Creating HIV risk profiles for men in South Africa: a latent class approach using cross-sectional survey data
←
→
Page content transcription
If your browser does not render page correctly, please read the page content below
Gottert A et al. Journal of the International AIDS Society 2020, 23(S2):e25518
http://onlinelibrary.wiley.com/doi/10.1002/jia2.25518/full | https://doi.org/10.1002/jia2.25518
RESEARCH ARTICLE
Creating HIV risk profiles for men in South Africa: a latent class
approach using cross-sectional survey data
Ann Gottert1,§ , Julie Pulerwitz1 , Craig J Heck2 , Cherie Cawood3 and Sanyukta Mathur1
§
Corresponding author: Ann Gottert, Population Council, 4301 Connecticut Avenue NW, Suite 280, Washington, DC 20008, USA. Tel: +1 202-237-9425.
(agottert@popcouncil.org)
Abstract
Introduction: Engaging at-risk men in HIV prevention programs and services is a current priority, yet there are few effective
ways to identify which men are at highest risk or how to best reach them. In this study we generated multi-factor profiles of
HIV acquisition/transmission risk for men in Durban, South Africa, to help inform targeted programming and service delivery.
Methods: Data come from surveys with 947 men ages 20 to 40 conducted in two informal settlements from May to Septem-
ber 2017. Using latent class analysis (LCA), which detects a small set of underlying groups based on multiple dimensions, we
identified classes based on nine HIV risk factors and socio-demographic characteristics. We then compared HIV service use
between the classes.
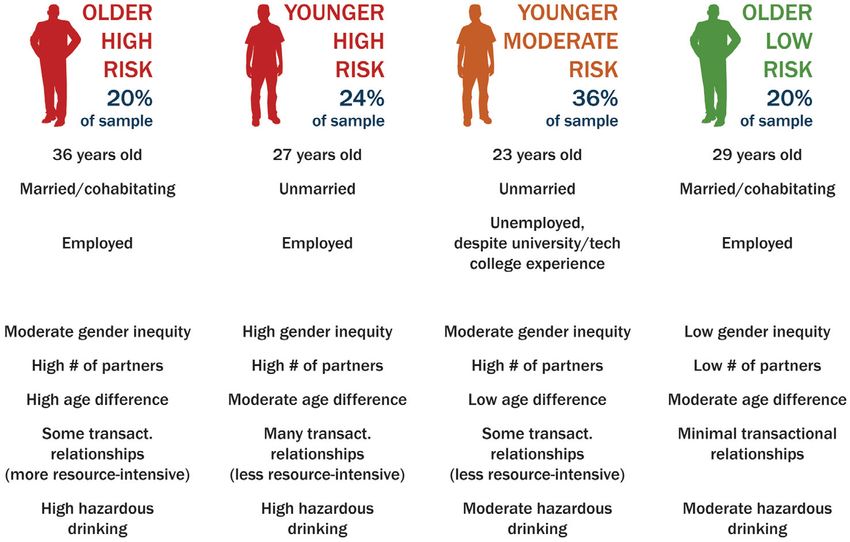
Results: We identified four latent classes, with good model fit statistics. The older high-risk class (20% of the sample; mean
age 36) were more likely married/cohabiting and employed, with multiple sexual partners, substantial age-disparity with part-
ners (eight years younger on-average), transactional relationships (including more resource-intensive forms like paying for part-
ner’s rent), and hazardous drinking. The younger high-risk class (24%; mean age 27) were likely unmarried and employed, with
the highest probability of multiple partners in the last year (including 42% with 5+ partners), transactional relationships (less
resource-intensive, e.g., clothes/transportation), hazardous drinking, and inequitable gender views. The younger moderate-risk
class (36%; mean age 23) were most likely unmarried, unemployed technical college/university students/graduates. They had a
relatively high probability of multiple partners and transactional relationships (less resource-intensive), and moderate haz-
ardous drinking. Finally, the older low-risk class (20%; mean age 29) were more likely married/cohabiting, employed, and highly
gender-equitable, with few partners and limited transactional relationships. Circumcision (status) was higher among the
younger moderate-risk class than either high-risk class (p < 0.001). HIV testing and treatment literacy score were suboptimal
and did not differ across classes.
Conclusions: Distinct HIV risk profiles among men were identified. Interventions should focus on reaching the highest-risk
profiles who, despite their elevated risk, were less or no more likely than the lower-risk to use HIV services. By enabling a
more synergistic understanding of subgroups, LCA has potential to enable more strategic, data-driven programming and evalu-
ation.
Keywords: segmentation; male; multiple sexual partners; transactional sex; alcohol; gender norms; Latent class analysis
Additional Supporting Information may be found online in the Supporting information tab for this article.
Received 20 September 2019; Accepted 22 April 2020
Copyright © 2020 The Authors. Journal of the International AIDS Society published by John Wiley & Sons Ltd on behalf of the International AIDS Society.
This is an open access article under the terms of the Creative Commons Attribution License, which permits use, distribution and reproduction in any medium,
provided the original work is properly cited.
1 | INTRODUCTION there has recently been intensified interest in reaching more
men with comprehensive social and behavior change program-
Men—previously a “blind spot” in an HIV response focused ming as well as biomedical prevention and treatment services.
primarily on women and children [1,2]—are now its frontier. Men are not a monolithic group with respect to HIV risk,
In sub-Saharan Africa, men experience intractably high HIV even in severe epidemics, and those at highest risk are often
incidence, and contribute to high incidence among adolescent “hidden” or “hard to reach” [6]. The goals of understanding
girls and young women (AGYW) [3-5]. Men in the region are and reaching subgroups of men most at risk are currently
also less likely than women to test for HIV, initiate antiretrovi- impeded by few effective tools to figure out how to do so.
ral treatment (ART), and be virally suppressed, and are more Increasing age is a clear risk factor for HIV acquisition in
likely to die of AIDS-related illnesses [2]. For these reasons, South Africa, with prevalence among men rising steeply
25Gottert A et al. Journal of the International AIDS Society 2020, 23(S2):e25518
http://onlinelibrary.wiley.com/doi/10.1002/jia2.25518/full | https://doi.org/10.1002/jia2.25518
between ages 20 to 40 [5,7]. Five-year age bands (e.g., 20 to social services. South Africa’s National Strategic Plan for HIV,
24, 25 to 29) are commonly used to establish and monitor TB and STIs 2017 to 2022 identifies people living in infor-
HIV prevention and treatment targets, yet this may be insuffi- mal settlements as a vulnerable population for HIV and STIs,
ciently nuanced since within any age band, there are likely in need of customized and targeted interventions [30].
men at both higher and lower risk. Several key behavioral/atti- Eligible participants were between the ages of 20 to 40.
tudinal determinants underlie risk for both acquiring and Recent population-based research in the region has suggested
transmitting HIV in high HIV prevalence settings like South that it is ages 25 to 40 years at which men are most likely to
Africa. These include having sex without condoms with multi- acquire HIV, as well as transmit HIV to AGYW (ages 15 to
ple sexual partners [6,7], alcohol abuse [7,8], and inequitable 24) [31].
gender norms and unequal relationship power [9-12]. Age-dis-
parate and transactional sexual relationships further con-
2.2 | Procedures
tribute to heightened HIV transmission from men to women,
and particularly AGYW [13-15]. Studies examining these fac- About two-thirds of men were recruited at “hot spot” venues,
tors most commonly use regression-based approaches and and one-third at HIV service sites. This dual recruitment strat-
yield information about relationships between individual vari- egy was intended to capture a sample of likely high-risk male
ables. Yet theory suggests that it is, in fact, combinations of partners of AGYW, as well as men already attending HIV pre-
factors that synergistically contribute to heightened risk. vention and treatment services. Hot spot venues were identi-
Latent Class Analysis (LCA) provides a rigorous, data-driven fied by key informants and included drinking establishments,
approach to identifying a set of “hidden” subgroups/classes taxi ranks, and university surrounds (e.g., hang-out spots near
characterized by multiple dimensions in survey data [16, p. university campuses). HIV service sites were both facility-
157,17]. LCA can be thought of as a “person-centered” based (government/NGO clinics) and community-based (mo-
approach to data analysis, in contrast to the dominant “variable- bile/home-based/workplace testing). Additional details about
centered” approach described previously with respect to com- recruitment procedures are included in the Data S1.
mon regression analyses. The latent classes are identified based The survey was administered by a trained interviewer in isi-
on patterns of responses on a selected set of variables, that Zulu or English and took an average of 45 minutes. The inter-
best represent the data [17]. Originally developed in the viewer read out each question to the respondent and then
1950’s, LCA has been increasingly used in social and behavioral entered his response using a tablet.
science research over the last decade [16]. Studies employing
LCA in the health field have focused on understanding patterns
2.3 | Measures
of substance use/abuse, adolescent risk behaviors, mental
health, and intimate partner violence [17-19]. Several recent We developed hypotheses a priori about HIV risk profiles, based
studies have applied LCA to understanding risk for HIV or sexu- on formative research with key informants in Durban (focus
ally transmitted infections (STIs). [20-26], as well as patterns of group discussions/in-depth interviews with HIV program/ser-
HIV testing [27,28]. One recent study among AGYW in South vice staff and community opinion leaders) and known demo-
Africa employed LCA to profile their types of male partners, graphic features of the study area (e.g., concentration of post-
finding five distinct partner types that were associated with inci- secondary institutions and industry/informal labor-related
dent HIV infection [29]. However, to our knowledge no studies employment; low marital/cohabiting rates [32,33]). We chose
among men in sub-Saharan Africa have employed LCA to better not to construct separate LCA models for risk of HIV acquisi-
understand their risk for HIV acquisition/transmission. tion versus transmission for several reasons. First, as described
In this study we used LCA to identify HIV risk profiles among above, most of the behavioral/attitudinal determinants we
men in Durban, South Africa. Our goal was to develop an examined confer risk for both acquisition and onward transmis-
approach for profiling subgroups of men in terms of HIV acqui- sion, and we wanted to identify profiles that could inform com-
sition/transmission risk that is data-driven, informative for pro- prehensive programs to prevent both. In addition, restricting
gramming, and potentially applicable in other contexts. We samples by self-reported HIV status was not advisable given
conceptualized HIV risk broadly as risk of either acquiring or likely underreporting of HIV-positive status and low sample size
transmitting HIV, since our intention was to develop profiles of HIV-positive men (n = 84) (for further detail see Data S1).
that could inform comprehensive programs to prevent both, We identified ten demographic, attitudinal, and behavioral
and most of the behaviors and attitudes we examined underlie variables we believed would define and distinguish between
both risk of acquisition and transmission. After developing the the hypothesized profiles, informed by the literature described
profiles, we compared use of HIV services between them. previously regarding key risk factors for HIV acquisition/trans-
mission. It was not informative to include self-reported HIV-
positive status in the model, since prevalence increased with
2 | METHODS
age per known prevalence patterns among men in KZN [5,7].
Table 1 includes detailed descriptions of the measures.
2.1 | Study population
From May-September 2017, we administered surveys to 962
2.4 | Analysis
men in two peri-urban informal settlements in eThekwini dis-
trict (Durban), Kwa-Zulu Natal (KZN) province, South Africa.
2.4.1 | Model definition
KZN has the highest adult HIV prevalence in the country, at
27% [7]. Informal settlements are characterized by high pop- All analyses were conducted using Stata v15 [38]. The LCA
ulation density, informal housing structures, and scarcity of followed an iterative process that involved constructing a
26Gottert A et al. Journal of the International AIDS Society 2020, 23(S2):e25518
http://onlinelibrary.wiley.com/doi/10.1002/jia2.25518/full | https://doi.org/10.1002/jia2.25518
Table 1. Measures for variables included in LCA models and postestimation analyses
Variable Measure description
Socio-demographics
Age Continuous; based on the question “What is your age?”
Marital/cohabiting status Binary; defined as married or cohabiting versus not, based on the question “What is your current
relationship status?”
Highest level of education Ordinal; consolidated from six response options into three categories: some secondary or less, secondary,
completed or technical college/university. Based on the question “What is the highest level of education you have
completed?”
Occupation Categorical; seven categories, including unemployed. Based on the questions “Are you currently working”
(with “No” corresponding to the unemployed category) and “What do you do for work?”, with 24 response
options. The final occupation variable was consolidated into seven categories (including unemployed as
one), based on (a) sufficient sample size in each occupational category, and (b) grouping similar
occupation types together. Response options with 5% of the sample, were categorized as ‘other’
HIV risk factors
Endorsement of inequitable Binary; based on mid-point cutoff of a continuous scale score. The continuous variable was measured using
gender norms an adapted version of the Gender-Equitable Men’s (GEM) Scale [34], previously validated in South
Africa [35]. The final 19-item scale demonstrated good reliability (ordinal theta = 0.93 [36]). Example
items are: “A man should have the final word about decisions in his home”; “Sometimes a woman needs to be
put in her place”; and “It is a woman’s responsibility to avoid getting pregnant.” Response options were
agree/partly agree/do not agree. We generated a mean GEM Scale score for each respondent. Then, for
clear interpretation (i.e., identifying highly inequitable gender norms), and to reduce the number of
continuous variables in the model to improve convergence, we dichotomized scores at the midpoint of
the possible range to represent endorsement of more inequitable versus equitable views
Number of sexual partners in the Ordinal; with 3 categories: 0 to 1, 2 to 4, or 5+ sexual partners in the last year. Based on the question
last year “Over the last 12 months, how many different female sexual partners have you had? If you are not sure of the
exact number please give a best guess.” (Of note,Gottert A et al. Journal of the International AIDS Society 2020, 23(S2):e25518
http://onlinelibrary.wiley.com/doi/10.1002/jia2.25518/full | https://doi.org/10.1002/jia2.25518
Table 1. (Continued)
Variable Measure description
Hazardous drinking Binary; measured using the concise version of the Alcohol Use Disorders Identification Test (AUDIT-C)
[37], which asks whether, how much, and how often the participant drinks alcohol, with a total score
ranging from 0 to 12. We created a binary variable with a score of 4 or above (standard cutoff)
indicating hazardous drinking [37]
HIV service use measures (for postestimation analyses)
HIV testing in the last 12 months Binary; based on response of ≥1 to the question “In the past 12 months, how many times have you been
tested for HIV? Please only include tests for which you received the results. If you don’t know the exact number
give a best guess.” Men who self-reported being HIV-positive and initiating antiretroviral therapy over
12 months ago (suggesting they did not need to test for HIV in the last 12 months), were coded as
missing
Circumcision status Binary; based on answering ‘Yes’ to the question “Have you been circumcised?” (with validity of the response
further confirmed/corrected through a series of follow-up questions, e.g., age circumcised, type of
circumcision, whether considering getting circumcised in the future)
HIV treatment literacy Discrete variable with values ranging from 0 to 5, based on the number of correct yes/no responses to
five questions about antiretroviral treatment: (1) “Can antiretroviral therapy (ART) help a person with HIV
to stay healthy and live longer?” (Yes = correct) (2) “Do you think HIV/AIDS can be cured?” (Yes = incorrect)
(3) “Are there any special drugs that a doctor can give a pregnant woman infected with HIV/AIDS to reduce
the risk of transmission to the baby?” (Yes = correct) (4) “Can taking breaks from antiretroviral therapy (ART)
make it work better in the long term?” (Yes = incorrect) (5) “Can taking antiretroviral therapy (ART) reduce
the risk of transmitting the HIV/AIDS virus to another person?” (Yes = correct)
Current antiretroviral therapy Binary; based on responding ‘Yes’ to the question “Are you currently taking antiretroviral therapy (ART)?”
(ART) use (among HIV-positive
respondents)
series of models and refining the variables included. We began [39,40] (a sensitivity analysis using logistic regression yielded
by fitting 1- to 5-class models. With each model, we assessed nearly identical results). We adjusted models for type of hot
identification, interpretability, overall model fit, and each indi- spot venue/service site. We did not adjust for demographic
cator’s ability to differentiate among the classes (e.g., >5% dif- characteristics because those characteristics were included in
ference between most classes). If an indicator consistently the LCA model.
produced similar probabilities across all of the classes, it was
excluded from the model.
2.5 | Ethics
Final model selection was based on identification and rela-
tive-fit statistics (for details see Table 4 and the Data S1), as This study was approved by the Institutional Review Boards
well as interpretability. For interpretability, we considered at the Population Council and University of Kwa-Zulu Natal.
whether the latent classes made logical sense and were dis- We obtained written informed consent from all participants.
tinct from each other [17]. The final model yielded probabili-
ties for class membership, and, for each class, item response
probabilities for each indicator. 3 | RESULTS
A total of 962 men participated in the survey. The response
2.4.2 | Postestimation analyses
rate was 97.3% (18 refusals) at hot spot venues and 99.1% at
For postestimation analyses, each respondent was assigned to HIV service sites (3 refusals); this reflects the proportion
a class based on their highest posterior latent class probabil- agreeing to participate after entering the study tent and being
ity. We then assessed associations between class membership read a description of the study. Fifteen respondents were
and four variables (for which measures are described in dropped from the analysis since they were missing values for
Table 1): HIV testing in the last year, ever-circumcised, treat- three or more of the ten variables included in the initial LCA
ment literacy score, and current ART use (among HIV-positive models. This resulted in a final sample size of 947, 638
men). Poisson regression was used for treatment literacy (a recruited at hot spot venues and 309 at HIV service sites.
count variable). For the rest, generalized linear models with a Sample characteristics are presented in Table 2. The mean
binomial distribution and log link function were used to com- age was 28 years (range 20 to 40). Fifteen percent of partici-
pute prevalence ratios. This is a recommended approach for pants were married or cohabiting, similar to documented mari-
binary outcomes characterized by relatively high prevalence tal/cohabiting rates in urban informal settlements in the
28Gottert A et al. Journal of the International AIDS Society 2020, 23(S2):e25518
http://onlinelibrary.wiley.com/doi/10.1002/jia2.25518/full | https://doi.org/10.1002/jia2.25518
Table 2. Sample characteristics (n = 947) use (with up to last three non-marital/non-cohabiting part-
ners), which was consistently at about 20% for each class
n/Mean %/SD (data not shown).
We found four latent HIV risk classes (Table 3). The four-
Socio-demographic class model was selected because the classes were distinct
Age 27.7 years 5.5 years from each other in terms of item response probabilities and
Married/cohabiting 146 15.4% were more interpretable than other class solutions. The model
Education (highest completed) also had good fit statistics (AIC = 21,275; BIC = 22,079;
Some secondary or less 215 22.7% entropy = 0.76) (Table 4). For ease of reference, we labeled
Secondary 529 55.9% the four classes Older high-risk, Younger high-risk, Younger
moderate-risk, and Older low-risk. Younger/older age was cho-
Technical college/University 203 21.4%
sen to include in the label due to the discrepancy in ages
Occupation
between classes (for simplicity classified as below/above the
Unemployed 370 39.1%
sample mean of 28 years, within the sample’s limit of 20 to
Taxi/bus driver 235 24.8% 40 years). Risk level was chosen to denote which classes may
Factory/construction worker 72 7.6% be more important to reach with HIV prevention/care ser-
Informal labor 51 5.4% vices, and since for each class most or all risk characteristics
Service industry 63 6.7% represented a consistent level of risk for HIV acquisi-
Small business/entrepreneur 48 5.1% tion/transmission.
Other occupation 108 11.4% The older high-risk class comprised one-fifth (19.6%) of the
Normative gender attitudes sample and had the highest mean age of the sample
Inequitable views towards gender norms 235 24.8% (35.9 years). This class was the most likely of the classes to
be married/cohabiting (37.1%) and least likely to be unem-
HIV risk behaviors
ployed (16.8%). The occupation with the highest probability
Number of sexual partners in last year
was taxi/bus driver (30.0%). Men in this class had a 26.5%
0 to 1 277 29.3%
probability of endorsing inequitable gender norms, and 46.7%
2 to 4 452 47.7% and 17.6% probabilities, respectively, of having 2 to 4 partners
5+ 218 23.0% and 5 + sexual partners in the last year. Among the classes,
Age difference with last 3 partners (mean 3.5 years 3.7 years these men’s relationships had the greatest age-disparity (on
years younger) average, 8.0 years younger) and were more resource-intensive
Transactional relationships transactional in nature (20.5%). Finally, this class had a high
None 416 43.9% probability (58.7%) of reporting hazardous drinking.
Less resource-intensive 405 42.8% The younger high-risk class (24.1 % of the sample) were
More resource-intensive 115 12.1%
relatively young (mean age 27.2 years) and had a low likeli-
hood of being married/cohabiting (7.8%). They had a 66.2%
Hazardous drinking 486 51.3%
probability of having completed secondary school and a 20.9%
SD, Standard deviation. For each variable, missingness was < 2%. probability of being unemployed and were most likely to be
Overall missingness was < 1%. Per Stata v15 standard procedures, taxi/bus drivers (35.8%) and more likely than other classes to
missing values were imputed based on equation-wise deletion, which be factory/construction workers (12.4%). Of the four classes,
uses valid responses from other variables to estimate missing values this class was most likely to endorse inequitable gender
[41]. norms, at 38.8%. They also had the highest probabilities of
most risk behaviors, at 54.3% for having 2 to 4 partners in
the last year and 41.5% for having 5+; on average their part-
ners were four years younger than themselves. They had the
country [33]. Most had completed secondary school (56%), highest likelihood of engaging in transactional relationships,
and over one-third (39%) were unemployed. Among employed primarily those less resource-intensive in nature (75.9%), as
men, the most common occupation was taxi/bus driver (25%), well as hazardous drinking (72.6%).
likely due to having recruited partly at taxi ranks. Other com- The younger moderate-risk class was the most prevalent
mon occupations included being a factory/construction worker, class of the sample (36.4%), with an average age of
informal laborer, service industry worker, and small business 22.5 years. Among the classes, they were the least likely to
owner/entrepreneur. be married/cohabiting (3.6%) and the most likely to have com-
pleted technical college/university (32.1%). However, they also
3.1 | Latent class solution had the highest probability (73.5%) of being unemployed
(although about half of those unemployed were still in school,
Initial variable re-coding (Table 1) was performed for about data not shown). The likelihood of endorsing inequitable gen-
half of the variables to eliminate collinearity, ensure adequate der norms was similar to the older high-risk class, at 25.5%.
cell size per response category, and/or condense certain con- This class had a high probability of having multiple sex part-
tinuous variables to enable model fit. We fit a one-class to a ners (49.8% with 2 to 4; 22.5% with 5+), but the mean age
five-class LCA model; each of these solutions was identified difference with these partners was only one year. They also
except for the five-class. The only variable dropped due to low had a relatively high probability (50.7%) of having transac-
variability across the latent classes was consistent condom tional relationships, mostly less resource-intensive in nature
29Gottert A et al. Journal of the International AIDS Society 2020, 23(S2):e25518
http://onlinelibrary.wiley.com/doi/10.1002/jia2.25518/full | https://doi.org/10.1002/jia2.25518
Table 3. HIV risk profiles among men (n = 947)
Class membership (probability)
Older high-risk Younger high-risk Younger moderate-risk Older low-risk
(19.6%) (24.1%) (36.4%) (19.9%)
Item response probabilities
Socio-demographic
Age 35.9 years 27.2 years 22.5 years 29.4 years
Married/cohabiting 37.1% 7.8% 3.6% 24.8%
Education (highest completed)
Some secondary or less 35.7% 20.0% 16.9% 23.8%
Secondary 46.5% 66.2% 51.0% 61.5%
Technical college/University 17.8% 13.8% 32.1% 14.7%
Occupation
Unemployed 16.8% 20.9% 73.5% 20.2%
Taxi/bus driver 30.0% 35.8% 11.5% 30.7%
Factory/construction worker 11.3% 12.4% 2.5% 7.6%
Informal labor 7.3% 5.1% 1.2% 11.4%
Service industry 10.2% 5.3% 3.3% 10.8%
Small business/entrepreneur 8.7% 9.4% 2.0% 2.0%
Other occupation 15.7% 11.1% 6.0% 17.3%
Normative gender attitudes
Inequitable views towards gender norms 26.5% 38.8% 25.5% 6.4%
HIV risk behaviors
Number of sexual partners in last year
0 to 1 35.7% 4.2% 27.7% 56.1%
2 to 4 46.7% 54.3% 49.8% 37.1%
5+ 17.6% 41.5% 22.5% 6.8%
Age difference with last 3 partners (mean 8.0 years 3.6 years 1.1 years 3.6 years
years younger)
Transactional relationships
None 49.7% 6.7% 49.3% 76.7%
Less resource-intensive 29.8% 75.7% 44.7% 14.2%
More resource-intensive 20.5% 17.6% 6.0% 9.1%
Hazardous drinking 58.7% 72.6% 41.2% 39.3%
(44.7%), but a lower probability than the high-risk classes of similar to the full-sample model (see Data S1 for details),
engaging in hazardous drinking (at 41.2%). therefore we chose the latter as the final model.
Finally, the older low-risk class (mean age of 29.4) was Figure 1 is a visual that aims to provide an easily-inter-
about as prevalent in our sample as the older high-risk class, pretable snapshot of the four classes, to facilitate translation
both at about 20%. They had a 24.8% likelihood of being mar- into programmatic implications.
ried/cohabiting, and a 20.2% likelihood of being unemployed.
Of the four classes, men in this class were least likely to
3.2 | Associations between latent class membership
endorse inequitable gender norms (6.4%), have multiple sexual
and use of HIV services
partners (56.1% had 0 to 1 partner), engage in transactional
relationships, and report hazardous drinking. For postestimation analyses, each respondent was assigned to a
Of note, there were no significant differences between the class. Class assignment diagnostics (Table 4) suggested a low
classes in terms of recruitment strategy (i.e., hot spot venue chance of misclassification; for example, the average posterior
vs. HIV service site) nor location (i.e., the two informal settle- probabilities of class assignment ranged from 0.81 to 0.92.
ments). We conducted a sensitivity analysis in which we Three-quarters (74.3%) of men assigned to the younger
restricted the sample to respondents who did not report moderate-risk class reported being circumcised (Table 5),
being HIV-positive. The resulting LCA model was markedly compared with 55.6% among the younger high-risk (aPR 0.75,
30Gottert A et al. Journal of the International AIDS Society 2020, 23(S2):e25518
http://onlinelibrary.wiley.com/doi/10.1002/jia2.25518/full | https://doi.org/10.1002/jia2.25518
Table 4. Model fit statistics and class assignment diagnostics
Goodness-of-fit statistics
Model Observations Log likelihood DF AIC BIC Entropy
1-Class 947 11363.3 19 22764.6 22856.8 —
2-Class 947 1002.1 37 22078.2 22257.7 0.79
3-Class 947 10878.1 55 21866.1 22133.0 0.78
4-Class 947 10789.2 73 21724.5 22078.8 0.76
Assignment accuracy diagnostics
Classes Probability of class membership Proportion assigned to class AvePP OCC
Older high-risk 0.196 0.196 0.92 47.17
Younger high-risk 0.241 0.250 0.81 13.43
Younger moderate-risk 0.364 0.360 0.91 17.67
Older low-risk 0.199 0.193 0.82 18.34
AIC, Akaike Information Criteria; AvePP, Average (mean) Posterior Probability of Assignment, ≥0.70 indicates high assignment accuracy [42]; BIC,
Bayesian Information Criteria, with lower values signifying a better fit [17]; DF, degrees of freedom; OCC, Odds of Correct Classification,
OCC > 5 represents high assignment accuracy [42].
The closer the entropy value is to 1, the stronger the separation between classes [43].
The 4-class model does not meet the conditional independence assumption; however, experts have emphasized that this assumption is more diffi-
cult to meet when classifying based on behavioral indicators, and that conditional independence must be balanced with interpretability [44,45].
We did not calculate the Likelihood-Ratio test for each model, since this test is based on the chi-squared statistic which requires observed and
expected values and can only be used when all indicators are categorical [41].
Figure 1. Graphic summarizing men’s HIV risk profiles, Durban, South Africa.
95% CI 0.68, 0.84, p < 0.001) and 45.1% among the older 4 | DISCUSSION
high-risk (aPR 0.61, 95% CI 0.51, 0.73, p < 0.001). There was
no association between class membership and levels of HIV This study demonstrated the value of applying LCA to
testing in the last year (at 64 to 68% across classes) or HIV advance HIV prevention research in sub-Saharan Africa, by
treatment literacy (at 3.4 to 3.7 on a scale of 0 to 5). Among enabling a more synergistic understanding of subgroups of
HIV-positive men, current ART use was similar between men. We identified four distinct HIV risk profiles among men
classes at 89 to 96%. in Durban, with different socio-demographic characteristics
31Gottert A et al. Journal of the International AIDS Society 2020, 23(S2):e25518
http://onlinelibrary.wiley.com/doi/10.1002/jia2.25518/full | https://doi.org/10.1002/jia2.25518
Table 5. Associations between latent class membership and HIV service use
Currently taking
Tested for HIV in last HIV treatment literacy score antiretroviral therapy
12 months (n = 513)b Circumcised (n = 939) (range 0 to 5) (n = 944) (n = 80)c
n (%) aPR (95% CI) n (%) aPR (95% CI) Mean SD aIRR (95% CI) n (%) aPR (95% CI)
Full sample 337 – 576 – 3.55 1.00 – 73 –
(65.7%) (61.3%) (91.3%)
Older high-risk 57 0.97 83 0.61 3.56 1.00 1.00 27 –d
(65.5%) (0.79, 1.19) (45.1%) (0.51, 0.73)*** (0.96, 1.04) (90.0%)
Younger high-risk 89 0.95 130 0.75 3.38 1.06 0.94 16 –d
(64.0%) (0.82, 1.10) (55.6%) (0.68, 0.84)*** (0.88, 1.01) (88.9%)
Younger moderate-risk 138 ref 252 ref 3.57 1.03 ref 9 –d
(67.7%) (74.3%) (90.0%)
Older low-risk 53 0.94 111 0.83 3.72 0.81 1.05 (0.98, 21 –d
(63.9%) (0.78, 1.13) (61.0%) (0.71, 0.95)* 1.11) (95.5%)
Overall p-valuea 0.89Gottert A et al. Journal of the International AIDS Society 2020, 23(S2):e25518
http://onlinelibrary.wiley.com/doi/10.1002/jia2.25518/full | https://doi.org/10.1002/jia2.25518
It is important to recognize that the sampling strategy was 5 | CONCLUSIONS
formulated to intentionally locate men at high risk of HIV by
focusing on informant-identified hot spot venues. This strategy Study findings elucidate a nuanced picture of who the right
was effective, as the sample as a whole reported very high men are to reach with HIV prevention and treatment pro-
levels of risk. Thus, concentrating future prevention activities grams in Durban, South Africa, and how those programs could
at such venues could help reach more of the “right” men with be tailored for subgroups representing varying levels of HIV
HIV prevention interventions. Yet, equally important is that risk. In particular, it is critical to reach both the younger and
even within this sample, it was possible to identify both older high-risk groups with HIV prevention programming and
higher-risk and lower-risk groups. This suggests that using services, grounded in an understanding of the different
approaches like LCA can help target limited resources in con- characteristics of each (e.g., younger high-risk as employed,
texts where much of the population is at risk, as well as iden- non-university-affiliated, unmarried, with ubiquitous hazardous
tify high-risk subpopulations within large samples. drinking and minimally-resource-intensive transactional
Another unique approach of our study is comparing HIV relationships).
service uptake across profiles. With this information, program The extent to which the HIV risk profiles we found differ
planners and implementers can create a more nuanced picture for men in other geographic locations in South Africa and/or
– beyond five-year age bands, for example – of who is being other countries remains to be seen, presenting a rich area for
reached with each type of service. To maximize prevention of future research. It may be that similar patterns of risk, and/or
HIV acquisition and/or transmission, it is particularly important notable differences, will emerge across contexts. Future stud-
to reach those at highest risk with services. Yet among men in ies should also explore comparative advantages of having sep-
our study, the highest risk profiles did not use services any arate models for risk of HIV acquisition versus transmission,
more than the lower risk profiles. And, with the exception of particularly if biological endpoints are available, and employ
current ART use, HIV service use and consistent condom use longitudinal designs to track change over time. In sum, LCA is
were suboptimal for all groups, per the current National a promising data-driven tool for profiling population sub-
Strategic Plan for HIV, TB and STIs [30]. groups, that could enable more strategic design and evaluation
LCA could be a useful tool for future HIV prevention efforts of HIV prevention, care and treatment programs.
among men in several ways. Using LCA to profile men in
terms of their HIV acquisition/transmission risk is an approach
AUTHORS’ AFFILIATIONS
that could be replicated in other geographic locations. Apply- 1
Population Council, Washington, DC, USA; 2Population Council, New York, NY,
ing LCA to existing survey data is also possible. Such surveys,
USA; 3Epicentre Health Research, Pietermaritzburg, South Africa
many of which include similar variables to those in the present
study, have been conducted in numerous high-prevalence loca-
COMPETING INTERESTS
tions that would benefit from a better understanding of at-risk
populations. This approach also has potential in terms of moni- The authors declare no conflicts of interest.
toring and evaluation. For example, using multiple cross-
sectional surveys, one could monitor changes in HIV service AUTHORS’ CONTRIBUTIONS
use over time by profile or see how an intervention differen- Study conception: AG JP SM; study design: AG JP SM; protocol development:
tially impacted each profile. AG JP SM CC; data collection: CC AG; data analysis and manuscript prepara-
This study had several limitations. First, survey responses tion: CJH AG; manuscript review: all authors. All authors read and approved the
were based on self-report, potentially introducing social desir- final manuscript.
ability bias. Second, the cross-sectional nature of the data pre-
cludes inferences that latent class membership was causally ACKNOWLEDGEMENTS
associated with HIV service use. Third, the extent to which We are particularly grateful to Elsa Marshall, David Khanyile, and Dominique
the risk profiles are linked to actual HIV acquisition or trans- O’Donnell for their important contributions during data collection. This study
mission remains unclear. Fourth, the conditional independence was supported by the Bill & Melinda Gates Foundation, Grant Numbers
OPP1150068 and OPP1136778. We thank all study participants, as well as
assumption was not met for the final model, although we do members of the study team and stakeholders from the following organizations/
not believe this invalidates the model (see note below entities: Epicentre Health Research, the Government of South Africa Depart-
Table 4). Fifth, by using posterior probability to assign class ment of Health and South Africa National AIDS Council, the U.S. President’s
membership, it is possible that some misclassification Plan for AIDS Relief, and the U.S. Agency for International Development
(USAID).
occurred. Additionally, for the postestimation analysis for last-
year HIV testing, we coded as missing HIV-positive men who
initiated ART > 1 year ago as a proxy for diagnosis >1 year
REFERENCES
ago (not captured on the survey); however this may have
1. Cornell M, McIntyre J, Myer L. Men and antiretroviral therapy in Africa: our
missed some ineligible men. Finally, the study was limited to blind spot. Tropical Med Int Health. 2011;16(7):828–9.
two informal settlements in Durban and to men recruited at 2. UNAIDS. Blind spot: reaching out to men and boys. Geneva: UNAIDS; 2017.
hot spot venues and HIV service sites. Therefore findings, 3. Cowan F, Pettifor A. HIV in adolescents in sub-Saharan Africa. Curr Opin
including the prevalence of each latent class, may not be gen- HIV AIDS. 2009;4(4):288–93.
4. Dellar RC, Dlamini S, Karim QA. Adolescent girls and young women: key
eralizable to all men ages 20 to 40 in Durban or other loca-
populations for HIV epidemic control. J Int AIDS Soc. 2015;18:19408.
tions in the region. In addition, studies taking a different 5. Kharsany AB, Cawood C, Khanyile D, Lewis L, Grobler A, Puren A, et al.
approach to identifying profiles may find different profiles Community-based HIV prevalence in KwaZulu-Natal, South Africa: results of a
than those identified in the present study. cross-sectional household survey. Lancet HIV. 2018;5(8):e427–37.
33Gottert A et al. Journal of the International AIDS Society 2020, 23(S2):e25518
http://onlinelibrary.wiley.com/doi/10.1002/jia2.25518/full | https://doi.org/10.1002/jia2.25518
6. UNAIDS. Get on the fast track: the life-cycle approach to HIV. Geneva, adolescent girls and young women enrolled in HPTN 068: a latent class analysis.
Switzerland: UNAIDS; 2016. J Acquir Immune Defic Syndr. 2019;82(1):24–33.
7. Simbayi L, Zuma K, Zungu N, Moyo S, Marinda E, Jooste S, et al. South Afri- 30. South African National AIDS Council (SANAC). South Africa’s National
can National HIV Prevalence, Incidence, Behaviour and Communication Survey, Strategic Plan for HIV, TB and STIs 2017-2022. 2017.
2017: towards achieving the UNAIDS 90-90-90 targets. 2019. 31. de Oliveira T, Kharsany AB, Gr€af T, Cawood C, Khanyile D, Grobler A, et al.
8. Kalichman SC, Simbayi LC, Kagee A, Toefy Y, Jooste S, Cain D, et al. Associa- Transmission networks and risk of HIV infection in KwaZulu-Natal, South Africa:
tions of poverty, substance use, and HIV transmission risk behaviors in three a community-wide phylogenetic study. Lancet HIV. 2017;4(1):e41–50.
South African communities. Soc Sci Med. 2006;62(7):1641–9. 32. Matthewsa A, Gowb J, Georged MG. HIV/AIDS Prevalence and Incidence:
9. Gottert A, Barrington C, McNaughton-Reyes HL, Maman S, MacPhail C, Evidence from Four Industries of the KwaZulu-Natal Economy. S Afr J Demogr.
Lippman SA, et al. Gender role conflict/stress and HIV risk behaviors among 2011;12:63–108.
men in Mpumalanga, South Africa. AIDS Behav. 2018;22:1858–69. 33. Shisana O, Risher K, Celentano DD, Zungu N, Rehle T, Ngcaweni B, et al.
10. Kaufman MR, Pulerwitz J. When sex is power: Gender roles in sex and Does marital status matter in an HIV hyperendemic country? Findings from the
their consequences. Power in Close Relationships. 2019;173. 2012 South African National HIV Prevalence. Incidence and Behaviour Survey.
11. Shannon K, Leiter K, Phaladze N, Hlanze Z, Tsai AC, Heisler M, et al. Gen- AIDS Care. 2016;28(2):234–41.
der inequity norms are associated with increased male-perpetrated rape and 34. Pulerwitz J, Barker G. Measuring attitudes toward gender norms among
sexual risks for HIV infection in Botswana and Swaziland. PLoS ONE. 2012;7: young men in Brazil development and psychometric evaluation of the GEM
e28739. scale. Men and Masculinities. 2008;10(3):322–38.
12. Jewkes RK, Dunkle K, Nduna M, Shai N. Intimate partner violence, relation- 35. Gottert A, Barrington C, Pettifor A, McNaughton-Reyes HL, Maman S, Mac-
ship power inequity, and incidence of HIV infection in young women in South Phail C, et al. Measuring men’s gender norms and gender role conflict/stress in a
Africa: a cohort study. The Lancet. 2010;376(9734):41–8. high HIV-prevalence South African setting. AIDS Behav. 2017;20:1785–95.
13. Stoebenau K, Heise L, Wamoyi J, Bobrova N. Revisiting the understanding 36. Zumbo BD, Gadermann AM, Zeisser C. Ordinal versions of coefficients
of “transactional sex” in sub-Saharan Africa: a review and synthesis of the litera- alpha and theta for Likert rating scales. J Mod Appl Stat Methods. 2007;6(1):4.
ture. Soc Sci Med. 2016;168:186–97. 37. Bush K, Kivlahan DR, McDonell MB, Fihn SD, Bradley KA. The AUDIT alco-
14. Leclerc-Madlala S. Age-disparate and intergenerational sex in southern hol consumption questions (AUDIT-C): an effective brief screening test for
Africa: the dynamics of hypervulnerability. AIDS. 2008;22:S17–25. problem drinking. Arch Intern Med. 1998;158(16):1789–95.
15. Stoner MC, Nguyen N, Kilburn K, G omez-Olive FX, Edwards JK, Selin A, 38. StataCorp. Stata Statistical Software: Release 15. College Station, TX: Stata-
et al. Age-disparate partnerships and incident HIV infection in adolescent girls Corp LLC; 2017.
and young women in rural South Africa. AIDS. 2019;33(1):83–91. 39. Lovasi GS, Underhill LJ, Jack D, Richards C, Weiss C, Rundle A. At odds:
16. Lanza ST, Rhoades BL. Latent class analysis: an alternative perspective on concerns raised by using odds ratios for continuous or common dichotomous
subgroup analysis in prevention and treatment. Prev Sci. 2013;14(2):157–68. outcomes in research on physical activity and obesity. Open Epidemiol J.
17. Collins LM, Lanza ST. Latent class and latent transition analysis: with appli- 2012;5:13.
cations in the social, behavioral, and health sciences. Hoboken, New Jersey: 40. McNutt L-A, Wu C, Xue X, Hafner JP. Estimating the relative risk in cohort
John Wiley & Sons; 2010. studies and clinical trials of common outcomes. Am J Epidemiol. 2003;157
18. Agrawal A, Lynskey MT, Madden PA, Bucholz KK, Heath AC. A latent (10):940–3.
class analysis of illicit drug abuse/dependence: results from the National Epi- 41. StataCorp. Stata Structural Equation Modeling Reference Manual, Release
demiological Survey on Alcohol and Related Conditions. Addiction. 2007;102 15. College Station, TX: Stata Press; 2017.
(1):94–104. 42. Nagin DS, Nagin D. Group-based modeling of development. Cambridge,
19. Connell CM, Gilreath TD, Hansen NB. A multiprocess latent class analysis MA: Harvard University Press; 2005.
of the co-occurrence of substance use and sexual risk behavior among adoles- 43. Celeux G, Soromenho G. An entropy criterion for assessing the number of
cents. J Stud Alcohol Drugs. 2009;70(6):943–51. clusters in a mixture model. J Classif. 1996;13(2):195–212.
20. Brantley ML, Kerrigan D, German D, Lim S, Sherman SG. Identifying pat- 44. Oberski DL, editor. Local dependence in latent class models: application to
terns of social and economic hardship among structurally vulnerable women: a voting in elections. Advances in latent variables [sis 2013 conference proceed-
latent class analysis of HIV/STI risk. AIDS Behav. 2017;21(10):3047–56. ings]. Milan, Italy: Vita e Pensiero; 2013.
21. Mathur S, Pilgrim N, Patel SK, Okal J, Mwapasa V, Chipeta E, et al. HIV vulnera- 45. Reboussin BA, Ip EH, Wolfson M. Locally dependent latent class models
bility among adolescent girls and young women: a multi-country latent class analysis with covariates: an application to under-age drinking in the USA. J Roy Stat Soc
approach. Int J Public Health. In press. doi: 10.1007/s00038-020-01350-1 A. 2008;171(4):877–97.
22. Alexander J, Rose J, Dierker L, Chan PA, MacCarthy S, Simmons D, et al. 46. Gomez A, Loar R, Kramer AE, Garnett GP. Reaching and targeting more
It's complicated: sexual partner characteristic profiles and sexually transmitted effectively: the application of market segmentation to improve HIV prevention
infection rates within a predominantly African American population in Missis- programmes. J Int AIDS Soc. 2019;22(Suppl 4):e25318. doi:10.1002/jia2.25318
sippi. Sex Transm Dis. 2015;42(5):266. 47. Luke N. Confronting the'sugar daddy'stereotype: age and economic asym-
23. Pflieger JC, Cook EC, Niccolai LM, Connell CM. Racial/ethnic differences in metries and risky sexual behavior in urban Kenya. Int Family Plan Perspect.
patterns of sexual risk behavior and rates of sexually transmitted infections 2005;31:6–14.
among female young adults. Am J Public Health. 2013;103(5):903–9. 48. Mampane JN. Exploring the “Blesser and Blessee” phenomenon: young
24. Vasilenko SA, Kugler KC, Butera NM, Lanza ST. Patterns of adolescent sex- women, transactional sex, and HIV in rural South Africa. SAGE Open. 2018;8
ual behavior predicting young adult sexually transmitted infections: a latent class (4):2158244018806343.
analysis approach. Arch Sex Behav. 2015;44(3):705–15. 49. Shefer T, Strebel A. Deconstructing the ‘sugar daddy’: a critical review of
25. Roberts ST, Flaherty BP, Deya R, Masese L, Ngina J, McClelland RS, et al. the constructions of men in intergenerational sexual relationships in South
Patterns of gender-based violence and associations with mental health and HIV Africa. Agenda. 2012;26(4):57–63.
risk behavior among female sex workers in Mombasa, Kenya: a latent class anal- 50. Wyrod R, Fritz K, Woelk G, Jain S, Kellogg T, Chirowodza A, et al. Beyond
ysis. AIDS Behav. 2018;22(10):3273–86. sugar daddies: intergenerational sex and AIDS in urban Zimbabwe. AIDS Behav.
26. McCarty-Caplan D, Jantz I, Swartz J. MSM and drug use: a latent class 2011;15(6):1275–82.
analysis of drug use and related sexual risk behaviors. AIDS Behav. 2014;18
(7):1339–51.
27. Dangerfield DT II, Craddock JB, Bruce OJ, Gilreath TD. HIV testing and
health care utilization behaviors among men in the United States: a latent class
analysis. J Assoc Nurses AIDS Care. 2017;28(3):306–15. SUPPORTING INFORMATION
28. Turpin RE, Slopen N, Chen S, Boekeloo B, Dallal C, Dyer T. Latent class
analysis of a syndemic of risk factors on HIV testing among black men. AIDS Additional Supporting Information may be found in the online
Care. 2019;31(2):216–23.
29. Nguyen N, Powers KA, Miller WC, Howard AG, Halpern CT, Hughes JP,
version of this article:
et al. Sexual partner types and incident HIV infection among rural South African Data S1. Additional information regarding study methods.
34You can also read