Investigating the Gender Wealth Gap across Occupational Classes - Nora Waitkus, Lara Minkus
←
→
Page content transcription
If your browser does not render page correctly, please read the page content below
Investigating the Gender Wealth Gap
across Occupational Classes
Nora Waitkus, Lara Minkus
Working Paper 56

January 2021
III Working Paper 56 Waitkus, Minkus

LSE International Inequalities Institute
The International Inequalities Institute (III) based at the London School of Economics and
Political Science (LSE) aims to be the world’s leading centre for interdisciplinary research
on inequalities and create real impact through policy solutions that tackle the issue. The
Institute provides a genuinely interdisciplinary forum unlike any other, bringing together
expertise from across the School and drawing on the thinking of experts from every
continent across the globe to produce high quality research and innovation in the field of
inequalities.
In addition to our working papers series all these publications are available to download
free from our website: www.lse.ac.uk/III
For further information on the work of the Institute, please contact the Institute Manager,
Liza Ryan at e.ryan@lse.ac.uk
International Inequalities Institute
The London School of Economics and Political Science
Houghton Street
London
WC2A 2AE
Email: Inequalities.institute@lse.ac.uk
Web site: www.lse.ac.uk/III
 @LSEInequalities
© Nora Waitkus and Lara Minkus. All rights reserved.

Abstract
This study examines the role of occupational class in the Gender Wealth Gap (GWG).
Despite rising interest in gender differences in wealth, the central role of occupations in
restricting and enabling its accumulation has received less scrutiny thus far. Drawing on
the German Socio-economic Panel, we employ quantile regressions and decomposition
techniques. We find explanatory power of occupational class for the gender wealth gap,
which operates despite accounting for other labour-market-relevant parameters, such as
income, tenure, and full-time work experience at all points of the wealth distribution.
Wealth gaps by gender vary between and within occupational classes. Particularly,
women’s under-representation among the self-employed and over-representation among
socio-cultural professions explain the GWG. Our study thus adds another dimension of
stratification – occupational class – to the discussion on the gendered distribution of
wealth.

Keywords: Gender Wealth Gap; inequality; gender; wealth, occupational class

 2
III Working Paper 56 Waitkus, Minkus

 1. Introduction
The gendered nature of economic inequality is a persistent phenomenon in many
countries. Despite extensive research on gender differences in income and pay, the
gender wealth gap (GWG) only recently gained more scrutiny from social scientists
across various disciplines (Deere/Doss 2006; Grabka et al. 2015; Lersch et al. 2017;
Ruel/Hauser 2013; Schneebaum et al. 2018; Sierminska et al. 2010).
Wealth, however, is a central dimension of inequality as it represents current inequalities
in income, property, and inheritance, as well as past inequalities over the life-course and
across generations. Current levels of wealth are further driving future inequalities, since
today’s investments in housing or private pensions impact future life and generations
(Cowell et al. 2012; Piketty 2014). Therefore, inequalities in wealth can be more persistent
than inequalities in income (Killewald et al. 2017) and add another layer to the gendered
nature of economic inequalities in contemporary societies (Ruel/Hauser 2013).
Rising interest in the GWG has led to a dynamic interdisciplinary field of research. Studies
find that women’s lower levels of wealth are mostly attributable to lower lifetime earnings,
discontinuous labour trajectories, and family obligations (e.g. Lersch 2017; Sierminska et
al. 2010). Our study expands existing research by arguing that next to these well-
established determinants, women work in occupations that systematically restrict them
from wealth accumulation.
Previous research on the gender pay gap has shown that women cluster in precarious,
low prestige and low-income occupations with high shares of part-time employment,
which has led to a rise in wage inequalities between men and women (Blau/Kahn 2017;
Minkus 2019). Given that the lion’s share of wealth is the result of savings from income
(Killewald et al. 2017), we reason that women’s position in the occupational class
structure does not only exacerbate gender wage differentials but also restricts women
from wealth accumulation. Hence, the aim of our paper is to pursue an integrative
approach studying three dimensions of inequality – gender, wealth, and occupational
class – together. We assume that the association between these three dimensions varies
along the wealth distribution – given the strong concentration of wealth at the top and the
crucial role of gendered occupational segregation in wage dispersion. Therefore, we
investigate gender differences in the wealth and their association with occupational
classesi among the working population at different points of the wealth distribution in
Germany.

 2. Gender Differences in Wealth
Wealth is usually measured on the household level, therefore most papers investigating
the GWG compare female-headed households with male-headed households (e.g.
Ruel/Hauser 2013; Schneebaum et al. 2018; see also Deere and Doss 2006) as
individual-level data are only available for Australia and Germany.

 3
III Working Paper 56 Waitkus, Minkus

Existing studies on the GWG follow two overlapping lines of research. The first is
concerned with family demographics. Studies pursuing this strand of research show that
married women are wealthier than non-married women (Ruel/Hauser 2013) but
accumulate less wealth than married men (Lersch 2017; Lersch et al. 2017) and face
stronger disruptions when marriages dissolve (Addo/Lichter 2013; Warren et al. 2001).
The timing and number of children further influences the GWG (Lersch et al. 2017;
Ravazzini/Kuhn 2018; Yamokoski/Keister 2006).
The second line of research points out that women’s lower endowment with human capital
explains most of the GWG on the individual level (Sierminska et al. 2010; Sierminska et
al. 2019) as well as on the household level (Ruel/Hauser 2013; Schneebaum et al. 2018).
Discontinuous employment trajectories and lower (lifetime) earnings translate into lower
wealth levels (e.g. Lersch et al. 2017; Ruel/Hauser 2013; Sierminska et al. 2010;
Sierminska et al. 2019; Warren et al. 2001) but also education and asset ownership
impact the GWG (Ravazzini/Chesters 2018; Schneebaum et al. 2018).
However, research on the gender wage gap suggests that both mechanisms are
intertwined, such that parenthood and care lead to employment breaks (Ehrlich et al.
2019) that result in lower lifetime earnings (Boll 2011; Ehrlich et al. 2020) as well as lower
saving rates and pensions entitlements (Conley/Ryvicker 2004; Sunden/Surette 1998;
Warren et al. 2001). According to the permanent income hypothesis (Bewley 1977),
individuals compensate for economic fluctuations by saving and dissaving wealth. Hence,
wealth inequality between different groups is the result of differences in individual’s
possibility to self-insure against earning shocks (De Nardi/Fella 2017).ii
We believe that occupational classes are a missing link to explain these gender
differences in saving wealth, because recent work on the gender wage differential
suggests that pay differences between men and women are the result of rising
occupational segregation (Blau/Kahn 2017; Minkus 2019; Minkus/Busch-Heizmann
2020). Therefore, by integrating occupations into the analysis of wealth inequality, we
propose an approach beyond contemporary research on the GWG.
We argue that occupations aggregate toward something more than single labour market-
related components such as skill-level, average job tenure, work experience or income
and significantly influence earnings net of job-characteristics or human capital (Blau/Kahn
2017): Occupations capture past as well as future employment and income trajectories
as well as associated risks, that are not fully accounted for by measures for current levels
of income and employment status.iii
Further, occupations differ in power resources that are not directly observable. Latent
dimensions such as overall job securityiv, unionization, or strong lobby groups impact
gender wealth differences just as much as they influence wage gaps. Occupations where
women constitute the majority tend to have lower power resources to secure these latent
dimensions, illustrated by e.g. lower levels of unionization (Minkus 2019) or lower
additional allowances such as capital-forming benefits (Mohan/Ruggiero 2003) that in
turn enable and restrict women to save and/or make long term-investment decisions into
e.g. housing or stocks.

 4
III Working Paper 56 Waitkus, Minkus

 3. Occupations and Wealth
There is tentative evidence that occupational positions are important for the gendered
accumulation of wealth (Sierminska et al. 2019; Warren 2006). The only quantitative study
by Warren (2006) shows for the UK that gender, class, and ethnic differences in pension
wealth exist and overlap – making a case for how different dimensions of stratification
work together.
Qualitative work shows that sons of elite classes inherit predominantly businesses equity
whereas daughters are left with real estate of lower value (e.g. Bessière 2019), resulting
in different starting levels for wealth accumulation among male and female heirs (though
quantitative studies cannot map such gender difference in wealth, see Szydlik 2004).
There is further evidence by Sierminska et al. (2019) that returns to occupational position
explain part of the wealth gap and women’s increasing participation in white collar work
has led to a slight attenuation of the GWG over time.
While occupational positions are just control variables in most studies, we add to the
literature by putting occupational class at the forefront of the analysis of gender wealth
differences. For example, it is a well-established fact that self-employment is positively
associated with wealth levels for both men and women (Sierminska et al. 2010), although
self-employment comes with large income risks. However, men are more likely to be self-
employed and own a business, and – conditional on self-employment – the gender gap
in wealth is especially large with regards to business assets (Edlund/Kopczuk 2009). This
is because women are less likely to own and run large companies compared to men
(Austen et al. 2014; Bertrand/Hallock 2001; Budig 2006) and use self-employment to
substitute for part-time work and its better reconciliation capacities with family work
(Georgellis/Wall 2005; Lechmann/Schnabel 2012).
Therefore, women face lower power resource when being self-employed. Lower levels of
and returns to self-employment have been explained by differences in risk-taking,
however, empirical evidence is inconsistent at best (Schubert et al. 1999). Nelson (2016),
for example, has shown in an re-examination of existing studies that the risk-distributions
of men and women largely overlap (Nelson 2015).
Next to gender wealth differences in self-employment, wealth gaps might exist in other
occupational classes: women have entered higher professions in large numbers
(Crompton 1987) but mainly occupy those in the socio-cultural sector and are less found
in technical professions like engineers, that are usually higher paid (Oesch 2006: 275).
Evidence from Sweden further suggests that women oftentimes cluster in dead-end
occupations with lower career prospects (Bihagen/Ohls 2007) and henceforth face
restrictions when taking out (secure) mortgages (Baker 2014).
Further research has shown that managerial women report lower wages, are less likely
to be paid in stock options, and their bonuses are smaller (Kulich et al. 2011;
Mohan/Ruggiero 2003), which directly affects their capital income and wealth
accumulation. In contrast, there might be occupational classes where restrictions to
accumulate wealth are less pronounced for both men and women, for example, among
the working classes with very low levels of wealth (Waitkus/Groh-Samberg 2018). While

 5
III Working Paper 56 Waitkus, Minkus

it seems straightforward that the lack of power resources (e.g. a higher probability to
become unemployed, lower wages) correlates negatively with wealth levels, it could
alternatively be the case that – conditional on income – women with lower power
resources save at higher rates whilst expecting future income losses (Bewley 1977; De
Nardi/Fella 2017), although women’s capacities for saving are much more restricted due
to their lower levels of income.
We want to know whether occupational classes help us to understand why wealth gaps
still exist after controlling for differences in income, labour market experiences, and family
obligations. We take the occupational structure at large into account and investigate the
GWG across occupational classes among the working population at different points of
the wealth distribution using an occupational class scheme.

 4. The Oesch Class Scheme
In order to assess the importance of specific occupations for the gender wealth gap, the
occupational class scheme chosen must meet two criteria: First, it must differentiate the
occupational class structure at the top thoroughly, as wealth accumulation is mostly
restricted to upper-middle classes in Germany (Waitkus/Groh-Samberg 2018).
Additionally, wage differentials in leadership positions are particularly high (Calanca et al.
2019; Minkus/Busch-Heizmann 2018) which in turn leads to discrepancies regarding
saving wealth from income between men and women. Second, the occupational class
scheme must capture gender differences that have arisen through the increasing
feminization of labour markets (Crompton 1987; 1999) and consequently occupational
segregation between men and women.
To the best of our knowledge, the Oesch (2006) class scheme is the only in the class
literature that accounts for the rising feminization of the labour force and hence captures
those gender differences. What is more, its systematic differentiation of the top of the
employment structure enables us to capture wealth differences by differentiating the
broader higher professional groups into managerial occupations, technical experts and
socio-cultural professionals (see Oesch 2006).
The resulting class scheme (Table A.1) differentiates the self-employed from the
employed groups to account for the well-acknowledged and persistently shown employer-
employee divide (for a discussion of the role of self-employment in the GWG see
paragraph above). Vertically, classes are further differentiated according to the skill levels
these jobs require. Horizontally, classes are differentiated according to work logics and
the individual role in in the division of labour (Kriesi 1989; Oesch 2006). Following
differences in work logics and skill levels between classes, we argue that incumbents of
the different classes also face different capabilities to save. Exact mechanisms are laid
out in the following.

 6
III Working Paper 56 Waitkus, Minkus

Oesch (2006: 55) argues that managers are much more loyal towards their organisation
as their job directly depends on the success of the organization they are employed with,
resulting in a personal interest in profit maximation. Hence, we would expect managers
to be more open towards private wealth accumulation since part of their remuneration
may come as capital. In contrast, socio-cultural professionals (such as (university)
teachers, journalists, or medical doctors and nurses) rely more on their skills, knowledge,
and specialized training applied in a variety of contexts, which makes this group less
reliant on a specific employer. Instead, socio-cultural professionals’ orientation is towards
their professional group and the autonomy of their discipline (Oesch 2006; see also Kriesi
1989). Therefore, we argue that socio-cultural professionals might be less prone to private
wealth accumulation and profit maximization and instead rely more on their income-
generating skills.v Technical experts (such as engineers and computer professionals)
could be in an intermediate position between managers and socio-cultural professionals
regarding levels of wealth.
Given that women occupy different occupational groups compared to men (they are
overrepresented among socio-cultural professions und underrepresented among
technical experts) that come with different power resources, payment, and orientations
towards wealth accumulation (Crompton 1987; Oesch 2006: 275), we suspect between-
class inequalities to moderate the GWG.
Wealth differences between occupational classes could be further stratified by gender
differences within occupational classes: as mentioned, female managers are paid less
often in stock options (Mohan/Ruggiero 2003), leading to overall lower levels of wealth
among female managers compared to male managers. Though women are
overrepresented among socio-cultural professions, they might cluster just in these in
dead-end occupations with lower career prospects (Bihagen/Ohls 2007), which keep
women back from long-term investments such as taking out (secure) mortgages (Baker
2014). In contrast, male socio-cultural professionals might have higher wealth levels than
their female counterparts, as they occupy the best-paid positions within this group (e.g.
Bertrand/Hallock 2001). The role of occupational class in the GWG is therefore twofold:
First, women and men are horizontally allocated within different occupational classes that
differ in their inclination to accumulate wealth. Second, gender inequalities exist within
occupational classes e.g. when female managers are less likely to be paid in stock
options than male managers.
While the Oesch scheme captures differences in gender composition across classes
(Table A.1 and Table A.2 include an overview) and explains differences in income and
earnings, pension system integration and political orientations (see Gingrich/Häusermann
2015; Oesch 2006; 2008) its capacity to explain wealth differences is yet to be explored
(Lambert/Bihagen 2014; but see Waitkus/Groh-Samberg (2018) for descriptive
evidence). In what follows, we will investigate to what extent Oesch classes are
associated with the GWG. As we suspect the association to vary across the wealth
distribution, we will test the association at different wealth quantiles.

 7
III Working Paper 56 Waitkus, Minkus

 5. Analytical Approach
We test the association between gender, wealth, and occupational class using Germany
as our case study. Germany remains a crucial case in wealth research as levels of
inequality are higher than in any other Eurozone country (Grabka/Westermeier 2014;
Pfeffer/Waitkus 2020), due to low average levels of wealth resulting from historically low
home ownership rates (Kurz 2004). Additionally, a comparatively encompassing social
insurance system renders wealth accumulation less necessary for old-age security than
in other welfare states (Pfeffer 2011).

5.1. Data

We employ data from the Socio-economic Panel (SOEP). The SOEP was initiated in 1984
in West-Germany and expanded to East Germany in 1990. All household members 17
years and older are interviewed on a yearly basis. The survey covers more than 30,000
individuals in over 15,000 households (Goebel et al. 2019). including information on
socio-economic resources and different components of wealth. A detailed wealth module
permits an in-depth analysis of individual (and household) wealth (Frick et al. 2010).vi The
wealth module includes high-quality data on net wealth and other assets. Individual
wealth is provided in five replicates, following extensive and demanding imputation by the
SOEP team to account for item non-response and underreporting (Frick et al. 2010). To
account for the five replicates and their repeated observations, we employ Rubin’s rule
(1996) for estimating standard errors using the stata command mi estimate and average
coefficients across the imputed samples.

5.2 Sample

We use all available wealth data and pool the respective years (2002, 2007, 2012 and
2017) as levels of wealth inequality have been persistently high (Grabka/Halbmeier
2019). We restrict our sample to the working population between 20 to 64 years, living in
private households. Since our central independent variable is occupational class, we
restrict our sample to those who do not have missing information on the class measure.
Our final sample size consists of 20.462 observations for women (N=12.442) and 20.620
for men (N=12.220) men.

5.3 Variables

Our central dependent variable is individual net wealth, defined as the sum of all financial
and real assets minus liabilities. Given that the net wealth can be negative or zero, we
apply the inverse hyperbolic sine transformation to our wealth measures (Pence 2006).
This transformation allows for the inclusion of zero and negative values (Gale/Pence

 8
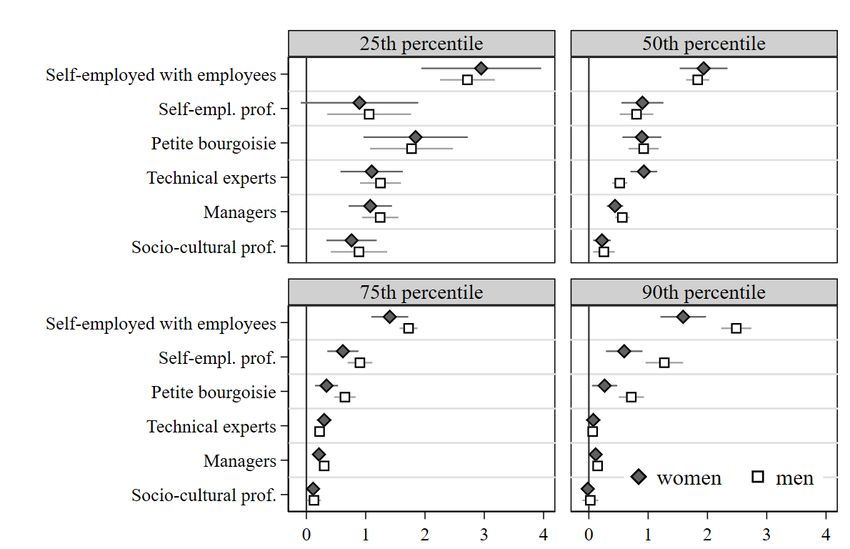
III Working Paper 56 Waitkus, Minkus

2006; Schneebaum et al. 2018). Wealth data are top and bottom-coded at the .1 and 99.9
percentile and inflation adjusted in constant 2015€.
Our central independent measure is occupational class, operationalized as a collapsed
version of the Oesch class scheme (Oesch 2006). While Oesch’s version includes eight
occupational classes (Table A.1), we further collapse the working classes into one group
for our main analysis, due to the low levels of net wealth among them (Table A.2). The
main model includes six occupational classes, i.e. self-employed, technical professionals,
managers, socio-cultural professionals, and workers (Table 2). To account for
heterogeneity within self-employed groups (e.g. Müller/Arum 2004), we run an additional
robust check with a class scheme that differentiates the self-employed into large
employers, self-employed professionals, and the petite bourgeoisie (see Figure A.1).
However, numbers of observations are very low (see Table A.2) which is why our main
analysis refrains from such a differentiation.
While occupational class is our central concern, we further control for economic indicators
that correlate with gender differences in wealth, such as human capital indicators and
household characteristics. We control for individual income by including inflation-adjusted
(2015€) monthly and ihs-transformed individual income from work, income from pensions
(which includes all kinds of occupational and private pensions), and income from transfers
(which includes all kinds of social security benefits like child allowances, housing support,
or disability allowance). We further account for years of full- and part-time work
experience and tenure (years), as well as weekly hours worked. Additionally,
unemployment experience and education in years is included. Furthermore, we account
for workplace characteristics, such as sectoral structurevii, working in the public sector,
and firm size. Moreover, we account for inheritance by including a dummy indication
having received an inheritance or giftviii. We further account for the partner’s occupational
class (measured as self-employed, professionals, (skilled and unskilled) workers, non-
working partner, no information for partner. Additionally, we introduce variables indicating
family traits. Marital status is categorized into being married and cohabiting, married and
separated, non-married, divorced, and widowed. We further add the number of children
living in the respondent’s household, the number of siblings, as well as the highest
parental education to account for the social background (Pfeffer and Killewald 2017). We
control for migration background to account for migrants’ lower wealth accumulation and
we implement a dummy for the region as there is still a considerable economic gap
between East and West Germany (Minkus/Busch-Heizmann 2020). Age is included in
categories (20-34, 35-49, 50-64 years). Since we work with a pooled sample, we add
yearly dummies to control for yearly confounders. Lastly, we control for the imputation
using a flag variable. See Table 1 for an overview.

 9
III Working Paper 56 Waitkus, Minkus

Table 1. Descriptive statistics

 Women Men Δ means
 Mean Std dev Mean Std dev (men-
 women)
 Explained Variable
 Wealth (IHS) 8.087 6.73 8.462 7.031 -0.38***
 Explanatory Variables
 Class position
 Self-employed 0.05 0.22 0.087 0.28 0.03***
 Technical experts 0.06 0.23 0.16 0.37 0.11***
 Managers 0.21 0.41 0.19 0.39 -0.02***
 Socio-cultural prof. 0.23 0.42 0.08 0.27 -0.15***
 Workers 0.45 0.50 0.48 0.50 0.02***
 Class position (Partner)
 Self-employed 0.07 0.26 0.04 0.20 -0.03***
 Professionals 0.25 0.43 0.26 0.44 0.02***
 Workers 0.24 0.43 0.25 0.43 0.00
 Not working 0.08 0.27 0.20 0.40 0.12***
 No Info 0.36 0.48 0.25 0.43 -0.11***
 Transfers
 No inheritance/gifts 0.90 0.29 0.91 0.29 0.00
 Inheritance/gifts 0.04 0.19 0.04 0.19 0.00
 Inheritance/gifts not applicable 0.06 0.23 0.06 0.23 -0.00
 Human capital and income
 Monthly labour income (IHS) 7.65 0.88 8.31 0.75 0.67***
 Monthly transfer income (IHS) 0.79 2.13 0.28 1.31 -0.51***
 Monthly pension income (IHS) 0.20 1.23 0.11 0.92 -0.09***
 Full-time work experience (years) 11.7 9.97 19.9 11.1 8.18***
 Part-time work experience (years) 6.21 7.12 0.77 2.25 -5.44***
 Unemployment (years) 0.73 1.97 0.54 1.61 -0.20***
 Job Tenure (years) 10.0 9.63 12.0 10.5 1.99***
 Weekly work hours 31.5 12.9 43.7 9.94 12.22***
 Education (years) 12.9 2.63 12.8 2.79 -0.01
 Firm size
 < 20 employees and self- 0.31 0.46 0.24 0.43 -0.07***
 employed w/o employees
 20-199 employees 0.26 0.44 0.26 0.44 0.00
 200-1999 employees 0.20 0.40 0.22 0.41 0.02***
 > 2000 employees 0.23 0.42 0.28 0.45 0.05***
 Sectoral structure
 Public sector(=1) 0.31 0.46 0.21 0.41 -0.10***
 Health, social, retail, and 0.50 0.50 0.17 0.38 -0.33***
 hospitality sector
 Bank and insurance sector 0.05 0.22 0.05 0.22 -0.00
 Manufacturing sector 0.16 0.37 0.46 0.50 0.30***
 Other services 0.29 0.45 0.32 0.47 0.03***
 Family
 # children in household 0.80 1.01 0.92 1.13 0.12***
 Married and cohabiting 0.60 0.49 0.68 0.47 0.08***

 10
III Working Paper 56 Waitkus, Minkus

 Married and living separately 0.03 0.18 0.02 0.14 -0.01***
 Non-married 0.22 0.42 0.23 0.42 0.01
 Divorced 0.13 0.33 0.07 0.25 -0.06***
 Widowed 0.02 0.15 0.01 0.07 -0.02***
 # siblings 1.87 1.56 1.95 1.69 0.08***
 Parental education
 No degree/don't know/else 0.11 0.31 0.12 0.33 0.02***
 Low education 0.49 0.50 0.50 0.50 0.01
 Intermediate education 0.23 0.42 0.21 0.41 -0.02***
 Higher education 0.17 0.38 0.17 0.37 -0.01
 Controls
 East Germany (=1) 0.23 0.42 0.22 0.41 -0.01**
 Migration background (=1) 0.13 0.34 0.15 0.35 0.01***
 Age (20 - 34 years) 0.22 0.41 0.21 0.41 -0.00
 Age (35 - 49 years) 0.48 0.50 0.47 0.50 -0.01*
 Age (50 - 64 years) 0.30 0.46 0.31 0.46 0.01**
 Wealth imputation flag (=1) 0.84 0.95 0.77 0.93 -0.07***
 Year dummies
 2002 0.19 0.39 0.22 0.41 0.03***
 2007 0.22 0.41 0.23 0.42 0.02***
 2012 0.30 0.46 0.29 0.45 -0.01**
 2017 0.30 0.46 0.26 0.44 -0.03***
 Number of person-years 20.462 20.620
 N of persons 12.442 12.220
SOEP.V35 2002, 2007, 2012, 2017 Not weighted. p < 0.05, p < 0.01, *** p < 0.001.
 . * **

5.4 Methods

We employ pooled unconditional quantile regressions and decompositions at the 25th
percentile, the median, the 75th percentile, and the 90th percentile. Following Firpo et al.
(2009), unconditional quantile regression assesses the explanatory variable’s – here
occupational class and gender – association with the quantile of the unconditional
marginal distribution of net wealth. In unconditional quantile models, the Recentred
Influence Function (RIF) is applied (Firpo et al. 2009; Fortin et al. 2011: 74 ff.) that is
defined as:

 (1)

With τ indicating a quantile of the marginal distribution of wealth and q is the value of
wealth at quantile τ. Hence, the coefficient τ estimates how fy reacts to changes in the
independent variables. To account for heteroscedasticity, we calculate robust standard
errors.

 11
III Working Paper 56 Waitkus, Minkus

To investigate in how far different compositions as opposed to different point estimates
for different coefficients to these characteristics between men and women drive the GWG,
we employ Kitagawa-Oaxaca-Blinder decomposition at different points of the
unconditional wealth distribution (Blinder 1973; Jann 2008; Kitagawa 1955; Oaxaca
1973). Equation 2 displays the decomposition that includes two components:

∆ − = ( ̅ − ̅ ) = ( ̅ − ̅ ) ̂ + ̅ ( ̂ − ̂ ), (2)

where ∆ − refers to the average (RIF) wealth difference between men and women. This
wealth difference is decomposed into the “explained” (( ̅ − ̅ ) ̂ ) and “unexplained”
term ̅̅̅
 ( ( ̂ − ̂ )).
The “explained” term refers to the part of the gender wealth gap that is relegated to
different endowments between men and women (i.e., if self-employment is associated
with a wealth penalty and women are less often self-employed than men; how does this
difference affect the GWG?). The “unexplained” term refers to differences in coefficients
between men and women (i.e., if self-employment poses higher wealth penalties for
women compared to men, how does that affect the wealth gap?). Since coefficients of
the unexplained part contain all sorts of unmeasured attributes and henceforth might
reflect spurious effects due to the omitted variable bias (c.f. Blau/Kahn 2017), we are
predominantly interested in the explained part of the decomposition. Men’s coefficients
serve as the benchmark for the decomposition. We also run robustness checks to test if
our results hold when women are the reference for the decomposition (Figure A.5).
Although a decomposition across the wealth distribution largely resembles the logic of a
regular decomposition, there is one peculiarity: for the estimation, the same descriptive
differences are used across the wealth distribution. This means if, for instance, on
average men are more often self-employed in our sample than women, the decomposition
will use this difference to estimate the explained part of the decomposition across all the
points of the wealth distribution. Hence, it does not consider that the difference in self-
employment might be diverging across the wealth distribution. Thus, differences in the
explained part of the decomposition are driven by diverging coefficients form the pooled
benchmark model at different parts of the wealth distribution. Additionally, we account for
the fact that categorical coefficients depend on the choice of the reference group , by
using the categorical option provided by the oaxaca stata command (Jann 2008). We
normalize coefficients by estimating them in terms of deviation from the grand-mean
rather than deviations from the omitted base category and can thereby circumvent the
problem of the omitted base category.

 12
III Working Paper 56 Waitkus, Minkus

 6. Results
6.1 Descriptive Results

We start with simple descriptive results. Table 2 shows that median wealth is higher for
men than for women across the occupational class structure, and these differences are
significant in all occupational classes.

Table 2. Wealth Gap within classes

 Oesch-classes Wealth median Wealth median Wealth Gap N (men) N (women)
 men (Euro) women (Euro) (Euro)
 Self-employed 165,196 80,314 84,881*** 1800 1075
 Technical experts 70,997 58,093 12,904* 3326 1182
 ***
 Manager 90,166 41,189 48,977 3976 4278
 Socio-cultural prof. 58,744 36,204 22,539*** 1605 4623
 ***
 Worker 15,864 12,394 3,470 9877 9304
 * ** ***
SOEP.v35 2002, 2007, 2012, 2017. Not weighted. p < 0.05, p < 0.01, p < 0.001.

However, there are important differences in size: While the wealth gap amounts to
85,000€ among the self-employed, the gap becomes smaller in lower occupational
groups and is only around 3,500€ among workers. The second-largest gap is found
among managers, where women report less than half of the levels of wealth than men –
although more than a half of all managers are female. In contrast, among technical
professionals the wealth gap is comparably low (13.000€). Hence, those few women who
are technical experts report median levels of wealth that are not too distant from men’s
median levels of wealth – at least compared to other occupational classes. The picture is
very different among socio-cultural professionals: while women mark the large majority in
this occupational class (73%) their median levels are almost 23.000€ lower compared to
men within the same occupational group.
While these descriptive results suggest that gender wealth differences exist across all
occupational classes, these insights do not reliably tell us whether these differences
persist when we control for human capital indicators, family structure, and other
confounders. We run unconditional quantile regression to understand if occupational
class is associated with the wealth distribution for men and women, net of relevant
controls.

 13
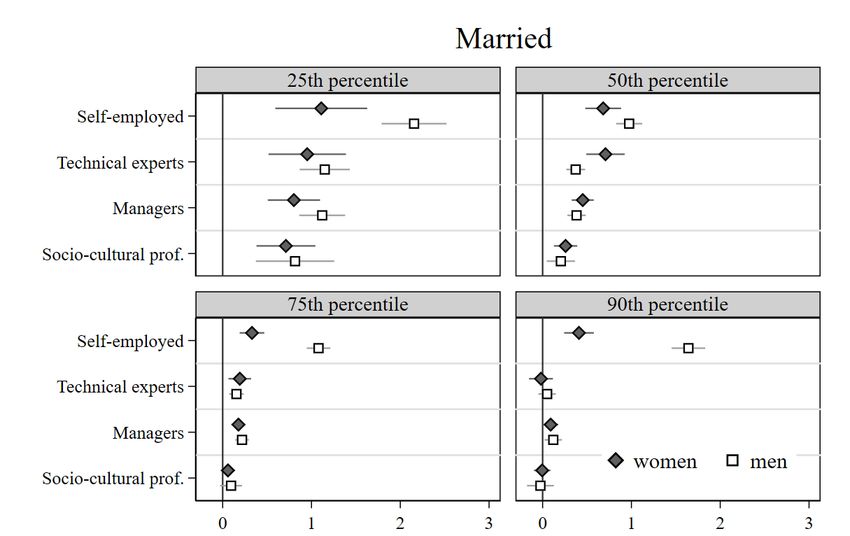
III Working Paper 56 Waitkus, Minkus

6.2 Unconditional Quantile Regression

Unconditional quantile (“rifreg”) regressions are displayed in Figure 1 (full regression
results are depicted in Table A.3) describing the association between occupational class
with the unconditional wealth distribution at the 25th percentile, the median, the 75th, and
the 90th percentile for men and womenix.
Figure 1 illustrates a clear positive association between self-employment and wealth for
women and men at all points of the wealth distribution (reference is workers)x. The Figure
also illustrates that men seem to profit slightly more from being self-employed than
women do. Still, gender differences are only statistically different at the 75th and 90th
percentile (see respective confidence intervals). In contrast, gender differences are not
significantly different at the bottom and middle of the distribution (25th and 50th percentile,
as indicated by overlapping confidence intervals)xi.

Figure 1. Results from unconditional quantile regressions (only occupational classes)

 Note: SOEP.v35 2002, 2007, 2012, 2017. (cf. Table A.3). Not weighted

Investigating other occupational classes, we observe a significant positive association
between being technical experts and wealth for women and men at the 25th percentile,
the median, and the 75th percentile of the wealth distribution. Only at the median,
however, the association for female technical professionals is statistically different from

 14
III Working Paper 56 Waitkus, Minkus

the coefficient for men, indicating that being a technical expert is more positively
associated with wealth for women compared to men.
Being a manager is positively associated with wealth across the entire wealth distribution
for men and women alike. Coefficients, however, do not significantly differ for men and
women, therefore, men and women seem to profit equally from being a manager
compared to the reference group (workers) at all points of the wealth distribution. Lastly,
socio-cultural professionals yield significant positive associations with the unconditional
wealth distribution – compared to workers – in all but the 90th percentile. Overall, men
and women seem to profit equally in terms of wealth from being a socio-cultural
professional compared to being a worker.
Investigating the control variables (we only discuss results at the median, see Table A.3),
regression results reveal that partner’s class is associated with the wealth distribution for
women and men. We also find that women experience wealth losses when they have a
partner who is not in employment, for men this association is not significant. These results
thus indicate the lasting importance of the male breadwinner model, i.e., men working
full-time and women being the secondary earner or homemaker. Inheritance is also
positively associated with wealth for both, men, and women. Labour income and full-time
work experience, as well as unemployment experience, education, and job tenure are
positively associated with men’s and women’s wealth accumulation. In contrast,
compared to working in the banking and insurance sector, working in health, retail, and
hospitality sector or other services is negatively associated with wealth while
manufacturing is positively associated with the wealth distribution for men and women.
Having children is positively associated with wealth for men and women alike, whereas,
compared to being married and cohabiting, being divorced or not married is detrimental
for women’s and men’s wealth. A higher number of siblings negatively influences wealth
accumulation for men and women. Parents not having any degree is negatively
associated with wealth levels, and so is being from East Germany and having a migration
background, while being older than 20-34 years and wealth are positively associated.

6.3 Decompositions

Turning to the decomposition analysis, we see that the explanatory capacity of our
occupational class covariates varies across the distribution (Figure 2 and Table 3).
However, occupational class adds to explaining the GWG at all points of the wealth
distribution, though with different sizes and in different directions.
Figure 2 depicts the explained part of the decomposition for occupational classes. Overall,
occupational classes explain between 7-18% of the wealth gap, depending on the
percentile of the distribution in the explained part of the decomposition investigated.
Different occupational class coefficients for men and women explain between 5 and -45%
of the overall GWG (unexplained part of the decomposition).

 15
III Working Paper 56 Waitkus, Minkus

Figure 2. Explained part of the decomposition, only Oesch classes and explained
percentages depicted.

 Note: SOEP.v35 2002, 2007, 2012, 2017 (cf. Table 3). Not weighted.

We first turn to the explained part of the decomposition. We find that the explanatory
capacity of self-employment is largest at the top of the wealth distribution. In fact, the
gendered composition of self-employment explains about 18% of the GWG between men
and women at the 90th percentile and about 13% at the 75th percentile.
In contrast, the composition of technical experts does not significantly influence the GWG
at the 25th and 50th percentile, while at the 75th and the 90th percentile this occupational
class attenuates the GWG by about 5 and 10%, respectively. Men are more often
employed as technical experts than women, which depresses the GWG since the
association between wealth and being a technical expert turn negative at the upper two
points of the wealth distribution investigated (results not shown, obtained using the
categorical option of the oaxaca commandxii (Jann 2008). Hence, if women were as often
technical experts than men, the gap would be bigger at the upper-middle and top of the
distribution.

 16
III Working Paper 56 Waitkus, Minkus

Table 3. Kitagawa-Oaxaca-Blinder-Decompositions

 25th percentile 50th percentile 75th percentile 90th percentile
 Men 8.933*** (0.056) 11.404*** (0.022) 12.601*** (0.013) 13.311*** (0.015)
 Women 8.289*** (0.070) 10.881*** (0.026) 12.302*** (0.014) 12.998*** (0.013)
 Difference 0.644*** (0.089) 0.523*** (0.034) 0.300*** (0.020) 0.313*** (0.020)
 Explained 1.966*** (0.157) 0.922*** (0.056) 0.475*** (0.033) 0.429*** (0.039)
 Unexplained -1.322*** (0.174) -0.399*** (0.063) -0.175*** (0.036) -0.116** (0.041)
 Explained
 Class 0.044 (0.036) 6.8 0.052 (0.014) 9.9 0.040 (0.010) 13.4 0.057 (0.011) 18.1
 Self-employed 0.032*** (0.006) 5.0 0.026*** (0.003) 5.1 0.028*** (0.003) 9.3 0.043*** (0.004) 13.7
 Technical experts 0.019 (0.012) 2.9 0.000 (0.005) 0.1 -0.014*** (0.003) -4.8 -0.032*** (0.004) -10.1
 Manager -0.003 (0.002) -0.4 -0.001 (0.001) -0.1 0.001 (0.001) 0.4 0.004*** (0.001) 1.2
 Socio-cult. prof. 0.023 (0.027) 3.5 0.039*** (0.010) 7.5 0.035*** (0.007) 11.6 0.051*** (0.008) 16.2
 Workers -0.027*** (0.006) -4.2 -0.013*** (0.003) -2.5 -0.009*** (0.002) -3.0 -0.009*** (0.002) -2.9
 Partner's Occ. Class -0.065** (0.024) -10.1 -0.045*** (0.009) -8.5 -0.015* (0.006) -5.1 -0.014* (0.007) -4.4
 Human capital 1.653*** (0.154) 257 0.782*** (0.054) 150 0.387*** (0.031) 129 0.345*** (0.037) 110
 Workplace 0.301*** (0.055) 46.8 0.067** (0.021) 12.8 0.031* (0.013) 10.2 0.024 (0.014) 7.7
 Family 0.121*** (0.023) 18.9 0.078*** (0.009) 14.8 0.026*** (0.006) 8.7 0.006 (0.007) 2.0
 Controls -0.089*** (0.018) -13.8 -0.012* (0.006) -2.3 0.006 (0.004) 2.1 0.011** (0.003) 3.4
 Unexplained
 Class -0.048 (0.074) -7.4 0.028 (0.029) 5.4 -0.065 (0.018) -21.6 -0.140 (0.20) -44.7
 Self-employed 0.003 (0.016) 0.5 0.010 (0.006) 1.9 0.021*** (0.004) 7.0 0.039*** (0.005) 12.6
 Technical experts 0.001 (0.014) 0.1 -0.022*** (0.006) -4.2 -0.010** (0.003) -3.5 -0.012** (0.004) -3.9
 Manager 0.009 (0.035) 1.4 0.029* (0.014) 5.6 -0.004 (0.009) -1.3 -0.036*** (0.011) -11.5
 Socio-cult. prof. 0.005 (0.053) 0.8 0.013 (0.020) 2.5 -0.020 (0.013) -6.7 -0.035* (0.015) -11.3
 Workers -0.066 (0.078) -10.2 -0.002 (0.030) -0.4 -0.052** (0.017) -17.2 -0.096*** (0.018) -30.6
 Partner's Occ. Class -0.083 (0.062) -12.9 -0.010 (0.024) -2.0 0.001 (0.015) 0.4 0.012 (0.019) 4.0
 Human capital 2.042 (1.280) 317 2.393*** (0.433) 458 1.869*** (0.270) 623 1.612*** (0.337) 515
 Workplace 0.057 (0.096) 8.8 0.007 (0.039) 1.4 -0.008 (0.025) -2.6 -0.018 (0.027) -5.8
 Family -0.040 (0.240) -6.3 0.050 (0.096) 9.6 0.015 (0.056) 5.1 0.007 (0.065) 2.2
 Controls -0.465* (0.200) -72.2 -0.013 (0.077) -2.6 0.015 (0.044) 4.9 0.031 (0.047) 9.9
 Constant -2.785* (1.394) -2.854*** (0.471) -2.003*** (0.290) -1.620*** (0.357)
 Number of person-years 41.082 41.082 41.082 41.082
 Number of persons 24.662 24.662 24.662 24.662
SOEP.V35; 2002, 2007, 2012; robust standard errors in parentheses. Not weighted. * p < 0.05, ** p < 0.01, *** p < 0.001. Categorical option employed (mean over occupational class categories).

 17
III Working Paper 56 Waitkus, Minkus

The explanatory capacity of managerial occupations is virtually non-existent: only at
the 90th percentile being a manager significantly explains as little as 1.2% of the GWG.
This is not surprising given that women and men are equally often managers (Table
2), and the association with the wealth distribution does not differ significantly (Figure
1).
Working in socio-cultural professions exacerbates the GWG across the distribution but
particularly at the top by as much as 16% and even at the 75th percentile about 12%.
Thus, working in a socio-cultural profession does not only come about with penalties
to wealth accumulation (i.e., the benchmark coefficient in the decomposition), but the
over-representation of women significantly widens the gender gap in wealth at the top
of the wealth distribution. In contrast, low-wealth occupational classes such as workers
seem to – slightly – attenuate the GWG, indicating that the association between wealth
and being a worker is negative. This gives the marginally underrepresented women a
slight advantage in wealth accumulation in this group.
Overall, occupational class does add to explaining the GWG: Particularly, the
underrepresentation of women among the self-employed and their overrepresentation
among socio-cultural professions add to explaining the GWG. In contrast, the
gendered composition of technical experts attenuates the GWG, whereas managers
do not add any explanatory power for the GWG.
Briefly investigating the unexplained part of the decomposition analyses (Table 3),
shows that the association between wealth and occupational class is further stratified:
self-employment seems to be particularly beneficiary at the top of the unconditional
wealth distribution for men, hence, if women would profit equally, the gap would be
smaller. For socio-cultural professionals, we see the negative association for women
depresses the GWG. In fact, women’s penalties are not as high as men’s, which is
leading towards closing the GWG. This could reflect a general devaluation of socio-
cultural professions that depresses wealth levels for men and women alike. Given,
however, that women are overrepresented in this occupational class, being a socio-
cultural professional is particularly detrimental for their wealth. In contrast, technical
experts stand out with a different direction of the association: women have lower
penalties for being a technical expert compared to men as the unexplained coefficient
is negative and significant at the 25th, the median, and the 90th percentile. The same
holds true for being a worker.
Overall, class adds to explaining the overall GWG. Investigating other confounders,
however, illustrates that the explanatory capacity of class is smaller than the pooled
human capital variables (i.e., income from work, transfers, pensions, unemployment,
full-time and part-time work experience, weekly working hours, education,
inheritance/gifts, and tenure, see Table 3). Nonetheless, Table 3 shows that at the 75th
percentile, gender composition of occupational classes accounts for about 13% of the
explained GWG, which is more than workplace characteristics (10%, i.e., firm size,
public sector, and sectoral structure), partner’s class (-5%) and family traits (9%, i.e.
marital status, parental education, number of siblings, children). Given that
occupational class further correlates with human capital indicators, some of the

 18
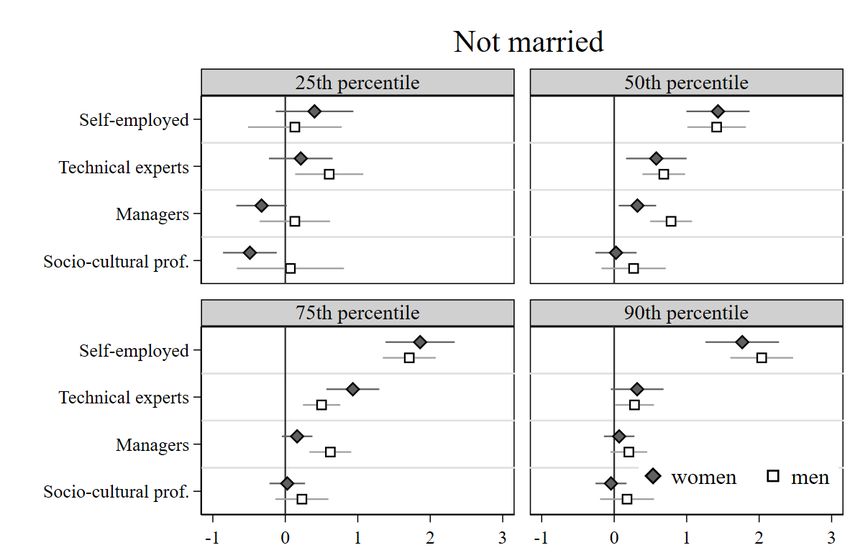
III Working Paper 56 Waitkus, Minkus

explanatory power of occupational class is already taken up by other control variables
emphasizing how important the role occupation class in the GWG is irrespective of
human capital indicators.

6.4 Robustness Checks

To test the robustness of our results, we ran four additional estimations.
First, we excluded business equity from the dependent variable to check whether this
alters the results, i.e., we analyze the importance of portfolio structure on the gender
wealth gap (Figure A.2). Except for the 25th percentile, results are similar. However,
there is one crucial difference: The association with self-employment for men drops
sharply in the 90th percentile and attenuates a bit for women as well, meaning that
self-employed men tend to accumulate more wealth through business equity compared
to women.
Second, we checked whether SES could serve as an informative proxy for occupation.
SES is a measure for occupational status that varies between 16 (e.g. cleaners) and
90 (judges) (Ganzeboom et al. 1992) and is usually divided into three equally sized
groups (high SES, middle and low SES) which – compared to the Oesch class scheme
– is an artificial and not a theoretically grounded difference. Figure A.3 further illustrates
that SES is not a useful proxy, as results are not significantly different for men and
women. Hence, SES measures masks important differences in the association
between gender, wealth, and occupations.
Third, we checked whether our results hold for non-married men and women compared
to married individuals (Figure A.4). We find that the positive association of self-
employment and wealth at the 75th and 90th percentile is not statistically different for
unmarried individuals, while it is for the married.
Fourth, to account for the fact that we chose men’s benchmark coefficients in the
decomposition, we ran another decomposition in which we used women’s coefficients
as the reference (Figure A.5). Not surprisingly, we find that the association between
self-employment and socio-cultural professionals with wealth at the 75th and 90th
percentile is smaller compared to our main model (Figure 2).

 7. Summary and Discussion

The aim of this paper was to investigate the Gender Wealth Gap taking occupational
class into account. The results illustrate that integrating a class perspective in the study
of gendered wealth inequalities yields interesting insights, and we show that classes
explain more of the gender wealth gap at different points of the wealth distribution, than
e.g., family attributes or workplace characteristics.

 19
III Working Paper 56 Waitkus, Minkus

We conclude with two main takeaways. First, the GWG varies substantially across
occupational groups and is largest among the self-employed and managers. This is
because women run smaller companies and are making less wealth from this,
indicating lower power resources in self-employment compared to men. Further,
although women are equally often managers, they tend to occupy lower wealth-
generating positions. However, even in female-dominated occupational classes such
as socio-cultural professions the gap is large and profound pointing to large differences
in power resources and possibly indicating that men hold the more attractive positions
among the socio-cultural professions compare to women that turn into differences in
wealth. In sum, particularly women’s under-representation among the self-employed
and over-representation among socio-cultural professions add to explain the GWG in
Germany.
Second, despite this additional explanatory capacity of occupational class, the largest
impact on the GWG still comes from income and work experience. The decomposition
analysis revealed that lower full-time work-experience and income are the main drivers
of the overall GWG, results that are well in line with previous research (Ruel/Hauser
2013; Sierminska et al. 2010). This is not surprising, given that income becomes wealth
when it is saved (Killewald et al. 2017), and we assume that part of the association
between wealth and occupational class is already taken up by our control variables, as
occupational classes differ and are constituted by e.g. income, education, or tenure.
Clearly, our analysis comes with some limitations. We follow the big-class tradition,
and we cannot account for intra-class differences. Additional analysis using
occupations might show how specific occupations drive the GWG. This could
particularly pertain to socio-cultural professionals, where a diverse set of occupations
are grouped together that vary in power resources towards their employer. However,
we leave this to future research.
Further, given the cross-sectional character of this study, we cannot state anything
about the association’s direction between occupational class and wealth accumulation.
More specifically, selection into self-employment could be the result of previous levels
of wealth (Fairlie/Krashinsky 2012). Future research should further tackle the gendered
nature of self-employment and the devaluation of female occupations such as socio-
cultural professions. Women are less likely to become self-employed in the first place,
and when they are, businesses are smaller, and wealth levels are lower (Austen et al.
2014; Georgellis/Wall 2005).
What is more, women’s lower levels of wealth are further the result of the systematic
devaluation of female occupations, restricting women from accumulating as much
wealth as men do. Though women are oftentimes key workers – as currently
exemplified in the COVID-19 pandemic – the systematic devaluation and lack of power
resources restrict women from keeping up with male levels of income and wealth.
When gender differences in labour markets and pay are overcome, we are one
significant step closer to ending gender differences in wealth.

 20
III Working Paper 56 Waitkus, Minkus

Bibliography
Addo, Fenaba R, and Daniel T Lichter. 2013. "Marriage, marital history, and black–white
 wealth differentials among older women." Journal of Marriage and Family, 75(2): 342-
 62.
Austen, Siobhan, Therese Jefferson, and Rachel Ong. 2014. "The gender gap in financial
 security: What we know and don't know about Australian households." Feminist
 Economics, 20(3): 25-52.
Baker, Amy Castro. 2014. "Eroding the wealth of women: Gender and the subprime
 foreclosure crisis." Social Service Review, 88(1): 59-91.
Bertrand, Marianne, and Kevin F Hallock. 2001. "The gender gap in top corporate jobs." ILR
 Review, 55(1): 3-21.
Bessière, Céline. 2019. "Reversed accounting: legal professionals, families and the gender
 wealth gap in France." Socio-Economic Review, Forthcoming.
Bewley, Truman. 1977. "The permanent income hypothesis: A theoretical formulation."
 Journal of economic theory, 16: 252-92.
Bihagen, Erik, and Marita Ohls. 2007. "Are women over-represented in dead-end jobs? A
 Swedish study using empirically derived measures of dead-end jobs." Social
 Indicators Research, 84(2): 159-77.
Blau, Francine D, and Lawrence M Kahn. 2017. "The gender wage gap: Extent, trends, and
 explanations." Journal of Economic Literature, 55(3): 789-865.
Blinder, Alan S. 1973. "Wage discrimination: reduced form and structural estimates." Journal
 of Human Resources, 8(4): 436-55.
Boll, Christina. 2011. "Mind the gap—German motherhood risks in figures and game theory
 issues." International Economics and Economic Policy, 8(4): 363-82.
Borah, Bijan J, and Anirban Basu. 2013. "Highlighting differences between conditional and
 unconditional quantile regression approaches through an application to assess
 medication adherence." Health Economics, 22(9): 1052-70.
Budig, Michelle J. 2006. "Intersections on the road to self-employment: Gender, family and
 occupational class." Social Forces, 84(4): 2223-39.
Calanca, Federica, Luiza Sayfullina, Lara Minkus, Claudia Wagner, and Eric Malmi. 2019.
 "Responsible team players wanted: an analysis of soft skill requirements in job
 advertisements." EPJ Data Science, 8(1): 1-20.
Conley, Dalton, and Miriam Ryvicker. 2004. "The price of female headship: Gender,
 inheritance, and wealth accumulation in the United States." Journal of Income
 Distribution, 13(3/4): 41-56.
Cowell, Frank, Eleni Karagiannaki, and Abigail McNight. 2012. "Mapping and Measuring the
 Distribution of Household Wealth: A Cross-Country Analysis." LWS Working Paper
 Series, 12.
Crompton, Rosemary. 1987. "Gender, status and professionalism." Sociology, 21(3): 413-28.
Crompton, Rosemary. 1999. "The gendered restructuring of the middle classes: employment
 and caring." The Sociological Review, 47(2): 165-83.
De Nardi, Mariacristina, and Giulio Fella. 2017. "Saving and wealth inequality." Review of
 Economic Dynamics, 26: 280-300.
Deere, Carmen Diana, and Cheryl R Doss. 2006. "The gender asset gap: What do we know
 and why does it matter?" Feminist Economics, 12(1-2): 1-50.
Edlund, Lena, and Wojciech Kopczuk. 2009. "Women, wealth, and mobility." American
 Economic Review, 99(1): 146-78.
Ehrlich, Ulrike, Lara Minkus, and Moritz Hess. 2020. "Einkommensrisiko Pflege? Der
 Zusammenhang von familiärer Pflege und Lohn." Zeitschrift für Gerontologie und
 Geriatrie, 53(1): 22-28.
Ehrlich, Ulrike, Katja Möhring, and Sonja Drobnič. 2019. "What comes after caring? The
 impact of family care on women’s employment." Journal of Family Issues, Online first.
Fairlie, Robert W, and Harry A Krashinsky. 2012. "Liquidity constraints, household wealth,
 and entrepreneurship revisited." Review of Income and Wealth, 58(2): 279-306.

 21
III Working Paper 56 Waitkus, Minkus

Firpo, Sergio, Nicole Fortin, and Thomas Lemieux. 2009. "Unconditional quantile regression."
 Econometrica, 77(3): 953-73.
Fortin, Nicole, Thomas Lemieux, and Sergio Firpo. 2011. "Decomposition Methods in
 Economics." In Handbook of Labour Economics, edited by Orley Ashenfelter and
 David Card, pp. 1-102. Amsterdam: Elsevier.
Frick, Joachim R, Markus M Grabka, and Jan Marcus. 2010. "Editing und multiple Imputation
 der Vermögensinformation 2002 und 2007 im SOEP." SOEP Survey Papers, 146.
Gale, William G, and Karen M Pence. 2006. "Are successive generations getting wealthier,
 and if so, why? Evidence from the 1990s." Brookings Papers on Economic Activity,
 2006(1): 155-234.
Ganzeboom, Harry BG, Paul M De Graaf, and Donald J Treiman. 1992. "A standard
 international socio-economic index of occupational status." Social science research,
 21(1): 1-56.
Georgellis, Yannis, and Howard J Wall. 2005. "Gender differences in self‐employment."
 International review of applied economics, 19(3): 321-42.
Gingrich, Jane, and Silja Häusermann. 2015. "The decline of the working-class vote, the
 reconfiguration of the welfare support coalition and the consequences for the welfare
 state." Journal of European Social Policy, 25(1): 50-75.
Goebel, Jan, Markus M Grabka, Stefan Liebig, Martin Kroh, David Richter, Carsten
 Schröder, and Jürgen Schupp. 2019. "The German Socio-economic Panel (SOEP)."
 Jahrbücher für Nationalökonomie und Statistik, 239(2): 345-60.
Grabka, Markus M, and Christoph Halbmeier. 2019. "Vermögensungleichheit in Deutschland
 bleibt trotz deutlich steigender Nettovermögen anhaltend hoch." DIW Wochenbericht,
 86(40): 735-45.
Grabka, Markus M, Jan Marcus, and Eva Sierminska. 2015. "Wealth distribution within
 couples." Review of Economics of the Household, 13(3): 459-86.
Grabka, Markus M, and Christian Westermeier. 2014. "Persistently high wealth inequality in
 Germany." DIW Economic Bulletin, 4(6): 3-15.
Hipp, Lena, Janine Bernhardt, and Jutta Allmendinger. 2015. "Institutions and the prevalence
 of nonstandard employment." Socio-Economic Review, 13(2): 351-77.
Jann, Ben. 2008. "The Blinder–Oaxaca decomposition for linear regression models." The
 Stata Journal, 8(4): 453-79.
Killewald, Alexandra, Fabian T Pfeffer, and Jared N Schachner. 2017. "Wealth Inequality and
 Accumulation." Annual review of sociology, 43: 379-404.
Kitagawa, Evelyn M. 1955. "Components of a difference between two rates." Journal of the
 American statistical Association, 50(272): 1168-94.
Kocka, Jürgen. 1980. "The study of social mobility and the formation of the working class in
 the 19th century." Le mouvement social, 111: 97-117.
Kriesi, Hanspeter. 1989. "New social movements and the new class in the Netherlands."
 American Journal of Sociology, 94(5): 1078-116.
Kulich, Clara, Grzegorz Trojanowski, Michelle K Ryan, S Alexander Haslam, and Luc DR
 Renneboog. 2011. "Who gets the carrot and who gets the stick? Evidence of gender
 disparities in executive remuneration." Strategic Management Journal, 32(3): 301-21.
Kurz, Karin. 2004. "Home ownership and social inequality in West Germany." In Home
 ownership and social inequality in comparative perspective, edited by Karin Kurz and
 Hans-Peter Blossfeld, pp. 21-60. Stanford, CA: Stanford University Press.
Lambert, Paul S, and Erik Bihagen. 2014. "Using occupation-based social classifications."
 Work, Employment and Society, 28(3): 481-94.
Lechmann, Daniel SJ, and Claus Schnabel. 2012. "Why is there a gender earnings gap in
 self-employment? A decomposition analysis with German data." IZA Journal of
 European Labour Studies, 1(6): 1-25.
Lersch, Philipp. 2017. "The Marriage Wealth Premium Revisited." Demography, 54(3): 961–
 83.
Lersch, Philipp M, Marita Jacob, and Karsten Hank. 2017. "Parenthood, gender, and
 personal wealth." European Sociological Review, 33(3): 410-22.
Minkus, Lara. 2019. "Labour market closure and the stalling of the gender pay gap." 1049.

 22
You can also read