SUSAN G. KOMEN NEW ORLEANS - Susan G ...
←
→
Page content transcription
If your browser does not render page correctly, please read the page content below
SUSAN G. KOMEN®
 NEW ORLEANS
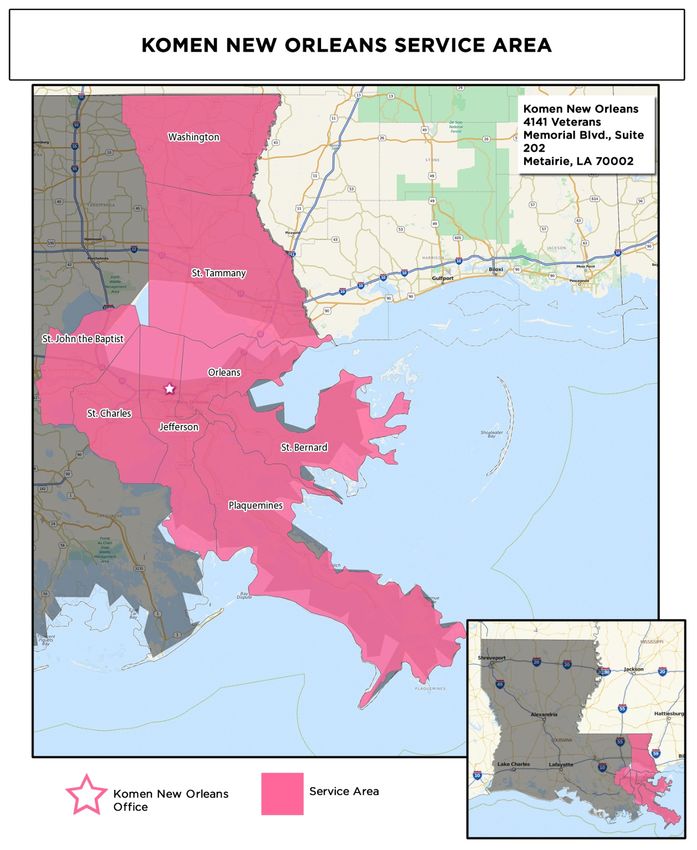
Table of Contents

Table of Contents ........................................................................................................................ 2
Acknowledgments ...................................................................................................................... 3
Executive Summary .................................................................................................................... 4
   Introduction to the Community Profile Report ........................................................................... 4
   Quantitative Data: Measuring Breast Cancer Impact in Local Communities ............................. 4
   Health System and Public Policy Analysis ................................................................................ 7
   Qualitative Data: Ensuring Community Input ............................................................................ 8
   Mission Action Plan ................................................................................................................... 9
Introduction ............................................................................................................................... 12
   Affiliate History ........................................................................................................................ 12
   Affiliate Organizational Structure ............................................................................................. 12
   Affiliate Service Area ............................................................................................................... 13
   Purpose of the Community Profile Report ............................................................................... 15
Quantitative Data: Measuring Breast Cancer Impact in Local Communities ...................... 16
   Quantitative Data Report ......................................................................................................... 16
   Selection of Target Communities ............................................................................................ 29
Health Systems and Public Policy Analysis ........................................................................... 33
   Health Systems Analysis Data Sources .................................................................................. 33
   Health Systems Overview ....................................................................................................... 33
   Public Policy Overview ............................................................................................................ 42
   Health Systems and Public Policy Analysis Findings .............................................................. 45
Qualitative Data: Ensuring Community Input ........................................................................ 46
   Qualitative Data Sources and Methodology Overview ............................................................ 46
   Qualitative Data Overview ....................................................................................................... 48
   Qualitative Data Findings ........................................................................................................ 49
Mission Action Plan .................................................................................................................. 52
   Breast Health and Breast Cancer Findings of the Target Communities .................................. 52
   Mission Action Plan ................................................................................................................. 53
References................................................................................................................................. 56

                                                                                                                                   2|P a g e
                  ®
Susan G. Komen New Orleans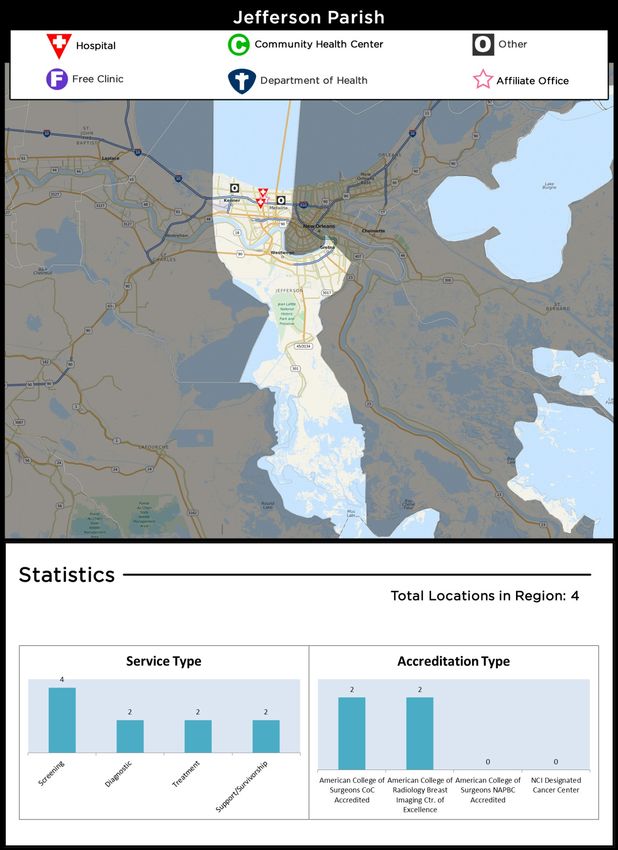
Acknowledgments
The Community Profile Report could not have been accomplished without the exceptional work,
effort, time and commitment from many people involved in the process.
Susan G. Komen® New Orleans would like to extend its deepest gratitude to the Board of
Directors and the following individuals who participated on the 2015 Community Profile
Team:
Tracy Conlin Dreiling
Community Profile Team Lead
Clinical Business Manager
Cubist Pharmaceuticals
Amanda Gittleman
Community Profile Team Member
MPH Candidate 2016
Tulane University School of Public Health and Tropical Medicine
Emily Poznanski
Community Profile Team Member
Bachelor of Science Public Health December 2016
Tulane University School of Public Health and Tropical Medicine
Donna Williams, MPH, DrPH
Louisiana Breast & Cervical Health Program
Louisiana State University School of Public Health
Lisa Plunkett
Community Profile Team Member
Executive Director
Susan G. Komen New Orleans
A special thank you to the following entities for their assistance with data collection and
analyses, as well as providing information included in this report:
St. Thomas Community Health Center
CAGNO
LSUHSC School of Public Health Breast Center
Report Prepared by:
Susan G. Komen® New Orleans
4141 Veterans Blvd., Suite 202
Metairie, Louisiana 70002
504-455-7310
komenneworleans.org
Contact: Lisa Plunkett
3|P a g e
®
Susan G. Komen New Orleans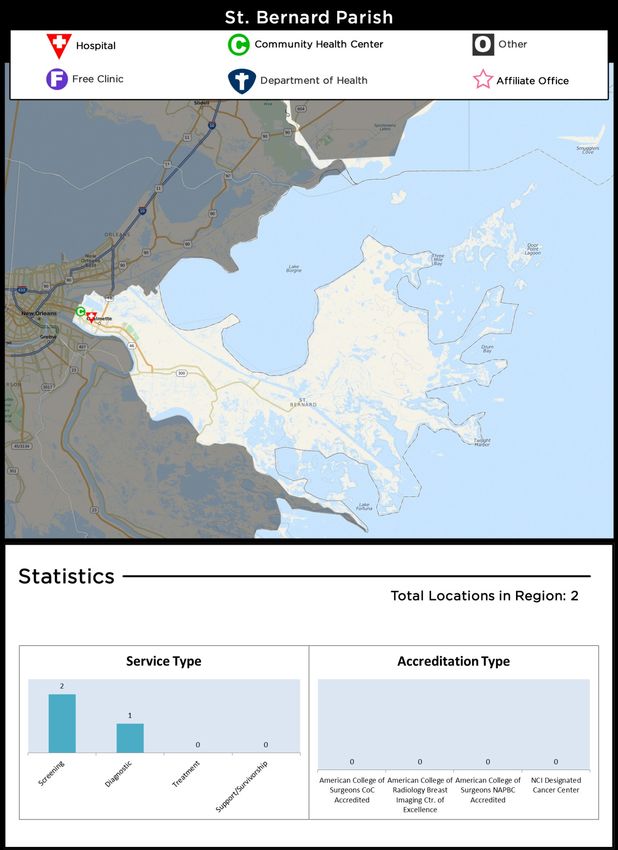
Executive Summary
Introduction to the Community Profile Report
Susan G. Komen® New Orleans was founded in 1992 by Patricia C. Denechaud and the late Dr.
Merv Trail. Komen New Orleans shares the common mission of other Affiliates to eradicate
breast cancer as a life threatening disease by advancing research, education, screening, and
treatment.
Komen New Orleans works to ensure that all people, regardless of race, income, geographic
location, sexual orientation or insurance status, have access to screening, accurate breast
health information, and if diagnosed, to quality, effective treatment and treatment support
services.
Komen New Orleans Grants program is designed to make systemic, lasting change in the
community. The current funding cycle, April 1, 2015 – March 31, 2016, includes nine projects
totaling $500,000 that will provide breast health and breast cancer services to thousands of low-
income and uninsured women in the community. More than $5.3 million has been raised and
invested by Komen New Orleans since 1992.
The Community Profile (CP) is a community needs assessment specifically looking at breast
cancer in the eight parishes served by the Komen New Orleans. The CP will help the Affiliate
to:
Establish granting priorities by helping the Affiliate better understand which breast needs
have been unmet in each parish and seek out and partner with organizations and
providers that can help meet these needs.
Establish focused education activities within the communities that have limited or no
access to breast health awareness information and/or Susan G. Komen.
Drive public policy efforts for federal and state funding for patient navigation, low or no
cost screening and transportation to and from treatments.
Strengthen/increase partnerships and sponsorships and establish direction for marketing and
outreach activities to increase community awareness of Susan G. Komen and breast health
awareness in the eight parishes served by Komen New Orleans.
Quantitative Data: Measuring Breast Cancer Impact in Local Communities
When measuring the breast cancer impact on the eight parishes served, Komen New Orleans
used data from the Quantitative Data Report. This data report provides data at the Affiliate level
as well as data comparisons to Louisiana and the United States. Some of the data provided are
as follows:
Female breast cancer incidence (new cases)
Female breast cancer deaths
Late-stage diagnosis
Screening mammography
Population demographics
Socioeconomic indicators
4|P a g e
®
Susan G. Komen New Orleans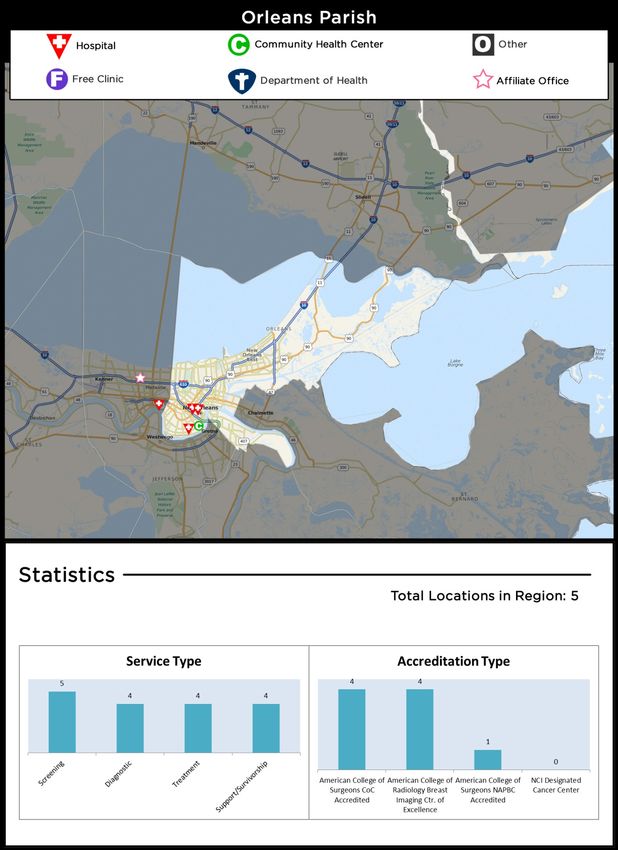
The data provided in the report is used to identify priorities within the Affiliate’s service area
based on estimates of how long it would take an area to achieve Healthy People 2020
objectives for breast cancer late-stage diagnosis and death rates (HP 2020). The Healthy
People 2020 is a major federal government initiative that provides specific health objectives for
communities and the country as a whole.
To determine priority areas, each parish’s estimated time to reach the HP2020 target for late-
stage diagnosis and deaths were compared and then each parish was categorized into seven
potential priority levels. Four parishes in the Affiliate service area are in the highest priority
category: Jefferson Parish, Orleans Parish, St. Bernard Parish, and St. John the Baptist Parish.
Two parishes in the Komen New Orleans service area are in the medium high priority category:
St. Tammany Parish, and Washington Parish.
In an effort to be the most efficient stewards of available resources, Susan G. Komen New
Orleans has chosen the four parishes at the highest priority as targets within the service area.
The Affiliate will focus strategic efforts on these four target parishes over the course of the next
four years. These four target parishes are those parishes identified as having cumulative key
indicators showing an increased chance of vulnerable populations likely at risk for experiencing
gaps in breast health services and/or enhanced barriers in access of care.
When selecting the target parishes, the Affiliate reviewed the Healthy People 2020. Specific to
Komen New Orleans, goals around reducing women’s death rate from breast cancer and
reducing the number of breast cancers found at a late-stage were analyzed. Through this
review, areas of priority were identified based on the time needed to meet Healthy People 2020
targets for breast cancer. Additional key indicators the Affiliate reviewed when selecting target
parishes included:
Incidence rates and trends
Death rates and trends
Late-stage rates and trends
Residents living below the poverty level
Residents living without health insurance
Unemployment percentages
The selected priority target parishes are:
Jefferson Parish
Orleans Parish
St. Bernard Parish
St. John the Baptist Parish
Jefferson Parish
Jefferson Parish is the highest populated parish in the Affiliate service area. The total
population is 66.8 percent White, 28.4 percent Black/African-American and 11.4 percent
Hispanic/Latina. The income below 100 percent poverty is estimated to be 15.1 percent of the
total population with 6.7 percent unemployed. It is estimated that 13.5 percent of the Jefferson
Parish population are currently in medically underserved areas and that 21.9 percent have no
health insurance.
5|P a g e
®
Susan G. Komen New Orleans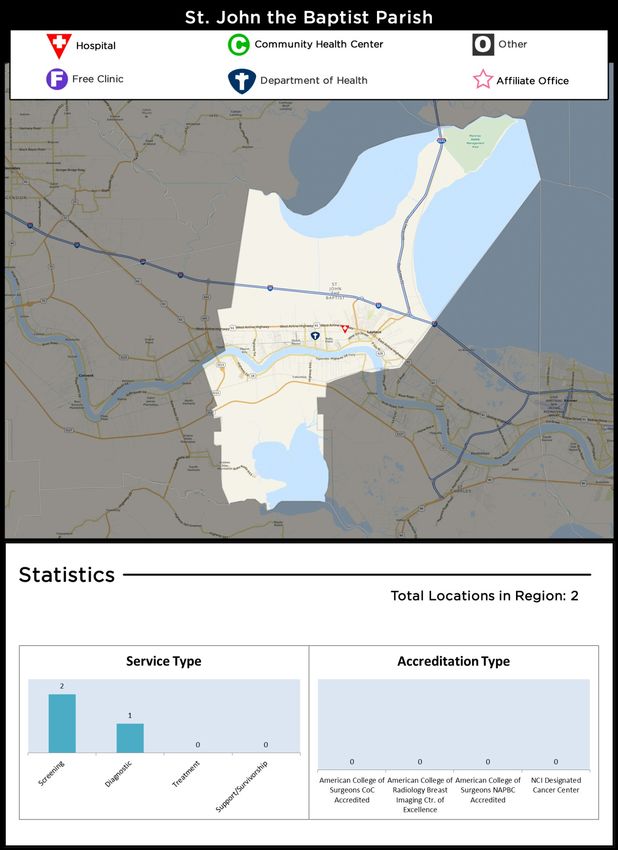
The age adjusted incidence rates, death rates, and late-stage rates for breast cancer in
Jefferson Parish are slightly higher than the US. However, the Healthy People 2020
needs/priority classification predicts that Jefferson Parish is likely to miss the HP2020 breast
cancer death and late –stage rate targets. It is estimated that it will take 13 years or more to
meet both targets. This prediction classifies Jefferson parish as a highest intervention risk
priority area.

Orleans Parish
Orleans Parish is the second highest populated parish in the Affiliate service area. The total
population is estimated to be 151, 951. The total population is 33.2 percent White, 63.3 percent
Black/African-American, and 4.4 percent Hispanic/Latina. The income below 100 percent below
poverty is estimated to be 25.7 percent with 11.4 percent unemployed. There is an estimated
36.1 percent of the population that are in medically underserved areas and approximately 23.4
percent have no health insurance.

For the Affiliate area as a whole, the death rate was higher among Black/African-American than
Whites. There were also a higher percentage of late-stage rates among Blacks/African-
Americans than Whites. Orleans Parish incidence, death and late-stage rates are all higher
than the US average. The death rate and late-stage rate of Orleans Parish are both higher than
the Affiliate service area average.

The Healthy People 2020 needs/priority classification predicts that Orleans Parish is likely to
miss the HP2020 breast cancer death and late-stage targets. It is estimated that it will take 13
years or more to meet both targets. This prediction based on increasing death and late-stage
rates make Orleans Parish a highest priority intervention target for the Affiliate. It is important to
take into consideration the substantially higher percentage of Black/African-American females
that reside in this parish and the increasing late-stage rates in this population within the Affiliate
as a whole.

St. Bernard Parish
St. Bernard Parish has an estimated female population of 13,705. The parish has a population
consisting of 75.6 White, 20.9 Black/African-American, and 5.2 percent Hispanic/Latina. An
estimated 14.6 percent have an income below 100 percent poverty level and approximately 11.9
percent are unemployed.

The data collected did not include a high enough pool of data to support a percentage rate for
breast cancer death rates in St. Bernard Parish; however, the incidence rates and late-stage
rates are both higher than the Affiliate and US averages.

The Healthy People 2020 needs/priority classification predicts that St. Bernard Parish is likely to
miss the HP2020 breast cancer late-stage rate target. It is estimated that it will take 13 years or
more to meet the target. This prediction puts St. Bernard Parish in the highest priority area.

St. John the Baptist Parish
The female population of St. John the Baptist Parish is estimated to be 23,976. The total
population consists of 43.2 White, 55.3 Black/African-American, and 4.6 Hispanic/Latina. It is
estimated that 15.2 percent have an income below 100 percent poverty. Ten percent are

                                                                                             6|P a g e
              ®
Susan G. Komen New Orleans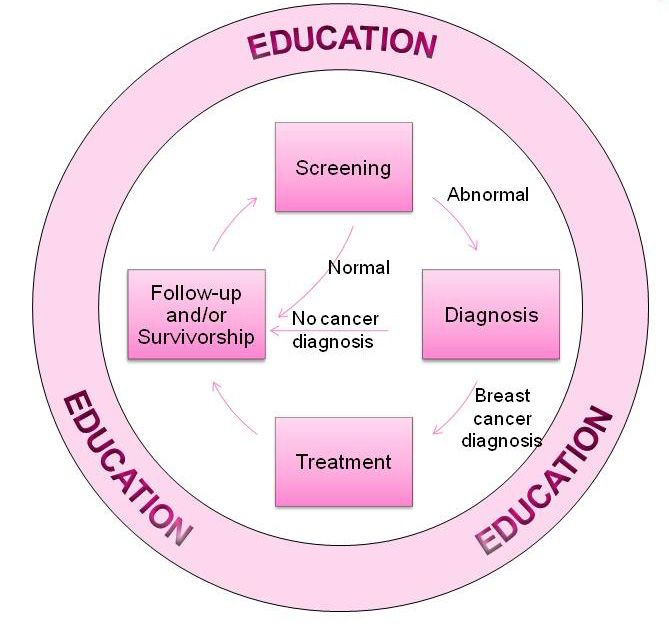
unemployed, with 100 percent in medically underserved areas and 19.5 percent having no
health insurance.

St. John the Baptist Parish has incidence rates that are equivalent to the US and Affiliate
averages, however, the death rates are high at 33.2 per 100,000 and the late-stage rates are
high at 58.7 per 100,000.

The Healthy People 2020 needs/priority classification predicts that St. John the Baptist Parish is
likely to miss the HP2020 breast cancer death and late-stage rates target. It is estimated that it
will take 13 years or more to meet both targets. This prediction based on the increasing death
and late-stage rates makes St. John the Baptist Parish a highest priority target area for Komen
New Orleans.

Health System and Public Policy Analysis

The Affiliate used the internet and an interview with the local LBCCHP (Louisiana Breast Cancer
and Cervical Health Plan) as resources to facilitate the search for a comprehensive Health
Systems Analysis inventory.

When assessing the breast health needs of the Affiliate service area, it is important to look at
the entire continuum of care (CoC). A patient needs to have access to proper screening, and a
woman must be given correct information about the outcome of the screening. The patient must
be educated about breast health. If there is an abnormality found during screening, the patient
must get guidance and further testing. Once the additional testing is done, a patient may be
given a breast cancer diagnosis. This patient must be able to navigate the system to get the
proper treatment options. A patient should be made aware of any clinical trials that she may be
eligible to participate in. During and after treatment it is imperative that the patient seek follow-
up care. There are many reasons why a patient may not stay in the CoC, and these reasons
must be considered to create solutions to keep them in the CoC.

The Health Systems and Public Policy Analysis revealed that women may enter the CoC at any
point, but ideally entrance would be through screening. However, screening may be affected by
a lack of education on screening practices. Barriers that hinder the CoC, such as lack of
transportation, lack of services within the specific target community, lack of time, and lack of
information, exist in the target communities of Jefferson Parish, Orleans Parish, St. Bernard
Parish, and St. John the Baptist Parish.

Two programs having to do with breast health in Louisiana include the Louisiana Breast and
Cervical Health Program (LBCHP) and the Louisiana Cancer Control Partnership (LCCP). The
Affiliate works with both of these programs to maintain a strong relationship and to ensure
collaboration and synergy on efforts. Goal 15 of the Louisiana Comprehensive Cancer Control
Plan addresses breast cancer, and the Affiliate works closely with the Director of the Louisiana
Cancer Prevention and Control Programs concerning Goal 15. Louisiana has opted out of the
Affordable Care Act, and consequently Medicaid has not been extended, leaving a coverage
gap.

Louisiana as a state has opted out of the Medicaid Extension of the Affordable Care Act,
resulting in a coverage gap for individuals whose income is above current Medicaid eligibility but
                                                                                            7|P a g e
              ®
Susan G. Komen New Orleans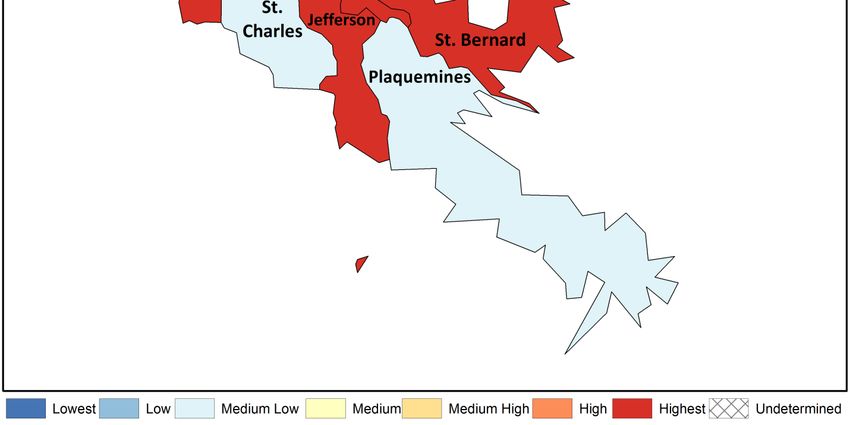
below the lower limit for Marketplace premium tax credits. This creates barriers for people
needing to access health services. This has an effect on breast health when considering access
and the CoC in Louisiana. Additionally, although the ACA may have allowed for increased
access to mammography coverage, the decision to opt out of the Medicaid Expansion strains
the places that provide screenings, treatment, and assistance.

Qualitative Data: Ensuring Community Input

Exploratory data of the community was provided by conducting key informant interviews with
patients and questionnaires for providers and patients using the Susan G. Komen grants.
Patient surveys were given to women who have received a mammogram in the selected greater
New Orleans target area. These included women who received mammograms at a grantee
clinic in Jefferson Parish, Orleans Parish, St. Bernard Parish, and St. John the Baptist Parish.
The provider surveys were completed by providers associated with the Jefferson Parish,
Orleans Parish, St. Bernard Parish, and St. John the Baptist clinics.

The survey questionnaires were emailed to providers, filled out and mailed or emailed back to
the team. Providers also printed the patient surveys to distribute to patients in their clinics. The
patient surveys were then scanned and emailed or mailed back to the office.

For the patient surveys and key informant interviews, key assessment questions, focused on
awareness of education and outreach, and screening, diagnostic and treatment programs, were
asked about community identified health concerns. The questions addressed general
knowledge of breast health and included questions on breast cancer screening and genetic
testing. A second set of questions for the patient surveys and key informant interviews was
added for breast cancer survivors only. These questions addressed barriers and problems that
the survivors faced when getting their mammograms, diagnosis, and treatment, in addition to
resources that were utilized by the participants that contributed to their knowledge of breast
cancer and breast health. Provider surveys questioned the availability of breast health education
materials and procedures taken by providers in regards to clinical breast exams, screening
mammography and referrals. In addition, a section of the survey was dedicated to the practice
perspective on factors that prevent women from breast health care.

A total of nine provider surveys, 77 patient surveys, and 45 key informant interviews were
completed. The common themes that arose from the surveys were: Lack of money or insurance,
fear, lack of education/community outreach, and misconceptions about knowledge of breast
cancer. The common variables that were identified as barriers from not getting screened from
these surveys were access, outreach, and fear.

The information gathered through these surveys helps to explain some of the disparities in
access to breast health care in the target communities. From the data, Black/African-American
women are a large percentage of the target population. Additionally, Black/African-American
women in Southeast Louisiana as well as the target parishes have higher than average annual
death rates. Many are uninsured and economically disadvantaged. The surveys tell the Affiliate
that these women skip regular screenings due to lack of money, fear of the unknown, and lack
of education. With increased education and advertising about the importance of early screening
and breast health, there will be an increase in community members affected.

                                                                                            8|P a g e
              ®
Susan G. Komen New Orleans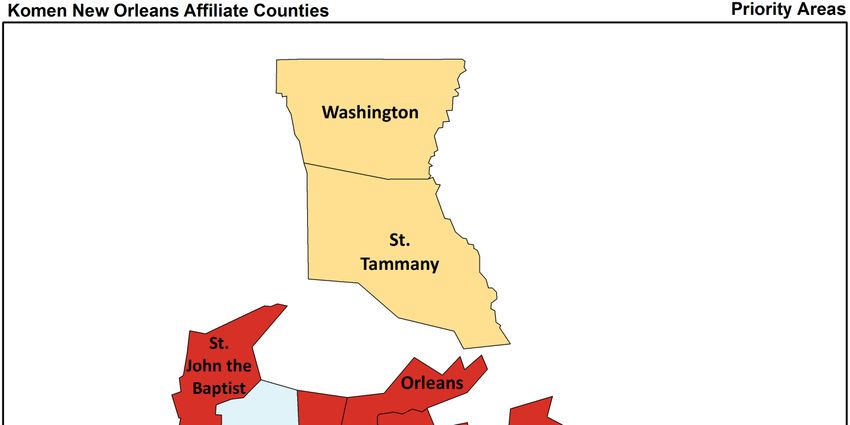
Mission Action Plan

Based on demographic, statistical and qualitative information collected for this report, Komen
New Orleans has chosen three priorities. These priorities take into account the common
themes seen in the surveys. These themes are the common barriers to proper breast health
awareness and the critical success of the continuum of care. These barriers are lack of money
and insurance, lack of education and fear of the unknown. Other barriers are cultural barriers
and misconceptions. The timeline for these priorities will be FY16-FY19. While the three
priorities will apply to all eight parishes in Komen New Orleans service area, special emphasis
will be given to the four parishes identified as the highest priority: Jefferson Parish, Orleans
Parish, St. Bernard Parish, and St. John the Baptist Parish.

                                         Needs Statement

The demographic and statistical information collected revealed that women in the target
communities of Jefferson Parish, Orleans Parish, St. Bernard Parish, and St. John the Baptist
Parish are at the greatest risk for falling out of the continuum of care. In particular, Black/African-
American women are being diagnosed at later stages than the national average. This may be
due to a lack of knowledge concerning breast cancer and early detection. In the four target
communities of Jefferson Parish, Orleans Parish, St. Bernard Parish, and St. John the Baptist
Parish, there is a large percentage of uninsured and economically disadvantaged people that are
not educated about breast health awareness and are unaware of available services. The Affiliate
has chosen three priorities based on the demographic, statistical, and qualitative information
collected for the report.

                                                                                             9|P a g e
              ®
Susan G. Komen New Orleans
Priority Objectives
Provide educational 1. Maintain partnership with Xavier University, Southern
outreach programs University, University of New Orleans, Tulane University and
specifically for Dillard University to provide culturally appropriate breast health
Black/African-American messages to the students and faculty of the Universities.
women that will help Education and information are the keys to breaking the cultural
remove cultural cycle of not getting screened for fear of diagnosis. Emphasis
misconceptions, should be on early detection. At least 8,000 educational flyers,
eliminate fear and pamphlets, and materials on breast cancer will be distributed to
increase breast health target communities on an annual basis from FY16-FY19.
awareness in the target
communities of Orleans 2. The Affiliate will participate in University health fairs and
Parish, Jefferson partner with school health clinics, sororities and fraternities as
Parish, St. John the well as community General/Family Practice offices, community
Baptist Parish, and St. health clinics, and OBGYNs. The Affiliate will participate in 120
Bernard Parish. health events on an annual basis from FY16-FY19 that involve
the target communities of Jefferson Parish, Orleans Parish, St.
Bernard Parish, and St. John the Baptist Parish.
3. Maintain partnership with The New Orleans Saints, Pelicans
and Zephyr organizations to provide culturally appropriate
breast health messages at three charity events, pre-game
events and half-time events on an annual basis from FY16-
FY19.
4. Coordinate at least 50 “Pink” events with community salons
and gyms to promote culturally appropriate breast health
messages on an annual basis from FY16-FY19.
Priority Objectives
Increase breast health 1. Susan G. Komen New Orleans will continue to partner with the
awareness, educational Louisiana Breast and Cervical Health Program (LBCHP) and
outreach, and access advocate for additional state funding for uninsured women in
to screening services Southeast Louisiana by working with the statewide Susan G.
for the uninsured and Komen Affiliates, participating in Susan G. Komen day at the
underserved. State Capital, contacting each legislator to engage and inform
three times annually from FY16-FY19.
2. The Affiliate will continue to partner with and establish a
presence in the local health clinics, such as St. Thomas
Community Health Center, LSUHSC clinic, West Jefferson
Women’s imaging and Breast Center and the St. Charles
Community Health Center, to promote access for screening
services to over 30,000 people on the Affiliate’s database from
FY16-FY19.
3. FY17 and FY18, the Affiliate will make contact with at least one
new breast cancer related organization in each priority parish
to inform them about the local Community Health Request for
Application. That can provide patient navigation, allow for
additional screening and transportation to and from screening
and treatment.
10 | P a g e
®
Susan G. Komen New Orleans4. From FY16-FY19, annually Komen New Orleans will
participate in one statewide Lobby Day and National Lobby
Day for Komen target specific legislators for support for Susan
G. Komen’s advocacy priorities.
5. If Louisiana has accepted Medicaid expansion by the FY17
Community Grant Request for Application, the patient
navigation services and transportation assistance for residents
of the target communities will be listed as a funding priority of
Komen New Orleans. If Louisiana has not accepted Medicaid
expansion, the focus will remain on screenings and treatment
assistance.
Priority Objectives
Increase Awareness of 1. Susan G. Komen New Orleans will work with 200 community
Susan G. Komen New and civic organizations along with leaders in each community
Orleans and the in the Affiliate service area with special emphasis on the
services that are highest priority communities of Jefferson Parish, Orleans
provided by the Parish, St. Charles Parish, and St. Bernard Parish to conduct
Affiliate. and partner with existing health fairs and community events
annually from FY16-FY19.
2. The Affiliate will expand partnerships with television, radio and
online community partners by 10 from FY16-FY19. Ideally,
awareness within the target communities would increase by
having corporate partners or sponsors to focus on public
awareness of both Susan G. Komen New Orleans and breast
health awareness.
3. Continue to partner with health and breast health clinics,
physician’s offices, hospitals and schools to attend health fairs
and events providing accurate breast health awareness
literature through the distribution of 10,000 educational
materials annually from FY16-FY19.
4. Continue nine partnerships with Mary Bird Perkins Cancer
Center, The Center for Restorative Breast Surgery, MD
Anderson at East Jefferson General Hospital, the Ochsner
Breast Center, the St. Charles Community Health Center, the
St. Thomas Clinic, the Louisiana Cancer Registry and the
LBCHP, Cancer Association of New Orleans, and the Central
City Health Clinic, which serve the target communities, from
FY16-FY19.
Disclaimer: Comprehensive data for the Executive Summary can be found in the 2015 Komen
New Orleans Community Profile Report.
11 | P a g e
®
Susan G. Komen New OrleansIntroduction
Affiliate History
Susan G. Komen® New Orleans was founded in 1992 by Patricia C. Denechaud and the late Dr.
Merv Trail. Komen New Orleans shares the common mission of other Affiliates to eradicate
breast cancer as a life threatening disease by advancing research, education, screening, and
treatment.
Komen New Orleans works to ensure that all people, regardless of race, income, geographic
location, sexual orientation or insurance status, have access to screening, and if diagnosed, to
quality, effective treatment and treatment support services.
Komen New Orleans Community Grants program is designed to make systemic, lasting change
in the community. The Affiliate is proud to have invested more than $4.8 million into New
Orleans since 1992. Komen New Orleans funding cycle, April 1, 2014 – March 31, 2015,
includes nine projects totaling $620,000 that will provide breast health and breast cancer
services to thousands of low-income and uninsured women in the community.
Fiscal Year 2014/2015 Awarded Grants ~ $620,000
St. Thomas Community Health Center ~funding for breast cancer screening
mammography and diagnostic ultrasounds.
LSUHSC School of Public Health Breast Center~ funding for advanced practice nurse
and diagnostic care coordinator patient navigator.
Cancer Association of Greater New Orleans (CAGNO)~Funding for breast cancer
patients financial assistance with medications, insurance premiums, COBRA fees, co-
pays and breast cancer related medical bills.
Thomas/McMahan Cancer Foundation ~ funding for breast cancer screening
lymphedema therapy, screening and transportation.
Access Health Louisiana ~ funding for breast cancer screening and diagnostic
mammograms.
West Jefferson Medical Center Women’s Imaging & Breast Care Center ~ funding for
breast cancer screening and diagnostic mammograms.
West Jefferson Medical Center Outpatient Rehabilitation Dept. ~ funding for breast
cancer survivor lymphedema rehabilitation and compression materials.
Mary Bird Perkins at St. Tammany Parish Hospital Cancer Program ~ funding for breast
cancer mobile mammography screening.
East Jefferson General Hospital Foundation ~ funding for breast cancer screening and
diagnostic mammograms.
Affiliate Organizational Structure
Komen New Orleans is led by a volunteer Board of Directors and an Executive Director. The
Affiliate’s ability to hire an Executive Director and obtain office space in 2000 has stabilized the
Affiliate leadership and visibility in the community. Visibility within the community has paved the
way for successful fundraising events such as the Summer Cure Chef’s Wine Dinner, #Kickdat
for Komen, and the Salute to Survivors Luncheon.
12 | P a g e
®
Susan G. Komen New OrleansThe Affiliate staff includes two full time employees and four internship positions:
Executive Director
Affiliate Coordinator
Race for the Cure Internship
Mission/Outreach Internship
Public Relations & Marketing Internship
Volunteer Development Internship
The Board of Directors includes:
President
Secretary
Treasurer
6 At-Large Board Members
22 Honorary Board Members
Affiliate Service Area
New Orleans is the Southeastern tip of the State of Louisiana. It is the largest city in Louisiana
and is the center of the largest metropolitan area in Louisiana, the Greater New Orleans
Metropolitan Area, which is the service area of Komen New Orleans. The Greater New Orleans
Metropolitan statistical area includes seven parishes: Orleans Parish, Jefferson Parish, St.
Bernard Parish, St. John the Baptist Parish, St. Charles Parish, Plaquemines Parish and St.
Tammany Parish. Washington Parish is added into the combined statistical area (Figure 1.1).
Geographically, the Greater New Orleans Metropolitan Area is described using the following
terms: East Bank, West Bank, North Shore and River Parishes. The East Bank term refers to
those parishes east and north of the Mississippi River and includes the northern portion of
Jefferson Parish, the northern portion of Orleans Parish and St. Bernard Parish. The West bank
term refers to those parishes west and south of the Mississippi River and includes the southern
portion of Jefferson Parish, the southern portion of Orleans Parish and the western portion of
Plaquemines Parish. St. Tammany and Washington Parish are the North Shore parishes on the
northern shore of Lake Pontchartrain. The River Parishes – St. Charles and St. John the
Baptist – are located along the Mississippi River between New Orleans and Baton Rouge,
Louisiana.
13 | P a g e
®
Susan G. Komen New OrleansFigure 1.1. Susan G. Komen New Orleans service area
14 | P a g e
®
Susan G. Komen New OrleansPurpose of the Community Profile Report
Susan G. Komen’s promise is to save lives and end breast cancer forever by empowering
people, ensuring quality care for all and energizing science to find a cure. To help meet this
promise, Komen New Orleans uses information obtained through a Community Profile Report
(CP) to assure that the mission and non-mission work of the Affiliate is targeted and non-
duplicative.
The CP is a community needs assessment specifically looking at breast cancer in the eight
parishes served by Komen New Orleans. It will help the Affiliate to:
1. Establish granting priorities by helping the Affiliate to better understand which breast
needs have been unmet in each parish and seek out and partner with organizations and
providers that can help meet these needs.
2. Establish focused education activities within the communities that have limited or no
access to breast health awareness information and /or Susan G. Komen.
3. Drive public policy efforts for federal and state funding for patient navigation, low or no
cost screening and transportation to and from treatments.
4. Strengthen/increase partnerships and sponsorships and establish direction for marketing
and outreach activities to increase community awareness of Susan G. Komen and
breast health awareness in the eight parishes served by Komen New Orleans.
15 | P a g e
®
Susan G. Komen New OrleansQuantitative Data: Measuring Breast Cancer Impact in
Local Communities
Quantitative Data Report
Introduction
The purpose of the quantitative data report for the Susan G. Komen® New Orleans is to
combine evidence from many credible sources and use the data to identify the highest priority
areas for evidence-based breast cancer programs.
The data provided in the report are used to identify priorities within the Affiliate’s service area
based on estimates of how long it would take an area to achieve Healthy People 2020
objectives for breast cancer late-stage diagnosis and death rates
(http://www.healthypeople.gov/2020/default.aspx).
The following is a summary of Komen New Orleans’ Quantitative Data Report. For a full report
please contact the Affiliate.
Breast Cancer Statistics
Incidence rates
The breast cancer incidence rate shows the frequency of new cases of breast cancer among
women living in an area during a certain time period (Table 2.1). Incidence rates may be
calculated for all women or for specific groups of women (e.g. for Asian/Pacific Islander women
living in the area).
The female breast cancer incidence rate is calculated as the number of females in an area who
were diagnosed with breast cancer divided by the total number of females living in that area.
Incidence rates are usually expressed in terms of 100,000 people. For example, suppose there
are 50,000 females living in an area and 60 of them are diagnosed with breast cancer during a
certain time period. Sixty out of 50,000 is the same as 120 out of 100,000. So the female breast
cancer incidence rate would be reported as 120 per 100,000 for that time period.
When comparing breast cancer rates for an area where many older people live to rates for an
area where younger people live, it’s hard to know whether the differences are due to age or
whether other factors might also be involved. To account for age, breast cancer rates are
usually adjusted to a common standard age distribution. Using age-adjusted rates makes it
possible to spot differences in breast cancer rates caused by factors other than differences in
age between groups of women.
To show trends (changes over time) in cancer incidence, data for the annual percent change in
the incidence rate over a five-year period were included in the report. The annual percent
change is the average year-to-year change of the incidence rate. It may be either a positive or
negative number.
A negative value means that the rates are getting lower.
A positive value means that the rates are getting higher.
16 | P a g e
®
Susan G. Komen New Orleans A positive value (rates getting higher) may seem undesirable—and it generally is.
However, it’s important to remember that an increase in breast cancer incidence could
also mean that more breast cancers are being found because more women are getting
mammograms. So higher rates don’t necessarily mean that there has been an increase
in the occurrence of breast cancer.
Death rates
The breast cancer death rate shows the frequency of death from breast cancer among women
living in a given area during a certain time period (Table 2.1). Like incidence rates, death rates
may be calculated for all women or for specific groups of women (e.g. Black/African-American
women).
The death rate is calculated as the number of women from a particular geographic area who
died from breast cancer divided by the total number of women living in that area. Death rates
are shown in terms of 100,000 women and adjusted for age.
Data are included for the annual percent change in the death rate over a five-year period.
The meanings of these data are the same as for incidence rates, with one exception. Changes
in screening don’t affect death rates in the way that they affect incidence rates. So a negative
value, which means that death rates are getting lower, is always desirable. A positive value,
which means that death rates are getting higher, is always undesirable.
Late-stage incidence rates
For this report, late-stage breast cancer is defined as regional or distant stage using the
Surveillance, Epidemiology and End Results (SEER) Summary Stage definitions
(http://seer.cancer.gov/tools/ssm/). State and national reporting usually uses the SEER
Summary Stage. It provides a consistent set of definitions of stages for historical comparisons.
The late-stage breast cancer incidence rate is calculated as the number of women with regional
or distant breast cancer in a particular geographic area divided by the number of women living
in that area (Table 2.1). Late-stage incidence rates are shown in terms of 100,000 women and
adjusted for age.
17 | P a g e
®
Susan G. Komen New OrleansTable 2.1. Female breast cancer incidence rates and trends,
death rates and trends, and late-stage rates and trends
Incidence Rates and Trends Death Rates and Trends Late-stage Rates and Trends
# of # of
Female New Age- Trend # of Age- Trend New Age- Trend
Population Cases adjusted (Annual Deaths adjusted (Annual Cases adjusted (Annual
(Annual (Annual Rate/ Percent (Annual Rate/ Percent (Annual Rate/ Percent
Population Group Average) Average) 100,000 Change) Average) 100,000 Change) Average) 100,000 Change)
US 154,540,194 182,234 122.1 -0.2% 40,736 22.6 -1.9% 64,590 43.8 -1.2%
HP2020 . - - - - 20.6* - - 41.0* -
Louisiana 2,265,429 2,967 119.7 1.3% 642 25.4 -1.4% 1,151 46.8 0.4%
Komen New Orleans Service 590,921 841 125.9 1.4% 179 26.4 NA 308 46.5 1.6%
Area
White 365,921 577 125.7 0.7% 114 23.6 NA 194 42.6 0.0%
Black/African-American 205,248 254 133.0 3.4% 64 34.7 NA 110 58.1 3.6%
American Indian/Alaska 3,237 SN SN SN SN SN SN SN SN SN
Native (AIAN)
Asian Pacific Islander 16,515 8 52.3 -6.3% SN SN SN 4 22.9 -0.7%
(API)
Non-Hispanic/ Latina 552,897 807 127.3 1.7% 176 27.3 NA 295 47.0 2.0%
Hispanic/ Latina 38,024 33 100.5 -4.9% SN SN SN 12 36.6 -8.2%
Jefferson Parish - LA 222,356 328 123.4 1.5% 69 24.9 -1.4% 115 44.3 0.0%
Orleans Parish - LA 151,951 209 128.1 1.4% 51 30.8 -1.4% 85 52.8 3.0%
Plaquemines Parish - LA 11,339 14 119.5 -4.6% SN SN SN 5 47.1 -7.0%
St. Bernard Parish - LA 13,705 18 126.9 12.6% SN SN SN 8 52.9 16.1%
St. Charles Parish - LA 26,736 30 110.7 -0.7% 6 25.1 -1.9% 9 34.8 -0.4%
St. John the Baptist Parish - 23,976 30 124.6 1.1% 8 33.2 0.8% 14 58.7 3.0%
LA
St. Tammany Parish - LA 117,318 179 134.0 -0.4% 33 24.8 -0.5% 57 42.5 -1.5%
Washington Parish - LA 23,540 34 116.8 10.7% 6 22.2 -2.5% 14 49.3 11.6%
*Target as of the writing of this report.
NA – data not available.
SN – data suppressed due to small numbers (15 cases or fewer for the 5-year data period).
Data are for years 2006-2010.
Rates are in cases or deaths per 100,000.
Age-adjusted rates are adjusted to the 2000 US standard population.
Source of incidence and late-stage data: North American Association of Central Cancer Registries (NAACCR) – Cancer in North
America (CINA) Deluxe Analytic File.
Source of death rate data: Centers for Disease Control and Prevention (CDC) – National Center for Health Statistics (NCHS) death
data in SEER*Stat.
Source of death trend data: National Cancer Institute (NCI)/CDC State Cancer Profiles.
Incidence rates and trends summary
Overall, the breast cancer incidence rate in the Komen New Orleans service area was slightly
higher than that observed in the US as a whole and the incidence trend was higher than the US
as a whole. The incidence rate of the Affiliate service area was significantly higher than that
observed for the State of Louisiana and the incidence trend was not significantly different than
the State of Louisiana.
18 | P a g e
®
Susan G. Komen New OrleansFor the United States, breast cancer incidence in Blacks/African-Americans is lower than in
Whites overall. The most recent estimated breast cancer incidence rates for Asians and Pacific
Islanders (APIs) and American Indians and Alaska Natives (AIANs) were lower than for Non-
Hispanic Whites and Blacks/African-Americans. The most recent estimated incidence rates for
Hispanics/Latinas were lower than for Non-Hispanic Whites and Blacks/African-Americans. For
the Affiliate service area as a whole, the incidence rate was higher among Blacks/African-
Americans than Whites and lower among APIs than Whites. There were not enough data
available within the Affiliate service area to report on AIANs so comparisons cannot be made for
this racial group. The incidence rate among Hispanics/Latinas was lower than among Non-
Hispanics/Latinas.
Significantly less favorable trends in breast cancer incidence rates were observed in the
following parish:
• St. Bernard Parish
The rest of the parishes had incidence rates and trends that were not significantly different than
the Affiliate service area as a whole.
It’s important to remember that an increase in breast cancer incidence could also mean that
more breast cancers are being found because more women are getting mammograms.
Death rates and trends summary
Overall, the breast cancer death rate in the Komen New Orleans service area was higher than
that observed in the US as a whole and the death rate trend was not available for comparison
with the US as a whole. The death rate of the Affiliate service area was not significantly different
than that observed for the State of Louisiana.
For the United States, breast cancer death rates in Blacks/African-Americans are substantially
higher than in Whites overall. The most recent estimated breast cancer death rates for APIs
and AIANs were lower than for Non-Hispanic Whites and Blacks/African-Americans. The most
recent estimated death rates for Hispanics/Latinas were lower than for Non-Hispanic Whites
and Blacks/African-Americans. For the Affiliate service area as a whole, the death rate was
higher among Blacks/African-Americans than Whites. There were not enough data available
within the Affiliate service area to report on APIs and AIANs so comparisons cannot be made for
these racial groups. Also, there were not enough data available within the Affiliate service area
to report on Hispanics/Latinas so comparisons cannot be made for this group.
None of the parishes in the Affiliate service area had substantially different death rates than the
Affiliate service area as a whole or did not have enough data available.
Late-stage incidence rates and trends summary
Overall, the breast cancer late-stage incidence rate in the Komen New Orleans service area
was slightly higher than that observed in the US as a whole and the late-stage incidence trend
was higher than the US as a whole. The late-stage incidence rate and trend of the Affiliate
service area were not significantly different than that observed for the State of Louisiana.
For the United States, late-stage incidence rates in Blacks/African-Americans are higher than
among Whites. Hispanics/Latinas tend to be diagnosed with late-stage breast cancers more
19 | P a g e
®
Susan G. Komen New Orleansoften than Whites. For the Affiliate service area as a whole, the late-stage incidence rate was
higher among Blacks/African-Americans than Whites and lower among APIs than Whites.
There were not enough data available within the Affiliate service area to report on AIANs so
comparisons cannot be made for this racial group. The late-stage incidence rate among
Hispanics/Latinas was lower than among Non-Hispanics/Latinas.
None of the parishes in the Affiliate service area had substantially different late-stage incidence
rates than the Affiliate service area as a whole.
Mammography Screening
Getting regular screening mammograms (and treatment if diagnosed) lowers the risk of dying
from breast cancer. Screening mammography can find breast cancer early, when the chances
of survival are highest. Table 2.2 shows some screening recommendations among major
organizations for women at average risk.
Table 2.2. Breast cancer screening recommendations
for women at average risk*
National Comprehensive US Preventive Services
American Cancer Society
Cancer Network Task Force
Informed decision-making
with a health care provider
at age 40 Informed decision-making
with a health care provider
Mammography every year
Mammography every year ages 40-49
starting
starting
at age 40
at age 45 Mammography every 2 years
ages 50-74
Mammography every other
year beginning at age 55
*As of October 2015
Because having regular mammograms lowers the chances of dying from breast cancer, it’s
important to know whether women are having mammograms when they should. This
information can be used to identify groups of women who should be screened who need help in
meeting the current recommendations for screening mammography. The Centers for Disease
Control and Prevention’s (CDC) Behavioral Risk Factors Surveillance System (BRFSS)
collected the data on mammograms that are used in this report. The data come from interviews
with women age 50 to 74 from across the United States. During the interviews, each woman
was asked how long it has been since she has had a mammogram. The proportions in Table
2.3 are based on the number of women age 50 to 74 who reported in 2012 having had a
mammogram in the last two years.
The data have been weighted to account for differences between the women who were
interviewed and all the women in the area. For example, if 20.0 percent of the women
interviewed are Hispanic/Latina, but only 10.0 percent of the total women in the area are
Hispanic/Latina, weighting is used to account for this difference.
20 | P a g e
®
Susan G. Komen New OrleansThe report uses the mammography screening proportion to show whether the women in an area
are getting screening mammograms when they should. Mammography screening proportion is
calculated from two pieces of information:
The number of women living in an area whom the BRFSS determines should have
mammograms (i.e. women age 50 to 74).
The number of these women who actually had a mammogram during the past two years.
The number of women who had a mammogram is divided by the number who should have had
one. For example, if there are 500 women in an area who should have had mammograms and
250 of those women actually had a mammogram in the past two years, the mammography
screening proportion is 50.0 percent.
Because the screening proportions come from samples of women in an area and are not exact,
Table 2.3 includes confidence intervals. A confidence interval is a range of values that gives an
idea of how uncertain a value may be. It’s shown as two numbers—a lower value and a higher
one. It is very unlikely that the true rate is less than the lower value or more than the higher
value.
For example, if screening proportion was reported as 50.0 percent, with a confidence interval of
35.0 to 65.0 percent, the real rate might not be exactly 50.0 percent, but it’s very unlikely that it’s
less than 35.0 or more than 65.0 percent.
In general, screening proportions at the county level have fairly wide confidence intervals. The
confidence interval should always be considered before concluding that the screening
proportion in one county is higher or lower than that in another county.
21 | P a g e
®
Susan G. Komen New OrleansTable 2.3. Proportion of women ages 50-74 with screening mammography
in the last two years, self-report
Proportion Confidence
# of Women # w/ Self- Screened Interval of
Interviewed Reported (Weighted Proportion
Population Group (Sample Size) Mammogram Average) Screened
US 174,796 133,399 77.5% 77.2%-77.7%
Louisiana 4,157 3,120 76.8% 74.9%-78.6%
Komen New Orleans Service Area 613 499 80.3% 75.7%-84.2%
White 399 324 81.8% 76.2%-86.3%
Black/African-American 188 155 78.0% 69.0%-85.0%
AIAN SN SN SN SN
API SN SN SN SN
Hispanic/ Latina 17 16 93.8% 61.6%-99.3%
Non-Hispanic/ Latina 593 480 79.7% 75.0%-83.7%
Jefferson Parish - LA 201 170 83.4% 75.8%-89.0%
Orleans Parish - LA 147 119 78.9% 68.4%-86.6%
Plaquemines Parish - LA SN SN SN SN
St. Bernard Parish - LA 13 9 69.9% 28.8%-93.0%
St. Charles Parish - LA 16 13 80.8% 46.1%-95.4%
St. John the Baptist Parish - LA 23 18 86.2% 57.0%-96.7%
St. Tammany Parish - LA 111 89 76.9% 65.1%-85.6%
Washington Parish - LA 94 73 71.8% 59.0%-81.8%
SN – data suppressed due to small numbers (fewer than 10 samples).
Data are for 2012.
Source: CDC – Behavioral Risk Factor Surveillance System (BRFSS).
Breast cancer screening proportions summary
The breast cancer screening proportion in the Komen New Orleans service area was not
significantly different than that observed in the US as a whole. The screening proportion of the
Affiliate service area was not significantly different than the State of Louisiana.
For the United States, breast cancer screening proportions among Blacks/African-Americans
are similar to those among Whites overall. APIs have somewhat lower screening proportions
than Whites and Blacks/African-Americans. Although data are limited, screening proportions
among AIANs are similar to those among Whites. Screening proportions among
Hispanics/Latinas are similar to those among Non-Hispanic Whites and Blacks/African-
Americans. For the Affiliate service area as a whole, the screening proportion was not
significantly different among Blacks/African-Americans than Whites. There were not enough
data available within the Affiliate service area to report on APIs and AIANs so comparisons
cannot be made for these racial groups. The screening proportion among Hispanics/Latinas was
not significantly different than among Non-Hispanics/Latinas.
None of the parishes in the Affiliate service area had substantially different screening
proportions than the Affiliate service area as a whole.
22 | P a g e
®
Susan G. Komen New OrleansPopulation Characteristics
The report includes basic information about the women in each area (demographic measures)
and about factors like education, income, and unemployment (socioeconomic measures) in the
areas where they live (Tables 2.4 and 2.5). Demographic and socioeconomic data can be used
to identify which groups of women are most in need of help and to figure out the best ways to
help them.
It is important to note that the report uses the race and ethnicity categories used by the US
Census Bureau, and that race and ethnicity are separate and independent categories. This
means that everyone is classified as both a member of one of the four race groups as well as
either Hispanic/Latina or Non-Hispanic/Latina.
The demographic and socioeconomic data in this report are the most recent data available for
US counties. All the data are shown as percentages. However, the percentages weren’t all
calculated in the same way.
The race, ethnicity, and age data are based on the total female population in the area
(e.g. the percent of females over the age of 40).
The socioeconomic data are based on all the people in the area, not just women.
Income, education and unemployment data don’t include children. They’re based on
people age 15 and older for income and unemployment and age 25 and older for
education.
The data on the use of English, called “linguistic isolation”, are based on the total
number of households in the area. The Census Bureau defines a linguistically isolated
household as one in which all the adults have difficulty with English.
Table 2.4. Population characteristics – demographics
Black/ Non- Female Female Female
African- Hispanic Hispanic Age Age Age
Population Group White American AIAN API /Latina /Latina 40 Plus 50 Plus 65 Plus
US 78.8 % 14.1 % 1.4 % 5.8 % 83.8 % 16.2 % 48.3 % 34.5 % 14.8 %
Louisiana 63.7 % 33.8 % 0.8 % 1.8 % 96.1 % 3.9 % 46.8 % 33.7 % 14.0 %
Komen New Orleans Service Area 60.1 % 36.4 % 0.6 % 2.9 % 93.1 % 6.9 % 48.1 % 34.6 % 14.0 %
Jefferson Parish - LA 66.8 % 28.4 % 0.6 % 4.2 % 88.6 % 11.4 % 50.2 % 36.8 % 15.7 %
Orleans Parish - LA 33.2 % 63.3 % 0.4 % 3.0 % 95.6 % 4.4 % 44.8 % 32.4 % 12.8 %
Plaquemines Parish - LA 72.2 % 22.2 % 2.0 % 3.7 % 94.8 % 5.2 % 46.1 % 30.7 % 12.3 %
St. Bernard Parish - LA 75.6 % 20.9 % 0.8 % 2.6 % 91.5 % 8.5 % 41.1 % 28.0 % 10.0 %
St. Charles Parish - LA 70.6 % 27.8 % 0.4 % 1.2 % 95.1 % 4.9 % 47.3 % 31.3 % 11.2 %
St. John the Baptist Parish - LA 43.2 % 55.3 % 0.4 % 1.1 % 95.4 % 4.6 % 46.1 % 31.3 % 11.3 %
St. Tammany Parish - LA 85.0 % 12.7 % 0.6 % 1.7 % 95.4 % 4.6 % 50.8 % 36.1 % 14.2 %
Washington Parish - LA 67.8 % 31.5 % 0.4 % 0.3 % 98.4 % 1.6 % 50.3 % 38.0 % 16.6 %
Data are for 2011.
Data are in the percentage of women in the population.
Source: US Census Bureau – Population Estimates
23 | P a g e
®
Susan G. Komen New OrleansTable 2.5. Population characteristics – socioeconomics
Income
Below In
Income 250% Medically No Health
Less than Below Poverty Linguistic- Under- Insurance
HS 100% (Age: Un- Foreign ally In Rural served (Age:
Population Group Education Poverty 40-64) employed Born Isolated Areas Areas 40-64)
US 14.6 % 14.3 % 33.3 % 8.7 % 12.8 % 4.7 % 19.3 % 23.3 % 16.6 %
Louisiana 18.4 % 18.4 % 40.2 % 8.0 % 3.7 % 1.8 % 26.8 % 59.3 % 20.8 %
Komen New Orleans 16.0 % 17.2 % 38.7 % 8.5 % 6.8 % 2.6 % 9.1 % 35.6 % 21.0 %
Service Area
Jefferson Parish - LA 17.0 % 15.1 % 36.5 % 6.7 % 11.1 % 4.3 % 1.1 % 13.5 % 21.9 %
Orleans Parish - LA 16.1 % 25.7 % 48.4 % 11.4 % 5.8 % 2.2 % 0.6 % 36.1 % 23.4 %
Plaquemines Parish - LA 18.4 % 9.4 % 30.0 % 6.9 % 3.0 % 1.0 % 19.5 % 100.0 % 17.0 %
St. Bernard Parish - LA 20.5 % 14.6 % 47.0 % 11.9 % 5.2 % 3.7 % 4.3 % 6.0 % 24.6 %
St. Charles Parish - LA 14.6 % 12.9 % 28.3 % 7.0 % 3.1 % 1.2 % 11.5 % 100.0 % 15.2 %
St. John the Baptist Parish 17.8 % 15.2 % 37.0 % 10.0 % 3.4 % 0.7 % 13.4 % 100.0 % 19.5 %
- LA
St. Tammany Parish - LA 11.6 % 10.1 % 28.1 % 6.1 % 3.4 % 0.9 % 23.2 % 33.6 % 16.9 %
Washington Parish - LA 22.5 % 27.4 % 55.7 % 15.6 % 0.9 % 0.2 % 66.7 % 100.0 % 23.7 %
Data are in the percentage of people (men and women) in the population.
Source of health insurance data: US Census Bureau – Small Area Health Insurance Estimates (SAHIE) for 2011.
Source of rural population data: US Census Bureau – Census 2010.
Source of medically underserved data: Health Resources and Services Administration (HRSA) for 2013.
Source of other data: US Census Bureau – American Community Survey (ACS) for 2007-2011.
Population characteristics summary
Proportionately, the Komen New Orleans service area has a substantially smaller White female
population than the US as a whole, a substantially larger Black/African-American female
population, a slightly smaller Asian and Pacific Islander (API) female population, a slightly
smaller American Indian and Alaska Native (AIAN) female population, and a substantially
smaller Hispanic/Latina female population. The Affiliate’s female population is slightly younger
than that of the US as a whole. The Affiliate’s education level is slightly lower than and income
level is slightly lower than those of the US as a whole. There are a slightly smaller percentage of
people who are unemployed in the Affiliate service area. The Affiliate service area has a
substantially smaller percentage of people who are foreign born and a slightly smaller
percentage of people who are linguistically isolated. There are a substantially smaller
percentage of people living in rural areas, a slightly larger percentage of people without health
insurance, and a substantially larger percentage of people living in medically underserved
areas.
The following parishes have substantially larger Black/African-American female population
percentages than that of the Affiliate service area as a whole:
• Orleans Parish
• St. John the Baptist Parish
The following parish has substantially lower education levels than that of the Affiliate service
area as a whole:
• Washington Parish
24 | P a g e
®
Susan G. Komen New OrleansYou can also read