Improving health and reducing costs through renewable energy in South Africa - Assessing the co-benefits of decarbonising the power sector - RENAC
←
→
Page content transcription
If your browser does not render page correctly, please read the page content below
COBENEFITS STUDY
October 2019

Improving health and reducing costs
through renewable energy in
South Africa
Assessing the co-benefits of
decarbonising the power sector
Executive report

                                      Koffer/
                                      Herz
COBENEFITS Study South Africa This COBENEFITS study has been realised in the context of the project “Mobilising the Co- Benefits of Climate Change Mitigation through Capacity Building among Public Policy Institutions” (COBENEFITS). This print version has been shortened and does not include annexes. The full version of this report is available on www.cobenefits.info. This study is part of a 2019 series of four studies assessing the co-benefits of decarbonising the power sector in South Africa, edited by IASS and CSIR. All reports are available on www.cobenefits.info. Improving health and reducing costs through renewable energy in South Africa Consumer savings through solar PV self-consumption in South Africa Economic prosperity for marginalised communities through renewable energy in South Africa Future skills and job creation through renewable energy in South Africa COBENEFITS is part of the International Climate Initiative (IKI). The Federal Ministry for the Environment, Nature Conservation and Nuclear Safety (BMU) supports this initiative on the basis of a decision adopted by the German Bundestag. The project is coordinated by the Institute for Advanced Sustainability Studies (IASS, Lead) in partnership with the Renewables Academy (RENAC), Independent Institute for Environmental Issues (UfU), IET – International Energy Transition GmbH and the Council for Scientific and Industrial Research (CSIR). Revised edition October 2019. First published March 2019. Editors: Ayodeji Okunlola, David Jacobs, Ntombifuthi Ntuli, Ruan Fourie, Laura Nagel and Sebastian Helgenberger – IASS Potsdam, CSIR and IET Technical implementation: Nuveshen Naidoo, Jackie Crafford, Mark Zunckel and Joseph Mulders – Prime Africa Consultants
Improving health and reducing costs through renewable energy in South Africa

COBENEFITS of the new energy world
of renewables for the people in
South Africa
South Africa is in the midst of an energy transition, with   We particularly highlight and acknowledge the strong
important social and economic implications, depending        dedication and strategic guidance of the COBENEFITS
on the pathways that are chosen. Economic prosperity,        Council members: Olga Chauke (DEA); Nomawethu
business and employment opportunities as well as             Qase (DoE); Gerhard Fourie (DTI); and Lolette
health impacts, issues related to the water–energy–food      Kritzinger-van Niekerk, Frisky Domingues, Thulisile
nexus and global warming impacts: through its energy         Dlamini and Lazarus Mahlangu (IPP Office). Their
pathway, South Africa will define the basis for its future   contributions during the COBENEFITS Council
development. Political decisions on South Africa’s           sessions guided the project team to frame the topics of
energy future link the missions and mandates of many         the COBENEFITS Assessment for South Africa and to
government departments beyond energy, such as                ensure their direct connection to the current political
environment, industry development, science and               deliberations and policy frameworks of their respective
technological innovation.                                    departments. We are also indebted to our highly valued
                                                             research and knowledge partners, for their unwavering
Importantly, the whole debate boils down to a                commitment and dedicated work on the technical
single question: How can renewables improve                  implementation of this study. The COBENEFITS
the lives of the people in South Africa?                     study at hand has been facilitated through financial
Substantiated by scientific rigor and key technical data,    support from the International Climate Initiative of
the study at hand contributes to answering this              Germany.
question. It also provides guidance to government
departments and agencies on further shaping an               South Africa, among 185 parties to date, has ratified the
enabling environment to maximize the social and              Paris Agreement, to combat climate change and provide
economic co-benefits of the new energy world of              current and future generations with opportunities to
renewables for the people of South Africa.                   flourish. Under the guidance of the National Planning
                                                             Commission, municipalities, entrepreneurs, citizens
Under their shared responsibility, the CSIR Energy           and policymakers are debating pathways to achieve a
Centre (as the COBENEFITS South Africa Focal                 just transition to a low-carbon, climate-resilient
Point) and IASS Potsdam invited the Department of            economy and society in South Africa. With this study,
Environmental Affairs (DEA) and Department of                we seek to contribute to these important deliberations
Energy (DoE), together with the Independent Power            by offering a scientific basis for harnessing the social
Producers (IPP) Office, the Department of Trade and          and economic co-benefits of building a low-carbon,
Industry (DTI), Department of Science and Technology         renewable energy system while facilitating a just
(DST) and the South African National Energy                  transition, thereby making the Paris Agreement
Development Institute (SANEDI) to constitute to the          a success for the planet and the people of
COBENEFITS Council South Africa in May 2017 and              South Africa .
to guide the COBENEFITS Assessment studies along
with the COBENEFITS Training programme and                   We wish the reader inspiration for the important debate
political roundtables.                                       on a just and sustainable energy future for South Africa!

               Ntombifuthi Ntuli                                          Sebastian Helgenberger
            COBENEFITS Focal Point                                             COBENEFITS
                 South Africa                                                Project Director
              CSIR Energy Centre                                              IASS Potsdam
                                                                                                                         1
COBENEFITS Study South Africa
Executive Summary Koffer/
Herz
Improving health and reducing costs
through renewable energy in South Africa
Assessing the co-benefits of decarbonising
the power sector
Air pollution, primarily from coal-fired power plants, is This study quantifies the impacts of South Africa’s
one of the main impacts that the energy sector has on power sector on human health, and how a shift to a less
the environment and human health. These pollutants carbon-intensive power sector can help to reduce
have many negative impacts, of which those of greatest negative impacts and contribute to reducing costs in
concern include heart disease, lung cancer, stroke and South Africa’s health system.
chronic obstructive pulmonary disease (WHO, 2016).
The consequences of such diseases include increased
levels of morbidity, which further result in elevated
health costs and losses of productivity.
Key policy message 1: Estimated health costs of coal power generation in 2018 range
from R11 billion (lower estimate) up to R30 billion (upper estimate) and will continue to rise
until 2022. This equates to a health cost externality of Rand 5 –1 5 cents per kWh of energy
generated from coal. As many as 2080 premature deaths annually can be attributed to air
pollution from power plants in South Africa. These externalities should not be disregarded
by policymakers in their integrated resource planning.
Key policy message 2: South Africa can significantly cut health costs by increasing the
share of renewable energy. With its decision to scale up renewables by moving from IRP
2016 to IRP 2018, South Africa by the year 2050 can cut health costs associated with the
power sector by 25 %, and considerably reduce negative health impacts and related costs
for people and businesses.
Key policy message 3: Health impacts and related costs can be reduced even further by
following (or going beyond) the DEA’s Rapid Decarbonisation pathway. By the year 2050,
this scenario could cut an additional 20 % of health costs associated with the power sec-
tor, amounting to as much as R100 billion in absolute savings.
KEY FIGURES:
COBENEFITS
South Africa (2019):
Up to 44 million people are exposed to air pollution from coal power plants in South Improving health and
Africa. reducing costs through
renewable energy in
Health costs related to coal emissions will peak in 2022, at up to R45 billion in that South Africa.
year alone. Assessing the co-benefits
of decarbonising the
As many as 2080 premature deaths annually were predicted due to air pollution from power sector
power plants in South Africa.
available on
Health cost externalities of Eskom’s power plants range from Rand 5 to 15 cents www.cobenefits.info
per kWh.
2Improving health and reducing costs through renewable energy in South Africa
KEY FINDINGS:
Health costs of coal power generation will continue to rise until 2022, ranging from R13
billion (lower estimate) to 45 billion (upper estimate) in 2022 alone, a trend shown by all
energy generation scenarios. In 2018, Eskom generated about 215 TWh of electricity, at
an estimated health cost of R11–30 billion. Accordingly, the health cost externalities of
Eskom’s power plants are within the range Rand 5–15 cents per kWh.
Health effects are most severe in the Highveld Priority Area, where most of South Africa’s
coal-fired power plants are located. The proximity of settlements to a power plant is a ma-
jor factor in total health costs, and therefore considering the locations of plants when for-
mulating decommissioning strategies could drastically reduce human exposure to pollution.
Health costs can be reduced significantly by increasing the share of renewables. By sca-
ling up renewables in IRP 2018 in comparison to IRP 2016, South Africa by the year 2050
will cut health costs from the power sector by 25 %. In absolute terms, up to R12.7 billion
(upper estimate) and at least R3.8 billion (lower estimate) will be unburdened from health
costs by the year 2035. For the year 2050, the estimated health cost savings are between
R168 billion and R48 billion respectively.
By following the DEA’s Rapid Decarbonisation pathway an additional 10 % of health
costs (compared with IRP 2018) associated with the power sector can be cut by the year
2035. By the year 2050, these additional cost savings would amount to almost 20 %. In
monetary terms, this represents additional savings (compared with IRP 2018) of at least
R14 billion (lower estimate) and up to R50 billion (upper estimate) by the year 2030, and
between R28 billion and R101 billion by the year 2050. Given that this pathway included
coal power generation beyond 2050, health costs could be further reduced in a scenario
that phases out coal power before 2050.
Decommissioning of Eskom’s oldest and dirtiest coal-fired power plants in the 2020s will
contribute to bringing down health costs in the nearer future to around R5–18 billion by
2030 (compared to peak costs ranging from R13 to 45 billion in 2022).
Health impacts on workforce productivity: The study findings show that (independent
of the choice of dispersion model) around 27 % of health costs are associated with re-
stricted activity days. Most studies do not model mercury – however, mercury damage
accounted for up to 5 % of health costs in the present study. This means that health impact
assessments are highly sensitive to the estimated cost of mercury damage and to the
value of a statistical life (VSL) employed.
5-step/5-scenario approach for Four different scenarios for the future development of
evaluating health co-benefits the electricity sector in South Africa were analysed: the
Integrated Resource Plan 2016 (IRP 2016), which is
The approach taken comprises five broad steps (cf. used as the baseline case; the Integrated Resource Plan
figure below): (1) Evaluate air pollution emissions for a 2018 (IRP 2018); Council for Scientific and Industrial
range of energy-generation scenarios; (2) Model the Research Least cost planning scenario (CSIR_LC); and
dispersion of air pollutants in the atmosphere; (3) the Department of Environmental Affairs Rapid
Calculate the proportion of the population exposed to Decarbonisation scenario (DEA_RD).
different concentrations of air pollutants; (4) Estimate
the change in disease incidence associated with Given the challenges in modelling the dispersion of
pollution exposure; (5) Attribute monetary costs to pollutants over the South African territory, this study
different diseases, thereby calculating the total financial took a comparative approach based on two recent
cost of health impacts in each scenario. models, representing the possible lower and upper
estimates of atmospheric pollutant concentrations in
South Africa, thereby providing the big picture of
possible effects.
3COBENEFITS Study South Africa
By 2050, South Africa can almost completely
eliminate its health costs from the power sector by
following an ambitious decarbonisation pathway
50
Current annual health costs:
R42 billion
40
[billion rand]
30
20
10 18
15
10
0 1
2030 2050
Current policy (IRP 2016) Rapid decarbonisation (DEA) Rapid decarbonisation savings
Health costs from the power sector
South Africa can save as much as R141 billion
in health costs by 2050 by following a rapid
decarbonisation pathway
141
98
[billion rand]
31
2030 2040 2050
Accumulated savings in the health sector by moving from current policy
(IRP 2016) to rapid decarbonisation (DEA)
4Improving health and reducing costs through renewable energy in South Africa
Contents
COBENEFITS of the new energy world of renewables for the people in South Africa 1
Executive Summary 2
1. Reducing air pollution from the power sector has many benefits 7
1.1 What is in the air we breathe? 7
Sulphur dioxide (SO2) 8
Nitrogen dioxide (NO2) 8
Particulate matter (PM10 and PM2.5) 9
1.2 Existing Knowledge and Gaps 10
Study Limitations 11
2. Methodology 12
2. 1 Reference policy and scenarios 12
2.2 Dispersion Modelling 13
Comparative approach representing the possible lower and upper estimates of 13
atmospheric pollutant concentrations
2.3 Exposure Modelling 14
2.4 Measuring health effects and health costs 16
3. The status quo: high health-related costs from the power sector 18
3.1 IRP 2018, defining the pathway to a power sector with reduced negative 19
health externalities
3.2 Surpassing IRP 2018’s limitations through the DEA Rapid Decarbonisation 19
scenario
4. Creating an enabling environment to improve health and save costs 21
References 23
Glossary and abbreviations 25
5COBENEFITS Study South Africa
List of Tables
Table 1: Table 1 Health effects, related indicator pollutants, baseline incidence, 17
exposure–response functions and health care costs used in the health impact model
List of Figures
Figure 1: South Africa’s large coal-fired power plants are all within Air Quality Priority 7
Areas (Adapted from SAAQIS)
Figure 2: Annual average SO2 concentrations at DEA monitoring stations in the HPA 8
(ppb: parts per billion)
Figure 3: Annual average NO2 concentrations at HPA monitoring stations 8
(ppb: parts per billion)
Figure 4: Annual average PM10 (top) and PM2.5 (bottom) concentrations for the HPA 9
(µg/m3)
Figure 5: Broad methodological steps involved in the Integrated Health Cost Model 12
Figure 6: Spatial domains used in the models developed by Naledzi (2018, lower estimate) 14
and Myllyvirta (forthcoming, upper estimate)
Figure 7: Location of thermal power plants (coal, diesel and natural gas) in South Africa 14
Figure 8: Pollution dispersion model demonstrating ground-level exposure to NOX from 15
Camden coal-fired power station
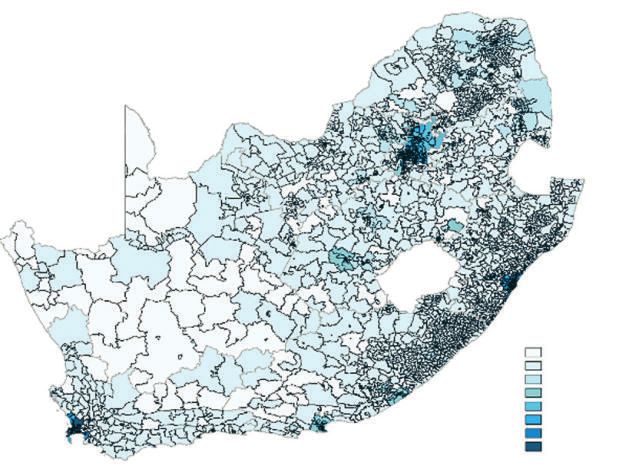
Figure 9: Population distribution in South Africa (adapted from Stats SA, 2012) 15
Figure 10: Exposure modelling components of the Integrated Health Cost Model 16
Figure 11: Exposure–response functions demonstrating relationships between pollutant 17
exposure and disease incidence
Figure 12: Health costs from the power sector across all scenarios between years 2019 18
and 2050 (higher estimate case)
Figure 13: Health costs associated with the power sector across all scenarios between 18
years 2019 and 2050, with the shares of “disease” burden from the year 2019 to
2021 (Lower estimate case)
Figure 14: Annual health cost trend (deviation) between IRP 2018 and IRP 2016 between 19
years 2030 and 2050 (higher estimate case)
Figure 15: Annual health cost trend (deviation) between IRP 2018 and IRP 2016 between 19
years 2030 and 2050 (lower estimate case)
Figure 16: Lower estimate cost for each disease incidence (or ailment) from 2025 until 20
2050 for the DEA_RD scenario (further ambitious efforts could deliver net-zero
health costs before 2045)
Figure 17: Lower estimate cost for each disease incident (or ailment) from 2025 until 20
2050 for the IRP 2018 (by 2050 the health costs from the power sector still
exceed R1 billion)
6Improving health and reducing costs through renewable energy in South Africa
1. Reducing air pollution from the
power sector has many benefits
Air pollution in South Africa is caused by myriads of 1.1 What is in the air we breathe?
industrial processes, vehicle emissions, biomass and
waste burning, domestic fuel burning, mines and mine Air pollution, primarily from coal-powered power plants,
dumps. Due to the strong dependence on coal as a fuel is one of the main impacts that the energy sector has on
source for power generation, the power sector has the environment and human health. These pollutants
become a major contributor to air pollution in the have many negative impacts, of which those of most
country; with emissions from the coal power plants concern include heart disease, lung cancer, stroke and
having severe negative impacts on the health status and chronic obstructive pulmonary disease (WHO, 2016).
wellbeing of the citizens. Amongst others, cardiovascular The consequences of such diseases include premature
and respiratory diseases occur more frequently and with death and increased levels of morbidity, which further
high mortality and morbidity rates, thus significantly result in elevated health costs and losses of economic
impacting the country’s health sector costs. productivity. Accurately estimating morbidity and
mortality, and attributing these to a specific pollutant, is
By reducing the harmful emissions generated from the contentious in the South African context, due to a lack of
power sector and moving towards higher shares of local epidemiological data, and the combined effects of
renewable energy sources in the country’s energy mix, factors such as indoor pollutants.
national health care costs can be reduced. A proactive
deployment of renewables driven by a need to improve The various impacts of air quality are most relevant to
the air-quality standard in provinces around the power coal-fired power stations, particularly when these all
plants while in turn delivering on the broad economic occur within the three priority areas identified by the
and health co-benefits1 and savings are in line with South Department of Environmental Affairs (DEA) under the
Africa’s “just transition” approach. Accounting for the National Environmental Management Act (NEMA:
positive externalities of a decarbonised power sector in AQA, 2004), where ambient air quality standards are
South Africa is therefore integral in delivering on the not being met and specific interventions are required to
objectives of South Africa’s Nationally Determined manage air quality.
Contributions (NDCs) and Paris commitments.
Limpopo Figure 1: Auction results
Province for large-scale solar
1
PV projects worldwide
Mpumalanga
Source: Senatla &
Gauteng
Mushwana, 2017, based on
North West information from IRENA
Free State KwaZulu-
Natal
Northern Cape
Highveld Priority Area
Vaal Priority Area
Eastern Cape Watersberg Bojanala Priority
SA Provinces
Western Cape
Eskom coal-fired power plants
5
The term “co-benefits” refersWestern Cape
to simultaneously meeting several interests or objectives resulting from a political
intervention, private sector investment or a mix thereof (Helgenberger et. al, 2019). It is thus essential that the
co-benefits of climate change mitigation are mobilized strategically to accelerate the low-carbon energy
transition (Helgenberger et al. 2017)
7COBENEFITS Study South Africa
Emissions of air pollutants from the concentration of HPA follows. There are some gaps in the data record
heavy industry (including power generation), domestic from periods when monitoring stations were non-
fuel burning, mining and biomass burning contribute to operational.
poor air quality across South Africa. Air quality in the
Highveld, which contains most of South Africa’s coal-
fired power stations, often fails to meet National Sulphur dioxide (SO2)
Ambient Air Quality Standards (NAAQS) (DEA, 2009
and 2012). As a result, the Minister of Environmental Industrial processes and power generation are the main
Affairs declared the Highveld Priority Area (HPA) in sources of atmospheric SO2, through the combustion
November 2007 under the terms of Chapter 18 of the or refining of fuels containing sulphur. The highest
National Environment Management: Air Quality Act, concentrations occur in Witbank, where the NAAQS
2004 (Act No. 39 of 2004) (NEMA: AQA). was exceeded in 2010 and 2011, and annual average
concentration is 90 % of the NAAQS in most other
In 2008 the DEA established a network of five ambient years. Noteworthy is the decreasing trend in SO2
monitoring stations within the HPA, located at Ermelo, concentrations over the 9-year monitoring period at
Hendrina, Middelburg, Secunda and Witbank. An Hendrina, Middelburg and Ermelo (Figure 2 ).
overview of the state of air quality (per pollutant) in the
30 Figure 2: Annual average
SO 2 concentrations at
SO 2 concentration (ppb)
DEA monitoring stations
in the HPA (ppb: parts per
Annual average
20 billion)
Source: own
10
0
Ermelo Hendrina Middleburg Secunda Witbank
2009 2010 2011 2012 2013 2014 2015 2016 NAAQS
Nitrogen dioxide (NO2) average ambient NO2 concentrations are relatively low
compared to the NAAQS, except at Secunda in 2009
Industrial processes and power generation are the main and Witbank in 2016 where exceedances occurred.
sources of NO2 in the atmosphere, through the Noteworthy is the increasing trend in annual average
combustion or refining of fossil fuels, with some NO2 concentrations at all the monitoring stations since
contribution from motor vehicle emissions, residential 2014, except at Ermelo (Figure 3 ).
fuel burning and biomass burning. In the HPA, annual
50 Figure 3: Annual average
NO 2 concentrations at
NO 2 concentration (ppb)
HPA monitoring stations
40
(ppb: parts per billion)
Annual average
30 Source: own
20
10
0
Ermelo Hendrina Middleburg Secunda Witbank
2009 2010 2011 2012 2013 2014 2015 2016 NAAQS
8Improving health and reducing costs through renewable energy in South Africa
Particulate matter (PM10 and PM2.5) The annual average PM2.5 concentrations are also high
at the HPA monitoring stations relative to the NAAQS
There are numerous sources of particulate matter in the (25 µg/m3 prior to 2016, 20 µg/m3 thereafter), except at
HPA, including industry, mining, biomass burning and the Hendrina and Secunda stations. The data series also
agricultural, as well as natural sources such as wind shows consistent exceedances of the NAAQS.
entrainment. Collectively, they contribute to high
annual average PM10 concentrations at most of the
DEA monitoring stations. Monitoring records show
consistent exceedances of the NAAQS (Figure 4 ).
120 Figure 4: Annual average
PM10 (top) and PM2.5
PM 10 concentration (µg/m3)
100 (bottom) concentrations
for the HPA (µg/m3)
Annual average
80
Source: own
60
40
20
0
Ermelo Hendrina Middleburg Secunda Witbank
2009 2010 2011 2012 2013 2014 2015 2016 NAAQS
50
PM 25 concentration (µg/m3)
40
Annual average
30
20
10
0
Ermelo Hendrina Middleburg Secunda Witbank
2009 2010 2011 2012 2013 2014 2015 2016 NAAQS
9COBENEFITS Study South Africa
1.2 Existing knowledge and gaps A 2017 study commissioned by Groundwork estimated
that the health impacts of air pollution from coal-fired
Many studies have estimated the health impacts of power plants cost South Africa $2.4 billion annually
either fossil fuel power plants, air pollution in general or (Holland, 2017). The study used many of the results of
specific sources of pollutants in South Africa. They the previously discussed Greenpeace study.
estimated morbidity and mortality, and in some
instances attributed monetary costs to these health Scale: National (Air pollution from coal-fired power
impacts. Studies of this type can employ either bottom- plants)
up (deterministic) or top-down (stochastic) approaches Resolution: Medium
to modelling pollution exposure, with the latter usually Health outcomes: Morbidity and mortality
preferable in data-poor environments or large spatial Modelling approach: Bottom-up
domains (Dios et al., 2012). Previous studies also varied
in geographic scale, ranging from selected areas to the Van Horen (1996) evaluated the health costs associated
national scale. Some of the most recent and relevant with Eskom’s power stations as part of understanding
include: the true costs of electricity generation. The valuation of
morbidity outcomes was found to be small in terms of
The World Health Organization (2009) estimated that, costs per kWh generated.
during 2009, approximately 1100 deaths in South Africa
could be attributed to poor outdoor air quality. Scale: National (Air pollution from coal-fired power
plants)
Scale: National (All air pollution) Resolution: Medium
Resolution: Coarse Health outcomes: Morbidity and mortality
Health outcomes: Mortality Modelling approach: Bottom-up
Modelling approach: Top-down
The Fund for Research into Industrial Development
The Institute for Health Metrics and Evaluation listed Growth and Equity, in 2004, assessed the economic
air pollution as the 9th largest risk factor for death and impact of air pollution in selected areas of South Africa.
disability combined in 2016 in South Africa (IHME, The study found that power generation was responsible
2016). for 51 % of the 8700 respiratory cases in Mpumalanga
(FRIDGE, 2004).
Scale: National (All air pollution)
Resolution: Medium Scale: Selected areas (All air pollution and air
Health outcomes: Morbidity and mortality pollution from power plants)
Modelling approach: Bottom-up Resolution: Medium
Health outcomes: Morbidity and mortality
A study commissioned by Greenpeace in 2014 Modelling approach: Bottom-up
estimated that air pollution emissions from Eskom’s
coal-fired power plants could cause as many as 2200 A review by Spalding-Fecher and Matibe (2003) aimed
premature deaths per year (Myllyvirta, 2014). The study to calculate the external costs of electric power
also estimated the impacts of mercury pollution. generation in South Africa, and estimated the health
costs to be R1.1 billion per year.
Scale: National (Air pollution from coal-fired power
plants) Scale: National (Air pollution from power plants)
Resolution: Medium Resolution: Coarse
Health outcomes: Morbidity and mortality Health outcomes: Morbidity and mortality
Modelling approach: Bottom-up Modelling approach: Top-down
10Improving health and reducing costs through renewable energy in South Africa
Summary:
Except for studies on a small geographical scale, most studies use very coarse pollution
dispersion models. There is the opportunity to leverage existing information on power
plant emissions in order to obtain not just more accurate dispersion models, but finer
resolution on population exposure.
All the studies listed made use of internationally developed exposure–response functions.
There are many factors that will cause South Africans to have different responses to air
pollution, including tobacco usage, HIV prevalence and socio-economic circumstances;
consequently, there is a lack of local exposure–response functions.
There are sufficient data and useful methodologies to enable detailed bottom-up (deter-
ministic) models for the present study.
Mortality health outcomes make up the bulk of health costs (>80 %) in most studies. This
means that health impact assessments are highly sensitive to the value of a statistical life
(VSL) used.
Study limitations Scenario descriptions: Scenarios are based on various
policy documents that describe power generation by
Air quality data and information: The lower estimate technological capacity. The lack of detail, specifically
used in this study relied on domain-constrained on the positioning of new builds, means that
predicted ambient concentrations related to only 13 of assumptions must be made regarding population
Eskom’s coal-fired power plants, and thereby exposure. The study assumes that new coal power
underestimates total health impacts. stations will be built close to coal resources in
Limpopo and Mpumalanga, and that natural gas- and
Local exposure–response functions: No local expo- diesel-powered stations will be built close to ports in
sure–response functions are available for South Africa. the Western Cape, Eastern Cape and KwaZulu-Natal.
The international functions used in this study do not
take into account local factors such as economic Health effects: Mortality health effects made up the
status, access to health care, HIV prevalence and majority of the health costs (67 – 71 %) and are typically
tobacco consumption, which could lead to an >80 % in most studies that do not model mercury. This
overestimation of health costs since these factors means that health impact assessments are highly
increase baseline disease incidence. In order to sensitive to the value of a statistical life (VSL) used in
develop local functions, certain preconditions need to modelling.
be met, including adequate monitoring, reporting and
verification of disease incidence, and greatly improved Exposed population: The Integrated Health Cost
monitoring and modelling of ambient air quality. Model assumed evenly distributed population growth
(in line with the United Nations Population Fund’s
Availability of health data: While mortality data are middle estimate) at the ward and municipal levels
published by Statistics South Africa, there is limited from now until 2050 (i.e., all wards and municipalities
information available on morbidity. The study grow at the same rate). While population growth is
therefore used international baseline estimates for unlikely to be homogenous, in the absence of finer-
morbidity. Improved reporting by both the private scale population growth estimates, this is a necessary
and public health sectors is required to improve health assumption. Furthermore, because the model evalu-
cost estimates. ates average pollution concentrations at the ward
level, it may slightly underestimate exposure of
populations that are very close to the power station.
11COBENEFITS Study South Africa
2. Methodology
To achieve the study’s aim of quantifying the health dispersion patterns, exposure–response functions,
impacts of improved air quality resulting from a less population data and health cost estimations into a user-
carbon-intensive power sector, a detailed Integrated friendly tool to estimate the health costs of each scenario
Health Cost Model was developed. The Microsoft over a specific period. The approach can be simplified
Excel-based model integrates scenario permutations, into five broad steps:
Figure 5: Broad
1 2 3 4 5 methodological steps
involved in the Integrated
Health Cost Model
Source: own
1. Scenario emissions: Evaluate air pollution emissions expected for each scenario;
2. Dispersion modelling: Model the dispersion of air pollutants in the atmosphere;
3. Exposure modelling: Estimate the population numbers exposed to different
concentrations of air pollutants;
4. Health effects: Estimate the effects on disease incidence associated with changes
in pollution exposure;
5. Health costs: Attribute monetary costs to diseases and provide total health impacts
in each scenario.
2.1 Reference policy and scenarios the power sector. The Integrated Resource Plan Policy
Adjusted scenario 2018 (IRP 2018)3, also developed by
Four scenarios were analysed for the future development the DOE, is an updated version of the IRP 2016
of the power sector in South Africa. From these four, document, which shows the new medium- and long-
three government-level scenarios from the Department term electricity sector planning document under
of Energy (DOE) and the Department of Environmental consideration by the South African Government. It
Affairs (DEA) South Africa represent the composition shows the increased share of renewable energy sources
of South Africa’s energy mix over medium- and long- in the energy mix, and also provides insight into the
term planning horizons, and form the basis in this study planned timeline for decommissioning existing coal
for assessing health costs associated with the power power plants by the years 2030 (for the short term) and
sector. The power supply mix and new capacity 2050 (for the medium and long term). The third
additions from the Integrated Resource Plan 2016 (IRP government reference policy and scenario assessed is
2016)2 scenario developed by the DOE are chosen as the the DEA Rapid Decarbonisation scenario4 (DEA_RD),
baseline, representing the policy-planning status quo in which presents an alternative approach for rapidly
2
The IRP refers to the coordinated schedule for generation expansion and demand-side intervention programmes,
taking into consideration multiple criteria to meet electricity demand. The IRP 2016 presents insights on the preferred
generation technology required to meet expected demand growth post-2030. The planning period further extends
beyond 2030 up to 2050. The scenario’s calculations are based on broadly different factors, such as technology cost
calculations, energy policy direction and emission targets. The base case scenario (BC) is used for the analysis.
3
The draft IRP 2018 was published for consultation in August 2018. It considered demand-growth scenarios that tested
the impacts of projected load demand (at a moderate rate) on the energy mix up to 2030. Details of the scenario can
be found here: http://www.energy.gov.za/IRP/irp-update-draft-report2018/IRP-Update-2018-Draft-for-Comments.pdf
4
The DEA_RD scenario presents an alternative mitigation pathway via emission reduction in the power sector as well
as the technological requirements for power generation. The scenario has a baseline set from 2015 and projected until
2050. The data for this scenario were provided directly by the Department of Environmental Affairs (as a member of
the COBENEFITS COUNCIL) to be analysed in this study.
12Improving health and reducing costs through renewable energy in South Africa
reducing the greenhouse gas and harmful emissions methylmercury through the food chain. Total mercury
generated from the power sector. The scenario increases emissions were presumed to scale with coal capacity.
the share of renewable energy in the power sector to
more than 70 % by the year 2050. It also has a planning
horizon up to the years 2030 for the short term and 2050 Comparative approach representing the
for the long term. The last scenario analysed is the possible lower and upper estimates of
Council for Scientific and Industrial Research Least atmospheric pollutant concentrations
Cost planning scenario5 (CSIR_LC). This scenario was
developed as the least-cost alternative to power sector Given the challenges in modelling the dispersion of
planning, as a formal and independent review of the IRP pollutants over the South African territory this study
2016. The scenario places no annual techno-economic took a comparative approach based on two recent
limitations on expanding the shares of renewable energy models, representing the possible lower and upper
sources over the planning horizon until 2050. estimates of atmospheric pollutant concentrations in
South Africa, thereby providing the big picture of possible
effects.
2.2 Dispersion modelling
The two models, the predicted pollutant concentrations
The dispersion of air pollutants from sources (power show some similar trends over time, but differ in the
plants) to receptors (ground level) are modelled using magnitude of their predictions. Consequently, the two
dispersion models. Dispersion models take into models are used here to represent the possible lower
consideration the quantities and concentrations of (Naledzi, 2018) and upper (Myllyvirta, forthcoming)
pollutants emitted from sources, and model how they are ranges of atmospheric pollutant concentrations in South
dispersed throughout the modelling domain based on Africa:
factors such as topography, meteorological conditions
and properties of pollutants. The outputs of these models Naledzi (2018), commissioned by Eskom:
are predictions of ambient pollutant concentrations.
Models the dispersion of pollutants from 13 coal-fired
plants (excluding Medupi and Matimba),
The following indicator pollutants were used:
The modelling results covered a domain of 97 200 km2
Particulate matter (PM2.5) is a complex mixture of (360 km by 270 km), including 41 municipalities.
extremely small particles and liquid droplets emitted
from the combustion process, and includes The maximum mean annual concentrations observed
uncombusted fuel components. per municipality (attributed to power stations) in 2018
were 2.1 µg/m3 (NO2), 2.9 µg/m3 (PM2.5) and 9.0 µg/m3
Oxides of nitrogen (NOX), expressed as nitrogen (SO2).
dioxide (NO2), are produced from the reaction of
atmospheric nitrogen and oxygen at high temperature The dispersion of air pollutants was modelled based on
during combustion. the requirements of the DEA (DEA, 2014). The study
employed CALPUFF, a multi-layer, multi-species, non-
Sulphur dioxide (SO2) is produced during combustion, steady-state puff dispersion model that simulates the
depending on the sulphur content of the fuel. effects of temporally- and spatially-varying meteo-
rological conditions on pollution transport, trans-
Mercury (Hg) is produced during combustion, formation and removal. Stack, emission, topographical
depending on the mercury content of the fuel. It is and meteorological parameters were obtained from
primarily a threat to health when absorbed as publicly available sources.
5
The CSIR least-cost scenario was developed as an independent review of the IRP 2016 (Wright et al., 2017). The
scenario places no annual technical limitations on the penetration of solar and wind technologies over the planning
horizon until 2050. It shows lower emissions in the energy mix, and consumes less water than the Draft IRP 2016.
Renewable energy costs are set to be compatible with the global learning curve on energy technologies. Furthermore,
the scenario presents solar PV and wind energy as the largest contributors to the energy supply mix in South Africa
by 2050. 2050. The data for this scenario were provided directly by the Department of Environmental Affairs (as a
member of the COBENEFITS COUNCIL) to be analysed in this study.
13COBENEFITS Study South Africa
Myllyvirta (forthcoming), produced The maximum mean annual concentrations (attributed
by Greenpeace: to power stations) observed per municipality in 2018
were 6.0 µg/m3 (NO2), 8.3 µg/m3 (PM2.5) and 9.6 µg/m3
Models the dispersion of pollutants from 15 coal-fired (SO2).
and 2 open cycle gas turbine (OCGT) at Acacia and
Port Rex. Stack, emission, topographical and meteo-rological
parameters were obtained from publicly available
The model covered a domain of 2 250 000 km2 sources.
(1500 km by 1500 km), comprising 208 municipalities.
Figure 6: Spatial domains
used in the models
Source: Naledzi, 2018
commissioned by
Eskom (Myllyvirta,
forthcoming), produced
by Greenpeace
(Naledzi, 2018), (Myllyvirta, forthcoming),
commissioned by Eskom produced by Greenpeace
2.3 Exposure modelling dispersed in the atmosphere, for example a population
close to a power plant may have low exposure if prevailing
Estimating actual exposure to pollutants is crucial to wind patterns move pollution away from the population.
understanding their health impacts. In general, popu- Thus, exposure to air pollution is determined primarily
lations closer to pollution sources are exposed to higher by three factors: the locations of pollution sources (Figure
concentrations of pollution, and the cumulative health 7), the dispersion of pollutants (Figure 8), and population
impact is higher when the population concentration is density (Figure 9).
high as more people are exposed. However, exposure to
pollution is also dependent on how the pollution is
Figure 7: Location of
thermal power plants
(coal, diesel, and natural
gas) in South Africa
Source: own
Thermal
power plants
14Improving health and reducing costs through renewable energy in South Africa
Figure 8: Pollution disper-
sion model demonstrating
ground-level exposure to
NO X from Camden coal-
fired power station
Source: own
Figure 9: Population
distribution in South
Africa
Source: own, adapted
from Stats SA, 2012
Population by Ward
200 – 2.744
2.744 – 5.288
5.288 – 7.833
7.833 – 10.377
10.377 – 12.921
12.921 – 15.466
15.466 – 18.010
18.010 – 20.554
Combing these three data sources by means of a (figure 7) to produce a pseudo-ambient air quality
geographical information system (and suitable scaling) data set (attributable to power station emissions).
enables estimation of the population exposed to These annual average concentrations per pollutant
different concentrations of pollutants. are averaged over suitable administrative boundaries
(wards) and then overlaid onto the population data
The population exposure to each pollutant per year for (figure 9) at the same spatial scale. Simultaneously,
each scenario was modelled by combining the outputs temporal effects are considered, such as population
from the preceding methodological steps (figure 10). growth (adapted from United Nations, 2017), and fleet
The Integrated Health Cost Model overlays dispersion capacity changes are modelled for each scenario
models (figure 8; figure 9) onto power plant locations (section 2.1).
15COBENEFITS Study South Africa
Figure 10: Exposure
Population Dispersion modelling components
of the Integrated Health
growth models
Cost Model
Source: own
Population Fleet
density capacity
Administrative Power plant
boundaries locations
Mercury is produced during the combustion process, hospitalisation for respiratory or cardiovascular diseases,
depending on the mercury content of the fuel, although it and exacerbation of respiratory diseases such as asthma.
is primarily a threat to health when absorbed as In order to provide a monetary estimate of the annual
methylmercury through the food chain. As such, costs associated with air pollution, estimated health
mercury-related impacts were calculated as a borderless endpoint incidences are applied to costs obtained from
cost, with just the quantity emitted being material. the South African Health Review (Gray and Vawda, 2017)
Garnham and Langerman (2016) estimated that Eskom commissioned by the Health Systems Trust.
coal power stations released 16.8 – 22.6 tons of mercury in
2015. Using the average value (19.7 tons), for Eskom’s Indirect costs are caused by loss of economic productivity
38,234 MW coal capacity that year (Eskom, 2017), an resulting from issues such as absenteeism, temporary or
emission factor of 0.51 kg/MW of coal capacity was permanent disability and premature mortality.
calculated. This emission factor was extrapolated to the
entire study period for each scenario, based on modelled Health outcomes indicate the results of various policy
coal capacity per year. interventions (e.g., in the fields of health, environment,
etc.), represented as changes in patients’ health over time.
Monitoring health outcomes over time can indicate the
2.4 Measuring health effects and environmental and health impacts of policy objectives
health costs such as reducing the concentrations of atmospheric
pollutants. To be of use in assessing the health impacts of
The fundamental goal of a health cost study is to evaluate air pollution, the chosen health outcomes should provide
the economic burden that illness imposes on society as a suitable evidence demonstrating a causal link with air
whole (Jo, 2014). A study by Rice et al. (1985) was pollutants, such as exposure–response functions that
instrumental in standardising the methodology for quantify the relationship and data on average costs of
estimating COI, and continues to be used internationally treatment.
with periodic updates (Rice, 1996; 2000). COI studies
traditionally stratify costs into three categories: direct, Exposure–response functions were used to estimate the
indirect, and intangible. However, intangible costs have increased disease incidence attributable to the annual
seldom been quantified in COI studies, due to average pollution concentration to which the population
measurement difficulties and related controversies (Jo, per ward was exposed. The specific health effects
2014). evaluated were: cerebrovascular, cardiovascular, respi-
ratory and diabetes mellitus mortality; respiratory or
Direct costs arise from the use of health care services in cardiac hospital admissions; restricted activity days; and
the prevention, diagnosis and treatment of diseases. For mercury damage (table 1). The exposure–response
example, acute (short-term) and chronic (long-term) functions demonstrate a relative increase in disease
human exposure to air pollution can result in a range of incidence (from the baseline incidence) per 10 µg/m3
health effects (FRIDGE, 2004). Such effects impose increase in mean annual average exposure per pollutant
direct costs on the health care system, such as (figure 11).
16Improving health and reducing costs through renewable energy in South Africa
Health costs were then attributed to each incidence of health costs were based on a study by Myllyvirta (2014).
disease. A contentious method of estimating health costs Their estimated cost of $1500 per kg of Hg was adjusted
is the value of a statistical life, an economic value that is to current US dollar prices and then converted to the
used to quantify the benefit of avoiding a fatality, rand-equivalent (using a conversion factor of 14 rand per
estimates of which are generally within the range R4–40 dollar), giving a damage cost of R25 000 per kilogram of
million (our medium estimate assumes R12 million). mercury emitted. The total cost associated with mercury
Hospital admission costs range from R11 000 to R24 000 per year in each scenario used the average emissions per
and the monetary value of a restricted activity day MW of energy generated from coal, multiplied by the coal
(reduced productivity) was assumed to be R633. Mercury capacity.
Table 1: Health effects,
Code Indicator Health Effect (Disease) Baseline Relative Cost per related indicator pollut-
Pollutant Incidence Risk (Ratio) Case (Rand) ants, baseline incidence,
exposure–response
(% or no.) functions and health care
costs used in the health
HO_01 PM Diabetes mellitus mortality 0.045 % 1.13 12 000 000 impact model
Source: own
HO_02 PM Cerebrovascular mortality 0.041 % 1.11 12 000 000
HO_03 SO2 Respiratory mortality 0.076 % 1.0106 12 000 000
HO_04 NO2 Cardiovascular mortality 0.174 % 1.0206 12 000 000
HO_05 PM Respiratory hospital 0.620 % 1.013 11 513
admissions
HO_06 PM Cardiac hospital admissions 0.860 % 1.013 23 869
HO_07 PM Restricted activity days 19 1.09 633
Each health effect was attributed to an individual would result in double accounting of health impacts as
indicator pollutant. While health effects can be attributed these pollutants are associated with each other.
to many different indicator pollutants, using all indicators
Health Outcome Relative Incidence
3
Figure 11: Exposure–
response functions
2.5 demonstrating relation-
ships between pollutant
2 exposure and disease
incidence
1.5
Source: own
1
0.5
0
0 10 20 30 40 50 60 70 80
Pollutant Concentration (µg/m3)
Diabetes mellitus mortality Cerebrovascular mortality Restricted activity days
Cardiovascular mortality Cardiac hospital admissions
Respiratory mortality Respiratory hospital admissions
17COBENEFITS Study South Africa
3. The status quo: high health-related
costs from the power sector
Health costs associated with coal power generation will mercury – however, mercury damage accounted for up
continue to rise until 2022, ranging from R13 billion to 5 % of health costs in the present study. This means
(lower estimate) to 45 billion (upper estimate) in 2022 that health impact assessments are highly sensitive to
alone, a trend shown by all energy generation scenarios the estimated cost of mercury damage and to the value
(see figure 12 and figure 13). In 2018, Eskom generated of a statistical life (VSL) employed. From 2021, the
about 215 TWh of electricity, at an estimated health cost estimated health cost trajectories change across the
of R11 – 30 billion. Accordingly, the health cost exter- four scenarios. This is attributed to certain exogenous
nalities of Eskom’s power plants are within the range factors, such as the gradual decommissioning of coal
Rand 5 – 15 cents per kWh. This high cost is due to power plants across the country, the share of renewable
South Africa’s overwhelming dependence on coal-fired sources in the energy mix (and the pace at which they
power plants for power generation. The study shows are added), the introduction of peaking power plants
that, independent of the applied dispersion models (gas power plants), and declining dependence on coal
(shown in figure 13), around 27% of health costs are due as a major fuel source for power generation.
to restricted activity days. Most studies do not model
50 higher estimate Figure 12: Health
costs from the power
sector across all scenarios
Annual health costs per scenario
40 between years 2019 and
2050 (higher estimate
case)
(billion Rand)
30 Source: own
20
10
0
2019 2024 2029 2034 2039 2044 2049
IRP 2016 IRP 2018 DEA_RD CSIR_LC
15 lower estimate Figure 13: Health
costs associated with
the power sector across
Annual health costs per scenario
Restricted activity days Cardiovascular mortality
12 all scenarios between
Diabetes mellitus Respiratory mortality 2019 – years 2019 and 2050,
2021 with the shares of
Cerebrovascular mortality Mercury damage
(billion Rand)
“disease” burden from
9 the year 2019 to 2021
Cardiac- related hospital admissions
(lower estimate case)
6 Source: own
3
0
2019 2024 2029 2034 2039 2044 2049
IRP 2016 IRP 2018 DEA_RD CSIR_LC
18Improving health and reducing costs through renewable energy in South Africa
3.1 IRP 2018, defining the pathway to a (lower estimate) by the year 2035. For the year 2050, the
power sector with reduced negative health cost savings amount to R168 billion and R48 billion
health externalities respectively. Decommissioning of Eskom’s oldest and
dirtiest coal-fired power plants in the 2020s will
The IRP 2018 scenario, which closely mirrors the CSIR contribute to bringing down health costs in the nearer
least cost scenario in its trajectory from the year 2021 future to around R5 – 18 billion by 2030 (compared to peak
until 2050, shows a steady decline in health costs costs ranging from R13 to 45 billion in 2022). Health costs
associated with the power sector. This decline is a result in the IRP 2016 scenario do not decline further post-2030,
of the increased share of renewable energy sources in the as shown in figure 14. This non-decline can be attributed
energy mix, including a combined solar PV and wind to the continued dependence on coal as a fuel for power
installed capacity of 12 GW between 2025 and 2030. By generation (despite the introduction of nuclear in the
scaling up renewables in IRP 2018 in comparison to IRP energy mix) in this scenario, as well as the stagnated
2016, South Africa by the year 2050 will have cut health increase in the share of renewables in the energy mix
costs from the power sector by 25 % (see figure 14 and 15). (despite the system’s capacity to accommodate a higher
In absolute terms, health costs will be reduced by as much share of renewables, justified by the revised IRP 2018
as R12.7 billion (upper estimate) and at least R3.8 billion scenario).
Annual health costs per scenario
20 Figure 14: Annual
health cost trend
16 (deviation) between
(billion Rand)
IRP 2018 and IRP 2016
12 between years 2030
and 2050 (higher
estimate case)
8
Source: own
4
0
2030 2035 2040 2045 2050
IRP 2016 IRP 2018
Annual health costs per scenario
10 Figure 15:Annual
health cost trend
8 (deviation) between
(billion Rand)
IRP 2018 and IRP 2016
6 between years 2030
and 2050 (lower
estimate case)
4
Source: own
2
0
2030 2035 2040 2045 2050
IRP 2016 IRP 2018
3.2 Surpassing IRP 2018’s limitations Rapid Decarbonisation (DEA_RD) scenario provides
through the DEA Rapid evidence that “more” can still be done and even greater
Decarbonisation scenario health benefits can be achieved. By following DEA’s
Rapid Decarbonisation pathway, the health costs
Although IRP 2018 shows extensive health benefits by associated with the power sector can be cut by an
steadily decarbonising the power sector by shifting to additional 10 % as soon as the year 2035; by the year
renewable energy over the scenario horizon, the DEA 2050, additional cost savings would amount to almost
19COBENEFITS Study South Africa
20 %. In monetary terms, additional savings of up to R50 introducing RE (especially wind and solar PV) as major
billion (upper estimate) and at least R14 billion (lower sources in the power mix, as well as replacing (and
estimate) can be achieved by the year 2030 in offsetting) more coal power plants with installed RE
comparison to IRP 2018. For the year 2050 the health sources (accounting for more than 70 % of production
cost savings amount to R101 billion and R28 billion share by 2050); although peaking plants are introduced
respectively. The rapid reduction in health costs from by 2021 to ensure that the flexibility, reliability and
the power sector under the DEA_RD scenario in adequacy requirements of the power system are
comparison to IRP 2018 (figure 16 vs figure 17) can be maintained.
mainly attributed to the earlier and faster pace of
12
Figure 16: Lower estimate
cost for each disease
incidence (or ailment)
Annual health costs
9 from 2025 until 2050 for
the DEA_RD scenario
(billion Rand)
(further ambitious efforts
could deliver net-zero
6 health costs before 2045)
Source: own
3
0
2025 2030 2035 2040 2045 2050
Mercury damage Restricted activity days Cardiac- related hospital admissions
Respiratory-related hospital admissions Cardiovascular mortality
Respiratory mortality Cerebrovascular mortality Diabetes mellitus
12
Figure 17: Lower estimate
cost for each disease
incident (or ailment) from
Annual health costs
9 2025 until 2050 for the
IRP 2018 (by 2050 the
(billion Rand)
health costs from the
power sector still exceed
6 R1 billion)
Source: own
3
0
2025 2030 2035 2040 2045 2050
Mercury damage Restricted activity days Cardiac- related hospital admissions
Respiratory-related hospital admissions Cardiovascular mortality
Respiratory mortality Cerebrovascular mortality Diabetes mellitus
Given that the DEA_RD pathway also includes coal power sector having net-zero health costs for metrics
power generation beyond 2050, health costs could be such as restricted activity days, cardio-related diseases
further reduced through a scenario that phases out coal and mercury damage, amongst others.
power before 2050. This could ultimately result in the
20Improving health and reducing costs through renewable energy in South Africa
4. Creating an enabling environment to
improve health and save costs
Impulses for furthering the debate
This COBENEFITS study has quantified the potential coal-fired power stations produced more than 202,106
for South Africa to significantly improve the health of GWh of energy in FY2017/18. At an estimated total
its people and reduce related costs by decarbonising health cost of R11–30 billion in 2018, this equates to a
the power sector. With its decision to progress its health cost externality of Rand 5–15 cents per kWh.
energy policy from IRP 2016 to IRP 2018, thereby These health cost externalities should be considered in
accelerating the decarbonisation of its electricity power sector planning.
supply, South Africa is set to cut health costs from the
power sector by 25% by the year 2050. This study has In addition, the locations of power plants need to be
also shown how, by following (or even going beyond) considered. Power plants that affect more densely
DEA’s Rapid Decarbonisation pathway, during the populated areas create higher costs for society as a
same period an additional 20% can be cut from the whole. Fortunately, in South Africa, the majority of the
health costs associated with the power sector, potential health impacts of power stations are reduced
amounting to as much as R100 billion in absolute due to their distance from major population centres.
savings. However, health costs would increase with the growth
of populations close to these fossil-fuelled power
What can government agencies and political stations.
decision makers do to create a suitable
enabling environment to maximise the health Finally, the emissions from individual power plants
of the South African people and to unburden should be considered when planning the phase-out of
the health system? these existing coal-fired plants. Older power plants
usually have higher emissions than those that employ
How can other stakeholders harness the newer technologies. This way, the phase-out
social and economic co-benefits of building programme in line with the economic lifetime of
a low-carbon, renewable energy system existing power plants already implicitly takes emission
while facilitating a just energy transition? intensity into account. However, there might be cases
where individual power plants should be
Building on the study results and the surrounding decommissioned earlier due to their specific emissions
discussions with political partners and knowledge (or proximity to highly populated areas).
partners, we propose to direct the debate in three areas
where policy and regulations could be put in place or Enforcement of Air Quality Act
enforced in order to reduce air pollution from coal-fired (emission standards) and potential
power plants within the shift to a less carbon-intensive retro-fitting of existing coal power
power sector: plants
Integrate health externalities of coal into power Over the past decades, South Africa has elaborated a very
sector planning sophisticated regulatory framework for air quality,
starting with the Air Quality Act of 2004. As part of this
Enforcement of Air Quality Act (emission standards) framework, emission limits for the power sector were
and potential retro-fitting of existing coal-powered defined for the year 2015 and even stricter limits for the
plants year 2020. However, Eskom and other industries have
applied for postponement, since they were unable to
Ensure better data availability for health cost comply with the existing regulation for the year 2015 and
assessments will likely be unable to comply with the even stricter
limits proposed for 2020. Consequently, air quality in the
Integrate health externalities of coal Highveld, which contains most of South Africa’s coal-
into power sector planning fired power stations, often fails to meet National Ambient
Air Quality Standards (NAAQS) (DEA, 2009 and 2012).
This study has quantified the health costs related to
coal-fired power generation in South Africa. Eskom’s According to the latest DEA regulation:
21You can also read