Progress in Peril JANUARY 2020 @COHealthSurvey - Colorado Health Institute
←
→
Page content transcription
If your browser does not render page correctly, please read the page content below

Progress
in Peril
2019 COLORADO HEALTH ACCESS SURVEY STORYBOOK

                            JANUARY 2020 @COHealthSurvey
Colorado Health Access Survey (CHAS) 2019 Storybook Acknowledgments
                            Colorado Health Institute (CHI) staff members contributing to this report:

                     Jeff Bontrager, Principal Investigator                 Jasmine Bains, Data Analyst
                            Eli Boone, Project Leader                       Emily Johnson, Data Analyst
                    Rebecca Silvernale, Lead Data Analyst                        Chrissy Esposito
                      Jackie Zubrzycki, Editor and Writer                            Cliff Foster
                          Joe Hanel, Editor and Writer                              Jalyn Ingalls
                             Kristi Arellano, Editor                               Michele Lueck
                                                                                   Alec Williams
                             Brian Clark, Designer
                                                                               Lindsey Whittington

          CHI thanks The Colorado Trust and The Colorado Health Foundation, two foundations
                dedicated to achieving health equity, for their ongoing support of this survey.

           Special thanks to the Colorado Department of Health Care Policy and Financing and
         the Colorado Office of Behavioral Health for their sponsorship of items on the 2019 survey.

                 Finally, we thank the many advisors and stakeholders who provided thoughts,
                         ideas, and guidance throughout the survey development process.

                                       The CHAS: Online and Interactive
        CHAS data are available in a number of formats to make them as useful as possible.
    Coloradohealthinstitute.org hosts data from the CHAS as well as a library of analysis.
    The data section features Excel workbooks with data at the regional level, based on the
    state’s 21 Health Statistics Regions (HSRs). Users can explore in detail how Coloradans are
    doing on health coverage, access, and status in their own regions and compare these data
    to other regions and the state average.                                                               Follow the CHAS
                                                                                                             on Twitter
    Workbooks with in-depth data broken down by race/ethnicity, income, education, gender,               @COHealthSurvey
    and insurance are available now.

                       coloradohealthinstitute.org • #2019CHAS

                     The CHAS is fielded, analyzed and managed by the Colorado Health Institute.
                                      CHI contracts with SSRS to conduct the survey.
            The survey is primarily funded by The Colorado Trust and The Colorado Health Foundation.
                Please contact Jeff Bontrager at bontragerj@coloradohealthinstitute.org
                    for information on sponsorship opportunities for the 2021 CHAS.
2                                                                                                          Colorado Health Institute
2019 COLORADO HEALTH ACCESS SURVEY

                                         CONT E NTS

 4      CHAS: A Primer                               HE ALT H I N S URAN C E COV E R AG E
 5      Introduction                                 16 Trends in Coverage and Churn
 6      Progress in Peril: Top Storylines            18 The Uninsured
                                                     22 Affordability

 SO CIAL FACTORS                                     ACC E S S TO C ARE
 8      Food Insecurity                              24 Use of Health Care
 10     Housing and Health                           25 Views on the Health Care System
 11     Unfair Treatment and Stress                  26 Barriers to Care

                                                     HE ALT H OF ALL CO LORA DA N S
 B EHAVIOR AL H EALTH
                                                     27 General Health
 12     Substance Use                                28 Oral Health
 13     Mental Health                                29 Aging and Advance Directives

                                    STORI E S O F T HE C HAS

F O OD :                    M EN TAL HEALTH:         COVERAGE:                  SU RPRISE B ILL S :
Nearly one in five people   Doug McCarthy is a       Staff at Every Child       Ethan Cerrato spent the
in southeastern Colorado    national expert on       Pediatrics say that        first months of his life
went hungry at some         health systems, but      increasing numbers of      in intensive care. The
point in the past year.     even he was at a loss    their young patients are   trauma for his parents
Las Animas nonprofit        when he had to find      uninsured. The CHAS        got even worse when
leaders say the need is     mental health care for   confirms their concerns.   they opened the bill.
increasing. PAGE 9          his son. PAGE 14         PAGE 20                    PAGE 23
                                                                                                           3
THE CHAS: A PRIMER
The Colorado Health Access Survey            Insurance Terminology                              from the CHAS with the experiences of real
— the CHAS — is the premier source of                                                           Coloradans. It also includes data and policy
information about health insurance           Private Insurance                                  insights in several sections.
coverage, access to health care, and         Also known as commercial insurance, this is
use of health care services in Colorado.     insurance provided through an employer or          The data insights aim to highlight data
The CHAS is a biennial survey of more        purchased by an individual.                        points indicating an area in which a
                                                                                                certain population of Coloradans does
than 10,000 households that has been         • Employer-Sponsored Insurance (ESI):              not have an equal opportunity to be as
conducted since 2009.                           Health insurance that is offered through        healthy as possible. These insights focus
The 2019 CHAS was conducted                     an employer. Generally, employees will          largely on disparities evident in the data.
between February 26 and July 14, 2019           pay a portion of the premium price,             Research suggests that systemic, social,
by Social Science Research Solutions            often through a payroll deduction. This         and economic factors, particularly racism,
(SSRS), an independent research                 category includes Tricare and other             have a direct effect on health and access
company. Survey data are weighted               military coverage options.                      to factors that affect health such as
to reflect the demographics and                                                                 transportation and housing. CHI features
                                             • Individual Market: Health insurance
distribution of the state’s population.                                                         these data points in order to inform
                                                purchased by an individual from a broker
The survey was conducted in English                                                             conversations about how to address these
                                                or from an insurance company directly,
and Spanish.                                                                                    disparities and the policies and practices
                                                including student plans.
                                                                                                that have created them.
The 2019 CHAS was administered               Public Insurance
mostly online — a change from the                                                               The policy insights highlight key legislative or
telephone surveys of previous years.         • Medicaid (Health First Colorado): A              private sector actions related to the topic at
                                                federal-state program that provides             hand. These insights offer a timely reminder
Randomly selected households
                                                health insurance to people with low             that Coloradans are actively working to
throughout Colorado received letters
                                                incomes. The term “Medicaid” and the            address many of the challenges identified in
asking them to participate in the
                                                Colorado program’s name, Health First           the CHAS.
survey and directing them to a website
                                                Colorado, were both used in the survey.
or toll-free number to call. A smaller                                                          The CHAS report does not include all
random sample of 1,000 respondents           • Child Health Plan Plus (CHP+): A federal-        possible data from the CHAS. For more
was taken by live interviewers calling          state health insurance program for              information, or to request additional
cell phone and landline numbers, as             children and pregnant women. It is for          data, visit our website or email
in previous years. This enabled the             people who earn too much to qualify             CHAS@coloradohealthinstitute.org.
Colorado Health Institute and SSRS              for Medicaid, but not enough to pay for
to see whether data from the online             private health insurance.                       Other Terminology
survey could be compared to phone-                                                              People who take the Colorado Health Access
based data from previous years. In           • Medicare: The federal health insurance
                                                program for older adults age 65 or              Survey are asked about race, ethnicity, gender,
most cases, the methodology change                                                              sexual orientation, and gender identity. This
appears to have had no effect on                older and people with disabilities. Most
                                                everyone in those categories qualifies for      section includes an explanation of some terms
respondents’ answers to specific                                                                used in this report.
questions.                                      Medicare, regardless of income or assets.
                                             Other Insurance                                    Race and ethnicity
New questions were added to the                                                                 Racial categories in the CHAS are: black or
2019 survey to explore the interaction       This category includes Railroad Retirement
                                             Plans and anyone who selected “other.”             African American, white, Native Hawaiian
of health and social factors such as                                                            or other Pacific Islander, American Indian or
housing and food security. Other new         Uninsured                                          Alaska Native, Hispanic, or some other race.
questions focused on the perception of                                                          Separately, the survey asks about Hispanic
                                             This category includes people who indicate
unfair treatment in the medical system       they have no insurance or reported                 or Latino ethnicity. Data are analyzed using
and the effects of substance use on          Indian Health Service as their sole form of        racial/ethnic groupings such as black (non-
Coloradans.                                  coverage. It also includes other self-reported     Hispanic/Latinx). Latinx is a gender-neutral
                                             sources not considered to be comprehensive         word used to describe people of Latin
Statistically Speaking                       coverage, such as health care sharing              American cultural or racial identity.
CHI identifies changes that have             ministries.                                        Gender
statistical significance, meaning that it
is relatively certain they are not due to    Federal Poverty Level                              Gender categories in the CHAS are: male/boy,
chance alone. Small differences may          Federal Poverty Level (FPL): The U.S.              female/girl, or other/different gender identity.
result from random coincidence in who        Department of Health and Human                     Gender identity
was surveyed rather than indicating          Services sets poverty guidelines to use for
                                             administrative purposes such as determining        CHAS respondents are asked if they consider
a change in Colorado’s population as                                                            themselves to be transgender. CHAS analysis
a whole. If there is at least a 5 percent    eligibility for programs like Medicaid. In 2019,
                                             the FPL is $12,490 for a single person and         uses the terms transgender and cisgender,
chance that a result is coincidental,                                                           respectively, to describe individuals whose
it is not considered to be significant.      $25,750 for a family of four.
                                                                                                gender identities do and do not differ from
For example, while the 2015 uninsured                                                           the sex they were assigned at birth.
rate was 6.7 percent and the 2019            Reading This Report
uninsured rate is 6.5 percent, this is not   This CHAS report includes highlights of            In some cases, the number of people
a significant difference, so the rates are   data organized by category. For the first          reporting a certain identity is too small to
described as essentially unchanged.          time, it features four stories pairing data        provide sufficient sample for analyses.

4                                                                                                                         Colorado Health Institute
2019 COLORADO HEALTH ACCESS SURVEY

COLORADO HEALTH ACCESS SURVEY 2019

  Colorado has made great strides in improving
 access to health care for its residents. But moving
      into the 2020s, that progress is in peril.
 Nutritious food and housing are fundamental          communities, and protecting consumers from
 to health. Yet one in 10 Coloradans don’t get        high medical bills. The 2019 CHAS includes data
 enough to eat, and one in 15 worry about having      about these emerging topics.
 a place to live.
                                                      But the survey also makes clear that insurance
 Even with a historically strong economy, the         coverage and access to health care still require
 state’s uninsured rate of 6.5 percent has not        attention. More Coloradans are having trouble
 budged since 2015.                                   paying their medical bills, and growing numbers
                                                      can’t get an appointment when they need one.
 The consequences of substance use are felt
 by many Coloradans. An estimated 206,000             And 18,000 more children, most of whom
 residents of the state have had a loved one die of   are Hispanic or Latinx, were uninsured in
 an opioid overdose.                                  2019 than in 2017, likely due to a combination
                                                      of administrative changes and changes to
 The 2019 Colorado Health Access Survey (CHAS)        immigration policy and rhetoric that have made
 offers insight into these and other issues that      families wary of signing up for coverage. At the
 affect the health of Coloradans.                     same time, the percentage of people covered by
                                                      Medicaid has declined for the first time since key
 Much has changed since 2009, when the first          provisions of the ACA were implemented.
 survey findings were released. At the time,
 Congress was debating the Affordable Care            For the first time, this survey report includes
 Act (ACA), and the overriding policy goal was to     personal stories of Coloradans directly affected
 expand access to care by getting more people         by food insecurity, access to mental health care,
 insured.                                             surprise bills, and loss of insurance coverage.
 Today, the health policy focus has shifted to        The findings from the 2019 CHAS are a call for
 creating a more equitable system, addressing         vigilance and attention. The work of ensuring
 the social factors that influence health, coping     all Coloradans have the opportunity to be as
 with the toll of substance use on people and their   healthy as possible is far from over.

                                                                                                           5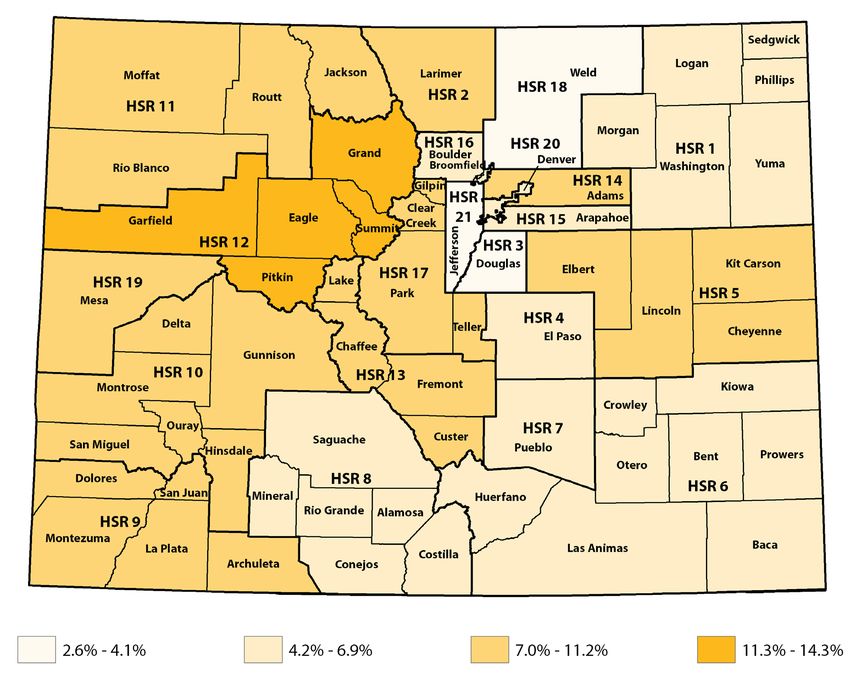
Progress in Peril
          The 2019 CHAS sheds new light on the health of Coloradans and
        the stories behind the statistics. While there has been little change in
        the state’s uninsured rate, Colorado has lost ground on affordability
         of insurance and coverage for children. New analysis shows many
      Coloradans are struggling to afford housing, food, and medical care,
    all of which can affect health. This all points to work that must be done to
     secure the gains of the past decade and build a more equitable system.

                                     TOP STO RY LIN E S

                         Poverty and Health
                         When people’s incomes are too low to afford necessities such as food or utilities,
                         their health is profoundly affected. Coloradans with incomes below the federal
                         poverty level are twice as likely as other Coloradans to report fair or poor health
                         (26.7 percent, compared with 13.0 percent of those with higher incomes).

        Housing, Food, and Health
        New CHAS data show that there is a strong connection between
        housing and food security and health. People experiencing unstable
        housing or who have not been able to afford food are three times as
        likely to report poor general, mental, and oral health.

                               Fair Treatment
                               Most Colorado adults say they are treated fairly by the medical system.
                               Yet nearly one in six (15.1 percent) say that they are sometimes or often
                               treated unfairly when getting medical care. Race, ethnicity, age, and
                               gender are a few of the reasons people believe they were treated
                               unfairly. Most of those who report unfair treatment said that the
                               experience caused stress, which can negatively affect health.
6                                                                                                Colorado Health Institute
2019 COLORADO HEALTH ACCESS SURVEY

                            Stuck at 6.5
     6.5%                   Colorado’s uninsured rate remains at 6.5 percent — statistically unchanged
                            since the 2015 survey, the first after the ACA took effect. The lack of
                            improvement is striking, considering a historically strong economy.
                            Colorado did see slight growth in job-based insurance in 2019.

More Hispanic/Latinx Children Uninsured
Two years ago, Colorado had insured 97 percent of its children. But that progress
has started to reverse, particularly for Hispanic and Latinx children. Their
uninsured rate tripled from 2.4 percent in 2017 to 7.9 percent in 2019.

                            Backsliding on Affordability
                            The share of Coloradans struggling to pay medical bills has climbed
                            back to its pre-ACA level of 18.1 percent. Meanwhile, 30.6 percent of
                            Coloradans received a surprise medical bill in the past year.

Mental Health
In 2019, 15.3 percent of Coloradans reported poor mental health,
compared with 11.8 percent in 2017. The increase could signal worsening
mental health — and an increased willingness to talk about it.

                            Toll of Drugs and Alcohol
                            More than 1 million Colorado adults (26.9 percent)
                            say that they, a loved one, or a close friend has been
                            addicted to alcohol or drugs in their lifetime.

Use of Care
Most Coloradans — 81.1 percent — report visiting a general doctor in the past year.
Nearly three-quarters of Coloradans (73.6 percent) visited the dentist or dental
hygienist in the past year — an encouraging increase over the past decade.

                                                                                                           7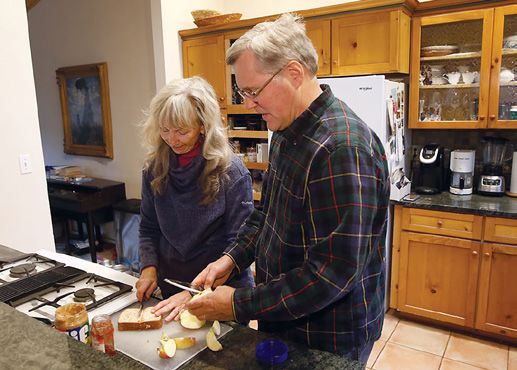
SOCIAL FACTORS

Food Insecurity
A healthy and balanced diet is a critical component of             to overall health, and the data back this up — 37.5
a healthy life, but many Coloradans struggle to afford             percent of Coloradans experiencing food insecurity
food. Nearly one in 10 Coloradans (9.6 percent) ate                report fair or poor health, compared with 11.9 percent
less than they felt they should in the past year because           of other Coloradans. Food insecurity is especially
there wasn’t enough money for food. Providers and                  prevalent in rural areas where many people have
researchers are becoming increasingly aware of how                 lower incomes and are less likely to have quick access
important these types of social determinants can be                to multiple grocery stores.

Food Insecurity Is More Common in Rural Colorado
Percentage of respondents who ate less than they felt they should because there
wasn’t enough money for food in the past year, 2019

                                                                                        Young Adults Are the Most
                                                                                        Likely to Be Food Insecure
                                                                                        Percentage of respondents who ate
                                                                                        less than they felt they should because
                                                                                        there wasn’t enough money for food
                                                                                        in the past year by age group, 2019

                                                                                         Ages
                                                                                         0-18    3.7%
                                                                                         Ages
                                                                                         19-29                       16.3%
                                                                                        Ages
                                                                                        30-49                    14.5%
                                                                                        Ages
                                                                                        50-64             9.3%

                                                                                         Ages
                                                                                         65+            7.2%

                                                                                                 0%               10%               20%

One in Five Coloradans in Poverty             20%
Experience Food Insecurity                             19.1%          18.8%
Percentage of respondents who ate             10%
                                                                                    12.1%
less than they felt they should because                                                               9.0%                3.6%
there wasn’t enough money for food in          0%
                                                     At or Below      101-200%      201-300%          301-400%          More Than
the past year by income, 2019                         100% FPL           FPL           FPL               FPL            400% FPL

          INSI GHT
P O L ICY: New private and public efforts are focused on addressing hunger             DATA: More than one in nine
throughout the state. Increased access to healthy food is part of Governor Polis’      rural residents (11.7 percent) say they
Roadmap to Save Coloradans Money on Health Care, and the Colorado Health               experience food insecurity, compared
Foundation is investing in the Colorado Blueprint to End Hunger, an effort led by      with closer to one in 11 residents of
a statewide coalition dedicated to ensuring all Coloradans have enough to eat.         urban areas (9.3 percent).

8                                                                                                              Colorado Health Institute
2019 COLORADO HEALTH ACCESS SURVEY

STORI ES O F T H E C H AS

Hunger Is a Pressing Need in
Many Colorado Communities
Las Animas Helping Hands has
served as an “on-call” food
pantry for more than a decade,
providing the people of Bent
County in southeast Colorado
with emergency food supplies
whenever a resident reached out
to them.
“Every week, there’s someone who
ate their last can of green beans
the night before,” said Sharon
Barber, the nonprofit’s founder.
But increased demand for the
pantry’s services caused the
organization to revamp its
approach in the summer of 2019,
establishing regular Monday
hours in a garage behind the
                                                                                                         CARE AND SHARE FOOD BANK
courthouse so residents could        Volunteers in Bent County prepare to distribute food.
more easily drop in.
“The need was so high that we        report food insecurity.                           may avoid using government-
had to make a change,” Sharon                                                          funded food programs out of fear
said, noting that the pantry now     Shannon Brice, the chief                          that the use might affect their
serves around 700 people a           operating officer at Care and                     immigration status.
month.                               Share, the food bank that serves
                                     southern Colorado, said that in                   But Shannon pointed out that
But hunger remains a pressing        rural areas such as Bent County,                  hunger is not unique to rural
need in the community. The           many people struggle to afford                    areas. Pueblo County, home to
Colorado Health Access Survey        food. There are sometimes                         southeast Colorado’s largest
(CHAS) found that 18.1 percent of    physical barriers to accessing                    city, has the highest rate of food
residents in southeast Colorado      food: The nearest grocery store                   insecurity in the state: 19.1 percent.
had eaten less than they should      may be far away. There is often                   A grocery store that had long
because there wasn’t enough          stigma around using food                          been a community staple in the
money for food at some point in      pantries, with people avoiding                    east part of the city recently
the last year – about twice the      services because they don’t want                  closed, leaving more people
rate as the state as a whole.        to be seen as taking handouts.                    without an easy way to get the
People who are experiencing food                                                       food they need.
                                     While there are public programs
insecurity are often experiencing    to support people experiencing                    “The geography may look
other challenges that affect their   hunger, such as the Supplemental                  different, but the stories are the
health. According to the CHAS,       Nutrition Assistance Program, or                  same: Families having to make
37.5 percent of those who report     SNAP, not everyone who is eligible                difficult decisions – between food
eating less than they should         is enrolled. Paperwork can be a                   and medicine, or food and health
reported they were in fair or        barrier. Some Coloradans who                      care, food and utilities,” Shannon
poor health, compared to just        are immigrants or who have                        said.
11.9 percent of those who did not    immigrants in their households                                   By Jackie Zubrzycki, CHI

                                                                                                                               9
SOCIAL FACTORS

Housing and Health
Housing is closely linked to wellbeing. The                      compared with 87.7 of those who are not concerned
affordability, stability, quality, and accessibility of          about housing. And the burden is disproportionately
a home all affect a person’s health. But in recent               borne by those with fewer resources. Among
years, Colorado’s booming economy has led to                     Coloradans in poverty, more than one in eight
limited housing supplies and increased housing                   (12.8 percent) are worried about housing stability,
costs, leaving some residents unable to afford their             compared with 2.5 percent of those making more
homes. In 2019, 6.7 percent of Coloradans worried                than 400 percent of the federal poverty level.
that they would not have stable housing in the next              Coloradans who are burdened by cost in one area,
two months. Just 55.9 percent of those who are                   such as housing, often have trouble affording other
concerned about housing reported good health,                    necessities, such as utilities, health care, or food.

Housing Instability Is Not Just an Urban Issue                                     People Facing
Percentage of respondents reporting housing instability, 2019                      Housing
                                                                                   Instability
                                                                                   Report
                                                                                   Worse Health
                                                                                                    Housing             Housing
                                                                                                    Unstable             Stable
                                                                                   Poor
                                                                                   General
                                                                                   Health          44.1%              12.3%
                                                                                   Poor Mental
                                                                                   Health          45.8% 12.5%
                                                                                   Poor Oral
                                                                                   Health          46.8% 16.0%

                                                                                   Of Coloradans Who Reported
                                                                                   Housing Instability ...

                                                                                                  had problems paying
                                                                                       51.9%      for medical care
                                                                                                  Compared with 15.4% who did
                8.4%
                Of rural
                                                           6.4%
                                                           Of urban
                                                                                                  not report housing instability

                Coloradans                                 Coloradans                              had problems
                report housing                             report housing
                insecurity                                 insecurity                  54.2%       paying for food
                                                                                                   Compared with 6.1% who did
                                                                                                   not report housing instability

          INSI GHT
P O L ICY: Increases in the supply of affordable                 DATA: Nearly one in 10 Hispanic/Latinx Coloradans (9.7
housing can decrease rates of housing instability.               percent) worry about having stable housing in the next
House Bill 19-1322 transfers money from the Unclaimed            two months, compared with just 5.9 percent of white
Property Trust Fund to provide affordable housing                (non-Hispanic/Latinx) Coloradans. Denver has among
support for those in need. More legislation related to           the highest rates of displacement due to gentrification of
housing is expected in the 2020 session.                         Hispanic/Latinx Coloradans of any city in the U.S.
10                                                                                                           Colorado Health Institute
2019 COLORADO HEALTH ACCESS SURVEY
Unfair Treatment and Stress
Doctors take an oath to care for all fellow human and race or skin color (17.1 percent). These experiences
beings. Yet nearly one in six Colorado adults (15.1 can have very real impacts on a person’s health.
percent) say they have sometimes or often been More than nine in 10 people (94.0 percent) who have
treated unfairly when getting medical care over their experienced unfair treatment say it caused them some
lifetime. Common reasons these Coloradans believe level of stress. And some Coloradans (5.3 percent)
they were treated unfairly include age (32.6 percent), actually skip care because they’re worried about unfair
disability (21.5 percent) sex or gender (20.9 percent), treatment or the consequences of getting care.
One in Six Colorado Adults Say They Have
Sometimes or Often Experienced Unfair Treatment
Often 3.3%
Sometimes 11.8%
Among Those Who Say They Have
Sometimes or Often Experienced
Rarely 25.5% Unfair Treatment When Getting
Medical Care, Reasons Include ...
32.6% Age
21.5% Disability
20.9% Gender or Sex
17.1% Race or Skin Color
8.9% Sexual Orientation
8.6% Ancestry or National Origin
Never 59.4% 4.2% The Way You Speak English
Young Adults Are the Most Likely to Experience Unfair Treatment Women Are More Likely to Report
Percentage of Colorado adults who have been treated unfairly sometimes or often Unfair Treatment Than Men
when getting medical care by age group, 2019
20%
19.3% 17.9%
10% 18.0% 15.9% 13.8% 11.8% 11.8%
0%
Ages 18-29 Ages 30-39 Ages 40-49 Ages 50-64 Ages 65+
INSI GHT
DATA: A growing body of research links discrimination and stress to negative health outcomes. Further research
documents discrimination or bias against people of color, women, people who identify as lesbian, gay, bisexual,
transgender, or queer, and other groups in the health care system.
11BEHAVIORAL HEALTH
Substance Use
More than 1 million Colorado adults (26.9 a prescription painkiller or heroin overdose. Yet
percent) say that they, a loved one, or a close 95,000 Coloradans said they went without needed
friend has been addicted to alcohol or drugs substance use treatment in 2019. Stigma is a major
in their lifetime. Of these, 44.5 percent say they reason people go without care. Many Coloradans
or a loved one struggled with prescription are not comfortable talking about problems
painkillers or heroin. More than 200,000 adults related to substance use or are concerned about
in Colorado know someone who has died from someone finding out they have a problem.
Stigma on the Rise
95,000 Reasons for not receiving needed substance use treatment
Concerned about the cost of treatment
2017
54.1%
2019
47.7%
Coloradans Did not think health insurance would cover it* 51.0% 52.1%
Said They Needed Concerned about someone finding out you had a problem 43.9% 72.4%
But Did Not Get Services Did not feel comfortable talking about personal problems 41.3% 72.8%
for Substance Use
Disorder Treatment Hard time getting an appointment 20.5% 32.9%
* Asked of currently insured
One in 10 Coloradans Know Someone Who Has Been Addicted to an Opioid
Have You, a Loved One, or a Close Friend Ever ...
Asked of Colorado Adults Ages 18+
Been addicted Been addicted to Even once taken any Received Died from a
to prescription alcohol or drugs drugs by injection with a emergency prescription
painkillers or other than prescription needle like heroin, cocaine, medical treatment painkiller or
heroin painkillers or heroin amphetamines, or steroids due to drug use heroin overdose
11.7% 25.2% 8.5% 7.8% 5.0%
486,425 1,043,661 348,807 322,308 206,291
Coloradans Coloradans Coloradans Coloradans Coloradans
INSI GHT
P O L ICY: Substance use continues DATA: Substance use in Colorado communities hits women especially
to be a major focus for the Colorado hard. Women are almost twice as likely as men to say that they, a loved
legislature. House Bill 18-1136 aims one, or a friend has been addicted to prescription painkillers or heroin
to expand inpatient and residential (14.6 percent of women, compared with 8.4 percent of men). Women
treatment for substance use disorder are also more likely to report that they or someone they know has taken
starting in July 2020 by covering it as prescription painkillers or heroin, taken any drugs by injection with a needle,
part of the Medicaid benefit package. or received emergency medical treatment due to drug use.
12 Colorado Health Institute2019 COLORADO HEALTH ACCESS SURVEY
Mental Health
More Coloradans are reporting poor mental care were more likely than in prior years to report
health, and fewer are getting the care they need. barriers related to stigma and lack of coverage.
In 2019, 15.3 percent of Coloradans report poor While the overall affordability of health care and
mental health, compared with 11.8 percent in 2017. modern stressors such as social media and political
More than one in 10 Coloradans (13.5 percent) say rhetoric all likely contribute to poor mental health,
they did not get needed mental health care in the it is also possible that efforts to raise awareness
past year, compared with 7.6 percent two years of mental health issues have resulted in more
ago. Those who did not get needed mental health Coloradans recognizing that they need care.
Coloradans Increasingly
47.3%
Report Poor Mental Health
Percentage who had eight or
of Coloradans
more days of poor mental health said stigma*
in the past month
was the reason they did not
2015: 9.9% receive needed services. This is
an increase from 38.0% in 2017.
2017: 11.8% * Discomfort talking about personal problems or concern someone will find out.
Cost and Coverage Are the Largest Barriers for
2019: 15.3% Those Who Didn’t Get Needed Mental Health Care
100%
Coloradans Seek Mental 83.0%
Health Care From Primary 80%
Care Providers 61.1%
60%
Percentage who talked with a 53.8%
provider about mental health, 43.5%
by provider type, 2019 40% 38.2%
31.3%
20%
0%
Primary Care Mental Health 2013 2015 2017 2019
Provider: Specialist: n Uninsured* n Concerned about the cost of treatment n Did not think health insurance would cover it**
18.5% 16.0% n Hard time getting an appointment n Don’t feel comfortable talking about personal problems
Many clinics have taken steps to integrate n Concerned about someone finding out you have a problem
primary and behavioral health care. *
Asked of those uninsured in past year Asked of currently insured
**
I NSI GHT
P O L ICY: House Bill 19-1269, the DATA: Coloradans who identify as transgender experience higher rates of
Behavioral Health Care Coverage poor mental health. More than half of adult respondents who identified as
Modernization Act, strengthened transgender (54.3 percent) reported poor mental health in the past month,
state requirements for insurance compared with 15.7 percent of cisgender Coloradans (those whose gender
coverage of mental health and identity matches the sex they were assigned at birth). This may reflect
substance use care. discrimination and social strain that this community endures.
13BEHAVIORAL HEALTH
STO RI ES O F T H E C H AS
Shortcoming
in the System
Mental Health Access Proves
to Be a Complicated Question
Doug and Susan McCarthy knew shocked to learn the crisis line
they were in for a challenge didn’t have services for children,
when they adopted a baby 12 and he was told to call the police
years ago. instead.
“We decided
The boy had experienced Although officers addressed
trauma in the womb, and his the immediate crisis, police we can’t
mother did not receive good intervention traumatized the
prenatal care. family, and the episode shifted
depend on this
But no one prepared the
their thinking about the mental system. It’s not
health care they had been
Durango couple for the seeking. going to work.
difficulty of finding appropriate
mental health care for their “We decided we can’t depend We had to
son, who started having social
and emotional troubles in
on this system. It’s not going to
work. We had to take matters
take matters
elementary school. He’s among into our own hands,” Doug said. into our own
the 100,000 children (ages 0-18)
who experience poor mental Those are striking words, hands.”
health, according to the CHAS. considering his job. He’s an
expert on health system reform Doug McCarthy
After a long hunt for a at the Commonwealth Fund, a
provider, the McCarthys found national foundation.
a psychiatrist who worked
with the school to develop The McCarthys hired an
educational consultant, who about the people who don’t
an individualized education
found a therapeutic boarding have the same resources,” Doug
program. Things were going
school. Their son is there now, said.
well.
and he is doing well. The
The CHAS asks why Coloradans
“But it all sort of fell apart when students work with animals and
did not receive mental health
we moved to transition to middle tend to their own garden plots.
care if they needed it, and they
school,” Doug said.
“I’m glad we have the resources can select from a list of reasons
One morning in 2018, Doug had to pay for this, although it’s that include cost and stigma. In
to call a crisis hotline because going to mean we don’t have Doug’s view, what’s needed is
of the boy’s behavior. He was much of a retirement. I think more support for parents and
14 Colorado Health Institute2019 COLORADO HEALTH ACCESS SURVEY
JERRY McBRIDE/THE DURANGO HERALD
Doug and Susan McCarthy’s experiences seeking mental health care for their child led them to believe there is a need for more support for
parents and children.
children starting in infancy, better Their needs stretched far beyond the need for systems reform.
identification of kids with mental the medical system into schools,
health needs earlier in life, and law enforcement, and social “The system is all of us, and we’re
more access to mental health services — systems that are not all part of the system. It’s not
specialists. set up to deal with the state’s something ‘they’ are going to do
increasingly prevalent mental for us,” he said. “It’s like back in the
The McCarthy family’s story health issues. olden days. You have to create the
shows the nuance and complexity community you want to live in.”
behind multiple-choice answers. More than ever, Doug appreciates By Joe Hanel, CHI
15HEALTH INSURANCE COVERAGE
Trends in Coverage and Churn
Since 2015, Colorado’s insured rate has remained churn when someone changes jobs —more than half
consistent: About 93.5 percent of Coloradans have of Coloradans (53.0 percent) who switched insurers
health insurance coverage. However, this consistency or lost coverage said it was because they lost prior
masks some instability in the health insurance employer coverage. Notably, for the first time since
market. One in six Coloradans (17.3 percent) lost, 2013, the percentage of Coloradans with employer-
switched, or gained coverage in the past year. sponsored insurance increased. This growth may
Coloradans experiencing this “churn” may struggle reflect the improving economy, with more employers
with care continuity and financial stability. Reliance offering insurance or more employees buying into
on an employer for coverage can increase the risk of their company plans.
Colorado Hit a Record-Low Uninsured Rate After ACA Implementation
Colorado uninsured rate, 2009-2019
20%
15%
2011
2009 2013
10%
13.5% 15.8% 14.3%
5% 2015 2017 2019
0%
6.7% 6.5% 6.5%
Employer-Sponsored Insurance Covers More Than Half of Coloradans Again; Medicaid Coverage Drops
n Employer-Sponsored n Medicare n Medicaid n CHP+ n Individual Insurance n Other Insurance n Uninsured
1.2% 0.1%
2019 52.7% 13.8% 18.7% 7.0% 6.5%
1.1% 0.7%
2017 49.4% 14.4% 19.9% 8.1% 6.5%
1.4% 0.5%
2015 50.9% 12.9% 19.9% 7.7% 6.7%
1.2% 0.8%
2013 52.6% 11.4% 11.6% 8.2% 14.3%
0.9% 0.8%
201 1 51.1% 11.4% 12.2% 7.7% 15.8%
1.3% 1.5%
2009 57.7% 9.7% 9.1% 7.3% 13.5%
16 Colorado Health Institute2019 COLORADO HEALTH ACCESS SURVEY
Since key provisions of the ACA took effect in 2014, the
largest gains in coverage have happened within the
public sphere — specifically Medicaid, which covered One in Six
Coloradans
one in 10 Coloradans prior to ACA implementation
and now covers nearly one in five (18.7 percent). While Experienced
Insurance Churn
17.3%
the ACA also sought to expand coverage within the
individual market, rates of individual insurance held in the Past Year
steady after its implementation at around 7 to 8
percent. The growth in public insurance impacted the
lowest-income Coloradans the most. People whose Of the 17.3% Who Experienced Insurance Churn ...
income was at or below the federal poverty level had Lost Lost Found Were no
an uninsured rate of 21.7 percent prior to 2014, and prior prior plan more longer able
now have an uninsured rate of 8.2 percent. Still, this employer other suited to to afford
coverage coverage your needs coverage
population is about twice as likely to be uninsured as
those with incomes at or above 400 percent of the 53.0% 16.1% 16.8% 2.6%
federal poverty level. And Coloradans with incomes at 409,000 124,000 130,000 20,000
201 to 300 percent of the poverty level, who have low Coloradans Coloradans Coloradans Coloradans
incomes but are not quite eligible for Medicaid, saw
their uninsured rate nearly double in recent years.
Low-Income Coloradans Are Less Likely To Be Uninsured Than Ever, but Disparities Remain
Uninsured rate by income, 2009-2019
2009 2011 2013 2015 2017 2019
30%
28.5%
28.3%
27.2%
26.3%
23.8%
20%
21.7%
19.7%
19.6%
18.2%
12.6%
12.2%
11.8%
10%
11.5%
10.6%
9.9%
9.7%
9.1 %
8.6%
8.1 %
8.2%
8.1%
6.4%
6.6%
6.2%
5.8%
5.3%
4.9%
4.0%
4.1%
3.1%
0%
At or Below 101% ‑ 201% ‑ 301% ‑ More Than
100% FPL 200% FPL 300% FPL 400% FPL 400% FPL
INSI GHT
P O L ICY: Health care is at the forefront of the 2020 DATA: One in 10 Hispanic/Latinx Coloradans (10.2 percent)
presidential debate. Democratic candidates have are uninsured. This is a steep drop from 27.6 percent in 2009
offered an array of options to expand coverage while but remains significantly higher than the uninsured rate
the Trump administration is challenging many aspects of most other racial or ethnic groups in the state, due to a
of the ACA. The 2021 CHAS may provide fresh insights complex set of historic and socioeconomic factors and, in
into a vastly changed federal health policy landscape. some cases, immigration policy and practice.
17HEALTH INSURANCE COVERAGE
The Uninsured
Colorado’s uninsured rate remains steady at 6.5 26. Coloradans with incomes between 139 and 400
percent. But the uninsured rate varies across the percent of the federal poverty level are more likely to
state, from 2.6 percent in Jefferson County to be uninsured than those with lower incomes, most
14.3 percent in the I-70 mountain corridor, where of whom are eligible for Medicaid, and those with
insurance premiums are most expensive. Policy also higher incomes. Not all ACA programs, including
plays a role in insurance rates. For instance, while Medicaid expansion, are available to all non-citizens.
young adults in their twenties (sometimes referred to For example, immigrants without documentation
as “young invincibles”) are often perceived as more and non-citizens who have lived in the U.S. for less
likely to be uninsured, Coloradans in their thirties than five years don’t qualify for Medicaid coverage,
and forties are actually more likely to go without regardless of income. One in four non-citizens (27.1
coverage in 2019. This may be because young people percent) are uninsured, compared with one in 20
can stay on their parents’ insurance plans until age citizens (5.8 percent).
Mountain Regions Have Highest Uninsured Rates 2019 Uninsured Rates by Region
Uninsured rate, 2019 Health Statistics Region Percentage
1 Northeast 6.0%
2 Larimer County 9.7%
3 Douglas County 3.2%
4 El Paso County 5.6%
5 Central Eastern Plains 7.8%
6 Southeast 5.4%
7 Pueblo County 6.3%
8 San Luis Valley 6.0%
9 Southwest 8.6%
10 Gunnison Valley 8.9%
11 Northwest 10.1%
12 I-70 Mountain Corridor 14.3%
13 Upper Arkansas Valley 9.4%
14 Adams County 9.1%
15 Arapahoe County 6.9%
16 Boulder-Broomfield 5.3%
17 Mountain Gateways 11.2%
18 Weld County 4.1%
19 Mesa County 9.2%
20 Denver County 6.1%
21 Jefferson County 2.6%
Colorado 6.5%
INSI GHT
P O L ICY: Summit County has launched Peak Health Alliance, a community health care purchasing
alliance to address high uninsured rates in this region. Its primary goal is to lower the price of insurance
premiums. It will take effect in January 2020.
18 Colorado Health Institute2019 COLORADO HEALTH ACCESS SURVEY
Coloradans in Their Thirties and Forties Have the Highest Uninsured Rates
Uninsured rate by age, 2015-2019 n 2015 n 2017 n 2019
14%
12% 12.9%
12.3%
11.6% 11.5%
10% 10.7%
8% 9.0%
7.5%
6% 6.6%
5.6%
4% 4.3%
2% 2.5% 3.0%
0%
Ages 0-18 Ages 19-29 Ages 30-49 Ages 50-64
Even though the uninsured rate has not changed Medicaid Eligibility Tied to Lower Uninsured Rates
since 2015, people’s reasons for being uninsured for Low-Income Coloradans
have. Cost has always been the biggest barrier to Uninsured rate by income, 2019
coverage in Colorado, but it’s increasing — nearly
14%
nine in 10 uninsured Coloradans (89.6 percent)
cited cost as their reason for not having coverage 12%
in 2019, up from 78.4 percent in 2017. At the same 10%
time, more Coloradans are seeing the need for
coverage than they were two years ago. The
8% 9.6%
percentage of uninsured residents who say they 6%
6.9%
do not need coverage fell from 23.6 percent in 4%
2017 to 12.7 percent in 2019. In recent years, health 2%
4.1%
insurance has been the subject of major federal
0%
policy debates, and this may have increased the At or Below 139%-400% More Than 400%
visibility of health insurance’s benefits. 138% FPL FPL FPL
More People Are Uninsured Because of the Cost of Insurance
Reasons for being uninsured, 2009-2019 2009 2011 2013 2015 2017 2019
Insured family member lost job or changed job 36.7% 39.3% 39.8% 25.7% 35.8% 34.6%
Insured family member no longer part of family 8.5% 8.4% 7.1% 11.9% 7.0% 7.3%
Working family member not offered or not eligible for insurance 41.0% 40.6% 30.3% 29.4% 33.0% 40.0%
Lost eligibility for Medicaid or CHP+ 18.9% 17.4% 17.0% 14.9% 26.4% 29.1%
Traded health insurance for another benefit or higher pay 3.0% 3.0% 5.4% 6.1% 3.5% 5.5%
Cost is too much 88.4% 84.6% 82.0% 82.2% 78.4% 89.6%
Don’t need health insurance 11.1% 13.5% 24.9% 20.8% 23.6% 12.7%
Don’t know how to get insurance 13.8% 17.4% 17.2% 14.1% 14.4% 18.8%
Can’t get health insurance because of a preexisting condition 14.2% 12.5% 6.1% 8.7% 6.8% 5.1%
19HEALTH INSURANCE COVERAGE
STOR I ES O F T H E C H AS
Covering Colorado’s Kids
Drops in Medicaid, Increases in Uninsured Rate Concern Clinics
Anahi Sebastian started noticing
a change in 2017: Fewer patients
at Every Child Pediatrics’ Denver
clinic, where she was lead medical
receptionist, were enrolled in
Medicaid and more were uninsured.
“All of a sudden, our self-pay
increased,” she said.
Anahi’s observations line up with
a trend emerging across Every
Child Pediatrics’ other clinics and
in health care clinics around the
state: In 2019, more children are
uninsured.
Colorado has had a historically
low uninsured rate for residents
between the ages of 0 and 18
in recent years. In 2015, just 2.5
ALEC WILLIAMS/CHI
percent of the state’s children were Anahi Sebastian noticed that more families were uninsured or withdrawing from Medicaid
uninsured, compared with 6.7 while she was the lead medical receptionist at Every Child Pediatrics’ Denver clinic.
percent of all Coloradans.
and administrative burdens for
That rate increased between 2015 government agencies and for
and 2019, however: In 2019, the “We want to create a safe
everyday Coloradans.
CHAS found that 4.3 percent of environment. Just because
children are now uninsured. That you don’t have insurance Clinics and agencies are also
represents about 58,000 kids. At the reporting that people are steering
same time, enrollment in Medicaid
doesn’t mean that we don’t clear of public programs such
has decreased. treat you the same as a as Medicaid because they are
family with insurance.” concerned about consequences
The change was driven by an for themselves or others in their
increase in the uninsured rate Anahi Sebastian, Every Child Pediatrics households who are immigrants
among children who are Hispanic to the U.S. Those reports began
or Latinx. While there was no around the time Donald Trump
significant increase in the uninsured became President and began
Center on Law and Policy
rate for white children (about 3 introducing a policy agenda around
found that a drop in Medicaid
percent were uninsured in 2019), the immigration that included reducing
enrollment between 2017 and
share of children who are Hispanic the admission of refugees, tying use
2019 corresponded with several
or Latinx who were uninsured of public programs like Medicaid
state and national trends. Federal
reached nearly 8 percent in 2019, up to residency and green card
and state policy changes to
from 3.1 percent in 2015. applications, and increasing arrests
Medicaid enrollment processes
A 2019 report from the Colorado have increased paperwork of undocumented immigrants.
20 Colorado Health Institute2019 COLORADO HEALTH ACCESS SURVEY
Dr. Sophia Meharena with a patient at an Every Child Pediatrics clinic. SPECIAL TO CHI
Statewide Changes said that Mountain Family has seen It also has consequences for
families churning in and out of children’s health. Leah Ramsey,
At Every Child Pediatrics, the Medicaid as their incomes increase a pediatrician at Every Child
percentage of uninsured patients just enough to be ineligible for the Pediatrics, said that the increase in
increased from 5 percent to 9 program for periods of time. the uninsured rate had a real effect
percent between 2017 and 2018. on the treatments she was likely to
But he said that immigration
Every Child Pediatrics is the state’s recommend to families. “When they
politics have been the biggest
largest pediatric practice, serving need anything done, like an x-ray, I
driver of the increase in uninsured
nearly 25,000 patients each year. have to think how much they’ll have
kids: “The sense was an anti-
Approximately 50 percent have a to pay out of pocket,” she said.
immigrant sentiment and driving
preferred primary language other fear in the immigrant population.
than English. Every Child has 16 Still, both Every Child Pediatrics and
How it’s played out is mom and Mountain Family Health Centers
clinics around the state, including dad not wanting to enroll their kids
four large clinics in the Denver have taken steps to ensure that
in Medicaid or CHP+,” even when people feel welcome and continue
area and several partnerships with the children are U.S. citizens and
school districts. to come to the doctor when they
eligible for those programs. need to, including wall signs
Other clinics are reporting similar “The fear hasn’t gone away,” he declaring the clinic a safe space
trends. At Mountain Family Health said. “It’s gotten worse.” and offering trainings for staff
Centers, a community health about the rights of patients.
center serving 21,000 patients in Real Consequences
western Colorado, there has been “We want to create a safe
The increase in the uninsured rate
an 11 percent drop in patients with environment,” said Anahi, the
has consequences for the finances
Medicaid and a 9 percent increase referral coordinator. “Just because
of health care clinics like Mountain
in patients who are uninsured. you don’t have insurance doesn’t
Family Health Centers and Every
mean that we don’t treat you the
Ross Brooks, the CEO of Mountain Child Pediatrics, which offer
same as a family with insurance.”
Family Health Centers, said that subsidized or free primary care to
drop also began around 2017. He people without insurance. By Jackie Zubrzycki, CHI
21HEALTH INSURANCE COVERAGE
Affordability
Since 2015, Coloradans have enjoyed a record-low for many low-income Coloradans. Cost can also
uninsured rate. Yet the affordability of health care burden those who make it to a doctor’s office. In
remains a challenge, with one in five Coloradans 2019, nearly one in three Coloradans (30.6 percent)
(20.2 percent) forgoing doctor, specialist, or were surprised by a medical bill that they thought
prescription services due to cost. Mid- to low- would be covered by insurance. And one in five
income Coloradans are more likely to face this Coloradans (18.1 percent) – the most since 2014,
barrier. But those with incomes below the federal when key provisions of the Affordable Care Act took
poverty level actually report problems with effect – said they have problems paying medical
affordability less frequently. Public insurance and bills, which can result in lowered spending on other
safety net programs help address cost barriers needs, debt, or even bankruptcy.
Coloradans With Modest Incomes Most Likely to Skip Care Because of Cost
Skipping care due to cost by income, 2019
30%
26.7% 26.3%
20% 23.3%
22.0%
10%
15.2%
0%
At or Below 100% FPL 101%-200% FPL 201%-300% FPL 301%-400 FPL More Than 400% FPL
Share of Coloradans Struggling to Pay Medical Bills Of the 18.1% Who Had a Problem Paying Medical Bills ...
Rises for the First Time Since ACA Implementation
70.5% Saved less or took funds out of savings
Percentage of Coloradans who had a problem paying medical
bills in the past 12 months, 2009-2019
53.9% Took on credit card debt
30% Were unable to pay for
32.6% necessities like food, heat, or rent
20%
21.9% 21.2% 28.4% Added hours or took another job
18.1% 18.1%
15.2% 14.0%
10%
18.6% Took out a loan
0%
2009 2011 2013 2015 2017 2019
3.7% Declared bankruptcy
INSI GHT
P O L ICY: House Bill 19-1174 seeks to reduce DATA: Black (non-Hispanic/Latinx) Coloradans are nearly
the likelihood of a surprise bill by increasing twice as likely to have had problems paying a medical bill than
notifications and disclosures saying that white (non-Hispanic/Latinx) Coloradans (30.2 percent versus
consumers may incur additional costs when 16.5 percent). A history of discriminatory policy and practice has
they seek care from providers who are out of led black Americans to have, on average, less than 10 percent of
their health insurance’s network. white Americans’ household wealth.
22 Colorado Health Institute2019 COLORADO HEALTH ACCESS SURVEY
STOR I E S OF T HE C HAS
Trauma of Surprise $1 Million Bill
Gives Way to Relief and Gratitude
Surprise medical bills are common
in Colorado. Some 30 percent of
Coloradans say they received an
unexpected bill in the past year,
according to the CHAS.
It’s a good bet that few of those
bills were as traumatizing as the
one Christine Cerrato opened four
years ago.
Her son, Ethan, was born six weeks
early with “catastrophic” medical
conditions. He spent three months
in the neonatal intensive care unit
and underwent dozens of surgeries.
When he finally came home,
Christine, her husband, Matthew,
BRIAN CLARK/CHI
and Ethan’s three older siblings The Cerrato family was faced with a pile of medical bills totaling more than $1 million after the
were emotionally exhausted birth of Ethan, now age 4, before seeking and receiving Medicaid assistance.
and economically teetering after
months of Christine not working. hit dead ends with the insurance Today, Ethan is a passionate
Then they got the hospital bill — carrier and the hospital. four-year-old who participates in
$790,000. It turns out that was just Special Olympics and pretends
the facilities charge. The surgeons But Christine made the call and to be in a band with his big sister.
billed separately, and the tab learned how to find a Medicaid He winds down by watching “Paw
climbed to more than $1 million. case worker. Before long, Ethan Patrol” and “PJ Masks.”
was enrolled in Health First
For some reason, the hospital Colorado, which picked up the bill. “He’s doing well, but he is
didn’t bill the insurance carrier. extremely medically complicated
Even when the hospital corrected Their million-dollar bill became less still,” Christine said.
that problem, the family still owed than $900.
30 percent of the total —more He has tubes in his kidneys that
Fortunately for the Cerratos, they need to be changed every few
than $300,000 — in coinsurance live in Colorado, which has a
charges. months, a risky procedure that
richer set of Medicaid benefits for can lead to infections that race
“People were calling saying, families like hers than some other through his body. He spent a week
‘Hey, let’s set up a payment states. Even so, three-quarters in Children’s Hospital Colorado this
arrangement.’ We don’t even have of Coloradans do not qualify fall to fight off an infection.
$10,” Christine said. They started to for Medicaid. While Colorado’s
be afraid to answer the phone. legislature passed a law seeking But Christine knows she can take
to reduce surprise bills in 2019, him straight to the emergency
It was only by luck that the family many families have already been room without worrying about
found a way out. A provider affected by the practice. another surprise bill, thanks to
recommended Christine call a Medicaid.
friend who had raised a child “We ended up being very lucky,
with complex illnesses. She was and I know a lot of families aren’t,”
skeptical at first, having already Christine said. By Joe Hanel, CHI
23ACCESS TO CARE
Use of Health Care
Coloradans are getting their annual checkups. More an ER in the past year, and of those, more than a
residents than ever report having a usual source of third (38.0 percent) say they went for a condition
care (87.6 percent), and nearly three in four (74.0 they felt could have been treated by a regular doctor.
percent) got preventive care in the past year, an Persistent barriers to care that lead people to the
increase from 62.4 percent in 2017. Increased use ER for nonemergency reasons include needing care
of preventive care is often thought to decrease after hours and difficulty getting an appointment
emergency room (ER) visits, but the CHAS finds that with a different health care provider soon enough.
the rate of emergency care use remained steady even Expanding primary care capacity and availability
as use of preventive care became more common. may help alleviate unnecessary strain on expensive
About one in five Coloradans (20.8 percent) visited and limited emergency resources.
Coloradans With Employer-Sponsored Insurance Many Coloradans Still Get
Are Most Likely to Get Care Nonemergency Care in an ER
Type of insurance vs. utilization, 2017-2019 Reasons for nonemergency ER visits,
2015-2019
n 2019 Health Care Professional Visit n 2019 Specialist Visit n 2019 Preventive Visit
n 2017 Health Care Professional Visit n 2017 Specialist Visit n 2017 Preventive Visit
Unable to Get
Appointment Soon Enough
Employer-Sponsored Individual 2015 2017 2019
89.1% 86.5%
83.5% 77.0% 57.2% 59.0% 52.9%
43.8% 40.6%
36.8% 32.5%
75.4% 71.6%
66.4% 61.0%
Needed Care Outside
of Normal Hours
2015 2017 2019
77.4% 72.4% 77.5%
Was Told by Doctor
Medicaid Uninsured to Go to ER
85.8% 62.7% 2015 2017 2019
77.9% 41.0%
41.5%
34.4%
18.1%
12.2%% 34.7% 33.0% 35.8%
72.9% 39.0%
58.2% 25.8%
More Convenient
2015 2017 2019
52.7% 61.4% 41.6%
INSI GHT
P O L ICY: House Bill 19-1233 seeks to create a more comprehensive primary care system by increasing investments in
primary care through payment reform and expanded benefit packages. The hope is that this will increase care quality
while reducing overall costs incurred in expensive settings like ERs.
24 Colorado Health Institute2019 COLORADO HEALTH ACCESS SURVEY
Views on the Health Care System
Nearly three in four Coloradans (73.8 percent) half (54.5 percent) say the system works for them
are happy with the state’s health care system, and their families. And among those with no
saying it meets the needs of their families. This coverage at all, approval is at just 27.5 percent.
has remained relatively consistent since the As Colorado and the nation continue to debate
implementation of major ACA reforms in 2014, and major changes to the health care system that
it represents an increase from a pre-ACA approval would affect coverage and, potentially, the role of
rating of 69.1 percent. But different groups report government and insurers, people’s perceptions of
different experiences with the system. Among the health care system can offer insight into their
Coloradans with individual insurance, only about experiences with past policy changes.
People Are More Likely to Say the System Is Meeting Their Needs Than the Needs of All Coloradans,
but Perceptions of Both Are Improving in the Wake of the ACA
n Agree that the Health Care System Meets the Needs of My Family
n Agree that the Health Care System Meets the Needs of All Coloradans
100%
80%
60% 69.1% 74.6% 75.1% 73.8%
66.4%
40% 51.2% 48.4% 46.8%
44.1%
20% 35.5%
0%
2011 2013 2015 2017 2019
Coloradans With Medicare Are the Most Satisfied with the Health Care System
Agree that the current health care system meets needs of my family and all Coloradans, by insurance type:
2011 2013 2015 2017 2019
Insurance My All My All My All My All My All
Type Family Coloradans Family Coloradans Family Coloradans Family Coloradans Family Coloradans
Uninsured 34.4% 29.9% 34.5% 34.5% 37.5% 41.6% 33.8% 32.4% 27.5% 27.3%
Employer-
76.1% 36.3% 76.3% 45.7% 78.6% 49.1% 79.5% 45.5% 77.5% 44.7%
Sponsored
Medicare 77.2% 36.6% 80.5% 48.4% 81.6% 51.7% 80.4% 49.1% 85.1% 52.1%
Medicaid /
65.8% 42.8% 74.8% 51.5% 77.1% 62.0% 80.8% 65.3% 77.1% 57.8%
CHP+
Individual /
52.6% 29.0% 59.9% 36.0% 62.7% 42.1% 56.6% 33.3% 54.5% 36.7%
Other
INSI GHT
P O L ICY: For some Coloradans, politics DATA: Just two-thirds of rural Coloradans (66.2 percent) believe
continue to impact coverage. In 2019, 6.3 the health care system meets the needs of their families, compared
percent of uninsured Coloradans say they with three-quarters of urban residents (75.2 percent). Rural residents
don’t have coverage because they disagree often find themselves facing higher insurance premiums and a limited
with Obamacare (the ACA). choice of providers.
25You can also read