"We're trying to heal, you know?" A Mixed Methods Analysis of the Spatial Equity of General Practitioner Services in the Waikato District Health ...
←
→
Page content transcription
If your browser does not render page correctly, please read the page content below
New Zealand Population Review,46, 4–35.
Copyright © 2020 Population Association of New Zealand

         “We’re trying to heal, you know?”
 A Mixed Methods Analysis of the Spatial Equity of
General Practitioner Services in the Waikato District
                Health Board Region

                                     JESSE WHITEHEAD*
                                    AMBER L. PEARSON†
                                     ROSS LAWRENSON‡
                                    POLLY ATATOA-CARR§

Abstract
       Inequitable access to health services can cause and exacerbate inequities in
       health outcomes and should therefore be monitored regularly to ensure that
       service distributions match population needs. Health service accessibility
       includes several factors and can be monitored using both quantitative and
       qualitative methods. We present an exploratory analysis of the spatial
       equity of general practice services in the Waikato District Health Board
       region using a mixed methods approach. Geographic Information Systems
       are used to assess the spatial accessibility of GP services, and in-depth
       qualitative interviews provide a better understanding of not only where
       inequities exist, but why they occur.
       Keywords: spatial equity, primary health care, geospatial, qualitative, mixed methods.

*
    Jesse Whitehead is a researcher at the National Institute of Demographic and Economic
    Analysis, University of Waikato. He is the corresponding author for this paper. Email:
    jesse.whitehead@waikato.ac.nz
†   Amber L. Pearson is an associate professor in the Department of Geography, Environment
    and Spatial Sciences, Michigan State University. East Lansing, Michigan, USA.
‡   Ross Lawrenson is a professor of population health at the Waikato Medical Research Centre,
    University of Waikato. He also works at the National Institute of Demographic and
    Economic Analysis, University of Waikato.
§
    Polly Atatoa-Carr is an associate professor at the National Institute of Demographic and
    Economic Analysis, University of Waikato and a public health physician in paediatrics at
    Waikato District Health Board.
We’re trying to heal, you know?                                               5

P
        opulation health inequities are systematic, avoidable and unfair
        disparities caused by different levels of access and exposure to the
        social determinants of health such as poverty and education (World
Health Organization, 2008). To achieve population health equity,
disadvantage that is beyond the control of individuals must be eliminated
(Marmot, 2005; Woodward & Kawachi, 1998). Health systems, which are
known to cause and perpetuate inequities (Marmot & Commission on Social
Determinants of Health, 2007), are one social determent that individuals
have little direct control over. Therefore, a critical step towards achieving
health equity involves ensuring that health care services are equitable
(Dalton et al., 2013). Spatial equity, often thought of as the fair distribution
of resources and examined through measures of access, is in turn a key
component of equitable health care (Markham & Doran, 2015; Neutens et
al., 2010; Talen & Anselin, 1998). Since effective primary health care is
associated with more equitable population health (Starfield et al., 2005),
improved spatial equity of primary health care may advance health equity.
        The New Zealand Primary Health Care Strategy (PHCS) (Ministry
of Health, 2001) takes a population health perspective towards primary care
services, while the refreshed New Zealand Health Strategy includes a shift
from treatment to prevention, and a focus on overcoming the inequities in
the health system (Ministry of Health, 2016). District health boards (DHBs)
receive government funding according to the age, sex, ethnicity and socio-
economic deprivation of each DHB region’s population, to give areas with
higher health needs appropriately higher funding (Ministry of Health,
2004). Primary health organisations (PHOs) are then funded by DHBs to
deliver primary care to communities, usually through general practitioner
(GP) services. However, New Zealand still has significant and persistent
socio-economic and ethnic health inequities, especially between Māori and
non-Māori (Reid & Robson, 2007).
        The spatial equity of health services is dynamic and should be
monitored regularly to ensure that current and future service distributions
match population needs. Whitehead et al. (2018) have outlined a framework
for examining the spatial equity and sustainability of GP services. However,
health service access and equity is not limited to geography. Penchansky
and Thomas (1981) outlined five domains of accessibility, which include non-
spatial factors such as “accommodation”, “affordability” and “acceptability”.
Levesque et al. (2013) have more recently expanded upon this and proposed
6 Whitehead et al. a framework of access that includes five elements (approachability, acceptability, availability and accommodation, affordability, and appropriateness) and also considers the ability of populations to achieve access. Furthermore, it is essential to incorporate qualitative methods into spatial equity analysis in order to better understand not only where inequities exist, but to gain insight into why they occur. Wakerman and Humphreys (2011) have argued that health services research should be multidisciplinary, and this exploratory paper combines spatial analysis with qualitative in-depth interviews to improve our understanding of GP service equity in the Waikato region. Setting The Waikato DHB region is home to around 405,000 people, with approximately 160,000 residing in Hamilton city and the remainder in small towns or rural areas (Stats NZ, 2019a). A greater proportion of the Waikato DHB population identify as Māori (23.9%) compared with the national average (16.2%), and nearly half of children aged under 15 in the Waikato DHB Region identify as Māori (36.9%) or Pacific (8.3%) (Stats NZ, 2019a). The New Zealand Health Survey has found that adults living in the Waikato region have higher levels of obesity, ischaemic heart disease, diabetes, high cholesterol and blood pressure, as well as higher levels of unmet need for primary care (Ministry of Health, 2018). Inequities in these indicators of poor health outcomes are experienced in the Waikato DHB region, particularly for Māori. For instance, half of Māori women in the Waikato DHB region experienced an unmet need for primary care – an odds ratio of 1.3 compared with non-Māori women (Ministry of Health, 2018). GP services in the Waikato DHB region are delivered through three PHOS – Hauraki Primary Health Organisation, the National Hauora Coalition, and the Pinnacle Midlands Health Network. Hauraki PHO and the National Hauora Coalition are kaupapa Māori PHOs that aim to empower wellness and mana in whānau through “mana whānau, whānau ora” (Hauraki Primary Health Organisation, n.d.; National Hauora Coalition, n.d.). Pinnacle is a network of 85 practices across the Waikato, Taranaki, Lakes, Bay of Plenty, and Tairawhiti DHB regions (Pinnacle Incorporated, n.d.). Pinnacle leads the development of the Health Care Home – a new model of general practice care adopted by some practices (Pinnacle Incorporated, n.d.). Common elements of the Health Care Home model include capacity for same day
We’re trying to heal, you know?                                              7

appointments, care planning for patients with high needs, the use of
technology for phone or email consultations and web or smartphone-based
patient portals, and the more effective use of physical space (Amey, 2018;
Cumming et al., 2018; Hefford, 2017)

Methods

Quantitative approach
Geographic Information Systems (GIS) were used to quantitatively assess
the spatial equity of GP services. The three steps to spatial equity analysis
outlined by Whitehead et al. (2018) involve defining, estimating and
quantifying spatial equity. Although spatial equity has a range of definitions
that vary with context (Whitehead et al., 2019a), it has been referred to as a
fair distribution of resources relative to need (Zenk et al., 2006). This
recognises that in order to achieve equitable health outcomes, some
populations with higher needs may require appropriately higher levels of
services (Reid & Robson, 2007). Similarly, there are a range of measures and
techniques used to estimate the spatial accessibility of health services
(Guagliardo, 2004). The “Floating Catchment Area” (FCA) group of
techniques estimate accessibility by considering service availability relative
to population size and the distance between populations and services. FCAs
calculate the ratio between the number of services and the size of
populations within a defined catchment area and produce an accessibility
score for each small area unit within a study area (McGrail & Humphreys,
2009). The main advancement of the Enhanced-2-step-floating-catchment-
area method (E2SFCA) is that it incorporates a distance decay function,
which recognises that spatial access to services decreases for populations
living further from the centre of a GP catchment. The E2SFCA is now
considered the default spatial accessibility measure (McGrail, 2012). This
paper applied a modified version of the E2SFCA method in ArcGIS (ESRI,
Redlands, CA, USA) to estimate accessibility within the Waikato DHB
region. Once accessibility has been estimated, the Gini coefficient can be
used to quantify equity. The Gini coefficient assesses the distribution of
resources (such as income, or in this case, accessibility) across a population,
and provides an equity score between 0 and 1, with 0 representing a
perfectly equal distribution and 1 indicating a completely unequal
distribution (Jang et al., 2017).
8                                                             Whitehead et al.

Data
All GP clinics were geocoded based on the physical addresses provided by
the Waikato DHB website (Waikato District Health Board, 2019). Area unit
(AU) boundaries were downloaded from Stats NZ (2019b) and 2013 Census
data, including usually resident population, age group and ethnicity, were
linked to represent the distribution of the Waikato DHB region’s population.
The NZDep2013 index of socio-economic deprivation (Atkinson et al., 2014)
was also linked to the AUs. The New Zealand road network was downloaded
from Land Information New Zealand (2019) to assist spatial analysis.
        When analysis was carried out, 2018 Census data were unavailable.
Although at the time of writing, Statistical Area 2 (SA2) level population
data for the 2018 Census were available, the 2018 Census External Data
Quality Panel (2019, p. 5) has highlighted “operational failures” that
resulted in a high level of non-response for the 2018 Census. As a result, the
External Data Quality Panel has rated the quality of ethnicity data in the
2018 Census as “moderate” and emphasised that at lower levels of
geographic scale there is greater uncertainty around both population count
and ethnicity data. Furthermore, delays to the release of 2018 Census data
have meant that a 2018 version of the New Zealand Deprivation Index had
not been developed by the time data analysis was performed. Due to these
issues of data quality and availability, it was decided that 2013 Census data
would be used for the purposes of this analysis.

Analytical methods
When estimating the spatial accessibility of GP services, we used a recently
developed modification of the E2SFCA which incorporates dynamic
catchment sizes defined by patient enrolment data: the VGP-E2SFCA
(Whitehead et al., 2020). Dynamic catchment sizes were used to reflect the
distance that patients in urban and rural areas were assumed to be willing
to travel to access GP services. Researchers have argued for the
incorporation of dynamic catchments to better model accessibility in mixed-
urban-rural environments (Luo & Whippo, 2012; McGrail & Humphreys,
2014). Our decision to use 10-km, 20-km and 30-km catchments for clinics
in major urban, small and medium urban, and rural areas, respectively, is
based on a detailed analysis of patient enrolment records for the Waikato
region, which is published elsewhere (Whitehead et al., 2020). The
Butterworth distance decay function, as used by Langford et al. (2012), was
We’re trying to heal, you know? 9
applied to take into account the reduced spatial accessibility of people living
at the outer edge of a catchment compared with those living much closer. We
accounted for differences in the level of services available at each clinic by
weighting clinics in our model according to the number of GPs working
there. While, the full-time equivalent (FTE) hours of each GP and nurse
would give a more accurate measure of the availability of appointments for
patients, this information was not available for all clinics. The distribution
of accessibility scores across the Waikato DHB region was mapped, and
differences in accessibility for age, ethnic and socio-economic groups were
examined. To quantify the overall spatial equity of GP services, the Gini
coefficient was calculated in R (R Core Team, 2017) using the ACID package
(Sohn, 2016).
Qualitative approach
The qualitative component of this research was based on in-depth
interviews. Key stakeholders were initially identified through purposive
sampling and contact with appropriate organisations. A snowball method
was then used to contact further participants. This method ensured
representation of key groups.
Potential participants were contacted via email with an interview
request, and informed written consent was obtained before the interview.
The study received ethical approval from the Human Research Ethics
Committee, Faculty of Arts and Social Sciences, University of Waikato
(granted 18 May 2017; reference: Whitehead FS2017-18).
Participants included seven patient representatives (n = 7), general
practitioners (n = 5), representatives from primary health organisations
(PHOs) (n = 4) and the Waikato District Health Board (DHB) ( n = 1). Face-
to-face semi-structured interviews lasting approximately 60 minutes were
conducted with the 17 participants between August and December 2018.
Participants were asked a range of questions within the broad theme
of GP service equity, including questions around barriers to equity, causes
and effects of inequity, and potential solutions. The semi-structured nature
of interviews gave space for participants to raise their own areas of concern
that were not directly addressed by the interview guide (displayed in Table
1 below). The interviews were carried out as part of a larger project that also
examined the equity of GP services in the Waikato region, and therefore
questions relating to the sustainability of services are included in the10 Whitehead et al.
interview schedule. The responses to these questions have been analysed
and will be published separately. Audio from all interviews was digitally
recorded, transcribed verbatim, de-identified, and imported into NVivo
qualitative analysis software (QRS International, 2018). After conducting 17
interviews, saturation was reached with participants repeating common
themes, and therefore no further participants were recruited. The
interviews and analysis of qualitative data was carried out by Jesse
Whitehead (JW), with planning assistance and guidance provided by the
other contributing authors.
Table 1: Interview guide
Key topics relating to equity covered by the interview guide
How would you define equity?
Are services in the Waikato DHB region equitable?
What factors affect the equity of GP services?
Who is affected by inequitable services?
How could the equity of services be improved?
Which areas have the most or least accessible services?
Analysis and interpretation of data
Through this process of conducting and transcribing interviews, JW became
familiar with the data corpus, which is phase one of a thematic analysis
(Braun & Clarke, 2006). Then, in phase two, an inductive approach was used
to generate initial codes from the recurring ideas in the interview
transcripts. As suggested by Guest et al. (2012), a single codebook with
thematic definitions was created iteratively. Codebooks include a list of
codes, definitions and examples for each code, and details of when to use it
(Guest et al., 2012). In phase three, potential themes were discerned by
sorting and grouping codes. These initial themes were reviewed in phase
four to ensure that the codes within them were coherent, and that there were
clear distinctions between themes. Through this process, higher order
themes were discerned, which led to phase five: the definition and naming
of themes and an examination of links and connections between concepts.
Finally, a more deductive approach has been used in phase six – the
development of a narrative and the preparation of this paper – through
alignment with key concepts and frameworks in the research literature. An
exploratory approach to mapping participants’ perceptions of equity andWe’re trying to heal, you know? 11 access across the Waikato DHB region was adopted. Participants were asked to highlight, on a map of the region, places that they believed had good or poor access to GP services. The information provided by all 17 participants was amalgamated and has been displayed visually. Results Spatial accessibility The results of the VGP-E2SFCA analysis indicate that spatial accessibility to GP services varies within the Waikato DHB region. Figure 1 displays the accessibility scores of each AU. Scores were grouped into quintiles from quintile 5 (Q5 representing AUs with the lowest access scores) to quintile 1 (Q1 representing AUs with the highest access scores). Figure 1 indicates that Hamilton city tends to have better spatial accessibility to GP clinics than most rural areas. Sixty-five per cent of all AUs with Q1 or Q2 accessibility scores were in Hamilton, while no AUs in Hamilton had low accessibility scores (Q4 or Q5). Hamilton not only has the highest concentration of GP clinics in the region, but also many clinics that have several registered GPs. On the other hand, Figure 1 also reveals that the areas with the lowest spatial accessibility scores tend to be located around the periphery of the Waikato DHB region. For instance, most of the Coromandel region, the west coast, and the area surrounding Taumarunui in the southern part of the Waikato DHB region have spatial accessibility scores in Q5.
12                                                            Whitehead et al.

Figure 1: Distribution of spatial accessibility scores across the Waikato
         DHB region
We’re trying to heal, you know? 13
Spatial equity
The Gini coefficient for the distribution of spatial accessibility scores across
the Waikato DHB total population was 0.477, suggesting an unequal
distribution of GP services. However, it also appears that this distribution
is slightly “positive”, with a higher than expected proportion of the
population (30.7 per cent) living in areas with high accessibility scores.
Figure 2 shows that more than half of the Waikato DHB population reside
in areas of high access (Q1 or Q2), while only 14 per cent live in areas of very
low accessibility (Q5).
Figure 2: Distribution of accessibility scores across the population
35
30
25
Population (%)
20
15
10
5
0
Q1 (High Q2 Q3 Q4 Q5 (Low
access) access)
Spatial accessibiliity quintile
Figure 3 shows a similar pattern and indicates that all age groups
are over-represented in areas of high accessibility, while only the “over 65
years” group has a higher than expected population living in areas of lower
accessibility (Q4). Figure 4 shows the distribution of accessibility scores by
ethnicity. There are high proportions of all ethnic groups living in areas of
high accessibility (Q1 and Q2). A particularly high proportion (80 per cent)
of Asian residents live in areas of high access, with 52 per cent living in Q1
and 28 per cent living in Q2. While many Europeans live in high-access
areas, there is also a relatively high proportion living in areas of lower
accessibility (Q4). More than half of Māori and Pacific in the Waikato DHB
region live in areas of high accessibility (Q1 or Q2), while a low proportion14 Whitehead et al.
(11 per cent and 7 per cent, respectively) live in areas of very low
accessibility (Q5). A high proportion of residents of other ethnicities also
lived in areas with high spatial accessibility. These results suggest that the
ethnic distribution of accessibility scores in the Waikato DHB region follows
the same overall trend as the overall Waikato DHB population (as outlined
in Figure 1), and most residents live in areas of high spatial accessibility.
Figure 3: Distribution of accessibility scores, by age
40
Under 15 15-64 65+
30
Population (%)
20
10
0
Q1 (High Q2 Q3 Q4 Q5 (Low
access) access)
Spatial accessibility quintile
Figure 4: Distribution of accessibility scores, by ethnicity
60
50
Population (%)
40
30
20
10
0
Māori Pacific Asian European Other (incl.
MELAA)
Q1 (High access) Q2 Q3 Q4 Q5 (Low access)We’re trying to heal, you know? 15
Table 2 indicates the distribution of accessibility scores for the
Waikato DHB population living in areas of high deprivation (NZDep2013
deciles 7–10). Figure 5 indicates that a high proportion of the Waikato DHB
population live in areas of high socio-economic deprivation, and that Māori
and Pacific populations in particular are over-represented in these areas.
Table 2 shows that only a very small proportion (0.26 per cent) of the
population face the double burden of living in areas that are both very highly
deprived (NZDep 10) and have very low accessibility (Q5). Furthermore,
almost half (49 per cent) of people living in areas of high socio-economic
deprivation (NZDep 7–10) also live in areas of high spatial accessibility (Q1
and Q2). While this may suggest that spatial accessibility is distributed
equitably, almost one-third (31.9 per cent) of people living in areas of high
socio-economic deprivation have poor spatial access (Q4 and Q5) to GP
services. Furthermore, a large proportion of the total DHB population (17.9
per cent) are affected by both high deprivation and low spatial access to GP
services. This is higher than would be expected in an equal distribution and
represents more than 64,000 residents.
Figure 5: Waikato DHB deprivation profile, by ethnicity
Māori Pacific Asian European
30
25
Population (%)
20
15
10
5
0
1 2 3 4 5 6 7 8 9 10
NZDep2013 Decile16 Whitehead et al.
Table 2: Area-level deprivation by accessibility
NZ Dep DHB Population Expected Population
Accessibility
2013 (%) (%)
Q1 4.96 2.00
Q2 0.58 2.00
Decile 7 Q3 0.04 2.00
Q4 2.43 2.00
Q5 1.98 2.00
10.0
Total 10.00 0
Q1 7.43 2.00
Q2 0.72 2.00
Decile 8 Q3 4.99 2.00
Q4 4.84 2.00
Q5 1.64 2.00
10.0
Total 19.62 0
Q1 7.23 2.00
Q2 0.00 2.00
Q3 2.36 2.00
Q4 2.41 2.00
Decile 9 Q5 0.73 2.00
10.0
12.73
Total 0
Q1 5.56 2.00
Q2 0.79 2.00
Q3 3.42 2.00
Decile 10 Q4 3.58 2.00
Q5 0.26 2.00
Total 13.60 10.00
Qualitative results
Most participants defined equity in terms of a ‘vertical” needs-based
distribution of resources where individuals or populations with higher levels
of need received higher levels of resources. This is closely related to aWe’re trying to heal, you know? 17 definition of equity that focuses on outcomes. Several participants took an outcome-focused definition of equity, arguing that a social justice approach should be used to ensure that people can achieve the same outcomes of good health and well-being regardless of their background. Specifically, participants referred to equity of access and outcomes irrespective of the social position, ethnicity, location or physical impairment of individuals. These needs-based and outcomes-focused definitions of equity align with spatial equity definitions outlined in the research literature (Whitehead et al., 2019a). Some participants expanded upon the outcomes-focused definition to consider equity in terms of the ability of individuals and populations to achieve their full potential in a wider sense, such as the potential for “…good health, good career, good family life, good housing”. Finally, interviewees also recognised that equity was intertwined with the rights of individuals and populations, and the importance of service quality in achieving equity. All participants viewed GP services in the Waikato region as inequitable. The reasons participants gave were organised into two broad groups: barriers to equitable access, and structural or systemic causes. Equity of access Responses that were coded as access-related were grouped into key themes that aligned with the Levesque et al.’s (2013) model of access. Levesque et al. (2013) incorporate five dimensions of service accessibility; approachability, acceptability, availability and accommodation, affordability, and appropriateness. The model includes five corresponding abilities of people to interact with services in order to achieve access. These are the ability to perceive the need for care, seek care, reach care, pay for care, and engage with health care. Participant discussions of these interrelated domains and their relationship to the equity of GP services are outlined below. Approachability of services Participants reported that GP services are often not approachable as the health system is difficult to navigate and understand, particularly for patients with complex health needs or multi-morbidities. This is then exacerbated by difficulties around the ability to perceive the need for health care among some individuals and groups. Different levels of health literacy among some patients meant that they often did not perceive the need for care until conditions had progressed and become serious. On the other hand,
18                                                                    Whitehead et al.

participants also discussed a group which they called “the worried well”, who
over-utilised health services, often for relatively trivial matters, adding to
clinic workloads and taking up appointments that could have been used by
those with more serious health issues.

Acceptability of services
The acceptability of services was a key issue. Participants highlighted that
mainstream services are aligned with a European view of health, rather
than a more holistic Māori approach. Most services lack cultural safety,
which presents a significant barrier to access.

     We’ve built [the health service] on the needs of the provider, it’s a European
     model and it isn’t responsive to the needs of the population. (D, Waikato
     DHB)

     We have tried, or been made to conform to a mainstream model, and our
     people continue to be unwell and our people to continue to not thrive as they
     should. (A, patient)

         Participants talked about how discrimination results in patients
avoiding health services at all costs.

     The only time that our people will engage is in ED, when it’s literally life or
     death, and then they get discriminated there...the only way our people will
     engage is if we make it safe. (P, patient)

         Participants also expressed a sense frustration with the limitations
of ‘traditional’ GP models of care, and talked about wanting more holistic
health care that integrates a wider range of health and social services in
order to address the root causes of poor well-being, rather than just treating
the symptoms. These discussions also included a patient’s ability to seek
care, which was highlighted as another point where inequities in access
develop. A lack of services that are seen as culturally safe, exacerbated by a
lack of trust in the health system in general, means that many patients
delay seeking care. Participants explained that many patients have complex
or chaotic lives which often means that accessing health care is not their
most immediate priority. Furthermore, the view that the most marginalised
members of society are excluded from mainstream services was expressed
by several participants.

Availability and accommodation of services
The availability and accommodation of services was also emphasised as a
key issue affecting equitable access. Participants highlighted the impacts of
We’re trying to heal, you know? 19
workforce shortages (among both GPs and other health professionals) which
result in difficulty getting timely appointments. Patients talked about
having to wait weeks for an appointment at understaffed practices and
highlighted that inflexible opening hours and a lack of after-hours care
exacerbates these issues, particularly in isolated areas and with clinics
without “drop-in” or urgent care services. This is also related to a patient’s
ability to reach care. Participants highlighted a lack of available
transportation, or high costs associated with transport, as a key barrier to
equitable access, particularly in rural areas with very limited public
transport. This particularly affects patients with low incomes, as well as the
young and elderly who are often reliant on others for transportation.
Furthermore, participants emphasised a lack of services designed for people
living with disabilities. This lack of accommodation means that some basic
aspects of facilities – such as outward opening doors – can act as a
fundamental barrier to physically entering a health service.
Affordability of services
The affordability of GP services was highlighted as a fundamental barrier to
equitable access. Participants argued that the cost of appointments was far
too high, and that this was often exacerbated when the cost of prescriptions
and accessing after-hours care was considered.
[People] don’t want to spend the money. When [my partner] is in the height
of his pain and I say go to the doctors he says ‘No, I don’t have enough money
to go to the doctors’. (H, patient)
This is directly related to a patient’s ability to pay for care.
Participants highlighted how the lack of affordable GP services, in a context
of widespread poverty in many communities, means that many patients are
unable to pay for health care.
Appropriateness of services
According to Levesque et al. (2013), the appropriateness of services concerns
their quality in terms of timeliness, the care put into diagnosis and
treatment, and fit between services and patient need. Participants discussed
how services could be inappropriate if they were unable to address patients’
wider social, spiritual, environmental or cultural needs, which are all
important components of well-being. Patients also highlighted that the
quality of care they received from different clinics or different GPs varied
greatly. Some patients were willing to travel significant distances to a20 Whitehead et al.
preferred GP that they knew would be able to meet their particular needs
and support access to additional equipment or services that would help them
to achieve equitable outcomes. Other patients expressed distress at losing
the relationship, continuity and trust that they had developed with a
particular doctor, sometimes over generations.
I struggled when my doctor left. He was my doctor from birth. My mum’s
doctor, my nan’s doctor. He just knew me. I didn’t even have to say it, I’d just
walk in and he’ll know. So, when he retired, I cried because I had a hard
time picking a doctor for [my daughter]. A really hard time. (S, patient)
The appropriateness of services aligns with a patient’s ability to
engage. Participants highlighted that this is dependent on patients having
a level of empowerment, support and health literacy, and that this should
be developed at the whānau level.
...the first point of contact for people to be well and maintain their well-being
is whānau, and so whānau capability is a huge thing for me ... If I hadn’t
become savvy about systems, the outcomes for my daughter would be
different ... so that whole kind of literacy space is really important but also
building whānau leadership... (L, patient)
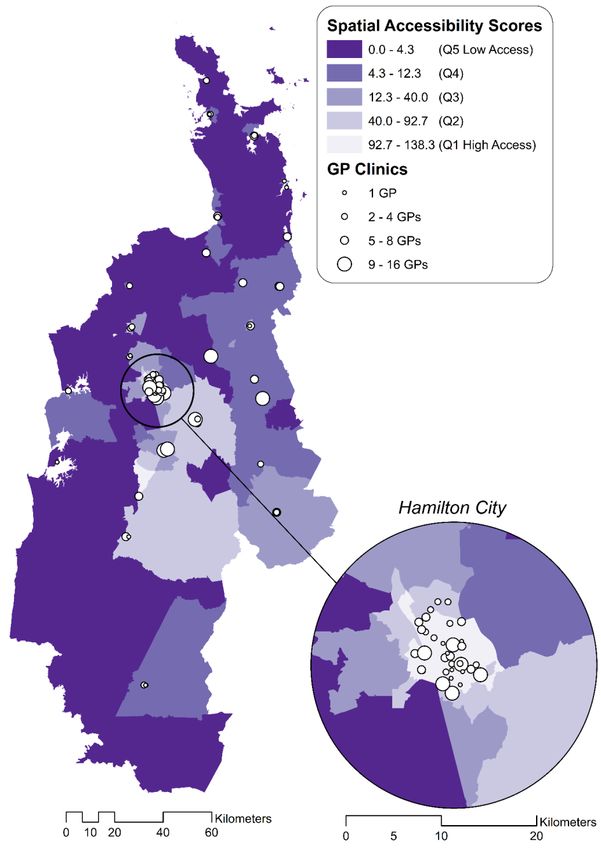
Qualitative mapping
Participants had different views on sub-regional equity, and at times there
were contrasting opinions about which places had good or poor access to
services. This is likely to reflect the in-depth knowledge and insight that
each individual participant has about their local area. However, in general
there was agreement that accessibility was much better in Hamilton and the
immediately surrounding area, while peripheral rural areas of the region
such as Taumarunui, Putaruru and Tokoroa had poor access to GP services.
Participants recognised that access to GP services varies across the Waikato
DHB region, and that “place” shapes the opportunities that individuals and
communities have to use health services. The number of participants who
commented that a place had good or poor access to GP services was counted
for each town in the region and has been represented in Figure 6. This gives
a visual depiction of where interview participants perceived spatial
inequities in access to GP services to be located. Figure 6 highlights an
understanding among participants that equitable access is variable and
dependent on place, as some places have much better access than others.
There appears to be significant overlap between the qualitative depiction of
accessibility in Figure 6 and the results of the quantitative spatialWe’re trying to heal, you know? 21
accessibility model in Figure 1. Of the AUs that interviewees rated as having
“good” access, 70 per cent were also considered to have high spatial
accessibility (Q1 and Q2) according to the VGP-E2SFCA results. The same
was true for 68 per cent of AUs that were rated as having “poor” access by
interviewees.
Structural factors
Participants also highlighted how these barriers to equitable access are
influenced by structural factors. These aligned with the three main “system
structures” that Kringos et al. (2010) highlight in their systematic review of
primary health care: governance, economic conditions and workforce
development. Participants emphasised the importance of good governance
of health services at all levels, including the Ministry of Health, DHBs,
PHOs and at individual practices, as a key factor influencing the
accessibility of services. The lack of appropriate planning and the design of
services in a provider-centric fashion, rather than a design to meet the needs
of patients, were highlighted as key barriers to equitable access.
Furthermore, patients called out a lack of community engagement from
governance structures around the design and delivery of services. These act
as barriers to the development of service approachability and acceptability.
Patients also expressed a strong desire for the better integration of services,
with a stronger holistic focus that incorporates the prevention of illness and
maintenance of well-being. Integration was seen as a particularly pertinent
issue in rural areas, where most secondary, tertiary and specialist services
can only be accessed by traveling to Waikato Hospital. A lack of planning
and service integration can act as a barrier to the approachability and
appropriateness of services.
Participants outlined funding arrangements and business models as
key economic factors that affect equity by directly affecting the affordability
of GP services. Participants explained the current GP system as a public–
private partnership, with practices receiving a base-level of public funding
based on their enrolled patient population, which is topped up through co-
payments from patients. This arrangement affects service equity.
Participants stated that this can result in some practices enrolling high
numbers of patients to get higher levels of funding, meaning that patients
are more likely to experience longer waiting lists, shorter appointments and
lower quality care.22 Whitehead et al.
We’re incentivised to take as many patients as we can. It’s all mixed up.
(P, GP)
Furthermore, if practices are not registered as Very Low Cost Access
clinics, they can set their own co-payment costs, meaning that the cost of an
appointment varies greatly throughout the Waikato region. The type of
business model that clinics operate can also affect business decisions and
impact on patients. For instance, some doctors noted that under GP-owned
models, they had more control over how much to charge patients and, in
some cases, would not charge anything when they knew that patients
couldn’t afford to pay. On the other hand, participants expressed concern
about the increasing corporatisation of health care, suggesting that
businesses run purely in the name of profit were unlikely to have patients’
best interests at the core of their model, leading to the potential for increased
inequities.We’re trying to heal, you know? 23
Figure 6: Participants perceptions of areas of ‘good’ and ‘poor’ access to GP
services in the Waikato DHB region24 Whitehead et al.
Participants also highlighted the link between workforce
development and the availability and accommodation of services. Issues
around the current GP workforce were discussed. In many areas, clinics rely
on locums or international medical graduates, which affects GP continuity
for patients. Difficulties recruiting and retaining doctors long-term means
that the level of services available can fluctuate. Participants also
highlighted the need to better integrate the non-GP health workforce,
including pharmacists, nurses and physician assistants into a health care
team. For example, not all appointments need to be with a GP, and therefore
other health professionals could meet some of the demand for GP services.
Participants also highlighted a lack of professional development
opportunities, and that the current medical training system tends to
discourage medical students from a career in general practice, contributing
to workforce shortages that impact on service availability.
Finally, participants outlined the fundamental drivers of health
inequity as New Zealand’s history of colonisation, and continuing
discrimination at systemic, institutional and interpersonal levels.
Participants directly tied the historical injustices of colonisation to current
poor health among Māori. Significant land confiscation, violence and
oppression resulted in the loss of an economic base and, through the social
determinants of health such as poverty, education and incarceration, has led
to present-day health inequities.
The violence that happened across the whole of the Waikato is deeply
entrenched in people’s history and impacts biochemically on them as well as
in terms of what happens with their illness. (F, GP)
Participants argued that colonisation has resulted in Māori being
disempowered by the government over many generations. This intentional
disempowerment has a significant impact on each of the five ‘abilities’ of
individuals to access care.
Our people are traumatised. There’s intergenerational trauma. We’re trying
to heal, you know? (P, patient)
Participants also emphasised that the negative impact of
colonisation is reinforced through present-day racism and discrimination
which, in the context of health services, directly affects access to appropriate
services and treatment.We’re trying to heal, you know? 25
As a young Māori woman … the service you may receive, as soon as they see
you, is not the same as somebody who is similar age, same gender, but could
be a different race. (J, patient)
Participants have described how the historical and ongoing trauma
of colonisation and repeated breaches of the Treaty of Waitangi have a direct
impact on health, despite Māori being guaranteed rights to protection under
Article 3 of the Treaty, including access to the same quality of health and
standard of living as Pākehā citizens (Wepa, 2015). Ryks et al. (2019) have
demonstrated that the ongoing impact of colonisation has produced
inequities between Māori and non-Māori that exist across key social
determinants of health, such as housing, transport, socio-economic
deprivation, racism, and access to and quality of health care. Furthermore,
the Wai 2575 Health Services and Outcomes Kaupapa Inquiry (Waitangi
Tribunal, 2019) found that the primary care system does not adequately
address the severe inequities experienced by Māori. Although there has been
an increase in Māori service providers, and the Waikato DHB region has
four Māori service providers across eight locations (Ministry of Health,
2012), the Wai 2575 inquiry argues that the Crown has not done enough to
support Māori to design and deliver primary care services for Māori.
Furthermore, the key legislative framework of the primary care system in
New Zealand – the New Zealand Public Health and Disability Act (2000) –
is not considered to be Treaty-compliant as it does not give full effect to the
Treaty of Waitangi or its principles.
The direct links that participants drew between colonisation and
health inequity supports the research literature outlined above and
highlights the importance of recognising colonisation and self-determination
as key determinants of health for indigenous people. In Canada, Greenwood
and de Leeuw (2012) have outlined a ‘Web of Being’ model of the social
determinants of indigenous people’s health. The inner layer of children,
families and communities are impacted by proximal determinants of health
such as income, education and healthy environments. These are surrounded
by the intermediate determinants such as health systems, location, cultural
ways and justice, while the outer layer consists of distal determinants of
health such as self-determination, language, racism, land resources and
poverty. Greenwood and de Leeuw’s model recognises the historical and
ongoing determinants of health that directly affect indigenous people in
Canada, suggesting that improvements to health systems and health26 Whitehead et al.
outcomes are intrinsically related to indigenous self-determination and
empowerment. The Wai 2575 inquiry (Waitangi Tribunal, 2019) has given
an interim recommendation that the Crown should explore the concept of a
stand-alone Māori primary health authority.
Colonisation in Aotearoa New Zealand is also closely linked to
capitalism. The systematic dispossession of Māori from their land – and the
rights and freedoms associated with it – established the preconditions for
capitalism in Aotearoa New Zealand and laid the foundations for persistent
inequities between Māori and Pākehā (Wynyard, 2017). In more recent
years, neoliberal economic restructuring in Aotearoa New Zealand has led
to increasing poverty (Kearns & Barnett, 1992) which marginalises and
excludes individuals who are unable to purchase health care (McGregor,
2001). At the same time, market approaches appear to have increased
geographic differences in GP availability, resulting in acute shortages in
rural areas (Barnett & Barnett, 2004). Kearns and Barnett (1992) note that
the health system in Aotearoa New Zealand has been gradually privatised
since the 1950s, leading to the emergence of corporate models of primary
care service provision. Capitalism and neoliberalism became influential
ideologies in the New Zealand health system in the 1990s (Prince et al.,
2006) and despite the intentions of the PHCS (Ministry of Health, 2001),
primary care in Aotearoa New Zealand is largely based on a privatised
business model driven by neoliberal market forces.
Colonisation and capitalism have produced inequitable societal
conditions, both in terms of the ‘abilities’ that individuals and populations
have to access services, and the impact on the availability and affordability
of user pays primary health care services. The research findings discussed
above have been synthesised into a model of equitable access to primary
health care in the Aotearoa New Zealand context, as displayed in Figure 7.
The model shows that the components of access outlined by Levesque et al.
(2013) – approachability, acceptability, availability and accommodation,
affordability, and appropriateness – are also key themes in ensuring
equitable access to GP services in Aotearoa New Zealand.
However, as our participants have highlighted, it is also important
to consider the roles that place and health system structures play in shaping
inequitable access to health care.We’re trying to heal, you know? 27
Figure 7: A model of equitable access to GP services in Aotearoa New
Zealand
Discussion
Overall, the quantitative findings point to an inequitable distribution of GP
services in the Waikato DHB region. The Gini coefficient of 0.477 suggests
that access is not shared equally among the population. Although it appears
that most residents have good spatial access to services, and there do not
appear to be any major differences by age or ethnicity, it is important to
recognise that this is likely to be influenced by the geographic distribution
of the population. Hamilton city accounts for a large proportion of the overall
Waikato DHB population, and good access to GP services in the Hamilton
area may be masking poor access in rural peripheral areas that have smaller
populations. Furthermore, a high proportion of residents of socio-
economically deprived areas reside in Hamilton and therefore also have good
spatial access to GP services. However, this is also likely to be masking
smaller populations living in small towns and rural areas with high socio-
economic deprivation and poor access to GP services. Importantly, a
substantial proportion of people are affected by the double burden of living28 Whitehead et al.
in areas with poor spatial access to GP services and high socio-economic
deprivation.
The results of the qualitative component of this research provide
important additional insight, and highlight key factors that participants
identify as influencing the equity of GP services. The qualitative mapping
approach triangulates our quantitative findings and there appears to be
significant overlap between the results of a quantitative GIS model of access
– based on population size, supply and the geospatial distribution of services
– and the more nuanced qualitative understandings of access among the
interviewees.
In-depth interviews reinforced the idea that spatial accessibility is
only one component of access, supporting the findings of previous research
in this area (Panaretto et al., 2017; Whitehead et al., 2019b). Participants
emphasised non-spatial factors that act as barriers to equitable access,
particularly the availability, acceptability and affordability of GP services.
Many considered the cost of services to be prohibitive, and the focus on
European health models unacceptable, and expressed frustration at the
difficulty of receiving an appointment with their GP. Several accessibility
factors that our participants identified align with the international
literature, such as the Levesque et al. (2013) model of patient-centred access.
While the Health Care Home (HCH) model is one response to
increase patient-centred care, Cumming et al. (2018) argue that it has
potential shortcomings and it too soon to judge whether it could be a
successful model of care in the New Zealand context. For example, Cumming
et al. (2018) argue that the HCH model does not directly tackle major equity
concerns, especially around the health of Māori and Pacific populations.
Furthermore, they suggest that the HCH model is mainly focused on
business efficiency, and it is assumed that giving GPs more time will result
in better care for patients and populations with complex needs. Our
interviewees also identified factors that influence GP service equity and are
unique to the Aotearoa New Zealand context such as the historical and
ongoing impact of colonisation and Treaty of Waitangi breaches. Our
proposed model of equitable access to GP services therefore highlights the
importance of historical and structural factors, as well as the role of place,
in shaping individual and community level access to GP services.
Landscapes of health and place are dynamically and reciprocally developed
through the activities of health care provision which affects health services,We’re trying to heal, you know? 29
the health of population groups, and the vitality of places (Kearns, 1993;
Kearns & Joseph, 1997). Kearns (1993) argues that health services are a key
institutional component of places. However, the restructuring and re-
orienting of health services towards free-market principles since the 1980s
have often limited the provision of rural services to very basic levels (Joseph
& Chalmers, 1996). Furthermore, Pomeroy (2019) has outlined how the
inequitable development of rural New Zealand has systematically
disadvantaged Māori populations, while Came et al. (2019) argue that a
fundamental barrier to achieving health equity is colonial health policy
designed for ‘all’ New Zealanders. The colonial health infrastructure and
policies which replaced indigenous systems of health have been ineffective
at addressing the systemic inequities produced through colonisation (Came
et al., 2019; Waitangi Tribunal, 2019). Therefore, in order to achieve equity,
health policy and health services need to effectively engage with te Tiriti o
Waitangi obligations (Came et al., 2019).
This paper has taken an exploratory approach to investigating
health care equity using mixed methods. It has highlighted areas of
weakness in a purely quantitative approach, and areas for future
improvement. For instance, the VGP-E2SFCA model used in this paper did
not consider the availability of appointments at each clinic, the type of
service being provided, or the cost of an appointment, despite availability,
acceptability and affordability being emphasised by participants as key
components of equitable access. The ability of populations to access services
was also assumed to be equal across the region. Although practice-level
databases exist that include the availability and type of appointments and
PHOs have data on staff FTE hours for each clinic, this data were not made
available for this research project. Future research could aim to better
incorporate these aspects of accessibility into a GIS model. Furthermore, the
use of GP numbers as a proxy measure of GP and nurse FTE hours
represents a potential underestimate of service availability in our GIS
model. Many primary care nurses are highly qualified, hold their own
appointments, and manage the population health components of general
practice such as screening, leading to increased capacity.
The qualitative component of this research is not without its
limitations either. While our original sample was designed to include a
diverse range of interviewees, the snowball approach to identify additional
participants may have limited the final sample. Interviewees may have30 Whitehead et al.
recommended contacts with similar world views, meaning that thematic
saturation might have been reached earlier than if another methodology had
been used – such as randomly selecting service providers and cold-calling
them to request interviews. However, overall, incorporating the perspectives
of patients, GPs and health service providers into this research has led to
the development of a much more intricate and nuanced understanding of GP
service delivery in the Waikato region.
To our knowledge, this type of mixed-methods analysis of health
service accessibility is unique. Previous research in the New Zealand context
has tended to take approaches that are either quantitative (see Pearce et al.
(2006) for their examination of access to health-related resources) or
qualitative (see Lawton et al. (2016) for their examination of barriers to
accessing contraception among Māori teenage mothers). This has meant
that quantitative studies of access to health services have tended to overlook
the social and historical contexts within which the use of services takes
place, and the underlying structural factors that shape opportunities to
access health care are concealed.
Conclusion
This exploratory research has provided new insights into the equity of GP
services in the Waikato DHB region and has highlighted particular areas
that have poor spatial accessibility. Although it is unclear whether these
results can be generalised to other parts of Aotearoa New Zealand, the
research approach could be replicated and applied to other study regions.
There is clear potential for the results to inform the Ministry of Health and
DHBs in their decision making around delivering more equitable primary
health services. Our proposed model of equitable access expands upon
previous theoretical frameworks of accessibility, is tailored to the Aotearoa
New Zealand context, and incorporates key drivers of health service equity.
This paper has shown how a mixed methods approach can be used to gain a
deeper understanding of health care equity at a regional level and can
answer questions of not only where inequities occur, but also why they have
been and continue to be produced.We’re trying to heal, you know? 31
References
2018 Census External Data Quality Panel. (2019). Initial report of the 2018 Census
External Data Quality Panel. https://www.stats.govt.nz/reports/initial-
report-of-the-2018-census-external-data-quality-panel
Amey, J. (2018). Rising demand for health care: The sustainability of community
general practice in the Waikato. (Doctoral thesis, University of Waikato,
Hamilton, New Zealand).
https://researchcommons.waikato.ac.nz/handle/10289/12222
Atkinson, J., Salmond, C., & Crampton, P. (2014). NZDep2013 Index of
Deprivation. Department of Public Health, University of Otago,
Wellington.
Barnett, R., & Barnett, P. (2004). Back to the future? Reflections on past reforms
and future prospects for health services in New Zealand. GeoJournal,
59(2), 137–147. https://doi.org/10.1023/B:GEJO.0000019972.22425.8d
Braun, V., & Clarke, V. (2006). Using thematic analysis in psychology. Qualitative
Research in Psychology, 3(2), 77–101.
https://doi.org/10.1191/1478088706qp063oa
Came, H. A., Herbert, S., & McCreanor, T. (2019). Representations of Māori in
colonial health policy in Aotearoa from 2006–2016: A barrier to the pursuit
of health equity. Critical Public Health, 1–11.
https://doi.org/10.1080/09581596.2019.1686461
Cumming, J., Dunn, P., Middleton, L., & O’Loughlin, C. (2018). The health care
home in New Zealand: Rolling out a new model of primary health care.
Journal of Integrated Care, 26(1), 242–252. https://doi.org/10.1108/JICA-
04-2018-0031
Dalton, A., Jones, A., Ogilvie, D., Petticrew, M., White, M., & Cummins, S. (2013).
Using spatial equity analysis in the process evaluation of environmental
interventions to tackle obesity: The healthy towns programme in England.
International Journal for Equity in Health, 12(1), 43.
https://doi.org/10.1186/1475-9276-12-43
Greenwood, M. L., & de Leeuw, S. N. (2012). Social determinants of health and the
future well-being of Aboriginal children in Canada. Paediatrics & Child
Health, 17(7), 381–384. https://doi.org/10.1093/pch/17.7.381
Guagliardo, M. F. (2004). Spatial accessibility of primary care: Concepts, methods
and challenges. International Journal of Health Geography, 3(1), 3.
https://doi.org/10.1186/1476-072X-3-3
Guest, G., MacQueen, K. M., & Namey, E. E. (2012). Applied thematic analysis.
Sage.
Hauraki Primary Health Organisation. (n.d.). About us.
https://www.haurakipho.org.nz/about-us/
Hefford, M. (2017). From good to great: The potential for the Health Care Home
model to improve primary health care quality in New Zealand. Journal of
Primary Health Care, 9(3), 230–233. https://doi.org/10.1071/HC17045
Jang, S., An, Y., Yi, C., & Lee, S. (2017). Assessing the spatial equity of Seoul’s
public transportation using the Gini coefficient based on its accessibility.32 Whitehead et al.
International Journal of Urban Sciences, 21(1), 91–107.
https://doi.org/10.1080/12265934.2016.1235487
Joseph, A. E., & Chalmers, A. L. (1996). Restructuring long-term care and the
geography of ageing: A view from rural New Zealand. Social Science &
Medicine, 42(6), 887–896. https://doi.org/10.1016/0277-9536(95)00187-5
Kearns, R. (1993). Place and health: Towards a reformed medical geography.
Professional Geographer, 45(2), 139. https://doi.org/10.1111/j.0033-
0124.1993.00139.x
Kearns, R., & Barnett, J. (1992). Enter the supermarket: Entrepreneurial medical
practice in New Zealand. Environment and Planning C: Government and
Policy, 10(3), 267–281. https://doi.org/10.1068/c100267
Kearns, R., & Joseph, A. (1997). Restructuring health and rural communities in
New Zealand. Progress in Human Geography, 21(1), 18–32.
https://doi.org/10.1191/030913297666611118
Kringos, D. S., Boerma, W. G., Hutchinson, A., van der Zee, J., & Groenewegen, P.
P. (2010). The breadth of primary care: A systematic literature review of
its core dimensions. BMC Health Services Research, 10(1), 65.
https://doi.org/10.1186/1472-6963-10-65
Land Information New Zealand (2019). LINZ data service. https://data.linz.govt.nz/
Langford, M., Fry, R., & Higgs, G. (2012). Measuring transit system accessibility
using a modified two-step floating catchment technique. International
Journal of Geographical Information Science, 26(2), 193–214.
https://doi.org/10.1080/13658816.2011.574140
Lawton, B., Makowharemahihi, C., Cram, F., Robson, B., & Ngata, T. (2016). E
Hine: Access to contraception for indigenous Māori teenage mothers.
Journal of Primary Health Care, 8(1), 52–59.
https://doi.org/10.1071/HC15021
Levesque, J.-F., Harris, M. F., & Russell, G. (2013). Patient-centred access to
health care: Conceptualising access at the interface of health systems and
populations. International Journal for Equity in Health, 12(1), 18.
https://doi.org/10.1186/1475-9276-12-18
Luo, W., & Whippo, T. (2012). Variable catchment sizes for the two-step floating
catchment area (2SFCA) method. Health & Place, 18(4), 789–795.
https://doi.org/10.1016/j.healthplace.2012.04.002
Markham, F., & Doran, B. (2015). Equity, discrimination and remote policy:
Investigating the centralization of remote service delivery in the Northern
Territory. Applied Geography, 58(C), 105–115.
https://doi.org/10.1016/j.apgeog.2015.01.020
Marmot, M. (2005). Social determinants of health inequalities. Lancet, 365(9464),
1099–1104. https://doi.org/10.1016/S0140-6736(05)71146-6
Marmot, M., & Commission on Social Determinants of Health. (2007). Achieving
health equity: From root causes to fair outcomes. The Lancet, 370(9593),
1153–1163.
https://doi.org/ 10.1016/S0140-6736(07)61385-3
McGrail, M. (2012). Spatial accessibility of primary health care utilising the two
step floating catchment area method: An assessment of recentYou can also read