HARRY GWALA DISTRICT HEALTH PLAN 2018/19 - 2020/21 (KWAZULU-NATAL) - National ...
←
→
Page content transcription
If your browser does not render page correctly, please read the page content below
HARRY GWALA DISTRICT HEALTH PLAN 2018/19 - 2020/21 (KWAZULU-NATAL)
Harry Gwala District Health Plan 2018/19

ACKNOWLEDGEMENTS
 The Planning Monitoring and Evaluation Unit wishes to extend its acknowledgements to the
members of District Office Management, Hospital and CHC Management for their
dedication and commitment and involvement in the whole process of data collection,
collation and finalization of the plan. A high level of teamwork and active participation of
different people in the district, BroadReach Healthcare (supporting partner) has resulted in
the successful completion of the health plan.

A special thank you goes to the following people:
   1. Mrs G.L.L. Zuma          District Manager
   2. Mrs B.A. Mkhize          Deputy District Manager Planning, M&E Unit
   3    Mr. S.A. Cekwana       Cooperate Service Manager
   4    Mr. B.H.S Makhaye      Deputy Manager Clinical & Programme Services
   5    Ms K.A. Mtinjana       Deputy Manager District Planner
   6    Mrs. N. Binase         CEO-EGUM
   7    Mrs S. Maseko          CEO- Christ the King Hospital
   8    Ms N. Hadebe           CEO –St. Apollinaris Hospital
   9    Dr. N. Gumede          CEO- Pholela CHC
   10   Mrs. N.A. Keswa        CEO-Rietvlei Hospital
   11   Dr. E. Mthembu         CEO/ Medical Manager –St Margaret’s TB/MDR Hospital
   12   Mr. R. Hadebe          CEO Umzimkhulu Hospital
   13   Mrs R Dladla           District Human Resource Manager
   14   Ms T.Manzi             District Principal accountant
   15   Mrs N. Nxele           District Finance Manager
   16   Mr. S. Zwane           District Pharmacist
   17   Mrs. T.G.O. Sikhakhane Nursing Manager - Pholela CHC
   18   Miss L. Mthembu        Nursing Manager – Christ the King
   19   Mrs. J. Mlotshwa       Nursing Manager - St Margaret’s TB/MDR Hospital
   20   Mrs. J. Nqophiso        Nursing Manager - Rietvlei Hospital
   21   Mr. B. Msibi           Nursing Manager - Umzimkhulu Hospital
   22   Miss T. Khumalo         Nursing Manager - St. Apollinaris Hospital
   23   Mr. S. Maphumulo        Nursing Manager - EGUM
   24   Mr. T. Zondi            District Information Officer
   25   Ms F.F. Shabalala       District Facilities Information Officer
   26   Mrs N.Ngubane           Civil Society Sector Chairperson
   27   Mrs M, Hlongwa           Harry Gwala District Municipality
   28   Mrs F. Dlamini           EGUM M&E Manager
   29   Miss S Mpongomo          Rietvlei M&E Manager
   30   Mrs E. Zondi             St Margaret’s M&E Manager
   31   BroadReach Healthcare NGO Partner

                                                                              Page 2 of 78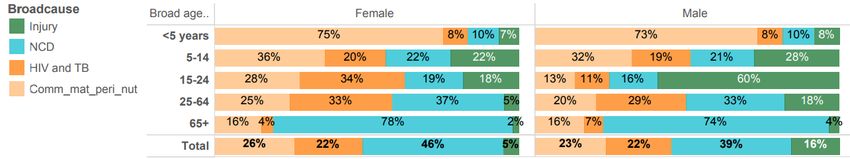
Harry Gwala District Health Plan 2018/19
OFFICIAL SIGN-OFF
It is hereby certified that this District Health Plan:
Was developed by the district management team of Harry Gwala District with the
technical support from the district health services and the strategic planning Units at the
Provincial head office.
Was prepared in line with the current Strategic Plan and Annual Performance Plan of the
KwaZulu Natal Department of Health.
Page 3 of 78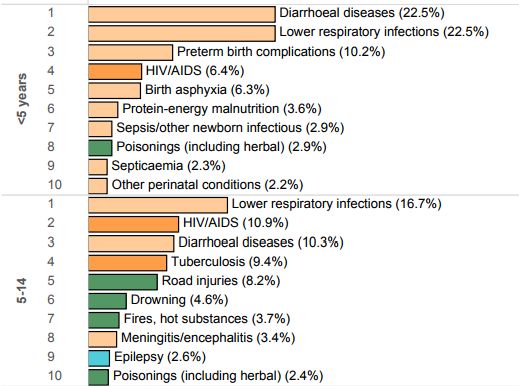
Harry Gwala District Health Plan 2018/19

EXECUTIVE SUMMARY BY THE DISTRICT MANAGER

The District Health Plan will give a brief overview of the 2016/2017 previous performance and
outline the Districts aspirations based on the diseases burden and the outcomes of the
indicators as per District Health Barometer 2016 2017.

1 DISTRICT SERVICE DELIVERY PERFORMANCE
Harry Gwala health district has performed fairly well in previous years in terms of strategic
priority programmes though there are challenges to meet some of the set targets. These
challenges have been identified and will be addresses in this plan.

PHC SERVICES
PHC Re engineering
Family health teams are in place though not enough to cover entire district due to financial
constraints which made it impossible to enrol teams to entire district. This has contributed to
below target performance of PHC utilisation rate 2.7 in 2016/17

School health teams have performed exceptionally well in terms of schools that were
accredited as health promoting school which totalled to 20 schools for previous year
2017/18.
The challenge remained with meeting the targets of screening of grades R and 8 thus the
district aspiration being increase PHC utilisation and increase screening of Grade R and 8

IDEAL CLINIC REALISATION AND MAINTAINANCE (ICRM)
National and Provincial assessment of clinics is still ongoing, marked achievements noted at
UMzimkhulu supported clinics all have achieved the status. Focus will be at Dr. NDZ clinics
and Ubuhlebezwe clinics for the next 3yr cycle.

The challenge in some of the clinics is related to infrastructure especially at NDZ sub-district.
The district aspiration is to increase the number of facilities scoring from 53%to above 80%
and the vital measures scoring on NCS from 0% to 100% BY 2021.

HIV and AIDS
HIV and AIDS nerve centre meetings and reviews are in place, implementation of Universal
testing and treatment (UTT) and capacitation of health care workers on key population
service provision is ongoing. Challenges identified: low paediatric initiation, low viral load
done and increasing numbers of loss to follow up. These challenges will be addressed in this
three year plan. The district interventions will focus on NIMART training acceleration plan and
mentorship especially in support of paediatric initiation , retaining clients on treatment and
active defaulter tracing at all levels assisted by supporting partner BroadReach.

                                                                                     Page 4 of 78
Harry Gwala District Health Plan 2018/19
TB CONTROL PROGRAM
TB control program has performed well this financial year as it is on track with the 90/90/90
strategic goals targets; with achievements of 92% TB on Success rate ; 85 % Cure rate; death
rate at 4 % below; and the loss to follow up (Defaulter)rate at 3%. The district is still struggling
with meeting roll out targets for TIER.Net TB module.
Strategies on clinical, systems and community interventions are in place to upscale the roll
out with inclusion of Sub districts teams and supporting partner (BroadReach).
District aspiration will focus on to reduce HIV incidence using 90/90/90 strategy.
MCWHN
The MNCWH program has remarkable improved Maternal, Child and Women’s Health and
has managed to achieve low baby PCR positivity rate around 10 weeks to 1%, under 5 year
severe acute malnutrition fatality rate at 2.1%.
Maternal death is within 95/100 000 and cervical cancer screening at 80%.
Despite the hard work and engagements the District is still struggling to achieve targets on
immunization coverage under 1 year, couple year protection rate, child under 1year
mortality and in patient early neonatal death rate.
Immunisation coverage has improved at UMzimkhulu and Ubuhlebezwe sub districts. Focus
for the district will be in the remaining sub districts DR.NDZ and Ubuhlebezwe.
The district aspiration will channel strategies and resources towards reducing neonatal
deaths and under 5 year’s mortality rate.
Women’s health will focus on improving couple year protection rate and decreasing
teenage pregnancy.
NON COMMUNICABLE DISEASES
Non Communicable Diseases have become the 3rd leading cause of death for ages
between 25-64 years and 65 and above both in males and females in Harry Gwala district as
per 2010-2016 barometers. Though screening services has improved in terms of targets, it is
not convincing that all deserving clients have been initiated on treatment and well
managed. Cataract surgeries have improved; as the projection shows that the district will
meet the target of 700 clients since for the past 3 quarters of 2017/18 698 cataracts were
conducted.
Shortage of ophthalmic nurses and optometrists in the district has negatively affected eye
care services.
Lack of community awareness in screening and dangers of chronic conditions has drastically
increased the risk mortality and morbidity.
Page 5 of 78Harry Gwala District Health Plan 2018/19
The district will be focusing on community awareness, community screening campaigns and
roll out of Palliative care services. Integration of 90-90-90 strategies in management of NCD
will be rolled out in the next 3 year cycle.
SUPPORT SERVICES
Pharmaceuticals
The District Pharmaceutical services are currently managing CCMDD in the entire district. The
district has achieved to reduce stock out of tracer items through implementation of stock
visibility system, which tracks and monitor stock outs, thus enabling shifting of stock within
facilities.
Transport
Transport remains the cost driver in the district in terms of maintenance and repairs resulting
from poor topography, terrains and distance in-between service points. EMS and Forensic
services vehicles are managed through district fleet management.
The focus on EMS is to reduce the response times as of the pillars to improve quality of care
according to the key steps to prevent avoidable maternal, neonatal and child mortality is
rapid inter-facility emergency transport system
Infrastructure
District infrastructure unit has supported institutions towards ensuring all planned projects are
implemented and maintenance budget utilised appropriately.
Finance
The district has managed to channel more budgets to PHC with the previous DHER; this will
be maintained as the district is prioritizing PHC health services over district hospital services.
District budget for 2017/18 has been managed as per prescript with 92% spent by end
February 2018.
Human resource
WISN training has been completed, implementation pending because of budgetary
constraints. District Equity Plan is in place and is being implemented in all sub districts.
Page 6 of 78Harry Gwala District Health Plan 2018/19
EPIDEMIOLOGICAL PROFILE
The District planning process required District Information Officer compile comprehensive
epidemiological health information of the District (as per Annexure C) before the district planning
workshop and make it available to the District Management Team to define aspirations, and
identify key interventions.
Provide the following sections of the comprehensive epidemiological health information for the
District, as a minimum:
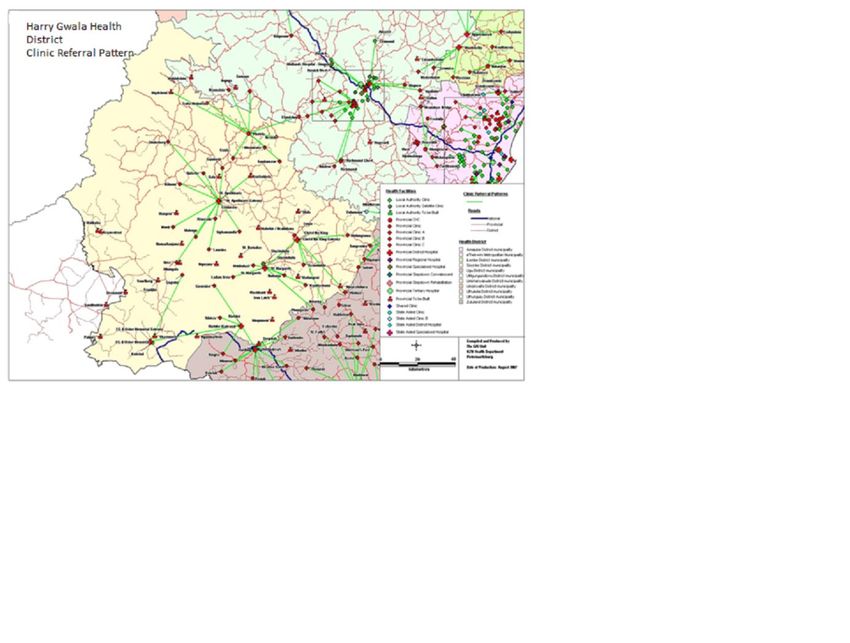
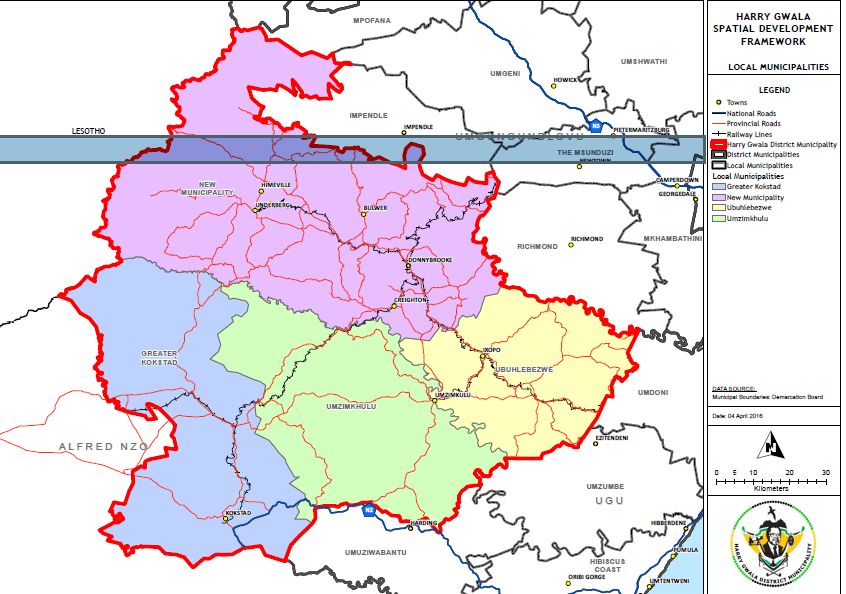
District Map with Population distribution, sub district boundaries,
6.Population distribution
Page 7 of 78Harry Gwala District Health Plan 2018/19
23%
37% Umzimkhulu
Kokstad
NDZ
Ubuhlebezwe
23%
17%
Greater Kokstad Local Municipality has 17% of the population. The municipality is mainly
composed of low cost houses which are located at Shayamoya, Horse shoe , Mphela
,Franklin (Lindelani).Quarters informal settlement ward 2,Marikana ward 8,Bambayi ward8
and Chocolate City ward 1 and farm areas. There are formal house for the middle income
group.
NDZ Local Municipality contributes 23% of the total district population with 94% of the
population living below poverty line, with Ward 4 at Kilmun and Ward 7 at Gqumeni and
Qulashe being the most deprived wards in the sub-district; It is the 2nd largest sub- district
within Harry Gwala District.
Underberg areas are most dominated with migrant laborers from Lesotho and Eastern Cape
and from the nearby Swartberg Farms which contribute to treatment defaulter rates. (see
graph above).
UBuhlebezwe Local Municipality’s population is predominantly formed by formal (traditional)
dwellings with few sugar cane and forestry farm areas. This Local Municipality is marked with low
cost houses at Mahehle, Springvale, Ndwebu area which was previously at UGu district and
Fairview with informal dwellings as well.
UMzimkhulu Local Municipality has the largest population. It is mainly constituted of traditional
dwellings with few low cost at Ibisi, Riverside and informal settlement like Sisulu Settlement areas
close to town enroute R56 which is a main road which has high accidents occurrences.
Page 8 of 78Harry Gwala District Health Plan 2018/19
Harry Gwala District is sub-divided into four local municipalities following merge r of Ingwe and
KwaSani local municipalities, to form Dr. Nkosazane Dlamini- Zuma Local Municipality known as
NDZ Local municipality.
NDZ Local municipality comprises of both tribal and pockets of farm areas with hard to reach
areas. There are variations of head count from clinic to clinic some with high headcount others
with low headcount, like Underberg clinic with high headcount. This is mainly due to the transport
flow from two clinics i.e. Kilmun and Qulashe to Underberg, Ncwadi clinic’s performance is
Page 9 of 78Harry Gwala District Health Plan 2018/19
affected by UMgungundlovu District due to its proximity resulting in low PHC utilization rate from
the low headcount.
The sub- district has the second largest population; this population is affected by the migrant
labourers from Lesotho and Eastern Cape Province as well as from nearby Swartberg farms. The
mobility of this population, especially found in farms where farmers import seasonal workers from
Eastern Cape and Lesotho also contributes to high treatment defaulter rates, which is addressed
in terms of cross-border meetings. The sub-district has one district one district hospital and CHC
with 12 clinics, 3 WBOT Underberg Clinic has an MOU (Maternal and Obstetric units).
Greater Kokstad Local Municipality has got two fixed clinics, 3 Health Posts , 3 mobile clinics and 1
district hospital that refers to Edendale Regional Hospital at UMgungundlovu District, transfers to
the nearest Port Shepstone Regional Hospital which is in UGu district is dependent on the
availability of beds. There are no WBOTs due to staff shortages.
Kokstad Local Municipality‘s services are affected directly by Eastern Cape Province because of
its soft boundary, this is evident in the high number of non-referred cases and high TB defaulter
rate of clients mostly from Eastern Cape. People from nearby villages access services from
Kokstad PHC facilities as they are centrally situated in town where people do their day to day
shopping.
Ubuhlebezwe Local Municipality has the third largest population. It has 10 clinics, 2 mobile services
and 2 WBOTs. Health post at ward 5 is operating with challenges of staff retention as it is in a
grossly rural hard to reach area, but its need to exist is obvious from the 100% increase of the
headcount from the previous year. There is one district hospital which refers to uMgungundlovu.
UMzimkhulu Local Municipality has the largest population and is the most rural poverty stricken
hence it was identified as the Presidential Node. It has 16 fixed PHC clinics with 3 mobile clinics, 4
WBOTs . This local municipality has 1 district hospital and 2 specialized hospitals i.e. MDR TB Hospital
St. Margaret Hospital and UMzimkhulu Psychiatric Hospital. Roads are mostly gravel with poor
terrains; making it difficult for the people to access health services. The situation is worse during the
rainy season
The district has a functional District AIDS Council (DAC) and OSS (DTT) which is working closely with
the Department of Health providing intersectoral strategic direction in response to community
health related interventions.
6. Population per selected category
Population category 2016 2017 2018 2019 2020
under 1 year 14407 14457 14470 14409 14219
under 5 years 72589 73011 73061 72782 72257
05-09 years 66387 67833 69021 70025 70987
Page 10 of 78Harry Gwala District Health Plan 2018/19
Population category 2016 2017 2018 2019 2020
10-14 years 55463 57255 59395 61642 63715
15-19 years 51329 50282 50113 50658 51905
20-24 years 55669 54036 52097 49973 48111
25-29 years 53387 54241 54434 54211 53414
30-34 years 37890 40956 44006 47005 49859
35-39 years 23714 25787 28043 30313 32373
40-44 years 16330 16904 17578 18434 19585
45-49 years 13383 13375 13442 13596 13847
50-54 years 12228 12090 11929 11759 11603
55-59 years 10910 10785 10674 10574 10465
60-64 years 9327 9257 9168 9065 8954
65-69 years 7394 7339 7278 7211 7137
70-74 years 5574 5522 5448 5358 5262
75-79 years 3948 3906 3863 3803 3723
80 years and older 3899 3850 3812 3780 3761
Total 499428 506435 513362 520188 526956
Estimated pregnant women 15415 15469 15483 15418 15214
Source: Mid-Year Population Estimates 2016, StatsSA (as per 2016 demarcations)
Note ; the highlighted population categories are some of the life course groups that will be
focussed on.
The projections on population growth for the under five years from 2019 onwards seems to be
declining. This could be attributed to high death rate in this age category (as evident in the
DHB 2015/16). The major causes of death for this age category are diarrhoeal diseases
(22.5%) as well as lower respiratory infections (22.5%). There is also a noticeable decline in the
reproduction rate as indicated on the estimated pregnant of women (as indicated from the
table above). This will be monitored against the performance of indicators like the child
mortality rate and couple year protection rate.
The high death rate due to injuries as well as HIV/AIDS amongst the 15 to 24 years according
to Health Barometer 2015 within the district is seen as contributing to the decline of the
population projection of growth rate from 2020. The effectiveness of interventions that are
planned for the three years should be targeting the injuries of this age group and research if
need be to focus on this life group.
Page 11 of 78Harry Gwala District Health Plan 2018/19
There is a gradual decline in life span of the 50 years and above due to increase in deaths on
clients with NCDs (as evident in the DHB 2015/16). Key interventions addressing the NCD
program will be implemented as part of this plan.
While there is decline in estimated pregnant women, the increase in delivery in the facility
under 18 years rate is a cause for concern. Harry Gwala District is ranked amongst the top 10
worst performing districts for this indicator. This has implications for child under 1 year mortality
and maternal deaths.
7. Social determinants of health
Greater
Sub-Districts Data Source NDZ Ubuhlebezwe Umzimkhulu District
Kokstad
Census 2001 41.2% 46.1% 61.6% 68.0% 52.6%
Unemployment
Census 2011 28.9% 27.7% 34.0% 46.6% 33.0%
C/ S 2007 11% 18.% 12% 25% 17%
rate
C / S 2016
Census 2001 20566 26032 23107 36677 106382
Total number of
Census 2011 19140 26746 23487 42909 112282
households
C/ S 2007 14321 26710 21804 43545 127659
C / S 2016 19140 26201 25516 42909 116766
Census 2001
below poverty line
of R283 per month
population living
Percentage of
Census 2011 57.0% 58% 68% 73.0% 62.9%
C/ S 2007 97% 86% 97% 98% 93%
C / S 2016 11220 28637 56937 30245 127039
Census 2001 6725 19458 17724 29305 73404
Informal dwelling
Census 2011 3139 17322 16371 28878 65685
households in
Number of
C/ S 2007 6336 1131 3334 3080 13881
C / S 2016
Census 2001 13841 6574 5383 7372 32978
formal dwelling
Census 2011 16001 9424 7116 14031 46597
households in
Number of
C/ S 2007
C / S 2016
Census 2001 59.9% 16% 9.9% 2.3% 20.8%
w
d
H
a
a
a
o
o
o
o
e
e
c
c
h
h
n
n
u
ti
it
it
s
s
s
s
s
t
f
l
Page 12 of 78Harry Gwala District Health Plan 2018/19
Greater
Sub-Districts Data Source NDZ Ubuhlebezwe Umzimkhulu District
Kokstad
Census 2011 60.1% 17% 12.0% 6.4% 22.4%
C/ S 2007 88% 92% 88% 92% 90%
C / S 2016 12437 3364 3007 4363 23171
Census 2001 19365
access to potable
Households with
Census 2011 9676 8958 4955 6277 5973
C/ S 2007 12891 10255 3920 19365 9486
water
C / S 2016 14311 9995 5081 7231 36618
Census 2001 49.9% 36.9% 28.6% 54% 36.7%
Households with
Percentage of
Census 2011 80.7% 62.7% 53.9% 64.5% 64.9%
electricity
access to
C/ S 2007 58.5% 50% 46% 54% 52%
C / S 2016 15446 14013 27656 14273 71388
Census 2001 25.7% 15.4% 13.9% 11.8% 16.4%
Adult literacy rate
Census 2011 31.1% 26.1% 33% 202% 28%
C/ S 2007 32% 37% 35% 42% 36%
C / S 2016
Source: Stats SA (Local Government Handbook)
The Unemployment rate is at 33 % for the district according to the Census 2011 with the adult
literacy of 28%. The high adult illiteracy results in the high levels of people earning below R283 per
month (62.9 %) and high levels of unemployment. The low socio- economic status of communities
renders them vulnerable to diseases. This too could contribute to treatment defaulter rate of
chronic diseases as a patient who does not have enough money will opt to buy food than to go
and collect medication. The implementation of CCMDD program may address some of these
challenges.
The source of employment for most of people is forestry farms, sugar plantations and
supermarkets. Those qualifying for social grants are using them as their main source of income.
Informal dwellings linked to poor access to sanitation are associated with sporadic diarrheal cases
that are reported from time to time. This has been noted during information meetings.
Ubuhlebezwe Local Municipality has the lowest electricity supply of at 53 % followed by NDZ Local
municipality with 62.7% of electricity supply. All health facilities in the district have electricity supply
but there are challenges with back up supply of generators to maintain in instances when there
are electricity interruptions. According to South African Multidimensional Poverty Index (SAMPI)
Harry Gwala District has got two wards that fall within the most deprived top 34 wards i.e. Ward 5
Page 13 of 78Harry Gwala District Health Plan 2018/19
at Ubuhlebezwe (which ranks number 19) and ward 4 at NDZ (which ranks number 23). Seven
wards are within the top 100 most deprived wards, 4 are from UMzimkhulu one from NDZ .These
wards are prioritized when allocating outreach services.
Water and Sanitation
Greater Kokstad local Municipality is ahead in the provision of sanitation and water services
compared to other local municipalities. This is largely caused by the mushrooming of informal
settlement this Municipality which has resulted in the provision of sanitation through mobile toilets.
Informal settlements such as Bhambayi, Chocolate city and Marikana have no basic water and
sanitation services; this becomes a threat of waterborne diseases.
NDZ Local Municipality has wards that comprise of formal traditional dwellings which never had
piped water (these are most from the previous Ingwe Municipality). These areas are entirely
dependent on boreholes and pit privy systems however the construction of Bulwer Dam will be a
source of water supply once it has been completed. Areas which are from previously Kwa Sani
Local Municipality have piped water except informal dwellings where they are dependent on
springs and boreholes. Municipality provides technical support in cases of drought. Sporadic
cases of diarrhoea are reported if there is extra influx of people.
UMzimkhulu Local Municipality comprise of formal traditional dwellings which never had piped
water, 28 000 informal dwellings do not have water and sanitation services. Communities from
these formal traditional dwellings are dependent on boreholes and spring water and sometimes
supplies from Municipality. Sanitation is mainly pit privy .The picture contributes to sporadic cases
of diarrhoea which is reported throughout the year.
These challenges and water and sanitation in the district are addressed by IDPs.
8. Causes of Mortality
The five leading causes of death in the under 5 years are mainly diarrhoeal diseases, lower
respiratory infections, Preterm birth complications , birth asphyxia and HIV and AIDS
according to the DHB 2015/16. Diarrhoeal diseases deaths related contributory factors have
been identified to be mostly related to herbal intoxication. This has been identified in all sub-
districts .Preterm birth complications deaths are mostly related to extreme prematurity mostly
due to low socio economic background. Specialised equipment like CPAP and presence of
Page 14 of 78Harry Gwala District Health Plan 2018/19
Medical Air are essential in management of premature babies of which not all District
Hospitals have got them like EGUM and St Apollinaris. Deaths from asphyxia are due to
compromised intra partum care.
HIV and AIDS related conditions have taken the lead in the 10 major causes of deaths as per
2014/2015 Health Barometer from 15.7% in 2013/ 2014 to 19.4% in 2014/2015. The key
population group mostly affected being within the ages of 15 and 24 years which is mostly
the child bearing age as well as the life course group tertiary education level.
Ages between 25 and 64 are equally affected but according to the population ratio both
males and females share almost the same percentage.
There have been no significant changes in HIV ANC Prevalence. It has been constantly be
above 35%. In 2011 it has been 35.9% in 2012, 36.6 in 2013 and 35.7 in 2014.
TB death rate is fluctuating between 26.2 .8%, 23.1 and 16.4% in 2014/ 2015 according to
Health Barometer 2015/2016. Previously Ingwe as a sub- district recorded the highest rate in
the district at 15.4%, and Ubuhlebezwe sub- district the lowest at 3.9%. The rest of the sub-
districts range from 7% to 7.6%.
Kokstad is having the highest defaulter rate, 13.3% in 2015. This seems to be the common
trend. The contributory factors being the soft boundary between KZN and Eastern Cape.
Kokstad is an economic hub thus attracting job seekers and has low cost houses as well as
informal settlements with poor ventilation facilities
Non Communicable diseases appear to be remaining at the same level but in terms of the
death figures rate they are increasing , Cerebro vascular diseases 5.6 % in 2013/ 2014 and 5.
7 in 2014/ 2015. Hypertensive heart diseases 2.0% in 2013/2014 and 2.4 in 2014/ 2015 diabetes
mellitus 2.9 % in 2013/ 2014 and 3.8 in 2014/ 2015.
Years of life lost due to interpersonal violence are a new trend that is gradually increasing
from 1.4% in 2013/2014 to 2.05 in 2014/ 2015. This is more related to alcohol and drug abuse
that are on the increase even in the rural communities. This will be addressed in the Part B of
the document
9. SERVICE DELIVERY PLATFORM AND MANAGEMENT
The District planning process required District Information Officer compile comprehensive
epidemiological health information of the District before the district planning workshop and make
it available to the District Management Team to define aspirations, and identify key interventions.
Provide the following sections of the comprehensive epidemiological health information for the
District (as outlined in Annexure C) is required as a minimum:
Page 15 of 78Harry Gwala District Health Plan 2018/19
Number of facilities per sub- district by level, 2016/17
Sub-districts
High Transmission Areas
Ward based outreach
Regional Hospital
Central/Tertiary
District Hospital
Other Hospitals
Health Posts
Hospitals
Mobiles
teams
Clinic
CHC
Greater Kokstad 0 2 0 3 3 1 1 0 0 0
Dr. NDZ 3 12 1 5 1 1 1 0 0 0
Ubuhlebezwe 2 9 0 2 1 1 1 0 0 0
Umzimkhulu 4 16 0 3 0 1 1 0 0 2
DISTRICT 9 39 1 13 5 4 4 0 0 2
Primary Health Care delivery platform is affected by the number of clinics resulting in long
distances that the clients have to travel to what they refer as the nearest health facility. Due the
high poverty rate, makes the community to weigh between goings to the clinic against buying
food with the little money he has got, resulting in defaulter rate. Use of WBOT and any outreach
programs to be considered in supporting the continuum of care.
The funding challenges have put on hold on construction of some clinics even though they have
been approved like the construction of CHC at Umzimkhulu Local Municipality.
The WBOT functionality is mostly affected by the staff retention which is a general challenge in the
district.
The two specialised hospitals at Umzimkhulu is the Psychiatric hospital, which serves beyond the
Harry district population, part of Ugu population and part of Alfred Nzo , Eastern Cape
Municipality because of its proximity.
St. Margaret hospital has been utilized as MDR TB hospital but discussion is under way to be
converted to a CHC by 2022
10. Human Resources for Health (filled posts)
health
Clinical Associates
Professional nurse
Speech therapist
Nursing Assistant
Physiotherapist
Enrolled nurse
Occupational
Community
Audiologist
Pharmacist
therapist
worker
Doctor
Dentist
Other
Page 16 of 78Harry Gwala District Health Plan 2018/19
health
Clinical Associates
Professional nurse
Speech therapist
Nursing Assistant
Physiotherapist
Enrolled nurse
Occupational
Community
Audiologist
Pharmacist
therapist
worker
Doctor
Dentist
Other
Greater Kokstad 108 34 34 94 6 2 1 0 1 0 0 0 9
Dr. NDZ 233 68 74 166 11 1 0 1 2 0 0 2 12
Ubuhlebezwe 237 68 71 131 8 5 0 2 1 0 0 2 13
Umzimkhulu 319 45 130 257 17 4 1 3 3 0 0 3 17
HARRY GWALA 878 215 309 648 42 12 2 7 7 0 0 7 51
DISTRICT
District has been successful in deployment of human resources equitably within all sub
districts such as, Professional Nurses, Pharmacist and Allied Health workers.
All institutions within the district including district office as an institution are operational with
the approved organization structure although some of the posts that have been approved in
the organogram are not yet implemented due to the shortage of funds for the filling of the
post.
The district is unable to recruit scarce skills employees, the challenge is that there is no
retention strategy in place to prevent high turnover rate, the multiracial / private schools that
are preferred by the child bearing age of the middle class are only at Greater Kokstad and
Ubuhlebezwe Local Municipalities. This put pressure to other sub- districts that do not have
them.
The unavailability of the Audiologist in the whole district compromises the management of
the clients that are in need of the service as they have to be referred to the nearest districts.
Community Health Workers may be seen as one of the category with high numbers but due
to the rural nature of the district their availability in all municipality wards provide the
seamless continuum of care in the wards however due to the vast nature of the wards they
are not availability in all villages.
The shortage of doctors is amongst the top 5 commonest patient’s complaints. This is linked
to long waiting periods which compromised quality care. Close monitoring of sessional
doctors has to be done by Medical Managers.
Low numbers of dentists are to be seen against low restoration and creative interventions are
to be put in place to address the challenge.
Page 17 of 78DR. NDZ
Ubuhlebezwe
Sub-districts
Greater Kokstad
Indicator
Indicator
Indicator
Numerator
Numerator
Numerator
Denominator
Denominator
5.3
4.8
4.9
6349
7566
33742
39338
36758
23
Average length of stay (days)
63.3
53.4
43.5
53296
33742
39338
84416
36758
22
Inpatient bed utilisation rate (%)
50.1
56.1
38.2
4692
6079
7479
2856 21 OPD new client not referred
10858
Hospital
rate (%)
District Hospital
2791
2524
3264
55728
40756
20 Expenditure per patient day
equivalent (Rand)
11. Management and efficiency indicators for the service delivery platform
5.7
5.4
6.1
149195165 468
140659609 405
133046261 390
19
7566
6349
Inpatient Crude Death Rate (%)
Provincial and local
government district health
8 services expenditure per capita
(uninsured population) (Rand)
Provincial and local
government primary health
Harry Gwala District Health Plan 2018/19
7 care expenditure per capita
Efficiency
population)
(uninsuredand
Provincial local (Rand)
government expenditure per
primary health care headcount
6
(Rand)
Percentage of assessed PHC
5 facilities with90% of the tracer
PHC
medicines available (%)
4 Percentage Ideal Clinics (%)
PHC facilities using Health
3 Patient Registration (No)
Management
2.7
2.4
2.6
2
279167
878049
179127
1284168
PHC Utilisation Rate (No)
1
Page 18 of 78
PHCKZN
RSA
Umzimkhulu
Harry Gwala
Sub-districts
Indicator
Indicator
Indicator
Indicator
Numerator
Numerator
Denominator
Denominator
Denominator
4.9
4.4
5.4
4.7
8380
8278
30573
39688
23
149505
Average length of stay (days)
52.8
67.4
56.2
55.2
71913
39688
73647
22
283271
149505
Source: DHIS, BAS, Ideal Clinic Information System
Inpatient bed utilisation rate (%)
74.9
59.3
49.4
89.7
9371
75486
56518
21 OPD new client not referred
47808
42891
Hospital
rate (%)
District Hospital
2685
2568
2566
2359
62321
53449
20 Expenditure per patient day
212254
equivalent (Rand)
5.4
5.1
5.4
4.5
147015581 376
569916617 1639
19
8380
8278
30573
Inpatient Crude Death Rate (%)
Provincial and local
government district health
8 services expenditure per capita
(uninsured population) (Rand)
Provincial and local
government primary health
Harry Gwala District Health Plan 2018/19
7 care expenditure per capita
Efficiency
population)
(uninsuredand
Provincial local (Rand)
government expenditure per
primary health care headcount
6
(Rand)
Percentage of assessed PHC
5 facilities with90% of the tracer
PHC
medicines available (%)
4 Percentage Ideal Clinics (%)
PHC facilities using Health
3 Patient Registration (No)
2.5
Management
2.3
2.7
2.2
2
426157
292889
5928633
1254868
2295315
PHC Utilisation Rate (No)
1
Page 19 of 78
PHCHarry Gwala District Health Plan 2018/19
ALOS is within Provincial target of 5 days. BUR is constantly below the norm (except for NDZ), the contributory factor has been the under-
utilisation of acute paediatric beds and non-adherence to general admission criteria. OPD Headcount not referred is still high as clients still
bypass PHC facilities. Expenditure per patient day equivalent is high because of the low BUR with full staff complement. High crude death rate
at NDZ is high, the preliminary investigation shows that clients present late. These poor performing indicators will be addressed in this plan.
PHC utilisation rate is low due to WBOT data not included in the numerator. Clients who were enrolled on CCMDD also contributed to the low
PHC utilisation rate.
Page 20 of 78Harry Gwala District Health Plan 2018/19
12. QUALITY OF CARE
12.1 TOP 20 WORST PERFORMING IDEAL CLINIC ELEMENTS PHC FACILITIES
Poor Signage
Basic Life Support training
Incomplete client Records
Non-functional Clinic Committees
Non availability of National Guidelines (clinical audit, Ordering of general supplies, referral
guidelines, inventory books)
No backup system for electricity black outs
Staffing not in line with WISN
Poor representation in LTT and WTT OSS
No Web access
Doctors and therapists visits
Essential medical equipment unavailability
Policies not signed by National
No storage space
Incomplete Clinical audits
12.2 TOP 20 WORST PERFORMANCE NATIONAL CORE STANDARDS IN DISTRICT HOSPITALS
Emergency trollies not appropriately stocked.
Functional system to supply piped medical gas to all clinical areas is inadequate
Functional system to supply piped suction/vacuum to all clinical areas is not adequate.
Safety checks during and after surgery is not conducted according to WHO guidelines
Informed consent forms are not completed correctly
Some tracer medicines are not available
Clinical audits are not conducted.
Clinical risk forum not existing
Adverse events committee non-functional
Adverse blood reactions are not documented and reported
Disaster management plan is not known by staff
Clinical management group policies are not in place
SOP for needle stick injury not available.
Non functionality Occupational Health and Safety committee.
Staff who have received Post exposure Prophylaxis are not retested
Turn-around-time for critical stock not set and monitored regularly
Annual management inspection reports on safety hazards and maintenance is not done
There is visible loose electric wiring and collapsing ceiling
Page 21 of 78Harry Gwala District Health Plan 2018/19
Staff –patient ratio in key areas not in accordance with the approved staffing plan for
emergency unit/out-patient/ medical/surgical and Paediatrics
Ramps with hand-rails to cater for disabled clients are not available
12.3 TOP 5 CHALLENGES REPORTED BY PATIENTS IN PATIENT SURVEYS AND PATIENTS COMPLAINTS
Long waiting times
Negative staff attitude
Poor food services
Unavailability of Doctors
Shortage of supplies e.g. hand washing material, toilet papers.
Page 22 of 78Harry Gwala District Health Plan 2018/19
13 ORGANISATIONAL STRUCTURE OF THE DISTRICT MANAGEMENT
TEAM
DISTRICT MANAGER
DEPUTY MANAGER INSTITUTIONS
DEPUTY MANAGER
DEPUTY MANAGER DHS PLANNING CORPORATE SERVICE 4 District Hospitals
INTEGRATED DHS MONITORING 2 Specialized Hospitals
DEVELOPMENT EVALUATION
1CHC
1vacant,spcialised and
chc
PROGRAMME SCM &FINANCE
DISTRICT PLANNER DISTRICT ENGINEER
MANAGERS X8 MANAGERS CLINIC MANAGERS
MOBILE TEAMS
HEALTH POSTS
DISTRICT
INFORMATION
TEAM
The full establishment of the District Management Team gives support to the sub-districts
which are key services delivery platforms. The challenge is provision of close support and
monitoring of sub-districts is the vast nature of the district which results in travelling long
distances to reach the facilities. The proposed sub- districts plan will probably ideal to
address the challenge.
Page 23 of 78Harry Gwala District Health Plan 2018/19
14 DISTRICT HEALTH EXPENDITURE
Budget: Adjusted Appropriation Expenditure TOTAL
BUDGET AND EXPENDITURE
Province *Transfer to LG LG Own Province Transfer to LG LG Own Budget Expenditure
2.1: District Management 25 545 000.00 0.00 0.00 26 668 572.00 0.00 0.00 25 545 000.00 26 668 572.00
2.2: Clinics 234 194 000.00 0.00 0.00 216 767 272.00 0.00 0.00 234 194 000.00 216 767 272.00
2.3: Community Health Centres 42 562 000.00 0.00 0.00 42 483 591.00 0.00 0.00 42 562 000.00 42 483 591.00
2.4: Community Services 0.00 0.00 0.00 0.00 0.00 0.00 0.00 0.00
2.5: Other Community Services 80 976 000.00 0.00 0.00 79 896 542.00 0.00 0.00 80 976 000.00 79 896 542.00
2.6: HIV/AIDS 163 718 000.00 0.00 0.00 176 240 700.00 0.00 0.00 163 718 000.00 176 240 700.00
2.7: Nutrition 2 700 000.00 0.00 0.00 3 151 882.00 0.00 0.00 2 700 000.00 3 151 882.00
2.9: District Hospitals 480 437 000.00 0.00 0.00 469 747 986.00 0.00 0.00 480 437 000.00 469 747 986.00
TOTAL DISTRICT 1 030 132 000.00 0.00 0.00 1 014 956 545.00 0.00 0.00 1 030 132 000.00 1 014 956 545.00
Source: District Health Expenditure Review (2016/17) or BAS*LG - Local Government
The increase in budget and expenditure in the past years has been gradual e.g Clinics budget has increased from R206 854.00 in 20115/16 to
R234 194 000 in 2016/17.The expenditure has been maintained within the limits. The reflection of Clinics to be under spending should not be seen
as true reflection, as this is mainly due to delays in journals as well as BAS that closed early before all the payments being processed.
HIV and AIDS budget has increased from R161921000 IN 2015/16 to R163 718 000 in 2016/17 but over expenditure remains.
Page 24 of 78Harry Gwala District Health Plan 2018/19
Overspending in HIV/ AIDS budget was incurred from VCT test kits which are in line with the increase in the number of people tested and the
coverage. The increase in the number of test kits used was in response the Universal test and treat program ( UTT) that was introduced in
September 2016. The support of Partner Broad Reach and other Community Based Organizations through additional Human Resource assisted
the district to be able to do Community testing. The implementation of UTT meant increase in the ARV Therapy expenditure as well.
The District Management over expenditure resulted from the out of adjustment of two officials one at level 12 and the other at level 10 at the
district that whom HR issues are not resolved.
Page 25 of 78Harry Gwala District Health Plan 2018/19
15 DISTRICT ASPIRATIONS AND INDICATOR TARGETS
List the District aspirations, and map to the Provincial DoH Strategic Plan 2015-2020 goals.
# District Aspiration Provincial Strategic Plan
2015-2020 Goal(s)
1. 1.1 Reduce neonatal mortality rate from 12.5 to 7.0 by 2021 Reduce neonatal and
under 5 years child mortality
1.2 Maintain under 5 child mortality below 5% by 2021
2. Reduce maternal mortality rate from 97/k to 95/k Reduce maternal mortality
2.1 Increase ANC visit before 20 weeks from 73.3% to 80% by 2021
2.2 Reduce teenage pregnancy rate from 10.4% to 7%by 2021
3 Improve Women’s Health Improve Women’s Health
3.1 Increase couple year protection rate from 69% to 80% by 2021
3.2 Increase cervical cancer coverage from 79% to 86% by 2021
4. Reduce HIV incidence using 90/90/90 strategy Manage HIV prevalence
4.1 Increases number of HIV test from 137449 to 197650 by 2021
4.2 Increase the number MMC from 5231 to 6432 by 2021.
4.3Mantain PCR positivity rate around 10 weeks atHarry Gwala District Health Plan 2018/19
# District Aspiration Provincial Strategic Plan
2015-2020 Goal(s)
to 391885 by 2021
5.4 Increase the cataract surgery rate from 1222.2 /1ml to 830 (per 1 million) to
2230/million by 2021
5.5. Increase the number of eligible clients accessing rehabilitation services
from 18687 to 19621 by March 2021
6. Improve patient experience survey rate from 82 % to 95% by 2021 Sustain a complaint
resolution rate of 95% (or
more) in all public health
facilities from March 2020
onwards
7. Improve compliance to the Ideal Clinic and National Core Standards Improve compliance to the
Ideal Clinic and National
Core Standards
7.1. Increase percentage of clinics scoring above 80% on ideal clinic
realisation from 53% to 80 %y 2021
7.2 Increase percentage of health facilities (district hospitals) scoring above
80% on extreme and vital measures of National Core Standards from 0% to
100% by 2021
8. Accelerate implementation of PHC re-engineering Accelerate implementation
8.1 Increase PHC utilisation rate (adult) from 3 to 3. 1 by 2021. of PHC re-engineering
8.2 Increase PHC utilisation rate childrenHarry Gwala District Health Plan 2018/19
# District Aspiration Provincial Strategic Plan
2015-2020 Goal(s)
10, 4 Maintain cost per PDE within R2250
11. Reduce deaths due to injuries within 14 to 24 age group of males ( High
according District Health Barometer)
Page 28 of 78Harry Gwala District Health Plan 2018/19
16. Indicator Targets for Theory of Change (impact, outcome and output) of aspirations
District Aspiration 1:
District Aspiration Indicato Audited Audited Audited Estimated Target Target Target
performance performance performance performance 2018/19 2019/20 2020/21
2014/15 2015/16 2016/17 2017/18
Type
Inpatient neonatal 18.7 13.6 12.5 12 14.6 7.0 7.0
death rate
Numerator 163 109 95 66 111 558 586
Impact
Denominator 8705 8009 7593 5627 7593 7973 8371
District Aspiration 1. 1.1 Reduce under 5 child mortality rate from
PCR Positive around 1.5 0.9 0.8Harry Gwala District Health Plan 2018/19
District Aspiration Indicato Audited Audited Audited Estimated Target Target Target
performance performance performance performance 2018/19 2019/20 2020/21
2014/15 2015/16 2016/17 2017/18
Diarrhoeal 3.1 2.5 2.5 5 2.6 2% 2%
Output Numerator 24 13 14 12 11 7 4
Denominator 777 529 571 325 529 364 191
District Aspiration 2:
District Aspiration Indicator(refer to Annex C for Audited Audited Audited Estimated Target Target Target
the proposed indicator names performance performance performance performance 2018/19 2019/20 2020/21
for health 2014/15 2015/16 2016/17 2017/18
outcomes/programmes)
Maternal deaths 136/k 97/k 92/k 97/k 95/K 95/K 95K
Numerator 12 8 7 6 6 8 8
Impact
Denominator 8797 8227 7593 6212 7593 8608 9005
Reduce maternal death rate
Delivery in facility 9.7 9.9 10.4 24.1 7.2 7% 7%
under 18
year’s
Outcome
Numerator 850 800 796 460 551 562 586
Denominator 8750 8050 7650 1904 7650 8033 8371
ANC 1ST visit be 57.1% 64.6% 73.3% 73% 84% 80% 80%
Out
put
before 20 weeks
1.
Page 30 of 78Harry Gwala District Health Plan 2018/19
District Aspiration Indicator(refer to Annex C for Audited Audited Audited Estimated Target Target Target
the proposed indicator names performance performance performance performance 2018/19 2019/20 2020/21
for health 2014/15 2015/16 2016/17 2017/18
outcomes/programmes)
Numerator 6593 6460 6790 6683 8707 8678 9111
Denominator 11507 10007 9393 9155 10332 10847 11389
Antenatal clients 97.6 93.4 93.0 94% 100% 100% 100%
initiated on ART
Numerator 2359 1695 1513 944 1612 1434 1708
Denominator 732 1823 1627 1089 1612 1434 1708
N/A N/A N/A N/A N/A N/A N/A N/A
Outcome
Numerator N/A N/A N/A N/A N/A N/A N/A
Denominator N/A N/A N/A N/A N/A N/A N/A
Mother Post-natal 72% 72% 64.2 70.3 85% 90% 90%
visit within 6 days %
Numerator 6296 5858 4915 5335 6503 7230 7534
Output
Denominator 8750 8050 7650 7614 7650 7650 8371
I
District Aspiration 3:
District Aspiration Indicator Audited Audited Audited Estimated Target Target Target
performance performance performance performance 2018/19 2019/20 2020/21
2014/15 2015/16 2016/17 2017/18
Type
m
m
w
’s
A
p
a
p
a
o
o
o
e
e
e
n
n
h
h
3
v
ti
lt
ir
s
r
:
:
I
Page 31 of 78Harry Gwala District Health Plan 2018/19
District Aspiration Indicator Audited Audited Audited Estimated Target Target Target
performance performance performance performance 2018/19 2019/20 2020/21
2014/15 2015/16 2016/17 2017/18
Couple year 22% 63% 75% 33% 80% 80% 80%
Protection
Outcome
Numerator 70511 82457 121037 45148 108722 110842 112561
Denominator 324019 131739 1609620 135141 135903 138552 140701
Cervical Cancer 81.8 73.4 110% 79.1 85% 85% 85.9%
screening
Numerator 6822 6641 10133 7152 13615 81021 83197
Output
Denominator 137102 90012 111216 35951 16018 95319 98232
District Aspiration 4:
District Indicator Audited Audited Audited Estimated Target Target Target
Aspiration performance performance performance performance 2018/19 2019/20 2020/21
2014/15 2015/16 2016/17 2017/18
MMC 6035 4854 5213 7396 5601 6432 5895
&
p
o
e
c
n
u
P
1
9
0
st
s
s
t
r
i
HIV test done - 144 221 135 444 319 015 137449 189616 231694 197650
Out
put
total
Type Male condom 8061653 10804875 11469300 3048000 8718602 14009823 15410805
distribution
Female condom 84392 192427 228074 181542 241925 253268 265931
distribution
Number of clients 1998 7795 10249 7059 10710 12011 12612
m
O
d
o
e
c
n
u
2
9
0
9
0
9
0
t
-
-
Page 32 of 78Harry Gwala District Health Plan 2018/19
District Indicator Audited Audited Audited Estimated Target Target Target
Aspiration performance performance performance performance 2018/19 2019/20 2020/21
2014/15 2015/16 2016/17 2017/18
started (adult) on
ART
number of clients 98 297 349 10 337 365 388
2nd
Out
me
90-
90-
co
90
started (children
Outcome TROA 38894 46656 49519 55776 61984 77064 82120
2nd 90-
90-90
Viral load 83.3% 84.6% 92.2% 92.3% 90% 90% 90%
Outcome 2n 90-90-
suppression @ 6
months
Numerator 2171 4002 4741 1155 10271 10024 10530
90
Denominator 2606 4728 8193 1252 11412 11138 11700
Viral load 42.4% 46% 62.7% 90% 90% 90% 90%
completion at
6months
Numerator 2606 4728 5141 1252 10271 11138 1300
Denominator 6144 10332 18193 1863 11412 12376 13300
District Aspiration 5:
District Indicator(refer to Annex C for Audited Audited Audited Estimated Target Target Target
Aspiration the proposed indicator names performance performance performance performance 2018/19 2019/20 2020/21
for health 2014/15 2015/16 2016/17 2017/18
outcomes/programmes)
Page 33 of 78Harry Gwala District Health Plan 2018/19
District Indicator(refer to Annex C for Audited Audited Audited Estimated Target Target Target
Aspiration the proposed indicator names performance performance performance performance 2018/19 2019/20 2020/21
for health 2014/15 2015/16 2016/17 2017/18
outcomes/programmes)
and
Hypertension New Indicator 2.3 11.3 26.0 25/1000 24/1000 23/1000
incidence
Aspiration: 5 Reduce premature mortality from NCD through prevention
Outcome
Numerator New Indicator 207 1021 2161 2080 2006 1940
Denominator New Indicator 88657 89951 83192 83192 83580 84337
Diabetes New Indicator 31.1/1000 10.36/1000 11.1/1000 8/1000 5/1000 3.1/1000
incidence
Outcome
Numerator New Indicator 2758 932 915 666 418 257
Denominator New indicator 88657 89951 83192 83192 83580 84337
Cataract Rate 177.6/1ml 562.5/1ml 683/1ml 577/1ml 1948/1ml 2019/million 2230/million
Outcome
Numerator 85 273 721 877 1000 1050 1175
Denominator 478535 485308 492203 506435 513362 520188 526956
Clients screened 8% 10% 36% 36.1% 37% 40% 45%
Output
for mental
disorders
treatment
Numerator 112339 150394 378939 541661 568744 624197 716266
Denominator 1 404 242 1 457 778 1 053 280 1501782 1539951 1560492 1591702
Page 34 of 78Harry Gwala District Health Plan 2018/19
District Aspiration 6:
District Aspiration Indicator(refer to Annex C for Audited Audited Audited Estimated Target Target Target
the proposed indicator names performance performance performance performance 2018/19 2019/20 2020/21
for health 2014/15 2015/16 2016/17 2017/18
outcomes/programmes)
TB death rate 6.1 6 7.5 5.2Harry Gwala District Health Plan 2018/19
District Aspiration Indicator Audited Audited Audited Estimated Target Target Target
performance performance performance performance 2018/19 2019/20 2020/21
2014/15 2015/16 2016/17 2017/18
Numerator 914 17 1210 1591 1670 1753 1840
Denominator 1099 708 1378 1643 1725 1811 1901
District Aspiration 8:
District Aspiration Indicator Audited Audited Audited Estimated Target Target Target
performance performance performance performance 2018/19 2019/20 2020/21
2014/15 2015/16 2016/17 2017/18
ALOS 5.1 5.1 4.9 5.0 5.0 5.1 5.1
Inpatient days 274698 164602 149505 156980 164829 173070 181723
Separations 33695 33330 30573 30781 32320 33936 35632
BUR 65.0% 63.0% 52.8 57.6 60.9 67.1 70.5
Inpatient days 274698 164602 149505 156980 164829 173070 181723
Inpatients beds 726 706 706 706 706 706 706
New not referred 39.8 62.7 74.9 61.2 50.1 41.0 33.5
Improve Hospital Efficiencies
cases
Numerator 69819 72320 56518 50866 45779 41201 37080
Denominator 178179 116128 75486 83034 91337 100470 110517
Cost per PDE 2162.8 2250 2685 2250 2250 2250 2250
Expenditure total 443822163 455367004 569916617 1 379 634 750
Page 36 of 78Harry Gwala District Health Plan 2018/19
District Aspiration Indicator Audited Audited Audited Estimated Target Target Target
performance performance performance performance 2018/19 2019/20 2020/21
2014/15 2015/16 2016/17 2017/18
PDE 231552 231903 212254 233479
District Aspiration 9:
District Aspiration Indicator Audited Audited Audited Estimated Target Target Target
performance performance performance performance 2018/19 2019/20 2020/21
2014/15 2015/16 2016/17 2017/18
PHC utilisation rate 2.9 3.0 3.0 2.6 2.7 3.0 3.1
Numerator 1404242 1457778 1254868 1317611 1317611 1560564 1633564
Accelerate PHC Re- engineering
Denominator 478535 485308 499428 506435 513362 520188 526956
PHC Utilisation rate 4.1 4.5 4.2 4.6 5.1 5.6 6.2
under 5yrs
Numerator 252714 280736 308809 339689 373657 411022 452124
Denominator 61967 62566 72589 73011 73061 72782 72257
Number of Health 11 12 11 19 22 26 30
Promoting schools
Page 37 of 78Harry Gwala District Health Plan 2018/19
17 BOTTLENECKS AND ROOT CAUSES
Summarise Bottlenecks and Root-causes in the template below along with the corresponding aspiration:
Bottlenecks / Challenges Root Causes District District
Aspiration # Aspiration
1.1. Poor communication & intersectoral co- Failure to understand dangers of herbal intoxication. 1 Reduce under 5 child mortality rate
ordination
1.2. Poor quality of care Reduce neonatal mortality rate from death rate
1.3.. Inadequate use of service delivery Delay/ ordering of equipment financial. from to by 2021
platforms and referral/linkages with
Inefficient monitoring of partogram 1
communities.
2. Shortage of neonatal equipment.
3. Poor Perinatal Care.
2. a. Poor quality of care Non adherence to guidelines and protocols 2 Reduce number of maternal deaths from 5 to 2 by
b. Inadequate use of service delivery 2021
platforms and referral/linkages with
communities
c. Poor infrastructure, medicine and
procurement and supply chain management
3a. Failure to understand indicators and targets Negative Staff attitude 3 Improve Women’s Health
b. Poor quality of care
4. Failure to understand indicators and targets Negative Staff attitude 4 Reduce HIV incidence using 90/90/90 strategy from
b. Poor quality of care 35.7to…by 2021
Poor quality of care Negative Staff attitude 4
4a. Poor quality of care Poor healthy lifestyle 5 Reduce premature mortality from NCD’s through
b. Poor communication & intersect oral co- prevention and treatment toHarry Gwala District Health Plan 2018/19
Bottlenecks / Challenges Root Causes District District
Aspiration # Aspiration
platforms and referral/linkages with
communities
6. Poor quality of care Negative Staff attitude 6 Improve patient satisfaction rate from 82 % to 95%
b. Poor communication & intersectoral co- by 2021
ordination
7. Poor communication & intersectoral co- Negative Staff attitude 7 Improve compliance to the Ideal Clinic and
ordination National Core Standards
Gaps in filling of client records Increase the number of clinics with Ideal Clinic
7.1 Quality of service Realisation Status from to Clinics by 2021
Poor performing indicators without monitoring
progress in quality
7.2 Communication and inter-sectoral improvement plans
coordination
Clinic committees are not empowered enough to
understand their roles and support
8.1 Service delivery platform Poor access due to geographical/topography 8 Accelerate implementation of PHC re-engineering
Transport route is redirecting the clients to outside the
8.2 Human Resource Sub-district
Shortage of staff has
Shortage of vehicles interferes with the outreach
schedule
9.1 Service delivery platform Noncompliance and defaulting of treatment 9 Improve TB outcomes
especially the males
9.2 Communication and inter-sectoral Beliefs and use of other methods resulting in late 9
coordination reporting
Associated comorbidities in one client(more than
one condition)
Stakeholders like Traditional healers and faith healers
Page 39 of 78Harry Gwala District Health Plan 2018/19
Bottlenecks / Challenges Root Causes District District
Aspiration # Aspiration
are not empowered to identify early signs and
symptoms of TB
10.1 Service delivery platform Implementation of UTT has improved quality of life 10 Increase bed utilisation rate from % to % by 2021
Clients not meeting admission criteria
Doctors not admitting patients consistently for
observations
Poor communication & intersectoral co- Lack of recreational facilities 11 Reduce deaths due to injuries within 14 to 24 age
ordination Increase in substance abuse group of males
c. Inadequate use of service delivery
platforms and referral/linkages with
communities
Page 40 of 78Harry Gwala District Health Plan 2018/19
18. KEY INTERVENTIONS
Population Geography Public Health Intervention Costing
District
Aspiration # Service
Life Course Key Population (Sub- Funding
Ward ** Key Intervention Root Cause** Delivery Amount
Group ** district)** Source
Platform*
1.1 0-28 days Neonates all All sub- All Wards Skilling Health Care providers Lack of skills (BLS), DH , PHC Voted funds
sexes districts on identification of danger reading of CTG and
signs on new born babies intervention
(ESMOE.
Failure to understand
Resourcing Health facilities with dangers of herbal
essential equipment. intoxication by the
communities PHC
Empower OMs on quality of
information to be discussed
with Clinic Committees.
Skilling of Health Workers on
Children under All sub- IMCI
1.2. 0-4 years
5 years districts Community dialogues on
dangers of herbal intoxication
2 10-40 years Women of ALL 2.1Skilling Health Care Lack of skills (BLS), DH &PHC
bearing Providers ( ESMOE . EOST) reading of CTG and
2.2. Monitor the availability of intervention
resources in health care
Page 41 of 78Harry Gwala District Health Plan 2018/19
Population Geography Public Health Intervention Costing
District
Aspiration # Service
Life Course Key Population (Sub- Funding
Ward ** Key Intervention Root Cause** Delivery Amount
Group ** district)** Source
Platform*
facilities including equipment Insufficient infra- structure DH, PHC
and HR. to provide medical air
2.3. Liaise with EMS in provision
of rapid interfaculty and
community transport system.
2.4 Provide support on sub-
district Child/ PPIP review Delayed EMS response DH, PHC
meetings to improve quality of time
labour and delivery
management
3. 10-40 years Young Women All Sub- 3.1 Extend of SRH services to Negative staff attitude DH, WBOT , Voted funds
& men. districts. the Youth at FET/TVETS. PHC
Child bearing 3.2 Promote dual protection.
stage women 3.3. Enforce Health workers
cervical cancer screening
norm
3.4 Conduct value clarification
4. 1.5 and older Males and All All Develop partnerships with Poor intersectoral DH,PHC Voted Funds,
Females community based partners to coordination CG
service key populations to
increase HTC coverage.
4 All age groups Males and All All Monitor the implementation of Negative staff attitude DH, WBOT. Voted funds
females UTT in facilities PHC &CG
Provide NIMART mentorship Lack of skills in HIV
Conduct value clarification management
Page 42 of 78You can also read