Structured Common Project Financing (SCPF): Efficiency without Debt Mutualization Christian Bauer Marc Patrick Adolph Research Papers in Economics ...
←
→
Page content transcription
If your browser does not render page correctly, please read the page content below
Structured Common Project
Financing (SCPF): Efficiency without
Debt Mutualization

Christian Bauer
Marc‐Patrick Adolph

Research Papers in Economics
No. 2/20
Structured Common Project Financing
(SCPF): Efficiency without Debt
Mutualization
Christian Bauer* Marc-Patrick Adolph
April 26, 2020
Abstract
We propose Structured Common Project Financing (SCPF) as a sta-
ble, beneficial and political feasible financing tool for special purposes, e.g.
Corona-Bonds, Green Deal Financing, Common Forces Budget. SCPF is an
ABS-based common financing tool managed by a supranational organization
like the ESM or the EIB. Our approach allows overcoming the huge and emo-
tionally influenced political obstacle of joint liability by marginalizing the
degree of jointness. SCPF creates significant interest savings compared to
individual financing, 0.6% p.a. in the benchmark case. It is stable over time,
robust to the emission of subgroup scenarios as e.g. a PIIGS bond and an EU-
6 bond, and insensitive to the evolution of the macroeconomic environment
(risk-free interest rate).
Keywords: Structured Common Project Financing, Joint Liability, Fiscal
Union, EMU, Sovereign Debt, ABS, Corona-Bonds
* University of Trier, Universitätsring 15, 54286 Trier, Germany, bauer@uni-trier.de
University of Trier, Universitätsring 15, 54286 Trier, Germany, adolph@uni-trier.de
1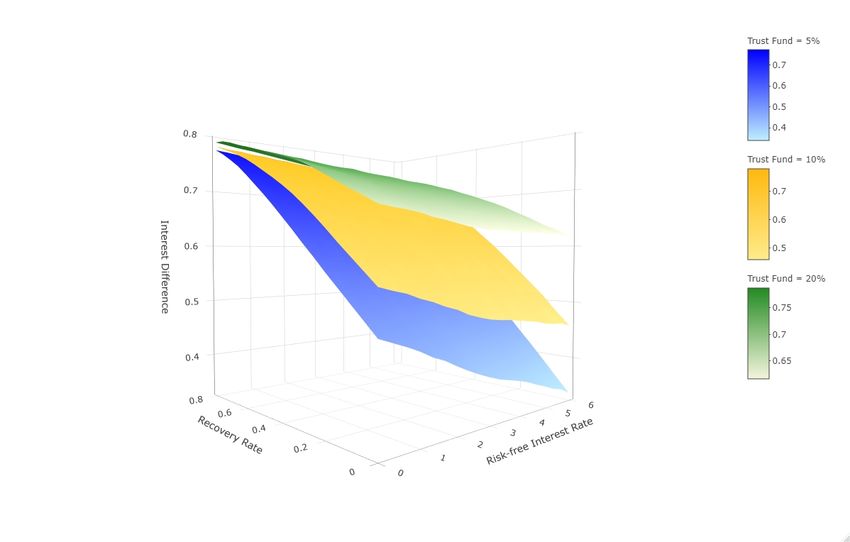
1       Introduction

Not just in the recent crisis common financing has been a heavily debated topic in
the academic, political and public community. Yet recently, the debate has gained
speed and intensity as from the need for support and solidarity from struggling
countries like Italy and Spain, the term Coronabonds emerged.
    Summarizing, there are two opposing views on the topic. The one side highlights
the macroeconomic advantages like a true European yield curve, increased availabil-
ity of a safe asset, higher stability and the removal of the asymmetry of monetary
and fiscal union. A common fiscal system is seen as the necessary and reasonable
next step in the evolution of the European system. The other side worries about the
mutualization of sovereign debt, moral hazard and increasing debt levels and fears
the loss of national sovereignty.
    Structured Common Project Financing (SCPF) is a way to establish joint fi-
nancing of European projects, like solidarity measures for Corona losses, the Green
deal or Common Forces. It also works well for smaller groups of countries as we
show below.
    Typically common financing approaches come along with joint liability, moral
hazard, interest saving and increased macroeconomic stability. Our approach keeps
the benefits but reduces the disadvantages to a marginal minimum. SCPF allows
overcoming most of the economic and political obstacles by installing an intermedi-
ary institution and an optimized small share of joint liability which still generates
significant interest savings1 and is politically feasible, stable and robust to vary-
ing macroeconomic circumstances. In contrast to the introduction of Eurobonds,
SCPF is designed to finance certain European projects, and thus does avoid many
of the problems assigned to the introduction of a truly joint European fiscal system.
However successful SCPFs could serve as a blueprint for a joint European fiscal

    1
     Interest savings reach 0.6 percentage points depending on the degree of joint liability even in
the current economic environment. Based on an efficiency optimal degree of joint liability between
16% and 29% of each countries individual share, we can price the political cost of joint liability.
Due to risk diversification, countries with high-interest load are most profitable for the community
while AAA country participation enhances the structures credibility.

                                                 2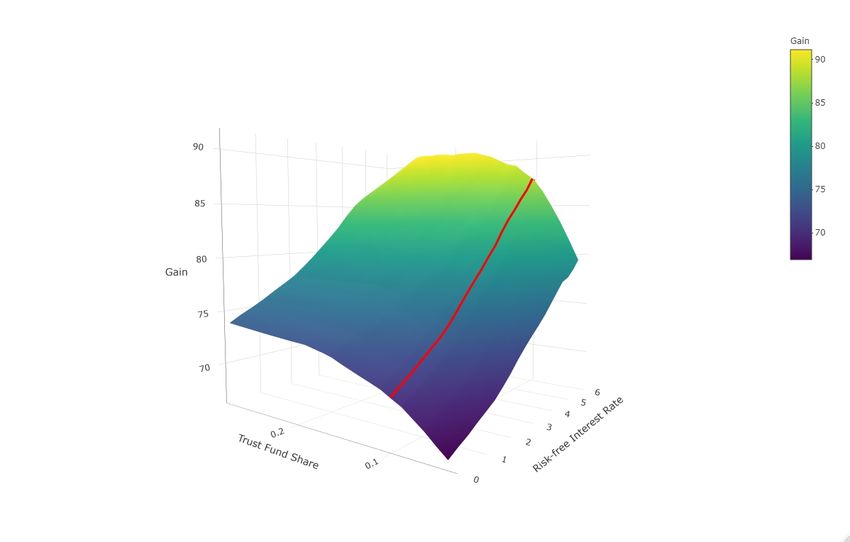
system.
    The core element of SCPF is an Asset-Backed-Security (ABS) structure issued
by a supranational institution like the ESM or the EIB which is additionally en-
hanced and strengthened by a security buffer.2 Closest in the literature are the
structured Eurobonds approaches in Hild et al. (2014), Bauer and Herz (2019) and
Brunnermeier et al. (2016) where the latter can be easily extended with a security
buffer. While preserving the general macroeconomic and fiscal advantages, SCPF,
in addition, allow the interest gains to be redistributed or used for project purposes.
Suitable distributions increase the internal stability and reduce moral hazard.
    Structured Common Project Financing yields positive economic effects at low
costs and enhances public opinion about the European project. As a consequence,
SCPF raises expectations on economic conditions and therefore support the public
opinion of both SCPF themselves and the European Union in general.
    The rest of the paper is structured as follows. Section 2 presents the structure
of SCPF in detail highlighting the theoretical background on advantages and dis-
advantages. Section 3 has a look at the data and methodology. In section 4 we
discuss the optimal degree of joint liabilities, while in section 5 different settings
and robustness checks are presented. Section 6 concludes our findings.

2       Theoretical Background

2.1     General approach

The approach introduces an intermediary between the originators of the debt and
the capital market. This intermediary is a special purpose vehicle (SPV) established
by a supranational organisation like the ESM or the EIB. By doing so, we can
disconnect or marginalize most of the problems attached to common financing while

    2
     In a simulation, we use an interest premium paid by the structure of 0.3% to account for
potential uncertainty aversion of investors as this is a new product and still get significant interest
advantages. Since all elements are standard and market depth is large, so this premium should
cease within a short time, e.g. a second or third tranche should be issued without such additional
costs and the interest advantage will boost.

                                                  3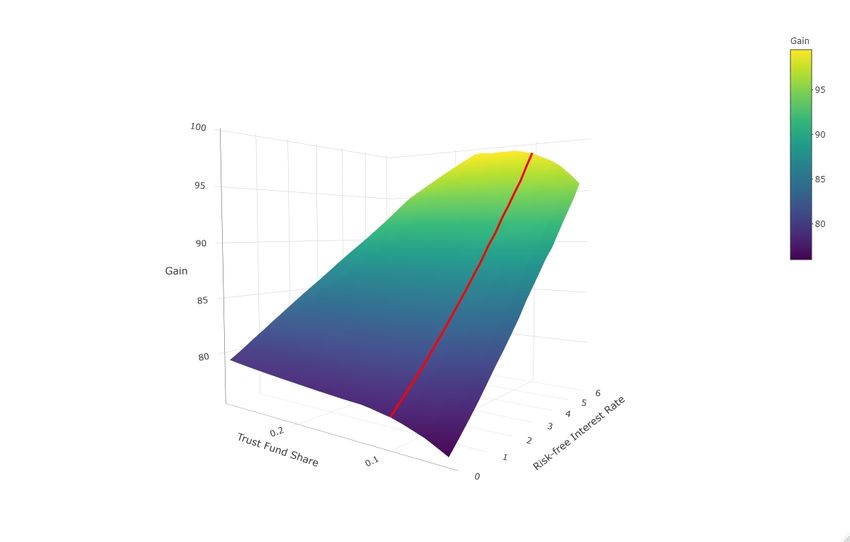
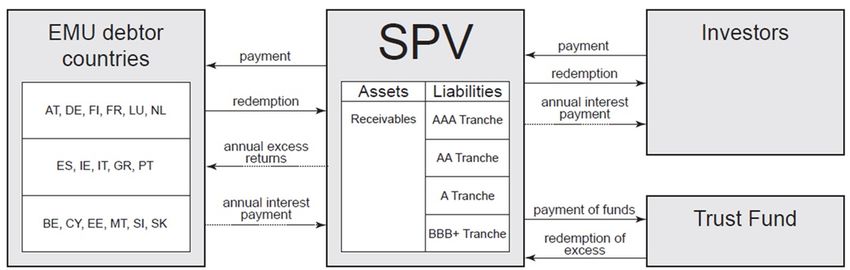
being able to preserve most characteristics beneficial to the group as a whole. Figure
1 depicts the main elements. (1) The originators issue bonds of a common maturity
and with a market conform interest rate directly to the SPV. (2) The SPV collects
these bonds, builds different risk tranches of them and creates the security buffer
(trust fund). (3) The refinancing is performed by selling the separate tranches to
the capital market.
    There are three main participants in ABS structuring as shown in figure 1: (i) an
independent SPV acts as an intermediary between (ii) originators and (iii) investors.
The SPV buys a portfolio of debt instruments to first pool and then tranche these
assets. To finance the portfolio the SPV issues claims with different characteristics
such as the level of seniority, risk, rating and yield - the tranches. In our case, the
ESM takes the role of the SPV while the beneficiary countries correspond to the
originators. The trust fund takes the role of the lowest tranche, the so-called equity
tranche. In case of insufficient payments by the beneficiaries, losses are covered
first by these funds which thereby create an additional security buffer (trust fund)
for investors and thus improve the ratings of the higher tranches. Joint liability
is limited to the fund which has an optimal size of 10% of the nominal volume of
issued debt for each country.3 Losses that exceed this size will cause depreciation of
the junior tranches.4

                                 Figure 1: Structure of the SCPF

   3
      In chapter 4 we discuss the optimal size of the trust fund. A size of 0 is very costly, as the
so-called equity tranche is the riskiest one and investors would demand an extremely high interest
rate. In private bank ABS constructs, typically this tranche is held either by the originating
financial institution or by specialized hedge funds.
    4
      In the appendix A we discuss the details of the ABS construction.

                                                 4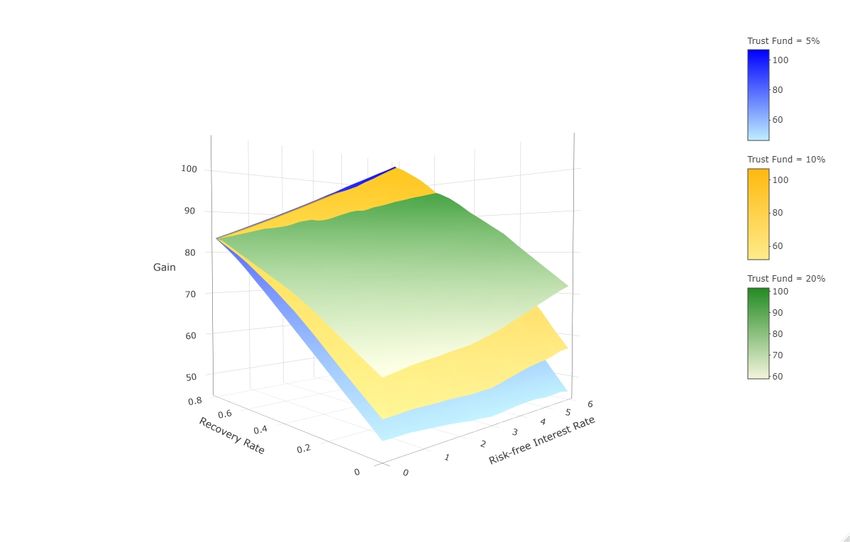
In the core of this construct, the SPV buys a portfolio of bonds of all participating
countries.5 After this pooling of assets, tranches with different risk and interest
payments are issued. The diversification and tranching effects allow to exploit the
nonlinear relation of default risks and interest rates and thus to generate interest
surpluses in excess of the extra costs of the trust fund and an uncertainty premium
for the first issuance.

2.2     The SPV

2.2.1    ABS: Diversification, tranching and interest rates

Markets’ evaluation of bonds shows an implicit risk aversion as the expected yield of
low risk (high rated) assets – including default risk – is lower than the expected yield
of high risk (low rated) assets. An ABS structure allocates the original cash flow
to different risk tranches and realizes an interest advantage between the refinancing
cost of the different tranches and the payoff of the underlying assets. By using
securitization tools net gains can be generated as new assets are created, which are
better tailored to individual investors’ preferences. A straightforward rationalization
for these gains is related to market participants demanding increasing risk premiums
above the risk neutral expected value for risky assets.
    The newly issued tranches have a lower average interest rate than the weighted
average of the single issuance interest rates of participating countries since sovereign
yield curves clearly show the market’s risk aversion. Since coupon rates on the nom-
inal value of bonds are driven by ratings and the corresponding default probability,
this advantage can also be gained with Structured Common Project Financing.
    Tranching of assets is basically a process of risk allocation. Instead of issuing
one bond with a given rating, risk and yield, the ESM-ABS offers several tranches
with different priority, creditworthiness and thickness. In this cascading structure

   5
     To avoid additional uncertainty and issuer risks, these portfolios must be filled with physical
bonds and not through synthetic contracts like credit default swaps (CDS). Collateral Default
Obligations (CDOs) are a special type of ABS which uses sovereign bonds as collateral. A deeper
explanation of CDOs, their pricing and the correlation effects can be found in Longstaff and Rajan
(2008), Coval et al. (2009b) and Coval et al. (2009).

                                                 5
high-rated tranches pay lower yields than tranches with a high risk and low rating.
The highest-rated senior tranche has priority on cash flows and therefore carries the
lowest risk. Subordinated tranches receive cash flows only after the senior tranche is
fully served. Their rating is lower and due to higher risk, they deliver higher yields.
Although ABS are commonly associated with both tranching and diversification,
it is the tranching procedure and its efficiency gains that are at the core of ABS.
The diversification effects support and amplify these tranching effects. The higher
the diversification the larger the AAA tranche and the higher the interest gains.
Hence, ABS with a low number of assets as in our case are nothing unusual in
structured finance. Obviously, the current ESM financing structure is subject to the
same diversification effects.
2.2.2 The trust fund
The trust fund is one of the innovations of our approach. It is equivalent to the equity
tranche in standard ABS constructs and takes first losses in case of a default. Since
the trust fund is financed through a part of the government debt it bears financing
cost in the form of the interest rate difference between the individual countries rates
and the risk free rate. On the other hand, it increases the risk structure of the SCPF
significantly, improves the structure of the tranches and thus lowers the interest costs
of the SCPF. In chapter 4, we show that cost optimal levels of the trust fund range
from 16% to 29%. We also show that a fixed rate of 10% shows only marginal
losses in efficiency. A fixed rate, however, is politically more feasible than individual
optimizes estimates which are sensitive to the model calibration and thus subject to
possible debates.
In the benchmark scenario, the interest gain of the 10% trust fund is 0.6% relative
to the no trust fund scenario. The optimized reserve level is 29% in absolute gains.
Relative to the nominal, the gains are slightly lower with 0.5%. Thus the additional
absolute gains reached by fully optimizing is relatively low compared to the potential
political cost of an argument about the exact value.
6The trust fund is the only element that resembles a sort of joint liability since
it is a jointly financed fund that covers first losses and losses only occur in case
of sovereign defaults. Since the ”joint liability - moral hazard” problem6 is one
of the largest political barriers to the introduction of any common financing, our
SCPF approach yields a convincing counter narrative. Usually, in the political
debate issuing bonds with joint liabilities comes down to the argument ”We [the
’strong’ countries] will have to pay for your [the ’weak’ countries’] debt.” E.g., in
September 2011 German Chancellor Angela Merkel said in the German Parliament
that Eurobonds are only a ”communitisation of debt” and a ”way into a debt union”.
One year later she said that Eurobonds will not be established ”as long as I live”. In
the current debate on Corona bonds, this position again outmatches any solidarity
and economic efficiency arguments.
2.2.3 The supranational institution and sovereign issuance
An important element of SCPF is the direct issuance of sovereign bonds to the SPV
of the supranational organization. By directly selling the bonds to the SPV two main
advantages can be established. Firstly, there are no friction losses nor incentives of
market participants for speculation or price manipulations. Secondly, since SCPF is
strictly project oriented the influence on the individual bond market should be very
small. Thereby the problems coming along with the introduction of Eurobonds will
not apply. There will be a market for sovereign bonds and thus a market measure
6
Of course, joint liability means an additional risk and thus hard financial costs and there is
a serious academic and political discussion about the moral hazard involved in common financing.
The debate whether full common issuance will set negative incentives for countries with refinancing
problems, e.g. through a financial crisis, is controversial. More stable countries, e.g. Germany, fear
a situation in which they de facto have to pay for countries which use SCPF as a cross-financing
instrument. This means that countries with refinancing problems can borrow money from the
capital market in a higher volume than in a single issuance scheme. This is due to a good rating
and a high nominal volume which allows borrowing money at a low interest rate and the effect
of one country needing more money is not crucial for the whole SCPF scheme. If they cannot
repay the debt, they default and the other countries in the SCPF system, e.g. the more stable
countries and especially their taxpayers, have to repay the debt of the defaulted country. The joint
liability of SCPF is widely seen as the demise of a common budget authority. Also, the design of
the SCPF system has to account for defaults of single countries to prevent negative impacts on the
credibility of the system itself with a subsequent probability of super-contagion-like effects. The
SCPF approach with its only marginal level of jointness is not subject to these fears.
7for interest rates and bonds prices. In contrast to a transformation of the entire
sovereign financing to a common structure, SCPF does not entail market liquidity
and market depth problems distorting the residual bond markets.7 Since SCPF
targets financing of large projects, market liquidity is ensured.
Also, since bonds issued to ESM or EIB are not part of the collective default
clause, a settlement of these debt are possible even in case of a sovereign default.
Therefore, the default risk for SCPF debt would de facto be lower than the default
risk on regular bonds. In our simulation study, we cannot account for this additional
advantage since there is no reasonable measure for this effect.
2.3 Advantages and disadvantages of the approach
General advantages of common financing in Europe are as vast as the literature on
it. Most of it is connotated with the term Eurobonds.8 While we will not enter the
discussion of the political advantages of a deeper integration or the disadvantages
of a loss of sovereignty, the economic consequences are much clearer to analyze.
Common financing reduces interest expenses and deepens the market for sovereign
bonds. In our benchmark scenario, the share of AAA bonds is 77% and thus more
than twice as high as with single issuance.9 Another advantage is the creation of
an equivalent to the US-American T-Bill market and supply the financial markets
with a new market based and tradable Eurozone wide yield curve.10 A higher share
7
On the national level, after the introduction of full common financing, the decreasing liquidity
in the remaining sovereign country-specific bonds will be challenging for the fiscal authorities.
Also, there will be increased uncertainty in rating single country bonds when liquidity is low in the
remaining individual markets. Due to lower liquidity, existing bondholders will face some liquidity
premia which lowers their yield. Also, new issuances will be more costly for issuing countries - if
they don’t want to be part of the common financing programme - since the demand is lower with
existing common bonds.
8
First ideas of joint issuance of sovereign bonds have already been published by the Giovannini
Group (2000). The variety of approaches proposed thereafter is wide. The Securities Industry and
Financial Markets Association (2008) and Claessens et al. (2012) give overviews of the proposals.
Brunnermeier et al. (2016) elaborates on the macroeconomic advantages.
9
Typical advantages of a broader switch to common financing, like higher liquidity in the
sovereign bond market due to a less fractionated bond market or a strengthened role of the Euro
as an international reserve currency, only partially apply.
10
To create a yield curve, issuance has to be in various maturities. Given the project character
of SCPF this might be possible only for certain large or continuous projects like the Green Deal
or common Forces.
8of common finance bonds in banks’ balance sheets might even be able to solve the
sovereign-bank nexus. Cronin and Dunne (2019) use the approach of Brunnermeier
et al. (2016) as the basis to show that tranching is advantageous to the senior bond
holders. They found that the spillover effects from higher-risk countries are reduced
and the effect declines during the time of a financial crisis. This can be beneficial for
banks holding the senior tranche. They see the same affects for an additional mez-
zanine tranche which indicates that the advantage is also observable for SCPF-ABS
structures.
In contrast to a standardized system of common financing with full joint liability,
the strict limitation of joint liability marginalizes the risk of moral hazard. Since
the SCPF is a strict project oriented form of financing, the benefits from a sovereign
default are limited to the involvement to this project but the cost include not only
the typical political and economic cost of a default but also the lost revenues of
participation on future SCPFs. In addition, since bonds issued to ESM or EIB are
not part of the collective default clause, a settlement of these debt are possible even
in case of a sovereign default.
Finally, SCPF creates significant net interest advantages over the individual
issuance. Even after subtracting expected losses from defaults11 and the interest
cost for the financing of the trust fund, the net profit is 0.6% p.a. in the benchmark
case.
The interest savings can be distributed according to a predefined scheme. Pos-
sible distributions include a cashback for all participating countries, bonuses depen-
dent on political goals like meeting targets of the stability and growth pact, support
for countries with special needs, the general support of the SCPF project goal or
increase the financial base of the supranational organization that handles the SPV
to ease the emission of the following SCPF.
The result is very insensitive to the riskless interest rate, as we see from the
11
We use a conservative market based measure for the default probability which does not ac-
count for the reduced the default probability for ESM/EIB bonds. While such an estimate would
significantly boost our results we have found no scientifically reliable way to estimate this political
variable.
9analysis in chapter 4. The interest advantage increases approximately by 0.01% per
percentage point increase of the risk-free rate. Therefore our analysis also applies
for negative AAA interest rates.
3 Methodology and Data
3.1 Methodology
Our analysis follows the model introduced by Hild et al. (2014). A SPV is es-
tablished which buys a portfolio of bonds of the participating countries and sells
different tranches with different interest rates to the capital market. A trust fund
(in the benchmark model 10% of the issued nominal volume) absorbs first losses and
invests the capital at the risk-free interest rate. If a country defaults and the cash
flows cannot be served, the trust fund steps in while the recovered nominal value is
transferred to the trust fund and the country drops out of the scheme.
The probability of default of every country is calculated using the method of
Sturzenegger and Zettelmeyer (2010). They use CDS-spreads and recovery rates to
calculate the default probability. As a benchmark, we use a fixed recovery rate of
50%. Other possible methods to calculate a default probability have been shown
by Polito and Wickens (2015) and Bi (2012). In the first article a rolling-window
VAR model has been used while in the second risk premia are matched to default
probabilities in a closed economy model. Polito and Wickens (2015) mainly focus
their analysis on the possibility of countries to repay the debt by tax revenues and Bi
(2012) uses a model with several macroeconomic factors. Since none of them presents
a connection to the recovery rate, we stick to the method of Sturzenegger and
Zettelmeyer (2010) and assume that the market appropriately displays the default
probability.
We apply the strongest possible parameter values for contagion effects to present
the most conservative model. For this, we assume the highest possible correla-
tion without violating the default probabilities of every participating country. This
10means that if one country defaults all countries with a higher default probability
also default. Also, we do not allow a member to come back into the SPV after
defaulting once. If a country defaults, it falls out of the SPV and the nominal which
can be recovered is transferred to the trust fund.
In this paper, we present results for a period of ten years to model long-term re-
financing. After this time the remaining capital in the trust fund is redistributed to
the non-defaulted countries. We allow for two different distribution methods of the
net surplus, even or relative, although other distribution schemes are possible to set
political incentives. In this context, an even distribution means that the net surplus
is allocated according to the individual debt level. In the relative case, the funds are
distributed in relation to the interest payments. The first method is better for coun-
tries with high nominal volume and low-interest rates, i.e. AAA countries, whereas
the second method is advantageous for countries with a high-interest burden, e.g.
PIIGS countries. Therefore, it is a political topic to decide between the methods of
distribution. The direct economic advantage, i.e. the average interest reduction for
the debtors, is independent of this distribution. But the indirect advantages, e.g.
higher economic stability through repayment schemes based on prudential economic
policies or low budget deficits, do indeed depend on the outcome of the political
bargaining process defining the distribution schemes.
We run Monte-Carlo simulations to find the structure and calculate the extra
costs and gains/losses. The simulation is done with m=100,000 loops.
3.2 Data
For the calculation, we need the yields of the government bonds of every single
member country of the EMU. We additionally need the CDS-spreads for different
rating classes to calculate the interest outflows from the SPV to the capital market.
We thus include the issuer risk assigned to non-sovereign bonds into our model.
Since these spreads are not available for every single possible rating, we use a spline
interpolation to approximate the few that are missing. The 10-year CDS-spreads for
11every member country are taken to derive their probability of default. These datasets
and the rating of every member country are taken from Reuters Datastream for the
end of August 2018, the end of December 2012 and the end of December 2008. The
three dates are chosen to represent current circumstances, the European sovereign
debt turmoil and the financial crisis starting in 2008, respectively. The individual
interest rates of every participating country can be found in the appendix table A.1.
Sovereign debt and GDP to calculate the issued volume of debt are also taken for the
end of July 2018 or the latest possible date from Eurostat, the European statistical
centre.
3.3 The Benchmark Case
For the calculation of the benchmark case, we apply a maturity of 10 years. With
regard to the current Corona crises shorter maturities seem not reasonable.12 Since
the SPV is set up by an international organization like the ESM or the EIB, we
assume that interest payments by the structure for the AAA share are equivalent to
German rates.
In the benchmark case, we get the following results:
Average interest rate paid by the structure: 0.4 %
Average interest rate paid by countries: 1.1%
Net expected interest savings: 0.6%
Rating AAA AA+ AA AA- A+
Thickness 77% 4% 14% 2% 3%
As a first robustness check, we added a risk premium estimated from sovereign
CDS spreads resulting in net savings of 0.4%. Even after additionally correcting for
an uncertainty premium of 0.3% for a new product we face a positive net savings of
approximately 0.1% per year.
12
In our robustness check, we also analyzed shorter maturities. The p.a. interest gains decrease
with the maturity, i.e. our benchmark case is a very conservative estimate.
12Since all three scenarios deliver positive results and we assume an issuance
through an supranational organization, we will stick to the benchmark case. This
is the basis for further analysis.
4 Optimal degrees of joint liability
The initial trust fund volume is a crucial determinant of both the political bargaining
process and the economic advantages of Structured Common Project Financing.
The trust fund is equivalent to the degree of joint liability every country is willing
to choose. The main implications of a larger trust fund are (1) an increased security
buffer for the investors resulting in a more efficient tranching and lower average
interest rates, (2) an increase of the void interest payments of the participating
countries as the trust fund share is also credit financed and (3) an increase of the
risk of the participating countries to lose money in case of a default of a member
and thus a potential increase of moral hazard. The financial net effect of the trust
fund for the participants is nonlinear in the size of the trust fund and also depends
on other parameters like the global financial situation and the recovery rate.
In the efficiency optimum, the positive marginal interest rate reduction is offset
by the marginal financing cost of the trust fund. The political and economic risk
is an additional argument in the political bargaining process that determines the
realization of the trust fund size. Therefore the optimal level of the security buffer
is below its efficiency optimum. The deviation from the optimum is the political
price for the joint liability risk. To minimize political frictions in the initiating
process, we argue that a fixed rate is to be preferred to an dynamically adjusted
one.
First, we examine the effects of the trust fund on nominal gain and interest rate
advantages generated by SCPF. In figure 2 we have a look at three benchmark shares
- 5%, 10%, and 20% - and their impact on the nominal gains as a function of the
recovery rate and the risk-free interest rate. In all scenarios, the recovery rates have
a qualitatively similar positive effect. The sensitivity to the recovery rate, however,
13Figure 2: Nominal gains in a SCPF scenario with different trust fund shares over a grid of several
recovery values as well as risk-free interest rates.
decreases with the trust fund size, since a larger trust fund stabilizes the repayment
cash flow and thus enhances the structuring. The effect of the risk-free interest rate is
dependent on several factors. It is neither strictly positive nor strictly negative. For
low recovery rates, the effect is negative with decreasing gains for growing interest
rates. For higher recovery rates we can observe a change and the effect is strictly
positive for increasing interest rates. The respective reversal point in the recovery
rate is dependent on the initial trust fund share. For a trust fund of 5% the reversal
takes place at a recovery rate of 10% whereas for a 20% trust fund share the effect
is positive for every recovery rate. This can be explained by the interest generated
within the trust fund which depends on the risk-free interest rate. In addition, a
larger initial trust fund can even bear losses when the recovery rate is low. In this
case, the sensitivity to the risk-free interest rate decreases with the trust fund size.
For an assumed total issuance of 10% of GDP (1240 billion Euro), the gains reach
from 46.60 billion Euro to 106.78 billion Euro. These extremes both happen in a
5% trust fund and 6% risk-free interest rate scenario with the recovery rate ranging
from 0% to 80%.
14Recovery rates used in the literature and which are implied in market estimates
from CDS spreads typically lie between 40% and 60%. For these rates the sensitivity
of the gains with respect to the risk-free interest rate is marginal. The maximum dif-
ference between a crises environment with risk-free rate of 0% and a macroeconomic
boom scenario with a rate of 6% is 19.66 billion Euro or 0.03% p.a.
For recovery rates below 60%, gains rise with the initial trust fund share but this
effect is reversed for higher recovery rates. The marginal effect of the trust fund
share on the average rating of the structure declines while the individual countries’
marginal interest rate burden to finance it remains constant.
We also see that excess returns of the SCPF are closer to each other for low
risk-free interest rate and diverge stronger for higher values. For low interest rates
the differences range only from 0.03 to 0.17 billion Euro, i.e. the structure is not
sensitive w.r.t. the trust fund share in a low-interest rate environment.
Figure 3: Interest rate difference in a SCPF scenario with different trust fund shares over a grid
of several recovery values as well as risk-free interest rates.
The results highlighted in figure 3 present the interest savings of SCPF, i.e. the
net gains displayed in figure 2 less the financing cost of the trust fund. We see
that the topmost layer, which is representing the 20% initial trust fund rate, has
15the flattest slope and the lowest layer (5%) the steepest slope. Low trust fund
structures are more sensitive to changes in recovery rate and risk-free interest rates.
This interest advantage (of a smaller initial trust fund) is decreasing with higher
recovery rates because the risk structures and thus the tranching converges with
growing recovery rates.
We turn to optimize the trust fund size w.r.t. the countries’ net gain. We use a
benchmark recovery rate of 50%13 and vary the trust fund shares between 5% and
30%. The result can be seen in figure 4.14
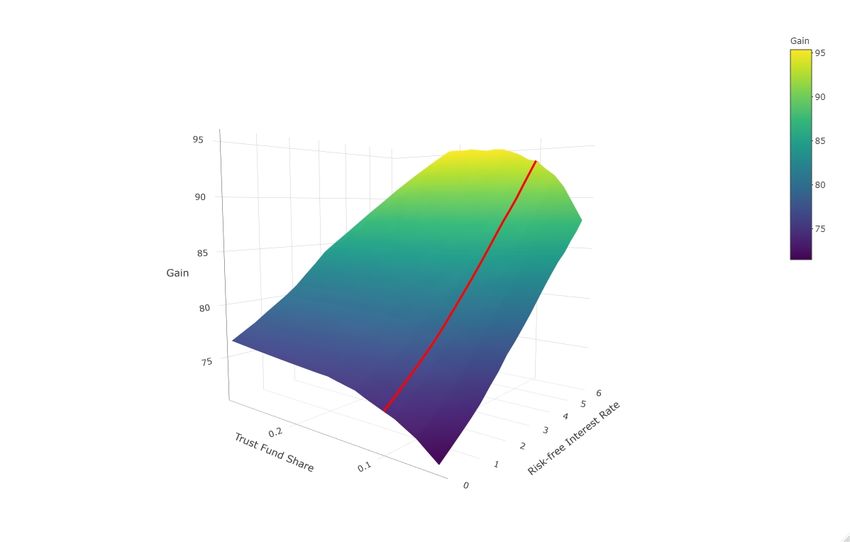
Figure 4: Sensitivity of gains for different trust fund shares and risk-free interest rates in a fixed
recovery rate scenario where it is fixed to 50%. Red line: Gains for a fixed trust fund share of 10%.
We see that the net gain as a function of the trust fund share is nonlinear,
asymmetrically inverse U-shaped and has a unique maximum. Dependent on the
risk-free interest rate, the efficiency optimal trust fund size is between 18% and
29%. The results are also absolutely supported for other recovery rates (see the
Appendix). We also see that the U-shape is quite flat in an environment of the
13
Meyer et al. (2019) and Cruces and Trebesch (2013) estimate haircut sizes of 44% and 40%,
respectively. This is equivalent to a recovery rate of 56% and 60%. We use a more conservative
assumption and fix the recovery rate at 50%.
14
Robustness checks with 40% and 60% recovery rate can be found in the appendix.
16efficiency optimum, i.e. not too large deviations from the optimum induce only
marginal efficiency losses. To illustrate our point, figure 4 depicts the gains of a
fixed trust fund share of 10%. We see that efficiency losses are below 3 billion
Euro which is about 0.025% p.a. Relative to the uncertainty involved in estimating
the relevant parameters like the recovery rate or changes in the macroeconomic
environment (risk-free interest rate), the efficiancy loss seems marginal.
Summarizing, the recovery rate increases the monetary advantages of SCPFs
whereas the risk-free interest rate has a mixed effect which in addition is small for
intermediate values of the recovery rate. The higher the trust fund share, the higher
is the interest advantage and the lower is the sensitivity of gains to the recovery rate
and the global economic situation. But in the current low interest rate environment
the structure is not sensitive w.r.t. the trust fund share, i.e., in and after a global
recession it appears not advantageous to have a high degree of joint liability. On the
other hand, when interest rates return to normal levels again interest advantages
of SCPFs would decrease and the decline is faster the lower the degree of joint
liability. In the same instant, interest increases deteriorate the economic situation
of struggling members potentially decreasing their expected recovery rate and thus
inducing a very steep reduction of the SCPFs’ advantages if the level of joint liability
is low. It might currently appear reasonable to establish SCPFs with a very low
degree of joint liability, e.g. 5% or less, since there are only little losses in efficiency
compared to higher joint liabilities. This parametrization certainly is politically
much easier feasible and eventually the only way to overcome current reservations
against such structures in the northern countries. However, only sufficiently high
degrees of joint liabilities, 10% to 15%, ensure that the system remains significantly
advantageous (in financial terms) if the global economic situation returns to normal.
The efficiency of SCPF, i.e. the net gain which equals the interest advantage less the
financing cost for the trust fund, depends on the size of the trust fund. The optimal
degree of joint liability lies between 10% and 15%, dependent on the recovery rate
and the risk-free interest rate. However, the efficiency losses between the optimum
17and more extreme cases, like 5% or 30%, are quite moderate and remain below 20%
of the maximal gains. The results indicate that optimizing common liability has
positive effects on the gains of SCPF and the stability of these gains to economic
shocks despite the political costs that may arise.
5 Alternative scenarios and Robustness checks
In this section, we present some alternative scenarios and robustness checks for
SCPF and give a brief overview on the effects. This includes country subsets and
variations in macro- and country-specific factors. An extensive explanation and
more robustness checks can be found in the Appendix.
5.1 EMU-wide with different introduction dates for the SCPFs
Firstly, we vary the general economic environment by altering the date for the intro-
duction of SCPF. As in the benchmark case, we look at an EMU-wide introduction
where every country is participating and 10% of GDP is issued. The three different
scenarios where the dates for introduction are August 2018, December 2012 and
December 2008, respectively, yield heterogeneous results for the structures and the
gains. The differences in the results are mainly driven by changes in three factors.
The first factor is the risk-free interest rate, the second are the CDS-spreads, which
changes the default probability of the countries, and the third are the interest rate
spreads every country and the SPV have to pay. The net gains reach from 1.44% of
issued nominal for Germany to 66.54% for Greece dependent on the time of issuance
and distribution method (relative and even). This can be achieved when SCPF are
issued through a supranational institution like the ESM.
5.2 Country subsets
Next, we focus on several country subsets with an introduction in 2018. The subsets
consist of an EMU-wide introduction without (1) Italy or (2) Germany, an intro-
18duction in only (3) the so-called PIIGS-countries and (4) the EU6 countries, the
founders of the European Economic Community. In case (1) the proceeds drop.
The maximum gain that can be reached is for Greece with 20.41% and the low-
est is for Germany with 1.20%. This shows that the inclusion of a relatively high
share of low rated countries like Italy has large advantages for other participating
countries due to the average cash inflow. Case (2) draws a contrary picture. Here
the gains rise. The average rating of the structure decreases only very little since
the trust fund can easily bear first losses. Therefore the structure’s capital outflows
are significantly reduced due to a lower nominal volume (Germany has a share of
approximately 29%) while the inflows stay nearly the same since the German in-
terest payments would have been very low. Summarizing, the diversification and
tranching effects of SCPF imply a high relevance of the participation of low rated
countries for the advantageousness of this financing instrument. Top-rated countries
like Germany, on the other hand, are less important for the economic performance
of SCPF, but undoubtedly inevitable for their political credibility.
In case (3), gains grow significantly compared to our base scenario. The average
rating of the structure declines but the interest rate differential stemming from the
diversification effect is stronger than the rating effect. The proceeds reach from
4.57% for Ireland to 28.41% for Greece. Savings per year can reach 1.4% of issued
nominal for all of the five participating countries in the even distribution scheme.
Case (4) shows the best average rating with all tranches rated AA-. However,
the gains are on average 30 basis points lower due to the already high average
rating of the participants. This result supports the notion that the countries which
founded the predecessor of the European Union can again play a pioneering role in
establishing new European cointegration measures like common debt financing.
5.3 Comparison
All of these alternative scenarios show the robustness of the model. We can also
see that even with small country-subsets gains can be achieved and that they are
19sometimes larger than for an all Euro-area scenario. Italy, as a large low rated
country, has a crucial impact on the gains as can be seen in the calculation where
Italy is missing. Politically it might be more feasible to start with a subset of the
Euro-area and extend afterward. As we see, there will be no economic disadvantages
with a smaller initial group and the process is open for other countries to join after
realizing the advantages.
Also, capital market trust and fiscal discipline indirectly determine the economic
efficiency of SCPF as is shown in the results regarding the sensitivity to the risk-
free interest rate and recovery rate. A high fiscal discipline can boost both capital
market trust and the expected recovery rate.
6 Conclusion
The European Commission pushes forward the joint issuance on sovereign bonds as a
vehicle to deepen integration and foster financial stabilization in the European Mon-
etary Union. The joint liability problem, however, makes any general approaches
to common financing void. In current crisis, the need for and willingness to show
solidarity might open a window of opportunity to establish a strictly project focused
type of common financing which avoids joint liability. Structured Common Project
Financing (SCPF) is such a tool. It comes with the advantages of common financing,
marginalizes the problem of joint liability and increases political room for maneuver
due to free distributable interest savings. Due to the strict focus on single projects
like economic support for heavily Corona hit countries, Green deal financing or a
stable Budget for Common Forces, SCPF avoids to be a threat to national budget
sovereignty as Eurobonds would be.
SCPF is an ABS-based approach that yields fiscal advantages for all(!) partic-
ipating countries. An endogenously financed trust fund enhances the overall risk
structure of the SPV and thus creates a significant net interest saving. Under the
global economic circumstances in 2018, the issuance of SCPF creates gains for par-
ticipating countries of around 0.6% p.a. The structures efficiency is very insensitive
20to the risk-free interest rate (about 0.01% per percentage point) but sensitive to the
recovery rate in case of a default. The presented results are based on very conserva-
tive assumptions with a low recovery rate and maximized contagion effects and are
thus a lower bound to real life savings to be expected.
Based on our results, we propose a fixed trust fund share of 10%, which is below
the economic efficiency optimum to (1) avoid misspecifications due to calibration
uncertainties and (2) account for the politically problematic issue of joint liability.
The efficiency losses are marginal and a price for the political cost of the degree of
joint liability.
21References
Agarwal, S., J. Barrett, C. Cun, and M. D. Nardi. ‘The asset-backed securities
markets, the crisis, and TALF’. Economic Perspectives, Federal Reserve Bank of
Chicago, issue 4Q, pp. 101–115.
Bauer, C. and Herz, B. (2019). ‘Reforming the European Stability Mechanism’.
JCMS, https://doi.org/10.1111/jcms.12951
Bi, H. (2012). ‘Sovereign default risk premia, fiscal limits, and fiscal policy’. European
economic review, Vol. 56, No. 3, pp. 389–410.
Boonstra, W. (2005). ‘Proposals for a better stabiliy pact’. Intereconomics : Review
of European Economic Policy, Vol. 40, No. 1, pp. 4–9.
Brunnermeier, M., Langfield, S, Pagano, M., Reis, R., van Nieuwerburgh, S. and
Vayanos, D. (2016). ‘ESBies: Safety in the tranches’. Discussion paper series /
Centre for Economic Policy Research Financial economics, international macroe-
conomics and finance and monetary economics and fluctuations, No. DP 11537.
Claessens, S., Mody, A. and Vallée, S. (2012). ‘Paths to eurobonds’. IMF Working
Paper, No. 12/172.
Coval, J., Jurek, J.W. and Stafford, E. (2009). ‘Economic catastrophe bonds’. The
American Economic Review, Vol. 99, No. 3, pp. 628–666.
Coval, J., Jurek, J.W. and Stafford, E. (2009). ‘The economics of structured finance’.
The Journal of Economic Perspectives, Vol. 23, No. 1, pp. 3–25.
Cronin, D. and Dunne, P.G. (2019). ‘How effective are sovereign bond-backed se-
curities as a spillover prevention device?’. Journal of International Money and
Finance, Vol. 96, pp. 49–66.
Cruces, J.J. and Trebesch, C. (2013). ‘Sovereign defaults: The price of haircuts’.
American Economic Journal : Macroeconomics, Vol. 5, No. 3, pp. 85–117.
22Delpla, J. and von Weizsäcker, J. (2010). ‘The Blue Bond proposal’. Policy Brief
2010/03, May (Brussels: Bruegel).
European Systemic Risk Board (2018). ‘Sovereign bond-
backed securities: a feasibility study’. Available at:
https://www.esrb.europa.eu/pub/task force safe assets/html/index.en.html.
European Commission (2011). ‘Green Paper on the feasibility of introducing stability
bonds’. COM (2011) 818.
European Commission (2017). ‘Reflection paper on the deepening of the economic
and monetary union’. COM (2017) 291.
German Council of Economic Experts (2012). ‘Nach dem EU-Gipfel: Zeit für
langfristige Lösungen nutzen’. Special Reports No. 75379.
Giovannini Group (2000). ‘Co-ordinated public debt issuance in
the Euro area: Report of the Giovannini Group’. Available at:
https://ec.europa.eu/economy finance/publications/pages/publication6372 en.pdf.
Hild, A.M.D., Herz, B. and Bauer, C. (2014). ‘Structured eurobonds: Limiting
liability and distributing profits’. JCMS, Vol. 52, No. 2, pp. 250–267.
Longstaff, F.A. and Rajan, A. (2008). ‘An empirical analysis of the pricing of col-
lateralized debt obligations’. The Journal of Finance, Vol. 63, No. 2, pp. 529–563.
Mcevoy, C. (2016). ‘The role of political efficacy on public opinion in the European
Union’. JCMS, Vol. 54, No. 5, pp. 1159–1174.
Meyer, J., Reinhart, C.M. and Trebesch, C. (2019). ‘Sovereign bonds since Water-
loo’. CESifo working paper, Category 7 No. 7506.
Polito, V. and Wickens, M.R. (2015). ‘Sovereign credit ratings in the European
Union: A model-based fiscal analysis’. European Economic Review, Vol. 78, issue
C, pp. 220–247.
23Securities Industry and Financial Markets Association (2008). ‘A Com-
mon European Government Bond’. Discussion paper, September. Available
at: https://www.sifma.org/resources/research/afme-sifma-a-common-european-
government-bond-discussion-paper/.
Sturzenegger, F. and Zettelmeyer, J. (2010) ‘Sovereign credit ratings in the European
Union: A model-based fiscal analysis’ (Cambridge: MIT Press)
van Riet, A. (2017). ‘Adressing the safety trilemma: a safe sovereign asset for the
eurozone’. ESRB Working Paper Series No. 35.
24A Appendix: Content
Collateral Default Obligations
Collateral Default Obligations (CDOs) are a special type of Asset-Backed Securities
(ABS). They are built of a portfolio of loans which is bought by a Special Purpose
Vehicle (SPV). The SPV buys the portfolio and structures it into different tranches.
The ratings of these tranches depend on the default risk and correlation of the
underlying credit facilities. In our case, the SPV buys sovereign bonds. Since the
ratings of the tranches are different, their cash flow from interest payments are also
different. The highest-rated tranche normally receives a rating of AAA - the best
possible rating - and faces the lowest interest payments. The lowest rated tranche
has to pay the highest interest rate. Investors in this part of the CDO are first to
face losses whereas investors in the AAA part are last to do so. The lowest rated
tranche, called ”equity tranche”, often remains in the holdings of the SPV.
A deeper explanation of CDOs, their pricing and the correlation effects can be
found by Longstaff and Rajan (2008), Coval et al. (2009b) and Coval et al. (2009).
An exact clarification of SCPF in a SPV as well as the cascading effects can be
found by Hild et al. (2014).
Principles of Asset-Backed Securities
Since its beginning in the 1970s the phenomenon of securitization became increas-
ingly important in financial markets. The ancestor of ABS transactions originated
in the United States in the form of mortgage-backed securities. Asset-backed secu-
rities were first issued in the 1980s in the US and about 10 years later in Europe.
Since then the global ABS-market constantly grew until the financial crisis in 2007.
Today ABS are typically collateralized by a number of different assets, like credit
card receivables, home equity loans, auto loans or student loans.15 In regard to
asset-backed securities typically three main participants take part in the structure:
15
For more detailed information about the development of the ABS market see Agarwal et al.
(2010).
25The originators, an independent separate institution the so called Special Purpose
Vehicle (SPV) and the investors. The SPV buys a portfolio of debt instruments,
and then pools and tranches the assets. To finance itself the SPV issues claims with
different characteristics related to level of seniority, risk, rating and yields against
the pooled portfolio. Within this type of structure, two key ingredients play a major
role: (1) The pooling of the assets, and (2) the tranching of the liabilities.
The first key ingredient of securitization is the pooling of assets. This pooling
can either be cash based or synthetical16 . The pooling matters because it introduces
diversification as long as the correlation between the pooled assets is not perfect
(|ρ| < 1). By pooling the variance of the asset pool is reduced, in other words,
the variance of the single assets is higher than the variance of the pooled assets.
The lower the variance, the lower the risk of assets. Correlation matters because
lower asset correlation implies a bigger part of risk-free AAA-rated securities within
the structured product. By reducing risk with diversification senior tranches issued
enjoy a higher credit quality than the average obligor in the pool.17
The second key element is the tranching of the assets. Tranching the portfolio
is nothing else than a mathematical optimization. By doing so, the SPV slices
the product into 1 to n tranches with different characteristics related to level of
seniority, risk, rating and yields. Depending of the repartition method of the cash
flows (pay-through- or pass-through-structure) securitization results differ. Within
a pass-through-structure interest and capital repayments from the underlying asset
pool are transferred to the investors without modification. All investors are in an
identical position, related to risk and yield. Within a pay-through-structure the
pooled assets are sliced into tranches with different priority and credit-worthiness.
Instead of issuing one bond with a given rating (depending on a given risk) and a
given yield several tranches with different ratings and characteristics (risk, yield) are
16
Cash based means the credit sensitive assets are purchased into a pool. Synthetic could refer
to a synthetic Collateralized Debt Obligation (CDO) where the assets are originated synthetically
by issuing credit default swaps.
17
For SCPF the correlation of defaults is a measure for contagion within Europe. In our simu-
lation studies we precautionarily used the maximal correlation values possible for the given default
probabilities (see Bauer and Herz (2019) for details).
26issued. Tranches with a high rating pay lower interest rates and are less risky than
tranches with a low rating. The senior tranche with the best rating has the highest
priority on cash flow and therefore carries the lowest risk. The next class receives
a lower rating. This tranche is subordinated to the senior tranche and pays higher
interest rates due to higher risk. The lowest tranche implies the highest risk. After
the payment of all costs related to the SPV18 interest is paid to the most senior
tranche before the remaining interest is paid to the subordinated tranches. In case
of default on participating bonds, the lowest tranche is hit first, if the structure does
not have a trust fund, which covers first losses19 . Because of the cascading effect
in an ABS structure this kind of structuring is also knows as cash flow waterfall
illustrated in figure A.1.
low
senior
expected yield
expected loss
tranche
credit risk
payments from
mezzanine
the SPV
tranche
junior
tranche
equity
tranche
high
Figure A.1: Cascading effect in an ABS transactions
Furthermore the thickness of the tranches differs. The rating of each tranche (and
thereby also the number and thickness of the tranches) is based on a complex calculus
of the rating agencies. In general, the rating of a tranche depends on its expected
loss probability. A tranche is eligible for a specific rating if the tranches default
probability is lower than a predefined idealized default rate. The expected loss of a
tranche (probability of a tranche being hit) decreases with increasing subordination
and/or increasing tranche thickness20 . The main focus here is on the question as to
“how thick can a tranche be to attain a given rating?”.
18
With this kind of structure administrative costs can be kept low.
19
If a trust fund has been installed, it is in a first loss piece position. It covers all first losses,
before the lowest rated tranche is hit. In this way, even investors of the lowest tranche benefit from
a certain security.
20
Increasing the fixed recovery rate also leads to a decrease of the expected loss.
27Financial Data
Country Interest Rate 2008 Interest Rate 2012 Interest Rate 2018
Belgium 3.77% 2.05% 0.70%
Germany 2.95% 1.31% 0.33%
Estonia 4.95% 2.41% 0.78%
Ireland 4.44% 4.56% 0.86%
Greece 5.20% 11.92% 4.40%
Spain 3.81% 5.27% 1.49%
France 3.41% 2.00% 0.69%
Italy 4.38% 4.51% 3.24%
Cyprus 4.60% 7.00% 2.30%
Latvia 6.43% 3.24% 0.80%
Lithuania 5.61% 4.00% 1.20%
Luxembourg 4.61% 1.43% 0.47%
Malta 4.81% 3.79% 1.50%
Netherlands 3.55% 1.49% 0.45%
Austria 3.84% 1.75% 0.55%
Portugal 3.96% 7.05% 1.92%
Slovenia 5.15% 5.03% 0.95%
Finland 3.69% 1.51% 0.52%
Slovakia 4.64% 3.92% 0.79%
Table A.1: Interest Rates per country
Simulation Results
Optimal degrees of joint liability
A crucial and very much political topic is the choice of the initial trust fund volume
or, to put it precisely, the trust fund’s percentage share of the whole nominal volume.
The choice displays the joint liability every country is willing to enter. We examine
the effects of different trust fund shares on the nominal gain as well as the interest
rate differential of the complete EMU. At first, we have a look at three different
possible trust fund shares - 5%, 10% and 20% - and their impact on the nominal
gains. The results are presented in figure A.2. The gain can be understood as a
function of the degree of joint liability since a higher joint liability is connected
with a higher trust fund share and a higher trust fund share is equivalent to a
28Figure A.2: Nominal gains in a SCPF scenario with different trust fund shares over a grid of several
recovery values as well as risk-free interest rates.
better average rating of the structure. The attributable profit resulting from this
connection is also highly dependent on the chosen initial trust fund share. On the
other hand, political costs are also directly related to joint liability. Higher liability
delivers higher moral hazard. In this case, we assume an issuing of 10% of the GDP
with SCPF. The effects of variations in the risk-free interest rate and recovery rates
are the same for all three possibilities of trust fund shares. The gain reaches from
46.60 billion Euro in a 5% trust fund scenario with 0% recovery rate and 6% risk-free
interest rate to 106.78 billion Euro with a 5% trust fund, 80% recovery rate and 6%
risk-free interest rate. It is remarkable that the lowest, as well as the highest gains,
are achieved with a trust fund share of 5%. We can see this in figure A.2 where the
other two layers are not as sensitive to the variables ”risk-free interest rate” and
”recovery rate” as the 5% layer.
We have to split our observations into different areas of interest. When we face
recovery rates below 60%, the gains depend strongly on the initial trust fund share.
Here we can conclude that the higher the trust fund share is the higher the gains are.
As long as the recovery value is between 60% and 75%, SCPF with an initial trust
29fund of 10% can deliver the highest gains. This is dependent of the risk-free interest
rate. In a low risk-free interest rate environment, a larger initial trust fund delivers
larger gains but this changes as the interest rate rises. At last, when recovery values
are above the 75% threshold the 5% trust fund will generate the highest gains. This
can be explained by a declining effect of the trust fund rate on the average rating
of the structure. Also, the interest rate burden is growing for every country due to
their payment on the whole debt. Notably, the results for a low risk-free interest
rate are close to each other whereas they diverge stronger for higher values in the
interest rate. The differences for low-interest rates range from 0.03 to 0.17 billion
Euro. This is an indication that the system is not sensitive to the trust fund share
in a low-interest rate environment. The 5% trust fund share is relatively sensitive to
a change in the recovery value or the risk-free interest rate. The above mentioned
results can be combined with figure A.3.
Figure A.3: Interest rate difference in a SCPF scenario with different trust fund shares over a grid
of several recovery values as well as risk-free interest rates.
We can see that the topmost layer, which is representing the 20% initial trust
fund rate, has the flattest growth and the lowest layer (5%) the steepest growth. It
is noticeable that the difference is decreasing for higher recovery rates with a fixed
30You can also read