Qualitative Field Observation of Pedestrian Injury Hotspots: A Mixed-Methods Approach for Developing Built- and Socioeconomic-Environmental Risk ...
←
→
Page content transcription
If your browser does not render page correctly, please read the page content below
International Journal of
           Environmental Research
           and Public Health

Article
Qualitative Field Observation of Pedestrian Injury
Hotspots: A Mixed-Methods Approach for
Developing Built- and Socioeconomic-Environmental
Risk Signatures
Nadine Schuurman 1, * , Blake Byron Walker 2 , David Swanlund 1 , Ofer Amram 3 and
Natalie L. Yanchar 4
 1    Department of Geography, Simon Fraser University, 8888 University Drive, Burnaby, BC V5A 1S6, Canada;
      dswanlun@sfu.ca
 2    Institut für Geographie, Friedrich-Alexander-Universität Erlangen-Nürnberg, Wetterkreuz 15,
      91058 Erlangen, Germany; blake.walker@fau.de
 3    Spokane Health Education and Research Building Third Floor, P O Box 1495, Spokane, WA 99210-1495,
      Canada; ofer.amram@wsu.edu
 4    Pediatric General Surgery, Alberta Children’s Hospital, 28 Oki Drive NW, Calgary, AB T3B 6A8, Canada;
      natalie.yanchar@ahs.ca
 *    Correspondence: nadine@sfu.ca

 Received: 20 February 2020; Accepted: 19 March 2020; Published: 20 March 2020

 Abstract: Road traffic injuries constitute a significant global health burden; the World Health
 Organization estimates that they result in 1.35 million deaths annually. While most pedestrian injury
 studies rely predominantly on statistical modelling, this paper argues for a mixed-methods approach
 combining spatial analysis, environmental scans, and local knowledge for assessing environmental
 risk factors. Using data from the Nova Scotia Trauma Registry, severe pedestrian injury cases
 and ten corresponding hotspots were mapped across the Halifax Regional Municipality. Using
 qualitative observation, quantitative environmental scans, and a socioeconomic deprivation index,
 we assessed hotspots over three years to identify key social- and built-environmental correlates.
 Injuries occurred in a range of settings; however, clear patterns were not observed based on land use,
 age, or socio-economic status (SES) alone. Three hotspots revealed an association between elevated
 pedestrian injury and a pattern of geographic, environmental, and socio-economic factors: low-
 to middle-SES housing separated from a roadside attraction by several lanes of traffic, and blind
 hills/bends. An additional generalized scenario was constructed representing common risk factors
 across all hotspots. This study is unique in that it moves beyond individual measures (e.g., statistical,
 environmental scans, or geographic information systems (GIS) mapping) to combine all three methods
 toward identifying environmental features associated with pedestrian motor vehicle crashes (PMVC).

 Keywords: pedestrian injury; geographic information systems; mapping; hotspots; socio-economic
 status; mixed methods

1. Introduction

1.1. Pedestrian Injury
     Injury represents a fundamentally global public health burden, although it is also highly
preventable. Estimates suggest that in 2013, between 942 and 993 million people required health care
due to a sustained injury [1]. That same year, 4.8 million individuals had their lives taken by injury [1].
In terms of years of life lost, injury resulted in nearly 260 million years of life lost globally in 2012

Int. J. Environ. Res. Public Health 2020, 17, 2066; doi:10.3390/ijerph17062066   www.mdpi.com/journal/ijerph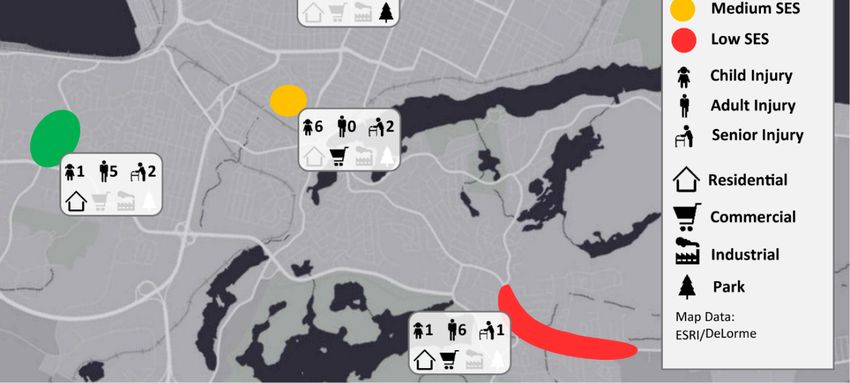
Int. J. Environ. Res. Public Health 2020, 17, 2066                                                   2 of 15

alone [2]. More specifically, road traffic injuries constitute a significant component of the global burden
of injury, as they end approximately 1.35 million lives every year [3]. Such injuries are not without a
significant economic impact: according to the World Health Organization (WHO), road traffic injuries
reduce national gross domestic product by 3% on average [3]. Clearly, injuries on the roadway present
a significant problem for public health.

1.2. Objectives
     Building on our previous studies of injury hotspots [4,5], this study sought to develop a mixed
methods approach to the assessment of risk factors associated with pedestrian injury hotspots.
The approach integrates GIS mapping, detailed environmental scans, and statistical analysis of
socio-economic status indicators. The goal was to combine qualitative and quantitative assessments
to develop a greater understanding of high-risk settings that can ultimately be used for an injury
prevention policy in Halifax, Nova Scotia. Risk has a complex signature and we argue that it is valuable
to combine qualitative observations with the assembled quantitative data in order to characterize
risk in specific settings. The calculation of socio-economic status (SES) and the geographical and
environmental correlates identified in the study are generalizable to other urban areas, but each setting
will have unique combinations of the correlates that must be assessed in situ.

1.3. Mixed Methods
      The exclusive use of quantitative methods (specifically statistical modelling) to analyze risk
factors suffers from several weaknesses when applied to injury studies. A reliance on large sample
sizes/populations to achieve adequate statistical power biases studies of smaller locales towards the
null hypothesis, almost certainly leading to important patterns and risk factors being rejected due
to inadequate statistical significance [6–9]. A traditional hypothesis testing (or otherwise p-value or
confidence-interval-focused) approach additionally relies on assumptions of underlying distributions
to assume multiple samples from a consistent population (a particularly perilous problem when using
geospatial models), which, well suited to inferential modelling of highly-controlled experimental
conditions [10], falls short of accounting for the non-parametric nature of models. However, the use of
statistical tools to evaluate injury data does present important inroads to disentangling patterns of
injury and identifying risk factors. It may therefore be argued that drawing upon both quantitative
and qualitative methodologies better equips researchers and analysts to detect and characterize risk
environments for complex socioeconomic and built-environmental phenomena.
      Accordingly, there has been a burgeoning of mixed methods research in the health and medical
domain, as the value of using two epistemic angles to triangulate possible reasons or rationales for
convergence of health incidence has been realized [11–14]. While a quantitative approach affords
the ability to identify clusters of disease incidence, the unique local conditions that lead to their
formation are harder to uncover. Qualitative research in an ideal situation does not bring a priori
assumptions about the conditions that lead to such clusters. Rather, qualitative research examines
through an idiographic approach the conditions that exist in situ that facilitate clusters of disease
incidence, in this case pedestrian injury. By utilizing the strengths of both methodologies through a
mixed method approach we are able to craft unique risk signatures for pedestrian injury hot spots that
would otherwise be missed if either qualitative or quantitative methods were used on their own. Were
this research to focus on quantitative measures alone, we could identify the hotspots and conduct the
environmental scans, but it would be difficult to explain why the hotspots were in that location and
how they were related to the environmental correlates. Likewise, qualitative research alone might
be able to use inductive reasoning and local knowledge to predict possible hotspots, but researchers
would have no way to corroborate their suspicions regarding possible causality. The combination of
the two approaches permits the unique methodology presented here.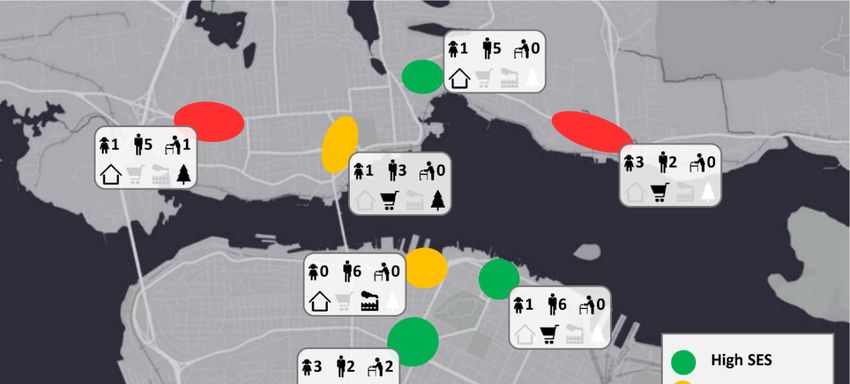
Int. J. Environ. Res. Public Health 2020, 17, 2066                                                      3 of 15

1.4. Risk Factors
      Previous studies have identified risk factors for pedestrian injury related to motor vehicles (PMVC)
including those related to vehicle traffic, infrastructure, and socio-economic contexts. These are
discussed below and are the basis for the geographical framework used in this study.
      Traffic Volume: Traffic volume, whether represented directly by measures such as vehicle miles
travelled or indirectly by arterial road presence, is one of the strongest risk factors associated with
PMVCs. Research has consistently shown that areas with higher traffic volume result in more PMVCs,
as well as higher injury severities [15–20]. This effect is not necessarily distributed uniformly in space.
For example, traffic volume is a significant risk factor at intersections but not mid-block [21]. This may
be because high traffic volumes introduce more complexity at intersections, rather than between them.
      Road Width: Closely related to traffic volume is road width, which can be examined as the
number of lanes as well as the width of those lanes. With regard to the former, numerous studies
have found that the number of lanes on a road is significantly associated with increased risk of
PMVC [15,18,22,23]. This is due to the added distance that pedestrians are required to cross, thereby
increasing their exposure to traffic. Wide lanes also increase PMVC risk [24]. Godley et al. [24] suggest
that this is because narrow lanes demand an increased steering workload that causes drivers to travel
at slower speeds. This correlates with motor vehicle collision (MVC) research that has demonstrated
increased MVC rates with wide lanes [25–27]. Finally, the addition of a divider in the center of the
road and the addition of a painted center-hatch both decrease PMVC risk, likely by attenuating drivers’
speed estimates, resulting in slower vehicle speeds and decreased crash risk [22,24].
      Intersections: The design of intersections also affects PMVC risk. It is widely agreed
that four-legged intersections are more dangerous for pedestrians than their three-legged
counterparts [15,18,28,29], and that adding more approaches only exacerbates PMVC rates [18,30].
While in some cases this may be a reflection of traffic volume, adding more approaches to an intersection
may increase its complexity, making it more dangerous for pedestrians.
      Crossing Infrastructure: The installation of crossing infrastructure, such as signals or crosswalks,
can promote pedestrian safety. Pedestrians crossing without a signal or against a signal have been clearly
shown to be at higher risk of PMVC, and over half of pedestrians killed are not in a crosswalk [17,31].
The absence of signals in rural areas is also strongly associated with more crashes; pedestrians crossing
non-signalized intersections on major routes are four times more likely to be severely injured or killed
than elsewhere on the route [17,22,32].
      Street Parking: Street parking has a demonstrated effect on pedestrian injury as it modifies
pedestrian behavior. Morency et al. [28] found that pedestrian injury rates are higher at intersections
with cars parked within five meters of their perimeter. Dommes et al. [33] found that pedestrians were
more likely to violate the signal at intersections if cars were parked legally around them, yet if cars
were parked illegally surrounding the intersection, pedestrians would instead exercise more caution
when deciding to cross [34]. These findings may suggest that legal parking lures pedestrians into a
false sense of security or trust in the infrastructure to protect them.
      Alcohol Outlets: Pedestrian injury has been associated with proximity to alcohol-serving
establishments, possibly due to increased risk of intoxication by either drivers or their victims [7,35,36].
Many studies have demonstrated that pedestrians who are intoxicated sustain injuries at a greater rate
and severity than those who are not [23,31,37,38]. Driver intoxication also increases the risk of deadly
injury for pedestrians [17,32].
      Land Use Mix: Land use has a well-documented effect on PMVCs. For instance, residential areas
have lower rates of PMVCs [15,30,39]. Conversely, commercial, industrial, and mixed land-use areas
sustain higher rates of PMVCs [15,20,21], including a greater risk of severe injuries or fatalities [17,39,40].
This is likely related to increased traffic volume, speed, and overall traffic pattern complexity of these
areas. In addition, land use mix can influence walking behaviors, thus increasing—or conversely,
decreasing—exposure to risk.
Int. J. Environ. Res. Public Health 2020, 17, 2066 4 of 15
Public Transportation: The presence of public transportation infrastructure appears to have a
mixed effect on pedestrian injury. Some have found the presence of transit stops to be associated
with an increase in the number of crashes in a given area [15,28,30,41], while others have found that
transit access is associated with significantly reduced injury severity [31]. It is possible that areas with
transit attract more pedestrian traffic, thereby resulting in more PMVCs, but that collisions in these
areas occur at a lower speed due to drivers being alert to the greater pedestrian presence and thereby
reducing the severity of injuries. Ultimately, the spread in results associated with studying the links
between transit and risk of pedestrian injuries may be explained by other unobserved factors in the
built urban environment.
Socioeconomic Status: Unsurprisingly, socioeconomic status is strongly associated with PMVC
rates. Studies have linked low area-level educational attainment to higher PMVC rates [16,18,20,29,42,43]
as well as increased severity of subsequent injuries [32].
Age: Age has a well-established association with the risk of severe injury in pedestrian-vehicle
collisions. Numerous studies have found that older pedestrians are at higher risk for sustaining
more severe or deadly injuries when struck by vehicles [15,31,32]. However, the rate at which older
pedestrians are injured is less clear, with some studies finding rates similar to or lower than the general
population [31,42], and others finding far higher rates [44]. Similarly, there are conflicting findings
with regard to the behavior of older pedestrians. Some studies report that older pedestrians comply
more often with crossing signals and are generally more cautious [33,45]. Others suggest that older
pedestrians may have poorer judgment related to slower walking speeds [46] while relying more
heavily upon crossing infrastructure [33]. Dommes et al. [47] found that functional age-related declines
affected a variety of factors in older pedestrians, suggesting that they “may overestimate their speed
of walking, misperceive the time-to-arrival of approaching cars, and have difficulty in efficiently
compensating for their perceptual and attentional declines when crossing a two-way street, especially
when traffic is approaching at a high speed.” Finally, there may be differences in walking ability levels
among the cohorts in the different studies.
Younger pedestrians are also at an increased risk. Moudon et al. [32] found that children under the
age of four have almost three times the general population’s risk of severe injury or death within cities
due to PMVCs. Dai’s [44] analysis of risk factors in pedestrian injury returned the highest injury rates
for those under the age of 14, and Chakravarthy et al. [42] found that areas with a greater proportion
of residents under the age of 14 suffered more crashes. On the other hand, LaScala et al. [16] found
that areas with higher proportions of children had lower injury rates. Ultimately, despite conflicting
findings with regard to the specific type and degree of vulnerability, it is clear that pedestrians at either
end of the age spectrum are more vulnerable to severe injury when involved in a crash compared to
those in the middle. As with the variables discussed above, exposure is a key component of risk but
often not accounted for.
2. Materials and Methods
There were two components to this mixed methods study. The first component consisted
of a methodical approach to data collection by mapping hotspots using known risk factors (from
the literature) to compile an environmental scan survey instrument, and finally carrying out the
environmental scans with a team of four. The second component of the study emphasized field work
to understand primary patterns that emerged from the data. We combined socio-economic status data
(SES) with field observations to understand why particular patterns emerged. The protocol for the
methods is illustrated in Figure 1.Int.
Int. J.
J. Environ. Res. Public
Environ. Res. Public Health
Health 2020, 17, x2066
2020, 17, 55 of
of 15
15
Figure 1. Methods for the study including framework for assessing risk profiles for pedestrian motor
Figure 1.
vehicle Methods
crashes for the study including framework for assessing risk profiles for pedestrian motor
(PMVC).
vehicle crashes (PMVC).
2.1. Data
2.1. Data
Data were acquired from the Nova Scotia Trauma Registry which maintains a comprehensive
population-based databasefrom
Data were acquired of allthe
cases
Novaof serious injuries taken
Scotia Trauma to hospital
Registry in the Canadian
which maintains province of
a comprehensive
Nova Scotia (Injury Severity Score >11, requiring trauma team activation and/or
population-based database of all cases of serious injuries taken to hospital in the Canadianresulting in in-hospital
province
death).
of NovaAll individuals
Scotia (InjuryinSeverity
the database
Scoresustaining a severe
>11, requiring pedestrian
trauma team injury within
activation the Halifax
and/or Regional
resulting in in-
Municipality
hospital death).(HRM) of Nova Scotia
All individuals from
in the 1 June sustaining
database 2002 to 31 March
a severe 2015 were included.
pedestrian Variables
injury within the
included in this analysis
Halifax Regional were incident
Municipality (HRM) date/time, location
of Nova Scotia recorded
from 1 Juneby2002
ambulance GPS, patient
to 31 March age
2015 were
and sex, and
included. the injuryincluded
Variables severity score (ISS)
in this recorded
analysis at hospital.
were incident date/time, location recorded by
Research
ambulance ethics
GPS, approvals
patient age andwere
sex,obtained from IWK
and the injury Health
severity Centre
score (ISS)Research
recordedEthic Board (Project
at hospital.
#1012595) and ethics
Research from Simon Fraser
approvals University
were obtainedOffice of Research
from IWK Health Services (Study #2013s0873).
Centre Research Ethic Board (Project
#1012595) and from Simon Fraser University Office of Research Services (Study #2013s0873).
2.2. Geographical Analysis
2.2. Geographical Analysis
All pedestrian injuries were geocoded based on the GPS location data and were mapped using
ESRI All
ArcGIS®software. Kernel
pedestrian injuries weredensity estimation
geocoded based (KDE)
on thewas
GPSused to identify
location the were
data and chief hotspots
mapped using
using
aESRI
bandwidth of 500 m (which approximates the average city block). KDE was selected based
ArcGIS software. Kernel density estimation (KDE) was used to identify the chief hotspots on its use
in previous injury studies [7,48,49] and because it indicates location hotspots (based
using a bandwidth of 500 m (which approximates the average city block). KDE was selected basedon hue) without
revealing
on its use individual
in previouspatient locations.
injury studies [7,48,49] and because it indicates location hotspots (based on hue)
without revealing individual patient locations.
2.3. Environmental Scans
2.3. Environmental Scans literature review to identify chief correlates of PMVC to include in the survey
We used a detailed
instrument. The instrument was first used in a study conducted by the authors in Vancouver, BC [7].
We used a detailed literature review to identify chief correlates of PMVC to include in the survey
Attributes included in the walking in-person environmental scans were: long block (Yes or No); bus
instrument. The instrument was first used in a study conducted by the authors in Vancouver, BC [7].
stop (Y or N); curb parking (Y or N); cross-walk (Y or N); obstruction (Y or N); signage (high, medium,
Attributes included in the walking in-person environmental scans were: long block (Yes or No); bus
low,
stopsubjectively
(Y or N); curb measured);
parking (Y lanes of cross-walk
or N); traffic; L/R turn
(Y orbans (Y or N); bars
N); obstruction (Y (Y
or or
N);N); retail (Y
signage or N);
(high, school
medium,
(Y or N); traffic calming measures (Y or N); median (Y or N); exclusive turn lane (Y or N); and speed
low, subjectively measured); lanes of traffic; L/R turn bans (Y or N); bars (Y or N); retail (Y or N);
limit.
schoolIn(Yaddition, we took
or N); traffic detailed
calming notes, photos,
measures (Y or N);and videos
median (Yatoreach
N); hotspot.
exclusiveThe
turnenvironmental
lane (Y or N);scan
and
framework is illustrated in Figure 2 below.
speed limit. In addition, we took detailed notes, photos, and videos at each hotspot. The
Over the course
environmental of three years,
scan framework we returned
is illustrated inon three2occasions
Figure below. to each of the hotspots in an attempt
to understand inductively why certain combinations
Over the course of three years, we returned on three of correlates
occasionsled to
to each
higherof injury counts.inIt an
the hotspots is
possible that the built urban environment could have changed significantly between
attempt to understand inductively why certain combinations of correlates led to higher injury counts. injuries at some
locations (e.g.,that
It is possible newthesignage or streetlights).
built urban environment However, this changed
could have risk was significantly
mitigated bybetween
our return to each
injuries at
hotspot to conduct new scans over the course of three years.
some locations (e.g., new signage or streetlights). However, this risk was mitigated by our return to
each hotspot to conduct new scans over the course of three years.Int. J. Environ. Res. Public Health 2020, 17, x 6 of 15
Int. J. Environ. Res. Public Health 2020, 17, 2066 6 of 15
Figure 2. A visual representation of the environmental artifacts included in the survey instrument
used during our environmental scans. Each of these environmental elements was selected based on a
Figure 2. A visual representation of the environmental artifacts included in the survey instrument
thorough literature review in which we examined the chief (known) correlates with pedestrian motor
used during our environmental scans. Each of these environmental elements was selected based on a
vehicle crashes.
thorough literature review in which we examined the chief (known) correlates with pedestrian motor
vehicle crashes.
Hotspots were identified from the initial analysis and mapping. For the purposes of this study, we
focused on the top ten hotspots, for which three separate environmental scans were conducted, once
Hotspots were identified from the initial analysis and mapping. For the purposes of this study,
in winter and again in summer. The results were enumerated based on the scores of four reviewers.
we focused on the top ten hotspots, for which three separate environmental scans were conducted,
In addition, land use at each hotspot (retail, recreational, or residential) was recorded. Notes were also
once in winter and again in summer. The results were enumerated based on the scores of four
taken on the traffic environment (volume, speed, pedestrian protection, presence of blind corners, and
reviewers. In addition, land use at each hotspot (retail, recreational, or residential) was recorded.
confusing/uncommon roadway configuration). Interestingly, there was strong agreement among the
Notes were also taken on the traffic environment (volume, speed, pedestrian protection, presence of
environmental scans team when counting the features and in recording notes.
blind corners, and confusing/uncommon roadway configuration). Interestingly, there was strong
In addition, socio-economic status (SES) was calculated at the Dissemination Area (DA) level. The
agreement among the environmental scans team when counting the features and in recording notes.
DA is the smallest unit for which Statistics Canada compiles and publicly publishes detailed census data.
In addition, socio-economic status (SES) was calculated at the Dissemination Area (DA) level.
Typically, a DA contains 400 to 700 people. DAs were designed to maximize the following attributes in
The DA is the smallest unit for which Statistics Canada compiles and publicly publishes detailed
order better characterize neighborhoods: temporal stability (borders not subject to frequent change);
census data. Typically, a DA contains 400 to 700 people. DAs were designed to maximize the
minimum population (i.e., greater resolution); uniformity of attributes; compact shape; and intuitive
following attributes in order better characterize neighborhoods: temporal stability (borders not
boundaries [50]. As such, they are well suited for characterizing SES at the population level. The
subject to frequent change); minimum population (i.e., greater resolution); uniformity of attributes;
Vancouver Area Neighbourhood Deprivation Index (VANDIX) metric was used to calculate SES (and,
compact shape; and intuitive boundaries [50]. As such, they are well suited for characterizing SES at
by extension, deprivation) for each DA in the HRM [51,52]. The VANDIX was developed explicitly for
the population level. The Vancouver Area Neighbourhood Deprivation Index (VANDIX) metric was
calculating deprivation across Canada. The measure includes variables associated with social capital
used to calculate SES (and, by extension, deprivation) for each DA in the HRM [51,52]. The VANDIX
(e.g., home ownership; living alone) as well as standard measures of income and education. The SES
was developed explicitly for calculating deprivation across Canada. The measure includes variables
value was separately calculated for the DA containing each unique hotspot. These results were then
associated with social capital (e.g., home ownership; living alone) as well as standard measures of
compiled with environmental scan results to characterize contributing factors and contexts related to
income and education. The SES value was separately calculated for the DA containing each unique
each PMVC hotspot.
hotspot. These results were then compiled with environmental scan results to characterize
Several in-person and remote meetings were held with all authors/researchers to discuss the range
contributing factors and contexts related to each PMVC hotspot.
of results from the various analysis tools. These meetings were used to critically examine the results
from each method in order to synthesize the findings.Int. J. Environ. Res. Public Health 2020, 17, x 7 of 15
Several in-person and remote meetings were held with all authors/researchers to discuss the
range of results
Int. J. Environ. fromHealth
Res. Public the various analysis tools. These meetings were used to critically examine
2020, 17, 2066 the
7 of 15
results from each method in order to synthesize the findings.
Results
3. Results
The results are reported in a range of formats formats thatthat reflect the mix of GIS GIS (geographical),
(geographical),
environmental scan, and SES methods used to assess risk factors at PMVC hotspots. Figure 3 Figure
environmental scan, and SES methods used to assess risk factors at PMVC hotspots. presents3
apresents a broad overview
broad overview of theThe
of the results. results. The
figure figure illustrates
illustrates that,glance,
that, at first at firstitglance, it is difficult
is difficult to
to discern
discern consistent
consistent patternspatterns across
across the the ten hotspots.
ten hotspots. However, However,
injuriesinjuries were to
were found found
havetooccurred
have occurred in a
in a range
range
of landofuse
land
anduseSES
andsettings.
SES settings. Further
Further quantitative
quantitative results
results combined
combined withwith a qualitative
a qualitative assessment
assessment are
are required
required to understand
to understand the the
riskrisk factors
factors associated
associated with
with individual
individual hotspots
hotspots andand intersections.
intersections.
Figure 3. Map
Map of
of the
the top
top ten
ten pedestrian
pedestrian injury
injury hotspot
hotspot locations
locations showing a range of specific as well as
Clear patterns
contextual risk correlates. Clear patterns are
are not
not observed
observed based
based on
on socioeconomic
socioeconomic status
status (SES),
(SES), age,
age,
This indicates
and land use alone. This indicates the
the need
need for
for further
further field
field examination
examination of the individual hotspots in
order to understand patterns associated with the built urban environment. Note that this map shows
only the top 10 hotspots representing 64 injuries.
Table 11 (below)
Table (below)provides
providesgreater
greaterclarification
clarificationofof
thethe map
map viewview in Figure
in Figure 3. Here
3. Here wethat
we see see age-
that
age-related
related risk risk is consequential;
is consequential; in our
in our sample,
sample, persons
persons aged
aged 1111 toto3030years
yearsbore
borethe
thegreatest
greatest risk
risk but
but
with significant risk also amongst those 51 to 60 years. There is a slightly elevated risk for
with significant risk also amongst those 51 to 60 years. There is a slightly elevated risk for males over males over
females. In
females. In terms
terms of
of SES,
SES, those
those at
at both
both ends
ends of
of the
the deprivation
deprivation spectrum
spectrum borebore the
the most
most injuries,
injuries, while
while
those in
those in the
the mid-SES
mid-SES range
range suffered
suffered fewer
fewer injuries. Table 22 lists
injuries. Table lists frequency
frequency counts
counts for
for each
each risk
risk factor.
factor.Int. J. Environ. Res. Public Health 2020, 17, 2066 8 of 15
Table 1. Injury counts and risk factors by age, sex, and socio-economic deprivation quintile. Note that
these are not standardized for population, age, or sex because pedestrian traffic crosses boundaries of
neighborhoods and is not exclusive to residence proximity.
Risk Factor Injury Count Injury Percent
Age
0–10 13 7.39%
11–20 41 23.30%
21–30 41 23.30%
31–40 11 6.25%
41–50 15 8.52%
51–60 21 11.93%
61–70 14 7.95%
71–80 10 5.68%
81–90 10 5.68%
Sex
Male 95 53.98%
Female 81 46.02%
VANDIX SES Ranking Relative to the HRM (Quintiles)
Q1 (Least Deprived) 41 23.30%
Q2 27 15.34%
Q3 33 18.75%
Q4 28 15.91%
Q5 (Most Deprived) 47 26.70%
Table 2. Frequencies of each risk factor out of ten hotspots.
Risk Factor Hotspot Prevalence
Long Blocks 7/10
Bus Stops 6/10
Curb Parking 3/10
Cross Walk 6/10
Obstruction 3/10
Exclusive Turn 8/10
Turn Ban 5/10
Bars 2/10
Retail 5/10
School 5/10
Calming 1/10
Median 2/10
Number of Lanes Mean: 8.8
High: 5/10
Signage Medium: 3/10
Low: 2/10
Despite the utility of these quantitative summaries, ultimately we were best able to characterize
the commonalities among the most risky intersections through qualitative discussion and examination
of field notes, photos (such as Figure 4), and video. We were aided by the local knowledge held by
one of the authors. We observed that three hotspots shared common risk factors: low- to middle-SES
housing separated by at least four lanes of traffic from an attractive feature such as fast food outlets,
retail establishments, a casino, or a sport complex. In each instance, these busy roads featured long
blocks, a blind hill and/or bend, and no median or traffic calming measures.Int. J. Environ. Res. Public Health 2020, 17, 2066 9 of 15
Int. Int.
J. Environ. Res.Res.
J. Environ. Public Health
Public 2020,
Health 17, x17, x
2020, 9 of 915of 15
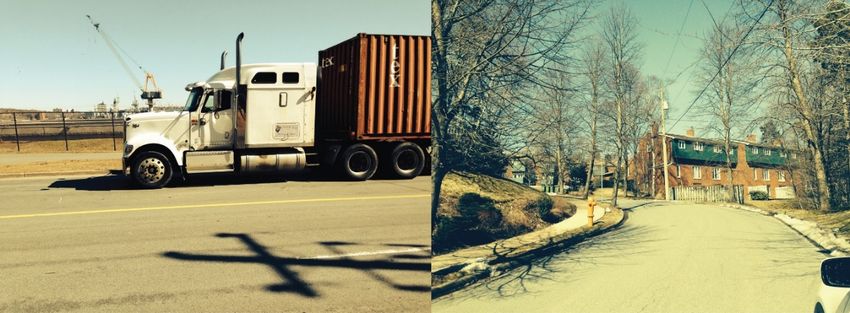
Figure
Figure 4.
4. Examples
Figure 4. Examples
Examples ofofimages
of
images that
images were
that
that taken
were
were throughout
taken
taken throughout
throughout thethequalitative
the scans.
qualitative
qualitative TheThe
scans.
scans. image
The imageon the
image on left
on the
theleft
depicts an
leftdepicts industrial
depictsan
anindustrial area
industrialarea frequented
areafrequentedby
frequentedby large trucks,
bylarge while
largetrucks, the
trucks,while image
whilethe on
theimage the right
imageononthe the illustrates
right
right the
illustrates
illustrates low-
the low-
the
income house
income
low-income housefound
house found
foundat one
at hotspot
at one
one hotspotin in
an area
in an
an with
area
area blind
with
with bends
blind
blind and
bends
bends and hills.
and These
hills.
hills. These
These factors were
factors
factors were were
associated
associated with
associated
with increased
with increased
increased pedestrian
pedestrian
pedestrian injury risk
injury
injury at
at three
riskrisk of the
at three
three of the hotspots
of the thatthat
hotspots
hotspots that were
were surveyed.
were surveyed.
surveyed.
Figure
Figure 5 illustrates
Figure illustrates a more
5 illustrates a moregeneralized
generalized
generalized scenario
scenario
scenariothat was
thatthat
was commonly
commonly
was commonly encountered
encountered
encountered across
across all tenten
all all
across
hotspot locations. The
The net
net effect
effect was
was that
that pedestrians
pedestrians were
were forced to cross
cross four or
or more
more
hotspot locations. The net effect was that pedestrians were forced to cross four or more lanes of heavy lanes
lanes of
of heavy
heavy
traffic with
traffic regularity,
with often
regularity, to reach
often either
to reach a bus
either stop
a bus or roadside
stop attraction.
or roadside There
attraction. were
There typically
were typicallyno no
crosswalks, medians,
medians, oror traffic
traffic calming
calming measures
measures to to
improve improve pedestrian
pedestrian safety.
crosswalks, medians, or traffic calming measures to improve pedestrian safety. Long blocks, safety.
Long Long
blocks, blocks,
exclusive
exclusive
turns, andturns,
exclusive high andand
turns, high
signage signage
were
high common.
signagewere common.
Low-
were Low-
to middle-SES
common. to middle-SES
Low- housing housing
as well
to middle-SES as well
as blind
housing hills
as as blind
and/or
well hills
bends
as blind hills
and/or
were
and/orbends
less were
frequent
bends lessless
but
were frequent
were agreed
frequentbutto
were
butbewereagreed
important tofactors
agreed be
to important factors
when present.
be important when
factors whenpresent.
present.
Figure
Figure 5. Frequently
5. Frequently
Figure observed
observed
5. Frequently configurations
configurations
observed of geographical,
configurations socio-economic,
socio-economic,
of geographical, andand
socio-economic, environmental
environmental
factors
factors present
present in pedestrian
pedestrian injury
injury hotspots
hotspots in urban Halifax. The
The number
number of
of hotspots
hotspots where
where
factors present in pedestrian injury hotspots in urban Halifax. The number of hotspots where each
each
each
factor
factor was
was observed
observed is
is listed
listed within
within parentheses.
parentheses.
factor was observed is listed within parentheses.
4. Discussion
4. Discussion
4. Discussion
This study was unique in that it sought to move beyond individual measures (e.g., statistical
This study waswasunique in that it sought to move beyond individual measures (e.g., statistical
analysis,This study
environmental unique
scans, orinGIS
that it sought
mapping) to to move beyond
characterize individual
environmental measures
features (e.g.,
associated statistical
with
analysis, environmental
analysis, environmental scans, or GIS
scans, or mapping)
GIS mapping) to characterize
to characterizeenvironmental
environmentalfeatures
featuresassociated
associated
higher risk of PMVC. Rather, it incorporated all of these measures with the net effect that patterns were
with higher
with risk of PMVC.
higher Rather, it incorporated all all
of these measures with thethenetnet
effect thatthat
revealed only byrisk of PMVC.
integration Rather,
of all it incorporated
modalities of reporting. of described
As these measures
in the with
results section effect
above,
patterns were
patterns revealed
were only
revealed by by
only integration
integration of all modalities
of all modalities of reporting. As As
of reporting. described in the
described results
in the results
section above, a specific pattern emerged in three of the ten PMVC hotspots. In each of
section above, a specific pattern emerged in three of the ten PMVC hotspots. In each of these, low- these, low- to toInt. J. Environ. Res. Public Health 2020, 17, 2066 10 of 15
a specific pattern emerged in three of the ten PMVC hotspots. In each of these, low- to middle-SES
housing was separated from a major roadside attraction by four or more lanes of traffic and blind bends
and/or hills. In addition, no median, crosswalk, or traffic calming measures were present, and blocks
were long. This unique combination of geographical, environmental, and SES factors was associated
with higher rates of pedestrian injury. A more generalized scenario that is representative of common
risk factors across all ten hotspots was also described and is again represented in Figure 5.
What sets this study apart was its use of multiple analytical methods to assess risk factors, as well
as ultimately utilizing an informal qualitative assessment to identify these patterns.
Of course, each urban area will feature unique constellations of risk factors. For this reason,
the integration of multiple analytic methods, united by a final qualitative assessment based on local
knowledge combined with quantitative results is of particular utility and is strongly recommended for
future research [53].
This research is decidedly qualitative despite being cloaked in quantitative clothing, which begs
the question of asking what makes research qualitative. Certainly there is discussion amongst scholars
as to what constitutes qualitative [54,55]. For the purposes of this study, we have used our inclusion
of observational study and inductive pattern recognition as a measure of qualitativeness [56]. This
was augmented by returning to the study site on three occasions as we sought to understand why
the patterns of injury differed so much from a previous study we conducted in Vancouver using the
same methods [4]. Returning to the same site over a period of time to try and unravel patterns is a
form of ethnography that is well suited to understanding why some intersections are manifestly high
risk while others are not [57]. Health research, especially spatial epidemiology, has not traditionally
embraced qualitative approaches [58] and we see an opportunity here to both expand the purview
of qualitative health research as well as the methods. Traditional epidemiology relies upon large
numbers and statistical measures of certainty to establish rigour, however, there are methods to
corroborate qualitative methods based on researcher reflexivity and justification of methods [59]. If the
final goals of using a qualitative approach is to extend understanding of a situation and find policy
solutions to a problem [60], then we believe that this paper achieves this based on its qualitative and
inductive approach.
Moreover, this study also stresses the importance of environmental scans and field work—including
the use of field notes, photography, and video—when conducting this type of research, as our
socio-economic results indicated that high SES DAs included almost as many injuries as low SES DAs.
While counterintuitive, our environmental scans provided some explanation for these results, such
as the presence of shelters that house populations often not captured by the census. In addition, we
relied on part of our team having local knowledge that allowed us to more easily identify key artifacts
such as the men’s shelter. Therefore, we encourage others to critically situate their findings using
qualitative-interpretive environmental scans [61]. In other words, we suggest that researchers not
only identify environmental correlates but seek to explain their unique configurations—especially
when those environmental configurations repeat, suggesting greater combined risk (see, for example,
Figure 5 above).
Of special interest is that the results of this study contrast starkly with previous studies conducted
with a similar dataset in Vancouver, Canada [4,5]. In the 2009 study [4], proximity to alcohol-serving
establishments was the greatest risk factor for increased PMVCs. The 2011 study [5] demonstrated
that pedestrian violations of crossing laws were high in areas with a higher density of alcohol-serving
establishments and lower in areas without bars. Conversely, in the HRM, only two of the top ten
hotspots had alcohol-serving establishments nearby. In Halifax, the attractants (and therefore risk
factors) were related to sports, recreation, and retail.
Ultimately, every hotspot is unique. There are, however, shared characteristics and combinations
of features between them. We are able to derive both specific and generalized profiles of high-risk
settings, comprising combinations of built-environment features and socio-economic characteristics.
Assessing these composites is, perhaps, the key to understanding patterns of risk in urban areas.Int. J. Environ. Res. Public Health 2020, 17, 2066 11 of 15
It may be that the combination of unique settlement patterns, geography, SES profile, transportation
infrastructure, and by-laws lead to unique risk signatures for different areas. Finally, the risk signature
must be influenced by volume of pedestrian traffic. Cinnamon et al. [5] used counters to measure
pedestrian traffic at hotspots at various times of day. Certainly, this framework could be expanded to
include traffic counts, although counts are capricious as they are influenced by extraneous factors such
as weather.
If indeed each city constitutes a unique risk signature, then this is the key to assessing and
remediating risk. Recognition of the existence of unique urban risk signatures requires individual
assessment based on known risk factors [4]. In other words, the literature and previous environmental
scans can provide a qualitative parameterization for environmental risk assessment for any given urban
area. However, the unique risk architecture for a place will emerge only as a result of environmental
scans combined with registry data for pedestrian injury. In this study, we used an environmental scan
matrix that had been compiled for our 2009 Vancouver study [4]; yet, when combined with SES data,
completely different risk profiles emerged.
Within the risk composites that emerge for PMVC, there will always be conflicting data.
For instance, we found that exclusive turn lanes were associated with a higher number of
pedestrian/motor vehicle injuries. While the data indicate that exclusive turns limit injuries in
the context of MVCs, this may not be the case with respect to PMVC. Alternatively, exclusive turn lanes
may indicate higher traffic volumes and thus increased complexity and risk for pedestrians. Likewise,
injury hotspots in the HRM were associated with long blocks but not bars, contradicting the 2009 study
in Vancouver [4]. Additionally, the VANDIX scores calculated in this study were relative to Halifax
(i.e., standard scores against the HRM mean VANDIX score), resulting in higher injury frequencies in
neighborhoods at either end of the SES spectrum compared to those in the middle. This unexpected
result prompted us to conduct a brief sensitivity analysis using standard scores against the Nova Scotia
mean and the Canada mean, each of which showed injuries being far more frequent in the highest
SES neighborhoods. As such, we reported our results relative to the HRM, but this underscores the
importance of spatial scale—as well as the importance of assessing unique risk signatures associated
with urban areas.
This study was limited in its ability to statistically infer risk factors due to limited sample size.
The use of census data to quantify local socio-economic deprivation at injury hotspots requires an
acknowledgement that the injured persons may not be residents of the area in which they were injured.
Theoretically, higher density neighborhoods are more likely to host clusters simply as a result of more
people walking. We did not find hotspots were in high density residential neighborhoods, though two
were in high traffic commercial zones.
The results of this study do, however, suggest that the built environment and its effect on
pedestrian injury risk varies geographically, such that risk factors identified in a given neighborhood,
city, or region may not necessarily hold true in other settings. Accordingly, local knowledge and
expertise is vital to developing a suitably nuanced understanding of patterns of injury and potential
responses towards reducing its burden.
Moreover, given that we were working with a 14-year span of data, it is possible that some
intersections underwent substantial or partial physical change over the course of the study period,
especially those in commercial zones. We expect that the level of commercial infrastructure may have
intensified in those areas, however, we are confident that the residential areas included in the scans
were relatively static.
Unique urban risk signatures are significant due to their ability to inform local policy. Since each
city has its own structure and local conditions that affect PMVC risk, any attempts to mitigate PMVCs
should take into account this structure and local conditions. This study, therefore, utilized a variety
of methods that included local knowledge and environmental scans. In this case, we can strongly
recommend the installation of crosswalks or pedestrian overpasses in several of the hotspots that were
studied. Additionally, given that nearly half of the PMVCs we studied occurred in areas of low SES orInt. J. Environ. Res. Public Health 2020, 17, 2066 12 of 15
were proximal to low- to middle-SES housing, our research once again illustrates that injury is related
to social determinants of health. Therefore, in addition to the numerous other benefits of increased
welfare, policies that attempt to reduce deprivation and inequality will also likely help to reduce the
burden of injury.
5. Conclusions
This study used a mixed-methods approach to identify the built-environment factors that
contribute to PMVCs in the HRM. More specifically, ten hotspots were identified based on data from
the Nova Scotia Trauma Registry, each of which were subject to environmental scans in both summer
and winter. Additionally, socio-economic deprivation using the VANDIX was calculated for the areas
surrounding the hotspots. Together, the environmental scans and SES data were used to create a
unique local risk signature for PMVCs in the HRM. Contributing factors to risk included roads with
four wide lanes of traffic across hills and blind bends, the presence of low- to middle-SES housing on
one side of the road and a roadside attraction on the other, and the absence of crosswalks, medians, or
traffic calming measures. As well, nearly half of PMVCs involved victims aged 11–30 years old. This
local risk signature may be significant for assessing and mitigating risk in the future.
Local knowledge and expertise were consulted throughout this process, and on-the-ground
environmental scans provided a more nuanced qualitative understanding of what contributed to
these hotspots. Accordingly, we emphasize the importance of going beyond strictly data-based
understandings of injury risk and towards more mixed-methods approaches that recognize the
uniqueness of cities and the value of on-the-ground research.
Author Contributions: N.S. conceptualized the study, organized and conducted environmental scans and drafted
the manuscript. B.B.W., N.L.Y. and O.A. made substantial contributions to the environmental scans in Halifax as
well as the interpretations of the results. B.B.W., and D.S. made significant contributions to the drafting of the
manuscript. B.B.W. and D.S. performed data analysis. All authors have read and agreed to the published version
of the manuscript.
Funding: This research received no external funding.
Acknowledgments: The authors acknowledge the Nova Scotia Trauma Registry for providing access to the
pedestrian injury data. This research was not directly funded. Research ethics were obtained from IWK Health
Centre Research Ethic Board (Project #1012595) and from Simon Fraser University Office of Research Services
(Study #2013s0873).
Conflicts of Interest: The authors declare no conflict of interest.
References
1. Haagsma, J.A.; Graetz, N.; Bolliger, I.; Naghavi, M.; Higashi, H.; Mullany, E.C.; Abera, S.F.; Abraham, J.P.;
Adofo, K.; Alsharif, U.; et al. The global burden of injury: Incidence, mortality, disability-adjusted life years
and time trends from the Global Burden of Disease study 2013. Inj. Prev. 2015, 22, 3–18. [CrossRef]
2. World Health Organization YLL Estimates, 2000–2012. Available online: http://www.who.int/healthinfo/
global_burden_disease/estimates/en/ (accessed on 12 December 2016).
3. World Health Organization Road Traffic Injuries. Available online: https://www.who.int/news-room/fact-
sheets/detail/road-traffic-injuries (accessed on 10 February 2020).
4. Schuurman, N.; Cinnamon, J.; Crooks, V.A.; Hameed, S.M. Pedestrian injury and the built environment:
An environmental scan of hotspots. BMC Public Health 2009, 9, 233. [CrossRef]
5. Cinnamon, J.; Schuurman, N.; Hameed, S.M. Pedestrian injury and human behaviour: Observing road-rule
violations at high-incident intersections. PLoS ONE 2011, 6, e21063. [CrossRef]
6. Tang, J.; Liang, J.; Han, C.; Li, Z.; Huang, H. Crash injury severity analysis using a two-layer Stacking
framework. Accid. Anal. Prev. 2019, 122, 226–238. [CrossRef] [PubMed]
7. Tang, J.; Zheng, L.; Han, C.; Yin, W.; Zhang, Y.; Zou, Y.; Huang, H. Statistical and machine-learning methods
for clearance time prediction of road incidents: A methodology review. Anal. Methods Accid. Res. 2020.
[CrossRef]Int. J. Environ. Res. Public Health 2020, 17, 2066 13 of 15
8. Yan, Y.; Dai, Y.; Li, X.; Tang, J.; Guo, Z. Driving risk assessment using driving behavior data under continuous
tunnel environment. Traffic Inj. Prev. 2019, 20, 807–812. [CrossRef] [PubMed]
9. Amram, O.; Walker, B.B.; Schuurman, N.; Pike, I.; Yanchar, N. Disparities in Paediatric Injury Mortality
between Aboriginal and Non-Aboriginal Populations in British Columbia, 2001–2009. Int. J. Environ. Res.
Public Health 2016, 13, 651. [CrossRef] [PubMed]
10. Amrhein, V.; Greenland, S.; McShane, B. Retire statistical significance. Nature 2019, 567, 305–307. [CrossRef]
11. Mixed Methods Research for Nursing and the Health Sciences; Andrew, S.; Halcomb, E. (Eds.) Wiley-Blackwell
Pub: Chichester, UK, 2009; ISBN 978-1-4051-6777-2.
12. Creswell, J. Mapping the Developing Landscape of Mixed Methods Research. In SAGE Handbook of Mixed
Methods in Social & Behavioral Research; Tashakkori, A., Teddlie, C., Eds.; SAGE Publications, Inc.: Thousand
Oaks, CA, USA, 2010; ISBN 978-1-4129-7266-6.
13. Crooks, V.A.; Schuurman, N.; Cinnamon, J.; Castleden, H.; Johnston, R. Refining a Location Analysis Model
Using a Mixed Methods Approach: Community Readiness as a Key Factor in Siting Rural Palliative Care
Services. J. Mix. Methods Res. 2011, 5, 77–95. [CrossRef]
14. Song, M.K.; Sandelowski, M.; Happ, M.B. Current Practices and Emerging Trends in Conducting Mixed
Methods Intervention Studies in the Health Sciences. In SAGE Handbook of Mixed Methods in Social &
Behavioral Research; Tashakkori, A., Teddlie, C., Eds.; SAGE Publications, Inc.: Thousand Oaks, CA, USA,
2010; ISBN 978-1-4129-7266-6.
15. Ukkusuri, S.; Miranda-Moreno, L.F.; Ramadurai, G.; Isa-Tavarez, J. The role of built environment on
pedestrian crash frequency. Saf. Sci. 2012, 50, 1141–1151. [CrossRef]
16. LaScala, E.A.; Gerber, D.; Gruenewald, P.J. Demographic and environmental correlates of pedestrian injury
collisions: A spatial analysis. Accid. Anal. Prev. 2000, 32, 651–658. [CrossRef]
17. Mohamed, M.G.; Saunier, N.; Miranda-Moreno, L.F.; Ukkusuri, S.V. A clustering regression approach:
A comprehensive injury severity analysis of pedestrian–vehicle crashes in New York, US and Montreal,
Canada. Saf. Sci. 2013, 54, 27–37. [CrossRef]
18. Quistberg, D.A.; Howard, E.J.; Ebel, B.E.; Moudon, A.V.; Saelens, B.E.; Hurvitz, P.M.; Curtin, J.E.; Rivara, F.P.
Multilevel models for evaluating the risk of pedestrian–motor vehicle collisions at intersections and
mid-blocks. Accid. Anal. Prev. 2015, 84, 99–111. [CrossRef] [PubMed]
19. Strauss, J.; Miranda-Moreno, L.F.; Morency, P. Multimodal injury risk analysis of road users at signalized and
non-signalized intersections. Accid. Anal. Prev. 2014, 71, 201–209. [CrossRef] [PubMed]
20. Wier, M.; Weintraub, J.; Humphreys, E.H.; Seto, E.; Bhatia, R. An area-level model of vehicle-pedestrian
injury collisions with implications for land use and transportation planning. Accid. Anal. Prev. 2009, 41,
137–145. [CrossRef]
21. Bennet, S.A.; Yiannakoulias, N. Motor-vehicle collisions involving child pedestrians at intersection and
mid-block locations. Accid. Anal. Prev. 2015, 78, 94–103. [CrossRef]
22. Lee, C.; Abdel-Aty, M. Comprehensive analysis of vehicle-pedestrian crashes at intersections in Florida.
Accid. Anal. Prev. 2005, 37, 775–786. [CrossRef]
23. Zajac, S.S.; Ivan, J.N. Factors influencing injury severity of motor vehicle-crossing pedestrian crashes in rural
Connecticut. Accid. Anal. Prev. 2003, 35, 369–379. [CrossRef]
24. Godley, S.T.; Triggs, T.J.; Fildes, B.N. Perceptual lane width, wide perceptual road centre markings and
driving speeds. Ergonomics 2004, 47, 237–256. [CrossRef]
25. Noland, R.B.; Oh, L. The effect of infrastructure and demographic change on traffic-related fatalities and
crashes: A case study of Illinois county-level data. Accid. Anal. Prev. 2004, 36, 525–532. [CrossRef]
26. Swift, P.; Painter, D.; Goldstein, M. Residential Street Typology and Injury Accident Frequency; Longmont
Planning Department: Longmont, CO, USA, 2006.
27. Ewing, R.; Dumbaugh, E. The Built Environment and Traffic Safety: A Review of Empirical Evidence. J. Plan.
Lit. 2009, 23, 347–367. [CrossRef]
28. Morency, P.; Archambault, J.; Cloutier, M.-S.; Tremblay, M.; Plante, C. Major urban road characteristics and
injured pedestrians: A representative survey of intersections in Montréal, Quebec. Can. J. Public Health 2015,
106, E388–E394. [CrossRef]
29. Morency, P.; Gauvin, L.; Plante, C.; Fournier, M.; Morency, C. Neighborhood social inequalities in road
traffic injuries: The influence of traffic volume and road design. Am. J. Public Health 2012, 102, 1112–1119.
[CrossRef]Int. J. Environ. Res. Public Health 2020, 17, 2066 14 of 15
30. Pulugurtha, S.S.; Sambhara, V.R. Pedestrian crash estimation models for signalized intersections. Accid. Anal.
Prev. 2011, 43, 439–446. [CrossRef]
31. Clifton, K.J.; Burnier, C.V.; Akar, G. Severity of injury resulting from pedestrian-vehicle crashes: What can we
learn from examining the built environment? Transp. Res. Part Transp. Environ. 2009, 14, 425–436. [CrossRef]
32. Moudon, A.V.; Lin, L.; Jiao, J.; Hurvitz, P.; Reeves, P. The risk of pedestrian injury and fatality in collisions
with motor vehicles, a social ecological study of state routes and city streets in King County, Washington.
Accid. Anal. Prev. 2011, 43, 11–24. [CrossRef] [PubMed]
33. Dommes, A.; Granié, M.; Cloutier, M.; Coquelet, C.; Huguenin-richard, F. Red light violations by adult
pedestrians and other safety-related behaviors at signalized crosswalks. Accid. Anal. Prev. 2015, 80, 67–75.
[CrossRef]
34. Yannis, G.; Papadimitriou, E.; Theofilatos, A. Pedestrian gap acceptance for mid-block street crossing. Transp.
Plan. Technol. 2013, 36, 450–462. [CrossRef]
35. Ponicki, W.R.; Gruenewald, P.J.; Remer, L.G. Spatial panel analyses of alcohol outlets and motor vehicle
crashes in California: 1999–2008. Accid. Anal. Prev. 2013, 55, 135–143. [CrossRef] [PubMed]
36. Sebert Kuhlmann, A.K.; Brett, J.; Thomas, D.; Sain, S. Environmental Characteristics Associated with
Pedestrian–Motor Vehicle Collisions in Denver, Colorado. Am. J. Public Health 2009, 99, 1632–1637. [CrossRef]
37. Dultz, L.A.; Frangos, S.G. The impact of alcohol in pedestrian trauma. Trauma 2013, 15, 75. [CrossRef]
38. Prijon, T.; Ermenc, B. Influence of alcohol intoxication of pedestrians on injuries in fatal road accidents.
Forensic Sci. Int. Suppl. Ser. 2009, 1, 33–34. [CrossRef]
39. Clifton, K.J.; Kreamer-Fults, K. An examination of the environmental attributes associated with
pedestrian-vehicular crashes near public schools. Accid. Anal. Prev. 2007, 39, 708–715. [CrossRef] [PubMed]
40. Islam, S.; Jones, S.L. Pedestrian at-fault crashes on rural and urban roadways in Alabama. Accid. Anal. Prev.
2014, 72, 267–276. [CrossRef]
41. Hess, P.M.; Moudon, A.V.; Matlick, J.M. Pedestrian safety and transit corridors. J. Public Transp. 2004, 7, 5.
[CrossRef]
42. Chakravarthy, B.; Anderson, C.L.; Ludlow, J.; Lotfipour, S.; Vaca, F.E. The relationship of pedestrian injuries
to socioeconomic characteristics in a large Southern California County. Traffic Inj. Prev. 2010, 11, 508–513.
[CrossRef]
43. Noland, R.B.; Klein, N.J.; Tulach, N.K. Do lower income areas have more pedestrian casualties? Accid. Anal.
Prev. 2013, 59, 337–345. [CrossRef]
44. Dai, D. Identifying clusters and risk factors of injuries in pedestrian–vehicle crashes in a GIS environment.
J. Transp. Geogr. 2012, 24, 206–214. [CrossRef]
45. Wang, W.; Guo, H.; Gao, Z.; Bubb, H. Individual differences of pedestrian behaviour in midblock crosswalk
and intersection. Int. J. Crashworthiness 2011, 16, 1–9. [CrossRef]
46. Liu, Y.C.; Tung, Y.C. Risk analysis of pedestrians’ road-crossing decisions: Effects of age, time gap, time of
day, and vehicle speed. Saf. Sci. 2014, 63, 77–82. [CrossRef]
47. Dommes, A.; Cavallo, V.; Oxley, J. Functional declines as predictors of risky street-crossing decisions in older
pedestrians. Accid. Anal. Prev. 2013, 59, 135–143. [CrossRef] [PubMed]
48. Walker, B.B.; Schuurman, N.; Hameed, S.M. A GIS-based spatiotemporal analysis of violent trauma hotspots
in Vancouver, Canada: Identification, contextualisation and intervention. BMJ Open 2014, 4, e003642.
[CrossRef] [PubMed]
49. Schuurman, N.; Cinnamon, J.; Walker, B.B.; Fawcett, V.; Nicol, A.; Hameed, S.M.; Matzopoulos, R. Intentional
injury and violence in Cape Town, South Africa: An epidemiological analysis of trauma admissions data.
Glob. Health Action 2015, 8, 27016. [CrossRef]
50. Schuurman, N.; Grund, D.; Hayes, M.; Dragicevic, S. Spatial/temporal mismatch: A conflation protocol for
Canada census spatial files. Can. Geogr. 2006, 50, 74–84. [CrossRef]
51. Bell, N.; Schuurman, N.; Oliver, L.; Hayes, M.V. Towards the construction of place-specific measures of
deprivation: A case study from the Vancouver metropolitan area. Can. Geogr. Géographe Can. 2007, 51,
444–461. [CrossRef]
52. Bell, N.; Schuurman, N.; Hayes, M.V. Using GIS-based methods of multicriteria analysis to construct
socio-economic deprivation indices. Int. J. Health Geogr. 2007, 6, 17. [CrossRef]
53. Teschke, K.; Dennis, J.; Reynolds, C.C.O.; Winters, M.; Harris, M.A. Bicycling crashes on streetcar (tram) or
train tracks: Mixed methods to identify prevention measures. BMC Public Health 2016, 16, 617. [CrossRef]You can also read