Alignment of Supermarket Own Brand Foods' Front-of-Pack Nutrition Labelling with Measures of Nutritional Quality: An Australian Perspective - MDPI
←
→
Page content transcription
If your browser does not render page correctly, please read the page content below
nutrients
Article
Alignment of Supermarket Own Brand Foods’
Front-of-Pack Nutrition Labelling with Measures of
Nutritional Quality: An Australian Perspective
Claire Elizabeth Pulker 1, * , Georgina S. A. Trapp 2,3 , Jane Anne Scott 1           and
Christina Mary Pollard 1,4
 1   School of Public Health, Curtin University, Kent Street, GPO Box U1987, Perth 6845,
     Western Australia, Australia; jane.scott@curtin.edu.au (J.A.S.); c.pollard@curtin.edu.au (C.M.P.)
 2   Telethon Kids Institute, The University of Western Australia, P.O. Box 855, West Perth 6872,
     Western Australia, Australia; gina.trapp@telethonkids.org.au
 3   School of Population and Global Health, The University of Western Australia, 35 Stirling Highway,
     Crawley 6009, Western Australia, Australia
 4   East Metropolitan Health Service, Kirkman House, 20 Murray Street, East Perth 6004,
     Western Australia, Australia
 *   Correspondence: c.pulker@curtin.edu.au; Tel.: +61-8-9266-0000

 Received: 12 September 2018; Accepted: 4 October 2018; Published: 9 October 2018

 Abstract: Two voluntary front-of-pack nutrition labels (FOPNL) are present in Australia:
 the government-led Health Star Ratings (HSR) and food industry-led Daily Intake Guide (DIG).
 Australia’s two largest supermarkets are key supporters of HSR, pledging uptake on all supermarket
 own brand foods (SOBF). This study aimed to examine prevalence of FOPNL on SOBF, and alignment
 with patterns of nutritional quality. Photographic audits of all SOBF present in three large
 supermarkets were conducted in Perth, Western Australia, in 2017. Foods were classified as nutritious
 or nutrient-poor based on the Australian Guide to Healthy Eating (AGTHE), NOVA level of food
 processing, and HSR score. Most (81.5%) SOBF featured FOPNL, with only 55.1% displaying HSR.
 HSR was present on 69.2% of Coles, 54.0% of Woolworths, and none of IGA SOBF. Half (51.3%) of
 SOBF were classified as nutritious using the AGTHE, but using NOVA, 56.9% were ultra-processed
 foods. Nutrient-poor and ultra-processed SOBF were more likely than nutritious foods to include HSR,
 yet many of these foods achieved HSR scores of 2.5 stars or above, implying they were a healthy
 choice. Supermarkets have a powerful position in the Australian food system, and they could do
 more to support healthy food selection through responsible FOPNL.

 Keywords: Health Star Rating; Daily Intake Guide; front-of-pack label; supermarket; supermarket
 own brand; private label; nutrition

1. Introduction
     Front-of-pack nutrition labels (FOPNL) have the potential to provide consumers with a convenient
guide to healthy food selection [1]. It is a highly contested area of food labelling [2], and a variety of
scoring systems and visual devices exist. They include initiatives from the food industry (e.g., the
international Choices Program [3]), government agencies (e.g., the UK traffic lights [4]), and some
supermarket scoring systems that are applied to shelf-edge labels of all foods (e.g., Guiding Stars [5]).
These FOPNL have been described using a continuum with reductive (i.e., facts only, with no evaluation
or recommendation) at one end, and evaluative (i.e., presence of the device indicates compliance with
predefined criteria) at the other, with hybrid or interpretive (i.e., a combination of facts and symbols) in
the middle [6]. They have also been categorised as nutrient-specific systems (i.e., display the amount

Nutrients 2018, 10, 1465; doi:10.3390/nu10101465                              www.mdpi.com/journal/nutrients
Nutrients 2018, 10, 1465                                                                          2 of 19

per serving of selected nutrients), summary indicator systems (i.e., a single symbol, icon, or score is
used to summarise the nutrient content), and food group information systems (i.e., symbols are used
to indicate presence of a specific food group) [1]. The policy objectives of each initiative can differ,
with some labelling systems which have been designed according to best practice for effective product
labels more likely to lead to changes in consumer purchasing behaviour than others [1,7]. The American
Institute of Medicine recommends use of a single standardised FOPNL, which appears on all products
in settings such as supermarkets, is promoted to consumers, and encourages reformulation of processed
foods [8]. In addition, FOPNL that are led or endorsed by governments and international health
agencies are generally regarded as the most credible [9].

1.1. FOPNL in Australia
      FOPNL is voluntary in Australia, and there are two commonly applied labelling systems.
The government-led Health Star Rating system (HSR) was designed to guide selection of healthier
packaged foods, and uses an nutrient profiling algorithm to assign each product a score from 12
to 5 health stars, with 5 stars indicating the healthiest choice [10]. Launched in 2014, the original
policy aim of the HSR was to guide consumers who have a wide range of literacy and numeracy
skills to select healthier foods by enabling comparison between individual foods, and increasing
awareness of the nutritional quality of foods, consistent with national dietary guidelines [11,12].
The objective of the HSR is summarised as: “To provide convenient, relevant and readily understood
nutrition information and/or guidance on food packs to assist consumers to make informed food purchases
and healthier eating choices” [13]. The food industry-led Daily Intake Guide (DIG), introduced in
2006 [14], aims to inform food selection by providing nutrition information for a serving of the
product on the front-of-pack, along with contribution to the daily intake of an average adult [15]
(Supplementary Figure S1). Comparison of the impact of the two Australian systems on consumer
food choice concluded that interpretive labels (or summary indicator systems) such as the HSR can
be more effective than reductive labels (or nutrient-specific systems) such as the DIG in guiding
food selection [16,17]. However, a New Zealand randomised controlled trial which compared the
effectiveness of traffic light labels, HSR and a control found the interpretive nutrition labels had no
effect on food purchases [18]. The authors attributed this finding in part to low uptake of HSR on
packaged foods in New Zealand and lack of awareness of the system [18]. To date, there is a lack
of ‘real world’ evidence of the effectiveness of government-led FOPNL on consumer purchasing
behaviour [7]. Therefore, the need to evaluate the impact of such labelling initiatives on public
health continues.
      Development of the HSR in Australia has not benefitted from the same levels of transparency
given to development of FOPNL and nutrient profiling criteria in countries such as the UK [19–21] and
France [22–26]. Although there has been considerable effort made by public health researchers to assess
the potential impact of FOPNL on consumer purchasing behaviour since implementation of the HSR,
there were no peer-reviewed studies that informed the development, validation, or implementation of
the system [6]. This may have been because the HSR algorithm was not specifically designed from
scratch to meet its policy aim. HSR system developers utilised the nutrient profiling criterion adopted
by Food Standards Australia New Zealand (FSANZ) to determine whether foods were eligible to make
health claims on packaging, which were in turn based on the UK nutrient profiling criterion used by
Ofcom to determine whether foods could be advertised to children [27]. While the UK model is the
most widely used and validated (for its purpose), adaptation from the original categorical scoring
to continuous scoring for a mnemonic device on pack required technical decision-making, including
setting HSR score cut-offs, that is currently unknown. In addition, a recent evaluation found that
alignment between the two Australian nutrient profiling systems (i.e., HSR and FSANZ health claims)
needed improving [28].
      Given this lack of transparency, Australian researchers have sought to determine the ability of
the HSR to assist consumers to select foods consistent with the recommendations of the Australian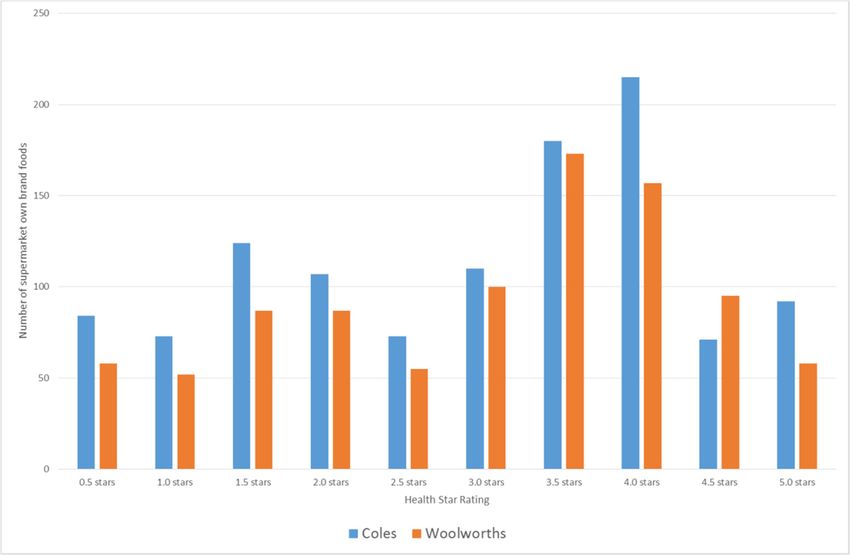
Nutrients 2018, 10, 1465                                                                                                 3 of 19

Dietary Guidelines [12]. To assist consumers to select the recommended nutritious five food group
foods (a) the algorithm that underpins the HSR needs to correctly allocate scores that are consistent
with national dietary guidelines; (b) the HSR should be widely applied to packaged foods; and (c)
consumers who have a wide range of literacy and numeracy skills should understand how to use the
HSR to guide selection of nutritious foods. The ability of the HSR to identify nutritious foods has
been examined by studies seeking to determine whether total sugar should be substituted with added
sugar in the HSR algorithm [29], and test the accuracy of HSR scores for dairy foods [30]. Researchers
have attempted to measure uptake of the voluntary HSR on packaged foods [31], and examine the
preference and ability of consumers to use HSR in several studies [17,32–36]. In addition, HSR may
encourage reformulation of packaged food to improve the nutrient profile, which has been assessed in
New Zealand [37] and Australia [38].
     Two studies have specifically assessed congruence between HSR and the Australian Dietary
Guidelines [12], with important differences in findings [39,40]. One concluded that the “scope of genuine
misalignment between the [Australian Dietary Guidelines] and HSR algorithm across the Australian food
supply is very small” [39] (p. 11), while the other concluded that “the HSR system is undermining the
[Australian Dietary Guideline] recommendations”, as it did not consistently demarcate between nutritious
and nutrient-poor foods [40] (p. 11). The difference in findings from these two studies can be explained
by examining the methodologies employed, summarised in Table 1. Methodological decisions made
about extracting or calculating the HSR score, rigour of food group classification, and allocating HSR
cut-off points that are deemed appropriate to indicate nutritious and nutrient-poor foods, can influence
study findings regardless of sample size. Questions about the ability of HSR to assist Australian
consumers to select nutritious foods therefore remain.

      Table 1. Methodological decisions that can influence study findings on whether HSR product scores
      are consistent with recommendations of the Australian Dietary Guidelines.

        Methodological Decision                    Study 1 [39]                                Study 2 [40]
                                      The George Institute for Global             The Mintel Global New Products
                                      Health’s Australian                         Database which collects packaging
      Source of data                  FoodSwitchDatabase, which conducts          data and images of all new packaged
                                      annual surveys and receives data from       foods launched in Australia and New
                                      manufacturers and consumers                 Zealand
      Date                            1 January 2013–30 June 2017                 27 June 2014–30 June 2017
      Number of products included
                                      n = 65,660                                  n = 1269
      in analysis
                                      Calculated from nutrition information
                                      present on pack, and proxy values
                                                                                  Extracted from packaging
                                      were estimated for missing values
      HSR product score                                                           photographic images, not calculated
                                      (e.g., fruit, vegetable, nut, legume, or
                                                                                  for products with no HSR displayed
                                      fibre content which are not required
                                      on labels)
                                                                                  Classification of recommended
                                                                                  nutritious foods was informed by the
                                                                                  Australian Dietary Guidelines
                                      Classification of recommended               Educator’s Guide [42]; classification of
      Classification of products      nutritious foods was informed by the        nutrient-poor foods utilised the
      consistent with the             Australian Dietary Guidelines [12];         Australian Bureau of Statistic’s
      recommendations of the          classification of nutrient-poor foods       Principles for Identifying
      Australian Dietary Guidelines   utilised the Australian Bureau of           Discretionary Foods, and the
                                      Statistic’s Discretionary Food List [41].   Discretionary Food List [41].Products
                                                                                  difficult to classify were coded by
                                                                                  each author individually and then a
                                                                                  consensus decision made.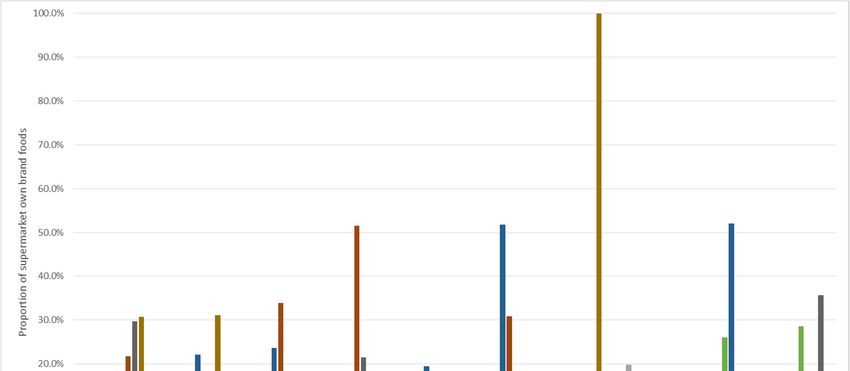
Nutrients 2018, 10, 1465                                                                                              4 of 19

                                                     Table 1. Cont.

        Methodological Decision                    Study 1 [39]                             Study 2 [40]
                                       No justification provided. However, a
                                       study which analysed alignment of
                                       the HSR with the Traffic Light system
                                                                                A HSR of 2.5 was deemed to be a
                                       used by the New South Wales
      Determination of HSR scores                                              ‘pass’ rating appropriate for nutritious
                                       Government to identify nutritious
      consistent with the Australian                                            foods; a HSR of 2.0 or lower was
                                       foods in settings such as schools,
      Dietary Guidelines                                                        deemed to be a ‘fail’ rating
                                       hospitals, and workplaces
                                                                                appropriate for nutrient-poor foods.
                                       recommended that foods with HSR ≥
                                       3.5 were more likely to be ‘green’ or
                                       nutritious [43].
      HSR demarcation of               Nutritious foods should not have a      Nutritious foods should not have a
      recommended nutritious foods     HSR ≤ 2.0Nutrient-poor foods should     HSR ≤ 2.0Nutrient-poor foods should
      and nutrient-poor foods          not have a HSR ≥ 3.5                    not have a HSR ≥ 2.5
                                               HSR is Health Star Rating.

1.2. FOPNL on Supermarket Own Brand Foods
     Supermarkets have been identified as key supporters of FOPNL. In Australia, the two dominant
supermarket chains who account for over 70% of Australian grocery sales [44] pledged to implement
the HSR on all supermarket own brand foods (SOBF) [45], and therefore stop using the DIG [14].
SOBF (also known as private label, in-house brand, store brand, retailer brand, or home brand)
are owned by retailers, wholesalers or distributors and sold privately in their own stores [46].
These products make a significant contribution to the global food supply and are predicted to grow until
they dominate, led by the world’s largest supermarket chains [47]. In Australia, SOBF are predicted to
reach 35 percent of grocery sales by 2020 [48]. Other packaged foods, or branded foods (also known
as national brands, manufacturer brands, premium brands), are owned by food manufacturers [46].
Data from 2017 indicated two supermarket chains, Coles and Woolworths, and discount retailer Aldi
contributed over half of the products adopting the HSR in Australia [31]. Similarly, a UK study found
that almost all products that carried the government-endorsed traffic light system in the first two years
of implementation were SOBF from three supermarket chains [49]. Supermarkets in other countries
have implemented nutrient profiling schemes to guide healthy food choice on shelf-edge labels [50],
and set targets for the amount of healthy foods sold [51].
     Supermarkets have a powerful position in the Australian food system [52] and their decision to
support the HSR is significant. Specific examination of uptake of FOPNL on SOBF, and alignment
with patterns of nutritional quality are therefore warranted. Assessing FOPNL present on SOBF is
important to monitor ongoing implementation of HSR. Alignment of HSR scores on SOBF with the
national food selection guide (Australian Guide to Healthy Eating (AGTHE) [12]) can inform the likely
impact of the labelling system on public health, given their leadership in HSR implementation and
market share. Application of the NOVA classification of level of food processing [53] adds to the
analysis of alignment between systems used to measure nutritional quality of foods and HSR.
     This study aimed to address three research questions: (1) What is the prevalence of nutrition
labels on the front-of-pack of Australian SOBF? (2) How do Australian SOBF rate for nutritional quality
using three different measures: the AGTHE (food group-based), NOVA (food processing-based),
and HSR (nutrient-based)? (3) Are Australian supermarkets using the HSR to promote nutritious or
nutrient-poor own brand foods?

2. Materials and Methods
     This study provides a ‘moment-in-time’ examination of SOBF in Perth, Western Australia,
including prevalence of the DIG and HSR on SOBF, the HSR scores present, and the nutritional
quality of SOBF displaying and not displaying the HSR. Alignment of the HSR with other measures of
nutritional quality is also analysed (Supplementary Figure S2).
Nutrients 2018, 10, 1465 5 of 19
2.1. Selection of Supermarkets
Supermarket audits were conducted in one of each major supermarket chain present in
Western Australia, i.e., Coles Supermarkets Australia Pty Ltd. (Coles, Melbourne, Australia),
Woolworths Supermarkets (Woolworths, Sydney, Australia), and Independent Grocery Association
Supermarkets (IGA, Perth, Australia). Aldi was excluded from this audit due to the different nature
of the retail outlets, whereby a limited range of mainly SOBF are sold at discounted prices [54].
The selected supermarkets were conveniently located in Perth in Western Australia, and were large
stores with an increased likelihood of displaying most of the SOBF available. The selected Woolworths
‘next generation’ store had been recently extensively refurbished [55]. The selected IGA was an
‘IGA store of the year’ for Western Australia. The selected Coles was the nearest large store to the
parent company Wesfarmers’ offices.
2.2. Identification of Supermarket Own Brand Foods
Supermarket own brands were identified by use of the supermarket’s branding on the
front-of-pack, and by referring to the supermarkets’ websites [56,57]. All packaged foods and
non-alcoholic beverages (referred to simply as ‘food’ hereon in) carrying a supermarket own brand
were included in the supermarket audits, including packaged unprocessed fresh food such as fruit,
vegetables, and meat. The following foods were collected during the supermarket audits, but excluded
from this study as the HSR is not an appropriate guide to selection: infant formula, infant food, baking
ingredients (e.g., baking powder), culinary condiments (e.g., dried herbs and spices, salt, vinegar)
plain coffee, and tea.
2.3. Data Collection
Two researchers visited each of the three stores together during a three-week period commencing
in February 2017, to conduct audits of SOBF. The main purpose of the audits was to assess the
nature and extent of SOBF in Australia, including products available, price, placement, promotion,
and nutritional quality. Therefore, data collection involved taking photographic images of the
front-of-pack, the shelf-edge label that displayed the price, the location of the product within the
store and on the shelf, and any promotional material present. Quality control procedures were
implemented to ensure the photographic images captured all the required information for all SOBF
present. Photographs were uploaded regularly to a laptop computer and checked for legibility at the
end of each day. Any illegible photographs that could not be used were listed and retaken during
subsequent visits.
2.4. Front-of-Pack Data Extraction
Photographic images were filed electronically. Relevant details were extracted from the images
into Excel databases created for each of the supermarkets. Within each supermarket’s spreadsheet,
18 worksheets were created to capture the information for each product group. Product groups
were designated based on the layout of the stores audited, where similar foods were co-located.
Within each product group (e.g., bakery and desserts), food groups were created (e.g., biscuits, cakes).
Pre-coded responses were established for each column for consistency of data entry. Free text was
only permitted for information such as the product name and description. Data entry for the first
food group was piloted to ensure all necessary information was entered and to establish any final
pre-coding changes needed. Two researchers conducted data extraction from the photographic images.
Both researchers reviewed the data for accuracy and changes were implemented by the first author as
required to ensure consistency of approach.
The data extracted from the photographic images included information displayed on the
front-of-pack, such as supermarket own brand, product name and description, pack weight or volume,
and voluntary nutrition labels. The FOPNL identified in this audit included: (a) the HSR only; (b) theNutrients 2018, 10, 1465 6 of 19
HSR plus kilojoules per 100 g; (c) the HSR plus kilojoules, saturated fat, sugars, sodium per 100 g and
an optional nutrient; (d) the HSR energy only icon [58]; (e) the DIG thumbnail icon which displays
kilojoules per serve; and (f) the DIG preferred format of kilojoules, fat, saturated fat, sugars and sodium
per serve [15].
2.5. Assessment of Nutritional Quality
The nutritional quality of all SOBF present was assessed using front-of-pack information only.
Nutritional quality was assessed using the recommendations of the AGTHE, which identifies nutritious
foods which are part of the recommended five food groups, and energy-dense-nutrient-poor or
‘discretionary’ foods which should be limited [12]. The NOVA classification of level of food processing,
which aims to address the impact of industrial food processing on health, was also applied [53].
The HSR provided on the front-of-pack was recorded as displayed, and was not calculated for
products where it was not present. Although the HSR is not intended to be used on fruit, vegetables,
meat, poultry and fish, they are not excluded [15], therefore these products were not excluded from
the analysis. A HSR of 2.0 or less was taken to be an appropriate cut-off for nutrient-poor foods, and a
HSR of 2.5 or more appropriate for nutritious foods [40]. The use of 2.5 stars as a ‘pass’ rating is
logical and has more credibility as a potential consumer education message than use of 3.5 stars [40].
For example, consumers could be advised that foods with HSR of at least 2.5 stars are more likely to be
a nutritious choice. It is not logical to have a system which attributes 3 stars out of a possible 5 stars to
a nutrient-poor food that is not consistent with the AGTHE and expect consumers to deduce it would
be a poor food choice. It is also not consistent with dietary guideline recommendations to discourage
consumption of nutrient-poor discretionary foods. Qualitative research has confirmed that consumers
tended to use the HSR in a binary way, categorising foods with HSR of 2 stars or less as unhealthy,
and foods with HSR of 3 stars or more as healthier [35].
The AGTHE nutritious five food groups included: vegetables, legumes and beans; fruit; grain or
cereal foods; lean meat, poultry, fish, eggs, tofu, nuts, and seeds; and milk, yoghurt, cheese, and their
alternatives. Nutrient-poor discretionary foods include items that are high in saturated fat, sugars, salt,
or alcohol. Examples are provided in the Educator’s Guide [42]; however, they are limited to whole
foods, not meals or mixed foods, and provide overarching principles that can be applied to dietary
analysis more easily than packaged food classification. The Australian Bureau of Statistics (ABS) has
established principles for identifying discretionary foods [41]. The ABS principles were adapted for this
study, as there were many ready-to-eat products present in the audit which were not addressed by the
ABS criteria, and product nutrition information was not available to inform classification. A decision
tree was constructed to enable classification of products in accordance with the recommendations
of the AGTHE, with the addition of two new food groups: ‘Mixed products using mainly five food
group foods’, and ‘Mixed products high in fat, salt or sugar’ (Supplementary Table S1).
The NOVA classifications included: unprocessed or minimally processed foods (e.g., fruit,
vegetables, meat, grains, nuts); processed culinary ingredients (e.g., salt, sugar, vegetable oils,
butter); processed foods which are simple foods made with few ingredients (e.g., canned vegetables,
canned fish, cheese, cured or smoked meat); and ultra-processed foods (UPF), which are nutrient-poor,
industrial formulations that include ingredients or processes not found in the home (e.g., savoury
snacks, cereal bars, biscuits, instant sauces, pre-prepared dishes such as pies and pizzas) [53].
Studies have shown UPF have higher saturated fat, sugar and sodium content compared to less
processed foods [53,59]. High levels of UPF consumption have been associated with excess weight [60],
increased risk of cancer [61], and reduced diet quality [62]. The recommendations of the AGTHE and
the HSR algorithm do not currently consider the level of food processing; however, researchers have
identified the benefits of incorporating consideration of the level of food processing into national
policies to improve dietary health [63].Nutrients 2018, 10, 1465 7 of 19
2.6. Statistical Analysis
Data were analysed using the SPSS for Windows statistical software package version 24 (IBM Corp.
Released 2016. Armonk, NY, USA: IBM Corp USA). The frequency of use of six different formats
of FOPNL was compared between the three supermarkets. A comparison of the frequency of HSR
labels on foods classified using the AGTHE food groups, and the NOVA levels of food processing was
produced. For SOBF displaying the HSR, mean HSR, standard deviation, minimum, and maximum
were derived for all AGTHE food groups and foods classified using the NOVA levels of food processing.
Charts that displayed the frequency of HSR scores by supermarket chain, AGTHE food group,
and NOVA level of food processing were prepared. Chi-square tests of independence were performed
to examine the relationship between presence of HSR on the front-of-pack of SOBF and their nutritional
quality as assessed using the AGTHE and NOVA, and to examine the relationship between foods that
achieved a HSR of 2.5 or above and HSR of 2.0 and below and their nutritional quality as assessed
using the AGTHE and NOVA.
3. Results
Approximately 20,000 photographic images were collected for 3940 SOBF in this audit. There were
1812 SOBF present in the Woolworths store, 1731 SOBF in the Coles store, and 397 SOBF in the IGA store.
After excluding infant formula, infant food, baking ingredients, culinary condiments, plain coffee,
and tea, there were 3737 SOBF included in this study: 1707 from Woolworths, 1645 from Coles,
and 385 from IGA (Table 2).
Table 2. Front-of-pack nutrition labels present on supermarket own brand foods in Australia.
Coles Woolworths IGA All Supermarkets
Frequency Percent Frequency Percent Frequency Percent Frequency Percent
Health Star Rating with kJ and nutrients 662 40.2% 570 33.4% 0 0.0% 1232 33.0%
Health Star Rating with kJ 149 9.1% 118 6.9% 0 0.0% 267 7.1%
Health Star Rating only 318 19.3% 233 13.6% 0 0.0% 551 14.7%
Health Star Rating energy only icon 9 0.5% 0 0.0% 0 0.0% 9 0.2%
Sub-total: Health Star Rating present 1138 69.2% 921 54.0% 0 0.0% 2059 55.1%
Daily Intake Guide with kJ and nutrients 185 11.2% 408 23.9% 159 41.3% 752 20.1%
Daily Intake Guide kJ only 29 1.8% 52 3.0% 153 39.7% 234 6.3%
Sub-total: Daily Intake Guide present 214 13.0% 460 26.9% 312 81.0% 986 26.4%
Total: Front-of-pack nutrition labels present 1352 82.2% 1381 80.9% 312 81.0% 3045 81.5%
Total 1645 1707 385 3737
3.1. Prevalence of Front-of-Pack Nutrition Labels on Supermarket Own Brand Foods
Most SOBF (81.5%) featured either the HSR or DIG on the front-of-pack (Table 2), no products
included both. Over half of all SOBF (55.1%) featured the HSR. Coles had the largest proportion of
foods featuring the HSR (69.2%), followed by Woolworths (54.0%), and the HSR was not present
on any SOBF in IGA. The full HSR logo that includes kilojoules and nutrient information was the
most commonly used version across Coles and Woolworths, present on 33.0% of all audited products.
A quarter of SOBF (26.4%) featured the DIG. The DIG was present on most IGA SOBF (81.0%), 26.9% of
Woolworths, and 13.0% of Coles SOBF.
Analysis of presence of FOPNL on SOBF included packaged unprocessed fresh food such
as fruit, vegetables, and meat (n = 438), even though the HSR was not intended to be used on
such foods. HSR was present on 4.1% of all packaged fresh foods, including: fish, beef, pork, lamb,
vegetables. DIG was present on 2.7% of all packaged fresh foods, including: beef, pork, lamb, herbs,
chicken and vegetables.
3.2. Nutritional Quality of Supermarket Own Brand Foods Using the Australian Guide to Healthy Eating
Using the principles of the AGTHE, half (51.3%) of the SOBF present in this study were classified
as nutritious foods, 46.6% were nutrient-poor, and 2.1% were culinary ingredients (e.g., mustard,Nutrients 2018, 10, 1465 8 of 19
liquid stock) (Table 3). The nutritious food group with the most SOBF present was the meat and meat
substitute group which included lean meat, fish, eggs, tofu, nuts and seeds (14.0%), followed by grain
or cereal foods (13.0%). However, the proportion of nutrient-poor discretionary SOBF present was far
greater at 45.2%.
Table 3. Health Star Rating scores for supermarket own brand foods in Australia, classified by
nutritional quality.
Supermarket Supermarket Own
Own Brand Brand Foods Health Star Rating
Foods Present Displaying HSR
N % N % Mean SD Min. Max.
Australian Guide to Healthy Eating food groups
Nutritious foods
Vegetables, legumes and beans 351 9.4 101 4.9 4.34 0.604 2.0 5.0
Fruit 166 4.4 77 3.8 4.04 0.802 2.5 5.0
Grain or cereal foods 484 13.0 263 12.8 3.92 0.727 1.5 5.0
Lean meat, fish, eggs, tofu, nuts and seeds 523 14.0 223 10.9 4.11 0.524 2.0 5.0
Milk, yogurt, cheese, alternatives 185 5.0 113 5.5 3.04 1.258 0.5 5.0
Mixed product using mainly five food group foods 184 4.9 172 8.4 3.65 0.376 3.0 4.5
Water 25 0.7 11 0.5 5.00 0.000 5.0 5.0
Sub-total: nutritious foods 1918 51.3 960 46.9 3.88 0.806 0.5 5.0
Nutrient-poor foods
Discretionary foods 1689 45.2 1025 50.1 2.09 1.102 0.5 5.0
Mixed product high in fat sugar or salt 52 1.4 50 2.4 2.90 0.995 0.5 4.0
Sub-total: nutrient-poor foods 1741 46.6 1075 52.5 2.13 1.110 0.5 5.0
Other foods
Culinary ingredients/other 78 2.1 14 0.7 3.64 0.929 2.0 5.0
NOVA food processing classification
Unprocessed or minimally processed 928 24.8 313 15.3 4.35 0.790 0.5 5.0
Processed culinary ingredients 119 3.2 59 2.9 2.62 1.303 0.5 5.0
Processed foods 564 15.1 341 16.6 3.46 1.114 0.5 5.0
Ultra-processed foods 2126 56.9 1336 65.2 2.52 1.178 0.5 5.0
Total 3737 2049 54.6 2.96 1.310 0.5 5.0
N is number, SD is standard deviation, Min. is minimum, Max. is maximum.
3.3. Nutritional Quality of Supermarket Own Brand Foods Using NOVA
Over half (56.9%) of all SOBF were classified as UPF (Table 3). A quarter (24.8%) of SOBF
were unprocessed or minimally processed, 15.1% were processed foods, and 3.2% were processed
culinary ingredients.
3.4. Nutritional Quality of Supermarket Own Brand Foods Using HSR Scores
The HSR was not calculated for foods that did not display the device (n = 1688), so the dataset
used for analysis includes 2049 SOBF. The mean HSR of all SOBF was 2.96 (range 0.5–5.0, n = 2049).
The mean HSR for Coles SOBF was 2.92 (range 0.5–5.0, n = 1129), and the mean HSR for Woolworths
SOBF was 3.01 (range 0.5–5.0, n = 921). The most frequently occurring HSR scores were 3.5 stars
(Coles n = 180, Woolworths n = 173) and 4.0 stars (Coles n = 215, Woolworths n = 157) (Figure 1).
More of the Woolworths SOBF scored HSR of ≥2.5 compared to Coles SOBF (69.1% for Woolworths,
65.7% for Coles).Nutrients 2018, 10, 1465 9 of 19
Nutrients 2018, 10, x FOR PEER REVIEW 9 of 20
Figure 1.
Figure 1. Frequency
Frequency of
of Health
Health Star
Star Rating
Rating scores
scores for
for supermarket
supermarket own
own brand
brand foods.
foods.
3.5.
3.5. Alignment
Alignment between
between HSR
HSR and
and Other
Other Measures
Measures of
of Nutritional
Nutritional Quality
Quality
Supermarket
Supermarketown ownbrand
brandfood
foodgroups
groupsclassified
classifiedasasnutritious
nutritioususing
usingthethe
AGTHE
AGTHE achieved
achieved a range of
a range
mean
of meanHSRHSRscores (Table(Table
scores 3). Mean HSR scores
3). Mean HSR for nutritious
scores food groups
for nutritious foodwere all above
groups werethe all designated
above the
cut-off of 2.5cut-off
designated stars. ofVegetables, legumes and
2.5 stars. Vegetables, beans had
legumes and abeans
meanhad HSRa of 4.3; HSR
mean fruit of
had a mean
4.3; HSRa
fruit had
of
mean HSR of 4.0; grain or cereal foods had a mean HSR of 3.9; lean meat, fish, eggs tofu, nuts, had
4.0; grain or cereal foods had a mean HSR of 3.9; lean meat, fish, eggs tofu, nuts, and seeds and
aseeds
mean HSR
had of 4.1;
a mean milk,
HSR yogurt,
of 4.1; milk,cheese,
yogurt,and alternatives
cheese, had a mean
and alternatives had aHSR
meanof HSR
3.0; and mixed
of 3.0; foods
and mixed
using
foods mainly five food
using mainly group
five foodfoods
grouphadfoods
a mean hadHSR of 3.7.HSR
a mean However,
of 3.7.Figure 2 shows
However, the frequency
Figure 2 shows the of
HSR scores for each food group; 26.5% of the milk, yogurt, cheese, and alternatives
frequency of HSR scores for each food group; 26.5% of the milk, yogurt, cheese, and alternatives food food group scored
below
group 2.5 stars.below
scored Nutrient-poor
2.5 stars.SOBF failed to achieve
Nutrient-poor SOBF mean
failedHSR scores ofmean
to achieve the designated
HSR scores cut-off of
of the
2.0 or below. Discretionary foods had a mean HSR of 2.1; and mixed foods high
designated cut-off of 2.0 or below. Discretionary foods had a mean HSR of 2.1; and mixed foods highin fat sugar or salt had
ainmean HSR or
fat sugar of 2.9.
salt Figure
had a 2meanshows the of
HSR frequency
2.9. Figureof HSR scores
2 shows theforfrequency
these nutrient-poor
of HSR scoresfoods; for39% of
these
discretionary
nutrient-poorfoods foods;and39% 84% of mixed products
of discretionary foodshighand in fatof
84% sugar
mixed or products
salt scoredhigh
HSRinoffat
2.5sugar
or over.
or salt
The
scored food
HSR ofgroups recommended in the NOVA classification system as the foundation of healthy
2.5 or over.
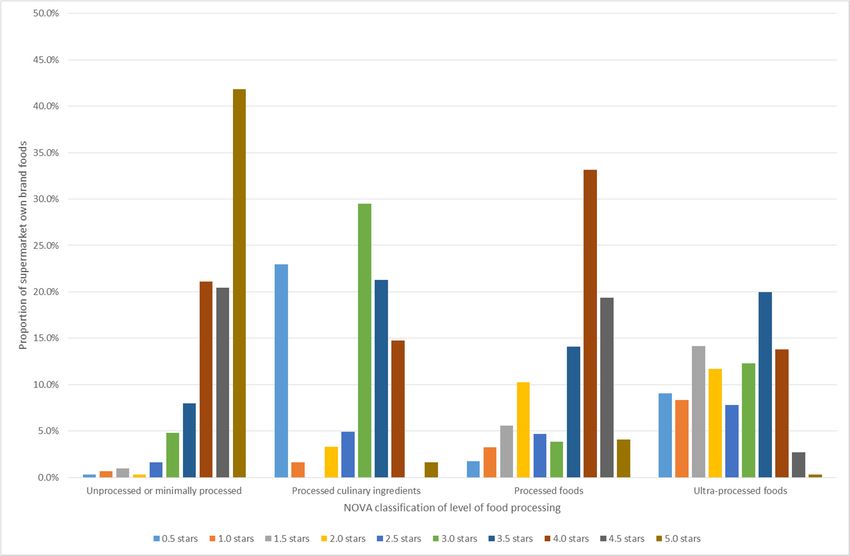
dietary patterns, unprocessed and minimally processed foods, achieved a mean HSR of 4.4 (Table 3).
Processed foods achieved a mean HSR of 3.5, and processed culinary ingredients achieved a mean HSR
of 2.6. The food group recommended to be avoided in the NOVA classification system, nutrient-poor
UPF, achieved a mean HSR of 2.5. Therefore, nutrient-poor ultra-processed SOBF failed to meet the
designated HSR cut-off of 2.0 or below. Figure 3 shows the frequency of HSR scores for the NOVA
food groups: 98% of nutritious unprocessed or minimally processed foods scored HSR of 2.5 or over;
however, 55% of nutrient-poor UPF also scored HSR of 2.5 or over.Nutrients 2018, 10, 1465 10 of 19
Nutrients 2018, 10, x FOR PEER REVIEW 10 of 20
Figure 2.
Figure 2. Frequency
Frequency of
ofHealth
HealthStar
StarRating
Ratingscores
scores
forfor supermarket
supermarket own
own brand
brand foods
foods classified
classified using
using the
the principles of the Australian Guide to Healthy
principles of the Australian Guide to Healthy Eating.Eating.
Nutrients 2018, 10, x FOR PEER REVIEW 11 of 20
The food groups recommended in the NOVA classification system as the foundation of healthy
dietary patterns, unprocessed and minimally processed foods, achieved a mean HSR of 4.4 (Table 3).
Processed foods achieved a mean HSR of 3.5, and processed culinary ingredients achieved a mean
HSR of 2.6. The food group recommended to be avoided in the NOVA classification system, nutrient-
poor UPF, achieved a mean HSR of 2.5. Therefore, nutrient-poor ultra-processed SOBF failed to meet
the designated HSR cut-off of 2.0 or below. Figure 3 shows the frequency of HSR scores for the NOVA
food groups: 98% of nutritious unprocessed or minimally processed foods scored HSR of 2.5 or over;
however, 55% of nutrient-poor UPF also scored HSR of 2.5 or over.
Figure 3.
Figure 3. Frequency
Frequency of ofHealth
HealthStar
StarRating
Ratingscores
scores
forfor supermarket
supermarket own
own brand
brand foods
foods classified
classified using
using the
the NOVA level of food processing.
NOVA level of food processing.
3.6. Presence of HSR on Nutritious and Nutrient-Poor Supermarket Own Brand Foods
A chi-square test of independence was performed to examine the relationship between presence
of HSR on the front-of-pack of SOBF and their nutritional quality (Table 4). Using the AGTHE food
group classifications, nutrient-poor SOBF were more likely to display HSR than nutritious foods.
Using the NOVA classification of level of food processing, nutrient-poor UPF were more likely to
display HSR than other foods.Nutrients 2018, 10, 1465 11 of 19
3.6. Presence of HSR on Nutritious and Nutrient-Poor Supermarket Own Brand Foods
A chi-square test of independence was performed to examine the relationship between presence of
HSR on the front-of-pack of SOBF and their nutritional quality (Table 4). Using the AGTHE food group
classifications, nutrient-poor SOBF were more likely to display HSR than nutritious foods. Using the
NOVA classification of level of food processing, nutrient-poor UPF were more likely to display HSR
than other foods.
Table 4. Chi-square test of independence between presence of HSR on the front-of-pack of supermarket
own brand foods and their nutritional quality.
Health Star Rating No Health Star Chi Square Tests
Nutritional Quality Present Rating Present of Independence
N (Percent) N (Percent) χ2 p Value
Australian Guide to Healthy Eating classification
Nutrient-poor foods 1075 (52.8%) 666 (41.0%)
51.509Nutrients 2018, 10, 1465 12 of 19
“more beneficial for shoppers . . . due to the increased nutritional information it provides” [65]. It is interesting
to note that Metcash is a member of the government-led Healthy Food Partnership (HFP) [66],
which advocates use of the HSR as a key support to their work on product reformulation [67]. As HSR
and the HFP are the only two Australian government initiatives which aim to address population
dietary health, lack of HSR uptake by a HFP member deserves further examination.
Findings indicate that while good progress had been made in applying the HSR to SOBF,
neither Coles nor Woolworths had fulfilled their commitments to label all SOBF with the HSR by
2016 [45]. This is important, because the two supermarkets privately govern the Australian food
system [52], and failure to fulfil commitments may erode trust in their ability. Only a third of SOBF
from the bread and alternatives product group displayed either the HSR or DIG. However, many of
these products were from the in-store bakery, which carried labels with branding, ingredients and
allergen information only. All foods carrying a supermarket own brand on the label were included in
this study, including packaged fresh whole foods such as fruit, vegetables, fish and meat, which the
HSR style guide states the system was not intended for [58]. However, few of the prepacked fresh
foods displayed either the HSR or DIG. The only foods excluded from analysis were infant formula,
infant food, baking ingredients, culinary condiments, plain coffee, and tea, as the HSR cannot usefully
guide selection of these items. The HSR system is currently undergoing a five-year review, and one
of the areas of consideration is the foods it should appear on [68]. Given an automatic five-star
rating currently applies to packaged water [58], which is a product not required to carry nutrition
information [69], and the fact that supermarkets are currently displaying the HSR on selected fresh
whole foods such as meat, it is logical to encourage its use across packaged whole foods, especially the
nutritious foods recommended in the AGTHE [12]. Scoring of these recommended nutritious whole
foods needs to be considered, one option being allocation of the same automatic five-star rating as
water. In addition, consideration of applying the HSR to shelf-edge tags for unpackaged or fresh whole
foods, similar to the American Guiding Stars system [70], should be considered.
An assessment of the proportion of packaged products displaying the HSR in Sydney
supermarkets in 2017 [31] had some differences in findings to this assessment of SOBF in Perth
supermarkets. There were more SOBF identified in the Perth stores, which is only partly explained by
the inclusion of packaged whole fresh foods that carried an own brand on the label. Some of these
foods, including packaged fresh meat, displayed the HSR which was the reason for their inclusion.
There were more Coles SOBF foods which carried the HSR on labels identified in the Sydney audit
(1246 versus 1128), which could be a result of differences in the products sold between locations,
or the timing of the audits. The differences were more pronounced when comparing findings for
Woolworths. The Perth audit identified considerably more Woolworths SOBF foods which carried the
HSR (921 versus 713); however, the greater number of SOBF overall meant that the proportion reported
in this study was significantly lower compared to the Sydney-based study [31]. Similarly, there were
considerable differences in the IGA findings. More than double the number of SOBF were identified
in the Perth audit compared to the Sydney audit. IGA supermarkets are not centrally managed,
and available products are selected by the owner or manager. Therefore, the difference in the number
of SOBF is not surprising. Studies found no (or one) IGA SOBF carried the HSR. These differences
in findings for the number of SOBF present, and the proportion displaying the HSR, indicate that
examination of differences in product availability between the Australian States and Territories is
needed. This is important because most Australian studies assessing attributes of supermarket
environments to date have been conducted in Sydney and Melbourne [71], and findings may not
translate to other metropolitan areas within Australia.
The nutritional quality of SOBF identified in this study was assessed using three different
measures: the AGTHE [12], NOVA [53], and HSR [72]. Most Australians do not eat the recommended
amount of nutritious foods needed for good health, and a third of population energy intake was
from nutrient-poor discretionary foods in 2011–12 [73]. Only half of the SOBF present were classified
as nutritious foods recommended by the AGTHE. This proportion is higher than that of a recentNutrients 2018, 10, 1465 13 of 19
evaluation of the nutritional quality of the Australian food supply [74], only partly explained by the
inclusion of packaged fresh whole foods in this study. Over half of the SOBF present were classified as
nutrient-poor UPF. This is consistent with other studies that have found a large proportion of such
highly processed foods present in the Australian food supply [74,75]. In fact, most new products
launched in Australia in 2015 were UPF [76]. Supermarkets control development of SOBF by suppliers
and can determine the nutritional quality [77]. They can also use SOBF to influence consumer food
choice [78]. This study shows that more effort is needed by Australian supermarkets to ensure their
contribution to the food supply supports healthy food selection.
A range of mean HSR scores were obtained for each of the AGTHE nutritious five food groups in
this study. Three of the five food groups achieved a mean HSR above 4 stars, and few of these foods
scored less than 2.5 stars. However, of the recommended dairy foods with HSR present, a quarter
failed to be scored as nutritious. Previous investigation of the ability of HSR to identify nutritious
dairy foods also found a large proportion scored less than 2.5 stars, particularly hard cheeses [79].
The authors attributed this finding to the contribution of saturated fat content to the HSR algorithm [79].
Technical flaws in the ability of the HSR algorithm to identify recommended dairy foods have also
been identified by Lawrence et al. [40]. The mean HSR scores for nutrient-poor discretionary foods,
mixed products high in fat sugar or salt, and UPF, and the predominance of UPF with HSR scores
indicating they were nutritious choices, further illuminate the inconsistencies between HSR and other
measures of nutritional quality. This study’s findings indicate the HSR algorithm currently fails to
score recommended dairy foods, discretionary foods, mixed products high in fat sugar or salt, or
UPF appropriately.
The French FOPNL was also based on the UK nutrient profiling model used by Ofcom to regulate
food advertising to children [26]. Unlike the HSR, the French Nutri-Score label underwent analysis
for consistency with the French nutritional recommendations, whereby adaptations were made to the
algorithm to improve the ability of the system to discriminate between recommended and nutrient-poor
foods [26]. In Australia, a wide variety of nutritious five food group foods are recommended [42].
Advice is also given on the amount to eat and best choices to make, for example: choose canned
legumes and vegetables without added salt, whole fruit is preferable to fruit juice, wholegrains are
preferable to refined grains, no more than 455g of cooked lean red meat is recommended each week,
low and reduced-fat dairy foods are better choices for most people compared to full-fat dairy foods [42].
Adapting the algorithm to ensure it promotes the recommendations of the Australian Dietary
Guidelines using the same three levels of detail examined in the French study [26] is recommended:
across food groups (i.e., nutritious and nutrient-poor food groups obtain scores that are demarcated),
within food groups (i.e., best choices and all other choices obtain scores that are demarcated),
and similar products from different brands obtain scores that allow for meaningful comparison.
Several studies have assessed the alignment of FOPNL with dietary guidelines, and there is
a current lack of consistency in the cut-off scores assigned to identify nutritious and nutrient-poor
foods. For example, the French study that assessed the ability of the Nutri-Score label to discriminate
nutritional quality stated that foods to be encouraged (i.e., nutritious foods) should have a green or
yellow rating, and foods to be limited (i.e., nutrient-poor or energy-dense foods) should have a pink
or red rating; the midway rating of orange was not applied to either group [26]. Applying the same
cut-off principles to the HSR would translate to nutritious foods attaining ≥3.5 stars, and nutrient-poor
foods attaining ≤2.0 stars. One Australian study assigned cut-off scores to identify HSR that were
‘apparent outliers’, stating nutrient-poor foods should not score ≥3.5 stars, and nutritious foods should
not score ≤2.0 stars [39]. Other Australian studies have used HSR of 3.5 as a cut-off to distinguish
between foods that are recommended in the dietary guidelines, and nutrient-poor discretionary
foods [29,31,74,80]. They refer to work which analysed the alignment of the HSR with the colour-coded
Traffic Light system used by the New South Wales Government to identify nutritious foods in settings
such as schools, hospitals, and workplaces [43]. Another Australian study used HSR of ≥2.5 to indicate
scores that are appropriate for nutritious foods [40]. Given FOPNL is a highly contested area of foodNutrients 2018, 10, 1465 14 of 19
labelling [2], and selection of HSR scores considered appropriate for nutritious and nutrient-poor
foods can impact findings, robust and transparent analysis of the implications of HSR cut-off scores
is recommended.
The current study’s findings indicate that application of HSR by two supermarkets on SOBF has
served to promote nutrient-poor food choices. Nutrient-poor and ultra-processed SOBF were more
likely to include the HSR on the front-of-pack than nutritious foods, and many achieved HSR scores of
2.5 stars and over, inaccurately indicating they were a healthy choice. These findings are likely to reflect
flaws inherent in the system which are currently being considered in a five-year review [68], rather than
supermarket decision-making per se. Decisions made by the HSR advisory committee to exclude foods
such as packaged fruit, vegetables, meat, and fish from the expectation of HSR labelling, but assign an
automatic five stars to packaged water [58], means the recommendations of the Australian Dietary
Guidelines [12] are not promoted consistently. Specific concerns about the ability of the HSR algorithm
to promote recommended nutritious foods have also been raised [40,81–84]. Regardless, Australia’s
two largest supermarkets [44], which wield enormous power over the food system [52], have been
key supporters of the HSR, leading uptake on packaged food [31]. Coles and Woolworths have
participated in Australian government-led population nutrition initiatives such as HSR and the HFP
since 2009, but their influence is unknown [52]. In particular, lack of transparency over development,
validation, and implementation of HSR in Australia means the drivers of decision-making remain
hidden. Research to determine the nature and extent of influence by supermarkets, and others with
vested interests, over decisions that affect national nutrition policy (i.e., HSR and HFP) is needed.
Strengths of this study include the large sample size, and the specific focus on examining use
of FOPNL on SOBF which was driven by the commitment of two supermarkets to adopt the HSR
across all SOBF. In addition, the supermarket audit methodology collected data over three weeks from
three large stores, which were purposively selected to give an increased likelihood of most of the
SOBF being available. The extensive data collection conducted over a short time period meant that
only front-of-pack photographs were taken. Therefore, the ABS discretionary food list, which uses
nutrient cut-offs in some of its definitions, was not suitable for classification of foods consistent with
the recommendations of the AGTHE in this study. However, a rigorous process was developed to
ensure consistency in using front-of-pack information for classification, and some products displayed
the full HSR label, which includes nutrient information. Data were collected in Perth in Western
Australia, and findings may not translate to other Australian metropolitan areas, as consistency in
SOBF availability is currently not known. Seasonality may also affect findings, and as this study was
conducted between the end of the Australian school summer holidays and Easter, supermarket audits
conducted at other times of the year may find different SOBF availability.
5. Conclusions
This study found that most SOBF present in three Perth supermarkets included a FOPNL.
HSR application was widespread on the Coles SOBF, present on over half of the Woolworths
SOBF, but not present on any of the IGA SOBF, which used the DIG instead. Nutrient-poor and
ultra-processed SOBF were more likely to include the HSR on the front-of-pack than nutritious foods,
and many of these foods achieved HSR scores indicating they were a healthy choice. Supermarkets
have a powerful position in the Australian food system, and they could do more to support healthy
food selection. Recommendations for supermarkets include:
(i) Use their influence and power by advocating to government for changes to the HSR algorithm,
to ensure it achieves the original policy aim of identifying healthier foods consistent with the
Australian Dietary Guidelines;
(ii) Apply the HSR to all foods including packaged unprocessed fresh foods such as fruit, vegetables,
fish and meat;
(iii) After the algorithm has been modified to ensure it achieves the original policy aim, Coles and
Woolworths should fulfil their commitments to label all SOBF with the HSR and remove the DIGNutrients 2018, 10, 1465 15 of 19
from packaging. Metcash should support application of HSR to all SOBF and remove the DIG
from packaging;
(iv) Consider setting targets to improve the proportion of SOBF that are classified as nutritious using
the AGTHE, NOVA, or HSR score; and
(v) Increase transparency of contributions to key government-led initiatives that aim to improve the
dietary health of all Australians (i.e., HSR and HFP).
In addition, future research recommendations include:
(i) Compare differences in SOBF availability between the Australian States and Territories,
to determine whether supermarket audit findings can be translated between metropolitan regions.
(ii) Adapt the HSR algorithm to ensure it promotes the recommendations of the Australian Dietary
Guidelines using three levels of detail: across food groups (i.e., nutritious and nutrient-poor food
groups obtain scores that are demarcated), within food groups (i.e., best choices and all other
choices obtain scores that are demarcated), and similar products from different brands obtain
scores that allow for meaningful comparison. In particular, this study’s findings indicate the
HSR algorithm currently fails to score nutritious dairy foods, nutrient-poor discretionary foods,
mixed products high in fat sugar or salt, or UPF appropriately.
(iii) Assess and report on the nature and extent of supermarket (i.e., Coles and Woolworths),
and wholesaler (i.e., Metcash) influence over decisions that affect Australian food and nutrition
policy, by analysing their contribution to HSR and the HFP.
Supplementary Materials: The following are available online at http://www.mdpi.com/2072-6643/10/10/1465/
s1, Table S1: Procedure to classify foods consistent with the Australian Guide to Healthy Eating; Figure S1: Front
of pack nutrition labels present in Australia; Figure S2: The research process.
Author Contributions: C.E.P. conceived the study design and research objectives in consultation with C.M.P.,
C.E.P. developed the research questions and store audit guide, C.E.P collected the data, completed data entry, and
analysed the data, C.E.P. wrote the first draft of the article in consultation with C.M.P., J.A.S., G.S.A.T. and C.M.P
reviewed the manuscript and contributed to subsequent drafts.
Funding: This research was funded by Healthway grant number 24124 and NHMRC grant number 1073233.
Acknowledgments: C.E.P. is supported through a Western Australian Health Promotion Foundation (Healthway)
PhD Scholarship (24124) and an Australian Government Research Training Program Scholarship. The authors
would like to thank Frances Foulkes-Taylor for assistance with data collection and data entry.
Conflicts of Interest: The authors declare no conflict of interest. The funders had no role in the design of the
study; in the collection, analyses, or interpretation of data; in the writing of the manuscript; and in the decision to
publish the results.
References
1. IOM (Institute of Medicine). Examination of Front-of-Package Nutrition Rating Systems and Symbols: Phase I
Report; The National Academies Press: Washington, DC, USA, 2010.
2. Lobstein, T.; Davies, S. Defining and labelling ‘healthy’ and ‘unhealthy’ food. Public Health Nutr. 2009,
12, 331–340. [CrossRef] [PubMed]
3. Dotsch-Klerk, M.; Jansen, L. The choices programme: A simple, front-of-pack stamp making healthy choices
easy. Asia Pac. J. Clin. Nutr. 2008, 17, 383–386. [PubMed]
4. Food Standards Agency. Board Agrees Principles for Front of Pack Labelling. Available online:
https://web.archive.org/web/20080724182226/www.food.gov.uk/news/newsarchive/2006/mar/
signpostnewsmarch (accessed on 13 August 2018).
5. Fischer, L.M.; Sutherland, L.A.; Kaley, L.A.; Fox, T.A.; Hasler, C.M.; Nobel, J.; Kantor, M.A.; Blumberg, J.
Development and implementation of the Guiding Stars nutrition guidance program. Am. J. Health Promot.
2011, 26, e55–e63. [CrossRef] [PubMed]
6. Hamlin, R. Front of pack nutrition labelling, nutrition, quality and consumer choices. Curr. Nutr. Rep. 2015,
4, 1–7. [CrossRef]Nutrients 2018, 10, 1465 16 of 19
7. Kanter, R.; Vanderlee, L.; Vandevijvere, S. Front-of-package nutrition labelling policy: Global progress and
future directions. Public Health Nutr. 2018, 21, 1–10. [CrossRef] [PubMed]
8. IOM (Institute of Medicine). Front-of-Package Nutrition Rating Systems and Symbols: Promoting Healthier Choices;
The National Academies Press: Washington, DC, USA, 2012.
9. Hawley, K.L.; Roberto, C.A.; Bragg, M.A.; Liu, P.J.; Schwartz, M.B.; Brownell, K.D. The science on
front-of-package food labels. Public Health Nutr. 2013, 16, 430–439. [CrossRef] [PubMed]
10. Department of Health. Health Star Rating System. Available online: http://healthstarrating.gov.au/internet/
healthstarrating/publishing.nsf/Content/About-health-stars (accessed on 20 July 2015).
11. Department of Health. Australia and New Zealand Food Regulation Ministerial Council Front of Pack
Labelling Policy Statement. Available online: http://foodregulation.gov.au/internet/fr/publishing.nsf/
Content/publication-Policy-Statement-on-Front-of-Pack-Labelling (accessed on 3 November 2017).
12. National Health and Medical Research Council. Australian Dietary Guidelines; Commonwealth of Australia:
Canberra, Australia, 2013.
13. Food Regulation Secretariat. Front-of-Pack Labelling (FOPL) Project Committee Meeting—11 May 2012.
Available online: http://foodregulation.gov.au/internet/fr/publishing.nsf/Content/frontofpackcommittee
(accessed on 12 September 2018).
14. Australian Food and Grocery Council. Daily Intake Labelling. Available online: http://www.afgc.org.au/
key-projects/daily-intake-labelling/ (accessed on 5 February 2016).
15. Australian Food and Grocery Council. The Daily Intake Guide Style Guide. Available online: https://
www.afgc.org.au/our-expertise/health-nutrition-and-scientific-affairs/afgcbestpracticeguides/ (accessed
on 31 January 2018).
16. Talati, Z.; Norman, R.; Pettigrew, S.; Neal, B.; Kelly, B.; Dixon, H.; Ball, K.; Miller, C.; Shilton, T. The impact
of interpretive and reductive front-of-pack labels on food choice and willingness to pay. Int. J. Behav. Nutr.
Phys. Acct. 2017, 14, 171. [CrossRef] [PubMed]
17. Talati, Z.; Pettigrew, S.; Ball, K.; Hughes, C.; Kelly, B.; Neal, B.; Dixon, H. The relative ability of different
front-of-pack labels to assist consumers discriminate between healthy, moderately healthy, and unhealthy
foods. Food Qual. Preference 2017, 59, 109–113. [CrossRef]
18. Ni Mhurchu, C.; Volkova, E.; Jiang, Y.; Eyles, H.; Michie, J.; Neal, B.; Blakely, T.; Swinburn, B.; Rayner, M.
Effects of interpretive nutrition labels on consumer food purchases: The Starlight randomized controlled trial.
Am. J. Clin. Nutr. 2017. [CrossRef] [PubMed]
19. Scarborough, P.; Rayner, M.; Stockley, L. Developing nutrient profile models: A systematic approach.
Public Health Nutr. 2007, 10, 330–336. [CrossRef] [PubMed]
20. Rayner, M.; Scarborough, P.; Lobstein, T. The UK Ofcom Nutrient Profiling Model: Defining ‘Healthy’
and ‘Unhealthy’ Foods and Drinks for TV Advertising to Children; OfCom: London, UK, 2009;
Available online: https://www.ndph.ox.ac.uk/cpnp/files/about/uk-ofcom-nutrient-profile-model.pdf
(accessed on 3 November 2017).
21. Arambepola, C.; Scarborough, P.; Rayner, M. Validating a nutrient profile model. Public Health Nutr. 2008,
11, 371–378. [CrossRef] [PubMed]
22. Julia, C.; Méjean, C.; Touvier, M.; Péneau, S.; Lassale, C.; Ducrot, P.; Hercberg, S.; Kesse-Guyot, E. Validation of
the FSA nutrient profiling system dietary index in French adults—Findings from Suvimax study. Eur. J. Nutr.
2016, 55, 1901–1910. [CrossRef] [PubMed]
23. Julia, C.; Kesse-Guyot, E.; Ducrot, P.; Péneau, S.; Touvier, M.; Méjean, C.; Hercberg, S. Performance of a five
category front-of-pack labelling system–the 5-colour nutrition label–to differentiate nutritional quality of
breakfast cereals in France. BMC Public Health 2015, 15, 179. [CrossRef] [PubMed]
24. Julia, C.; Etilé, F.; Hercberg, S. Front-of-pack Nutri-score labelling in France: An evidence-based policy.
Lancet Public Health 2018, 3, e164. [CrossRef]
25. Julia, C.; Péneau, S.; Buscail, C.; Gonzalez, R.; Touvier, M.; Hercberg, S.; Kesse-Guyot, E. Perception of
different formats of front-of-pack nutrition labels according to sociodemographic, lifestyle and dietary factors
in a French population: Cross-sectional study among the nutrinet-santé cohort participants. BMJ Open 2017,
7, e016108. [CrossRef] [PubMed]
26. Julia, C.; Ducrot, P.; Péneau, S.; Deschamps, V.; Méjean, C.; Fézeu, L.; Touvier, M.; Hercberg, S.; Kesse-Guyot, E.
Discriminating nutritional quality of foods using the 5-color nutrition label in the French food market:
Consistency with nutritional recommendations. Nutr. J. 2015, 14, 100. [CrossRef] [PubMed]You can also read