Staple Food Item Availability among Small Retailers in Providence, RI - MDPI
←
→
Page content transcription
If your browser does not render page correctly, please read the page content below
International Journal of
           Environmental Research
           and Public Health

Article
Staple Food Item Availability among Small Retailers
in Providence, RI
Yuyao Huang 1 , Alison Tovar 1 , John Taylor 2                 and Maya Vadiveloo 1, *
 1    Department of Nutrition and Food Sciences, University of Rhode Island, Kingston, RI 02881, USA;
      yuyao_huang@my.uri.edu (Y.H.); alison_tovar@uri.edu (A.T.)
 2    Department of Plant Sciences and Entomology, University of Rhode Island, Kingston, RI 02881, USA;
      jr_taylor@uri.edu
 *    Correspondence: maya_vadiveloo@uri.edu; Tel.: +1-401-874-2992

 Received: 28 February 2019; Accepted: 14 March 2019; Published: 23 March 2019

 Abstract: Inventory requirements for authorized Supplemental Nutrition Assistance Program (SNAP)
 retailers have undergone several revisions to increase the availability of healthful foods. A proposed
 rule of 84 staple food items was not implemented due to concerns that stores would not withstand
 this expansion, resulting in a final rule requiring 36 items. This study used the Food Access Research
 Atlas data to characterize food provisions in 30 small retailers in areas with high and low proportions
 of SNAP and racial minority residents in Providence, Rhode Island (RI). Stores were assessed with
 an audit instrument to tally variety, perishability, and depth of stock of four staple food categories.
 Descriptive, analysis of variance, and chi-square analyses were performed. Across stores, 80%
 were compliant with the final rule, but 66.7% would need to expand their offerings to meet the
 proposed rule. Mean dairy variety was lowest among all categories (p < 0.05). Most stores met
 the perishability (92.3%) and depth-of-stock requirements (96.1%) under both rules. No difference
 was detected between areas with high and low proportions of SNAP and racial minority residents.
 Future expansion of requirements may increase healthful food availability without imposing undue
 burdens on retailers in Providence, RI, excluding increased requirements for dairy variety.

 Keywords: food environment; food desert; SNAP; food assistance; community; local food culture;
 nutrition; small food stores; food insecurity

1. Introduction
       In the United States, the prevalence of obesity among adults increased linearly in the periods of
1999–2000 and 2015–2016 (30.5%–39.8%) [1]. In particular, obesity rates are disproportionally higher
among Hispanic (47.0%) and non-Hispanic black (46.8%) adults, compared to other racial/ethnic
groups [1]. Additionally, 21.2% of non-Hispanic black and 18.3% of Hispanic households live
under the federal poverty level nationwide [2], which could exacerbate obesity rates, given the
proportional relationship between obesity and poverty rate [3]. Low socio-economic (SES) populations
(i.e., populations with lower income and lower education level) also have lower diet quality than
high-SES populations, and the difference in the Alternate Healthy Eating Index 2010 score between
high-SES and low-SES groups increased substantially 3.9–7.8 from 1999–2000 to 2009–2010, with
non-Hispanic black adults having the lowest diet quality among all ethnicities [4]. One contributor to
their lower diet quality and subsequently higher obesity prevalence may be limited access to healthful
foods [5–8]. According to a systematic review in 2010 [9], lower-income neighborhoods have fewer
food outlets and are less likely to provide healthful food options to residents. While low-income
households with automobiles often travel beyond the nearest stores to shop for food [10], 2.3 million
households in the U.S. do not have access to a vehicle or public transit, and are estimated to live

Int. J. Environ. Res. Public Health 2019, 16, 1052; doi:10.3390/ijerph16061052           www.mdpi.com/journal/ijerph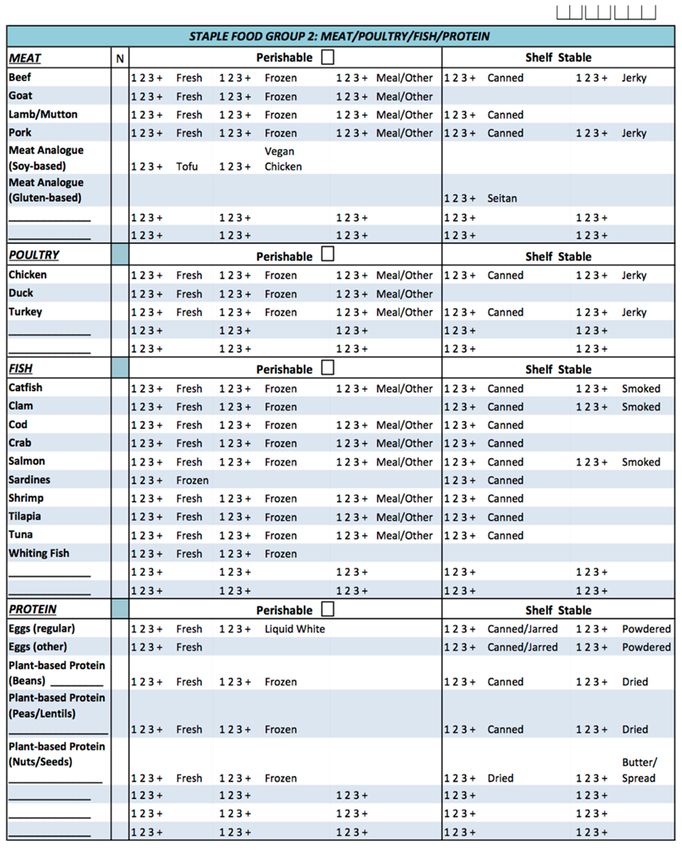
Int. J. Environ. Res. Public Health 2019, 16, 1052                                                   2 of 23

more than a mile from a supermarket [11]. Low-income and predominantly black and Hispanic
neighborhoods have fewer supermarkets, and blacks, on average, travel a greater distance to reach
their nearest supermarket [9]. Areas with limited food access, often termed “food deserts”, commonly
exist in low-income neighborhoods with predominantly black and Hispanic populations [9,12–14].
Residents in these underserved neighborhoods may benefit from increased selections of foods in the
limited number of small retailers readily accessible to them.
      One program intended to improve diet quality among those experiencing food insecurity is the
United States Department of Agriculture (USDA) Supplemental Nutrition Assistance Program (SNAP),
which subsidizes foods consumed at home, excluding alcohol, supplements and medicines, and hot
foods [15]. Recently, SNAP proposed expanding stores’ inventory requirements in an effort to improve
healthful food access for low-income populations, among whom 42 million participate in SNAP [16].
While SNAP receipt has reduced food insecurity [17,18], participation is associated with a higher Body
Mass Index (BMI), waist circumference, and metabolic risk factors [19], and SNAP participants have
higher obesity rates than income-eligible and higher-income nonparticipants (40% versus 32% and
30%, respectively) [20]. Additionally, while the evidence is not conclusive, the general consensus is
that SNAP recipients have lower diet quality compared to higher-income non-participants, and that
most low-income populations, regardless of SNAP participation, fail to meet the Dietary Guidelines
for Americans [21,22].
      To encourage consumption of healthful foods among SNAP participants, public health efforts
have promoted multiple interventions that aim at improving food purchasing behavior. One successful
effort which was instrumental in informing the development of SNAP inventory requirements was
expanding the provision of healthful foods in small food retailers [23–28]. Several attempts have been
made at increasing the variety and quantity of staple foods that SNAP-authorized stores are required
to carry. According to the USDA Food and Nutrition Service (FNS), staple foods are defined as basic
food items that make up a significant portion of an individual’s diet and are usually prepared at home
and consumed as a major component of a meal [29]. This broad definition allowed for certain food
items that could be regarded as accessory foods to be counted toward staple foods, such as cream
cheese, cream, and butter. The original rule from the Food Stamp Act of 1977 [30] required stores to
carry a minimum of three varieties under each of the four staple food categories: fruits and vegetables;
meat, poultry, and fish; breads and cereals; and dairy, including at least two categories with perishable
items (with a minimal stocking of 12 items). In February 2016, a new rule was proposed to increase
the number of required staple items to 168 (a minimum of seven varieties in four categories, plus six
depth-of-stock, i.e., the minimum number of units of every variety). However, depth-of-stock was
reduced to three (84 items in total, i.e., 4 categories × 7 varieties × 3 depth of stock) in December
2016 (hereafter referred to as the proposed rule), due to concerns that the expansion would impose
a substantial burden on small retailers [31]. One common concern was that the increase in the
number of perishable items would result in spoilage and waste, the cost of which is non-refundable
by manufacturers. Another concern was stocking logistics, such as a larger quantity of food items
exceeding the available shelf space [31]. Others expected that it would be difficult for retailers to carry
the proposed seven varieties in the meat, poultry, and fish category and the dairy category, and in
response to this particular concern, the proposed rule incorporated plant-based products as eligible
varieties in these two categories [31]. However, the proposed rule was not implemented, due to the
Consolidated Appropriations Act in 2017 that required revision of the definition of “variety” [32].
The final rule, which became effective in January 2018, reinstated the requirements of the original rule,
plus a minimum depth of stock of three (36 items in total). (See Appendix A and footnotes of Table
3 for details.)
      The idea that the proposed expansion of the rule is unacceptable stems from the concerns of
an increased administrative burden and profit loss for smaller retailers [33–36]; however, current
knowledge about whether smaller retailers would adapt to the more stringent inventory requirements
is limited. Therefore, it is important to evaluate how well they can meet the different requirements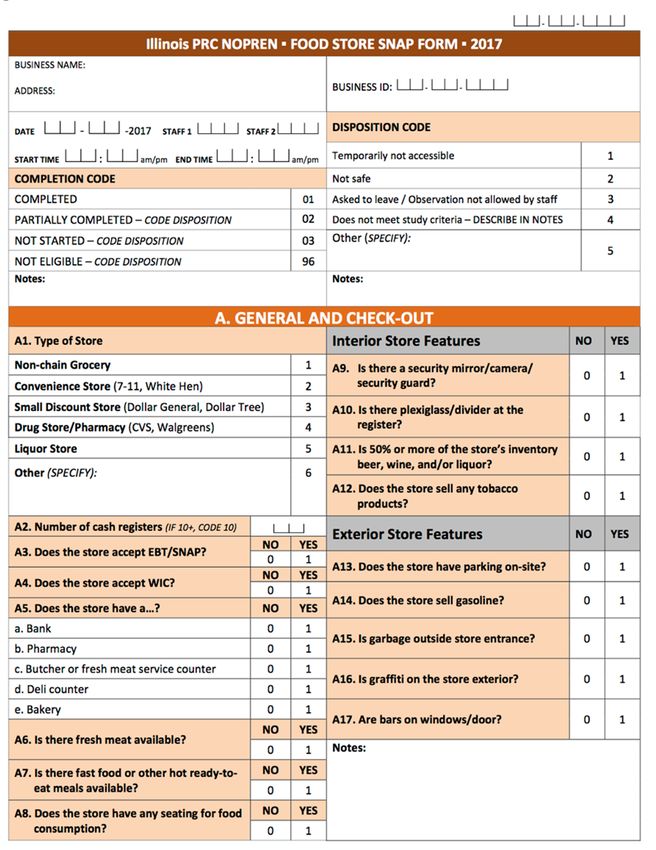
Int. J. Environ. Res. Public Health 2019, 16, 1052                                                        3 of 23

to help determine whether the concerns related to cost and burden are well-founded. In addition,
the perishability of foods within each category was also explored (i.e., whether a store carries a variety
of foods by having predominantly perishable items or shelf-stable ones), as it has been reported that
SNAP participants with limited access to perishable foods, particularly fruits and vegetables, have
lower expenditure on those foods, which are part of a healthful dietary pattern [21,37].
      Therefore, this study set out to characterize the food availability of 30 small retailers (approximately
73% of total small retailers) in five census tracts identified as food deserts in Providence, a city in the state
of Rhode Island (RI), aiming to help inform future inventory rules. This study stemmed from a multi-site
project conducted by the Illinois Prevention Research Centers (PRC) Nutrition and Obesity Policy Research
and Evaluation Network (NOPREN) Collaborating Center [38]. Specifically, the following questions were
examined: (1) What proportion of the retailers met the different requirements, including variety, perishable
categories (hereafter referred to as perishability), depth-of-stock, and total stocking in the original rule,
final rule, and proposed rule, respectively; (2) On average, how many varieties, varieties of perishable
items, depth-of-stock, and total stocking did stores carry in each of the four staple food categories; (3) What
proportion of the retailers carried perishable items within each category (though this was not a requirement
in any of the rules); and for all three questions, we compared whether there was a difference between areas
with high and low proportions of SNAP and racial minority populations.

2. Materials and Methods

2.1. Overview
     A total of 30 stores were sampled from selected food deserts in Providence, RI. A five-page audit
instrument was used to collect information at each store. To assess the store inventory status under
the original rule prior to the implementation of the current rule in January 2018, data collection took
place in November and December 2017, skipping the week before Thanksgiving and the week of
Thanksgiving, due to a potential inventory change for the holiday.

2.2. Sampling
      Because of the important role small retailers play in healthful food purchases in low-income
neighborhoods, this study focused on assessing small food stores in selected food deserts in Providence,
where the population is 34.3% non-Hispanic white, 42% Hispanic, and 15.6% non-Hispanic black [39], with
26.9% of residents living under the poverty level, higher than the national average of 12.3% [2,39]. A food
desert, as defined by the USDA Economic Research Service (ERS) [40] is a census tract that is low-income
(LI) and low-access (LA), with low-income residents and few large food stores. (See definitions of census
tracts, LI, and LA in Appendix B [40,41].) In order to locate food deserts, ERS developed the Food Access
Research Atlas [42], an online database that assembles indicators of the food environment, such as access
and proximity to food stores at the census tract level. This tool has been employed in many previous
studies investigating food retail access [43–45]. Tracts were selected by layering the Food Access Research
Atlas LILA tracts on Google Maps and 2010 Census Tracts Shapefiles [46] and merging them with Food
Access Research Atlas 2015 data [47] in the Quantum Geographic Information System (QGIS) [48], an open
source mapping tool. Tracts in Providence where at least 500 people or at least 33 percent of the population
is greater than 1/2 mile from the nearest supermarket, supercenter, or large grocery store (hereafter referred
to as LILA areas) were identified as food deserts for this study. Seventeen out of 39 census tracts in
Providence, RI were identified as LILA areas, among which five tracts were further selected based on the
characteristics of interest shown in Table 1. Three tracts with a low proportion of non-Hispanic black and
Hispanic, and a low proportion of housing units receiving SNAP benefits were selected (hereafter referred
to as low SNAP and low racial minority tracts, mean = 31.5% and 37.6%, respectively). Two tracts with a
high proportion of non-Hispanic black and Hispanic, and a high proportion of housing units receiving
SNAP benefits were selected to serve as a comparison (hereafter referred to as high SNAP and high racial
minority tracts, mean = 2.8% and 3.1%, respectively).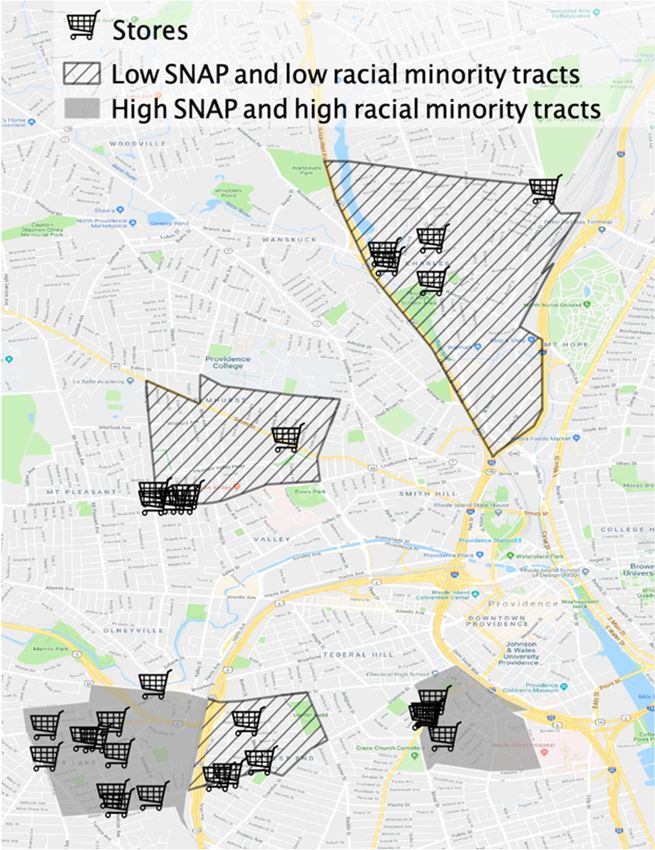
Int. J. Environ. Res. Public Health 2019, 16, 1052                                                                                                                                     4 of 23

                                                       Table 1. Characteristics of five selected tracts in Providence, Rhode Island (RI).

                                                           Black or African                                     Housing Units                                   Housing Units Without
                                                                                    Hispanic or Latino
                                                             American (%)                                    Receiving SNAP (%)                                  Vehicle and Beyond
                                           Tract                                   (%) Beyond 1/2 Mile                                 Poverty Rate (%)
                                                           Beyond 1/2 Mile                                     Beyond 1/2 Mile                                      1/2 Mile from
                                                                                    from Supermarket
                                                          from Supermarket                                    from Supermarket                                    Supermarket (%)
                                      44,007,002,300              0.91                      1.56                     1.61                    26.3                         1.43
     Low SNAP and low
                                      44,007,002,900              1.43                      2.00                     2.17                    27.7                         1.67
    racial minority tracts 1
                                      44,007,001,300              1.47                      9.24                     5.36                    29.5                         1.67

     High SNAP and high               44,007,001,600              8.88                     50.42                     30.42                   27.8                          6.6
    racial minority tracts 2          44,007,000,700             33.86                     32.99                     44.7                    50.2                         30.8
      1Low proportion of non-Hispanic black and Hispanic (mean = 2.8%), and low proportion of housing units receiving SNAP benefits (mean = 3.1%).   2   High proportion of non-Hispanic
      black and Hispanic (mean = 31.5%), and high proportion of housing units receiving SNAP benefits (mean = 37.6%).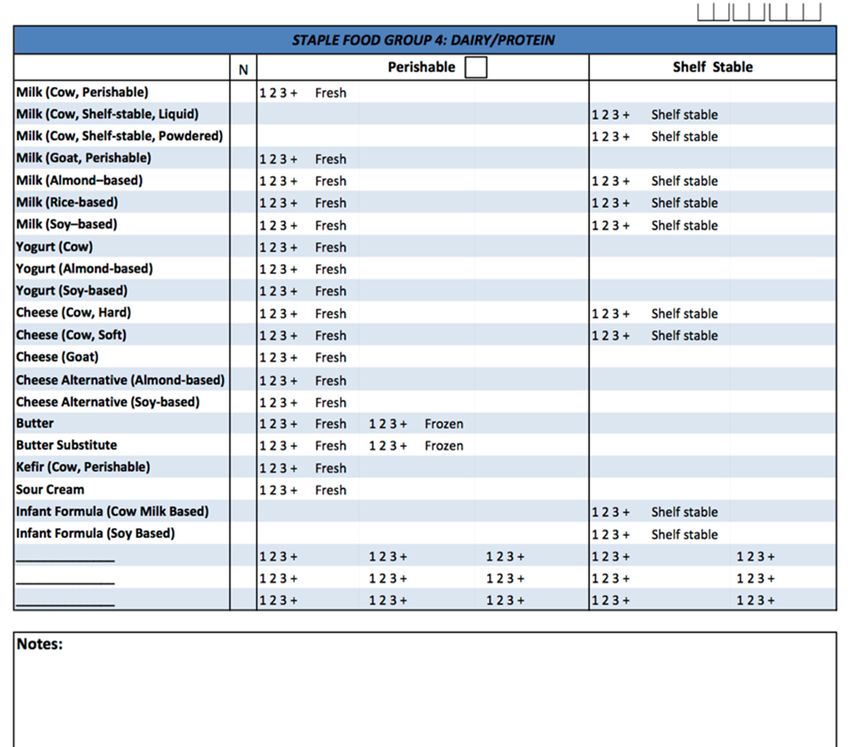
Int. J. Environ. Res. Public Health 2019, 16, 1052 5 of 23
Small non-chain grocery stores, convenience stores, dollar/discount stores, pharmacies/drug stores,
and liquor stores, irrespective of SNAP authorization status, were included to obtain a comprehensive
assessment (inclusion criteria). Given the focus of this study on small retailers, supermarkets and chain
grocery stores were not assessed. Farmer’s markets, butcher shops, and bakeries were also not assessed as
they are not required to meet the inventory requirements to be SNAP-authorized [29] (exclusion criteria).
(Definitions of each type of store can also be found in the Congressional Research Service (CRS) Report
R44650 [49].) Stores that met inclusion criteria were identified from each tract using Google Maps and
the USDA SNAP retailer locator [50]. A total of approximately 41 small retailers were identified among
the five tracts. When a store was unavailable for auditing (i.e., did not exist or had permanently closed)
or when store owners raised objections, a new store was added to the list of stores in order to obtain the
desired sample size of 30 stores, with 15 stores in high SNAP and high racial minority tracts and 15 stores
in low SNAP and low racial minority tracts (Table 2, Figure 1).
Table 2. Number of stores by store type in high and low Supplemental Nutrition Assistance Program
(SNAP)/high and low racial minority tracts (n = 30).
High 1 Accept SNAP Low 2, * Accepts SNAP Total
Non-chain grocery 9 8 3 3 12
Convenience store 4 3 8 7 12
Small Discount Store 0 0 1 1 1
Drug Store/Pharmacy 2 2 2 2 4
Liquor Store 0 0 1 0 1
* Includes three stores (two non-chain grocery and one small discount store) that do not fall within the low SNAP and low
racial minority tracts but are located at the boundary line of tract 44,007,002,300. The stores were added to achieve more
comprehensive sampling in low SNAP and low racial minority tracts. 1. Tracts where the mean of the proportion of black
and Hispanic residents and SNAP participating households are 31.5% and 37.6%, respectively. 2. Tracts where the mean
Int.
ofJ.the
Environ. Res. Public
proportion Health
of black and2019, 16 FOR
Hispanic PEER REVIEW
residents and SNAP participating households are 2.8% and 3.1%, respectively. 5
1. Map of Providence withwith
15 stores in high SNAP andand
high racial minority tracts 1
FigureFigure 1. Map of Providence 15 stores in high SNAP high racial minority tracts 1and
and15
15stores
in low SNAP and low racial minority 2 1
stores in lowtracts
SNAP .andTracts where
low racial the mean
minority of 2the
tracts . proportion of black and
Hispanic residents and SNAP participating households are 31.5% and 37.6%, respectively. 2 Tracts
wherewhere
1 Tracts the mean of theofproportion
the mean of black
the proportion and and
of black Hispanic residents
Hispanic andand
residents SNAP
SNAP participating
participating households
households
are
are 2.8%and
31.5% and37.6%,
3.1%,respectively.
respectively.2 Tracts where the mean of the proportion of black and Hispanic residents and
SNAP participating households are 2.8% and 3.1%, respectively.
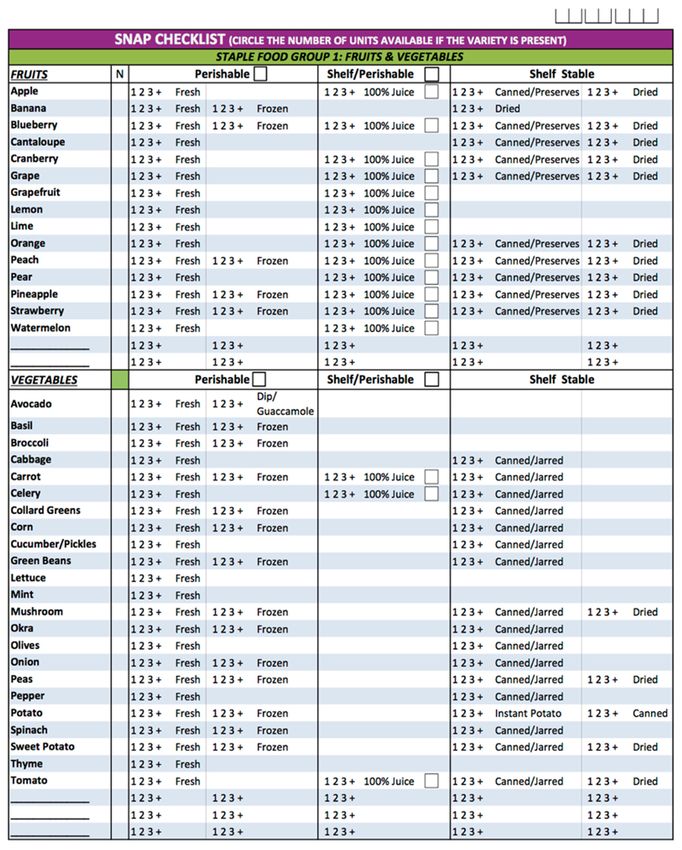
2.3. Retail Audit
An Institutional Review Board exemption was obtained prior to store auditing. (ID: 1139592-1)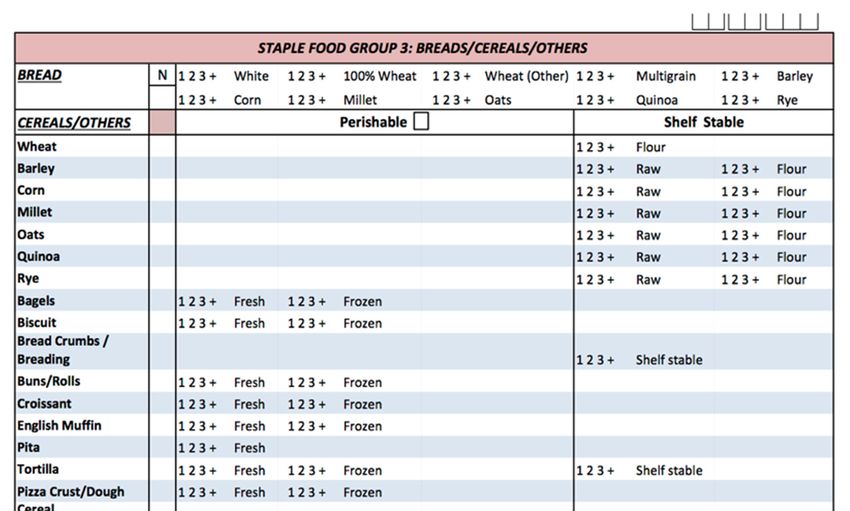
Int. J. Environ. Res. Public Health 2019, 16, 1052                                                    6 of 23

2.3. Retail Audit
      An Institutional Review Board exemption was obtained prior to store auditing. (ID: 1139592-1) All
stores were accessed using an audit instrument developed by the Illinois Prevention Research Centers
(PRC) and Nutrition and Obesity Policy Research and Evaluation Network (NOPREN) Collaborating
Center [38], which provides measures for store characteristics (e.g., interior and exterior features) and
the availability of food items in the store (Appendix C). The instrument has been tested for reliability
in Illinois PRC research [38]. Auditors recorded information on up to 10 foods and/or beverage
varieties under each of the four staple food categories, in the order of the fruits and vegetables
category, to the meat, poultry, fish category, to the breads and cereals category, and lastly to the dairy
category. Under each category, food items were searched for from left to right in the sequence shown
on the instrument page, giving priority to perishable items. Once 10 varieties were identified for a
given category and at least one perishable item had been identified, that category was considered
complete, and no additional data were collected. Accessory foods that are generally considered drinks,
condiments, snacks, or desserts were not counted as per the instructions. Food items that were in
storage and not available on the shelves at the time of auditing were also not counted. Mixed dishes
or multiple-ingredient foods and beverages where the first ingredient was a staple food item were
counted toward that accordant category, unless the first ingredient was water, in which case they were
classified by their second ingredient. For example, a frozen pizza would count toward the breads
and cereals category if flour was the first ingredient, but would count toward the dairy category if
the first ingredient was cheese [51]. (Refer to CRS Report R44650 for detailed definitions of accessory
foods and mixed dishes [49].) The depth-of-stock requirement under the first proposed rule of 6 was
not evaluated as the number of items that could be recorded with the audit tool was limited to 1,
2, or 3, or more. Auditors completed a 2-hour live webinar provided by the Illinois PRC NOPREN
Collaborating Center that instructed in detail the use of the audit tool. The webinar was taped
for reference, and any questions were answered either during the webinar or afterwards via email
communication. A training manual was also provided for reference, with detailed definitions of store
type, category, variety, perishability, depth of stock, accessory foods, mixed dishes, and instructions
on what should and should not be counted. Two trained auditors assessed the stores together to
enhance data quality. Data collection was unannounced, but an explanatory letter written in English
and Spanish was provided to store owners and staff when concerns were raised.

2.4. Analysis
     Based on the multi-site project proposed by the Illinois PRC NOPREN Collaborating Center,
a sample size of 30 stores was selected. Because this study was primarily descriptive, a priori power
was not calculated. Post hoc power was computed to evaluate the difference between high and
low SNAP/high and low racial minority tracts, with a large effect size of 0.5, α of 0.05, and degree
of freedom of 1, resulting in a power of 0.8. The exposure variable for this analysis was stores
located in census tracts with a high (versus low) proportion of SNAP and racial minority households.
Outcome variables included variety, perishability, depth of stock, and total stocking (see definitions of
each in footnotes of Table 3).

2.5. Variety
      To determine the variety of foods that a store carried, the number of unique items in each of the
four staple categories (i.e., fruits and vegetables; meat, poultry, and fish; breads and cereals; and dairy)
were assessed, and binary indicators were created to show whether a store met the variety requirement
of at least 3 or 7 varieties.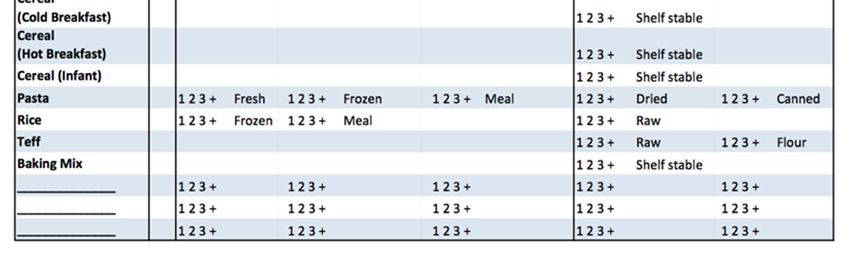
Int. J. Environ. Res. Public Health 2019, 16, 1052                                                    7 of 23

2.6. Perishability
     To determine the variety of perishable items under each category, foods that are considered
perishable (i.e., fresh/frozen/dips/mixed dishes in the fruits and vegetables category; perishable
100% fruit juice or vegetable juice; fresh/frozen/mixed dishes in the meat, poultry and fish category;
fresh/ frozen/mixed dishes in the breads and cereals category; and fresh/frozen dairy) were counted.
Binary indicators were created to indicate whether a store met the perishability requirement of having
a perishable item in at least 2 or 3 categories, if a store carried at least one perishable item under each
category, and if a store carried at least 50% perishable items.

2.7. Depth of Stock
      Binary indicators were created to indicate whether a store met the depth-of-stock requirement of
at least 3 units of items in all categories in the proposed rule and final rule.

2.8. Total Stocking
     Binary indicators were created to indicate if a store met the total stocking requirement of the
different rules (n = 12, 36, and 84 total items under the original, final, and proposed rules, respectively).
     All analyses were conducted using Statistical Package for Social Sciences (SPSS) version
25, developed by International Business Machines Corporation, registered in many jurisdictions
worldwide [52]. Descriptive statistics were used to determine the mean and/or proportion of retailers
that met the different versions of requirements (i.e., variety, perishability, depth of stock) and the
perishable items within each category. One-way analysis of variance (ANOVA) was performed to
determine if mean variety differed across categories. Chi-square tests were used to determine whether
differences in the means and/or proportions in variety, perishability, and total stocking were significant
between high and low SNAP/high and low racial minority tracts.

3. Results
     Among the 30 small retailers sampled, 80% were non-chain grocery stores and convenience
stores; the remaining stores included 3.3% small discount stores, 13.3% pharmacies, and 3.3% liquor
stores. (Table 2) Of all stores, 86.7% were SNAP authorized; 6.7% of stores in high SNAP and high
racial minority tracts and 6.7% of stores in low SNAP and low racial minority tracts were not SNAP
authorized. (Table 2)

3.1. Variety
     Table 3 shows the proportion of stores that were able to meet the requirements in the original,
proposed, and final rule, and also compares whether the store inventory in high and low SNAP/high
and low racial minority tracts differed with respect to meeting these requirements. Of all stores, 83.3%
met the variety requirement in the original and final rule; that is, three varieties per category, but only
33.3% met the proposed rule, or seven varieties per category. Among SNAP-authorized stores (n = 26),
92.3% met the original and final rule, and 38.5% met the proposed rule. No significant difference in
variety was detected between stores in high and low SNAP /high and low racial minority tracts; most
stores in both high and low SNAP /high and low racial minority tracts met the original and final
rules (86.7% and 80%, respectively). Among SNAP-authorized stores, 93.3% in both high and low
SNAP /high and low racial minority tracts met the original and final rules. However, fewer met the
variety requirements in the proposed rule (i.e., of all stores, 26.7% were in high SNAP and high racial
minority tracts and 40% in low SNAP and low racial minority tracts; and among SNAP-authorized
stores, 30.8% were in high SNAP and high racial minority tracts and 46.2% in low SNAP and low racial
minority tracts).
     Table 4 shows the mean of the variety, variety of perishable items, depth of stock, and total
stocking in each category. The variety requirement was met the least often in the dairy category
Int. J. Environ. Res. Public Health 2019, 16, 1052 8 of 23
(83.3% and 40% that carried 3 and 7 varieties, respectively) compared to the other three categories
(90% and 73.3–86.7 that carried 3 and 7 varieties, respectively). On average, stores carried a lower
variety of dairy foods (mean = 5.40 ± 3.04) compared to the other three categories (mean = 7.80 ± 3.31
- 8.53 ± 3.16, p < 0.05) (Table 4). Among SNAP-authorized stores, 100%, 96.2%, and 80.8% reached
or exceeded 3, 7, and 10 varieties in the fruits and vegetables category; 100%, 84.6%, and 50% in the
meat, poultry, and fish category; 100%, 84.6%, and 61.5% in the breads and cereals category; and 92.3%,
46.2%, and 3.8% in the dairy category, respectively. SNAP-authorized stores carried more varieties of
staple foods (mean = 33.15 ± 6.21) than stores that were not SNAP-authorized (mean = 6.25 ± 9.84,
p = 0.01).
3.2. Perishability
Perishability requirement: Of all stores, 83.3% met the perishability requirement (92.3% among
SNAP-authorized stores) in both the original and final rule—that is, at least two categories with
perishable items—and the proposed rule—that is, at least three categories with perishable items
(Table 3). No significant difference in meeting the perishability requirement was detected between
stores in high and low SNAP /high and low racial minority tracts (i.e., of all stores, 80% in high SNAP
and high racial minority tracts and 86.7% in low SNAP and low racial minority tracts; and among
SNAP-authorized stores, 73.3% in high SNAP and high racial minority tracts and 86.7% in low SNAP
and low racial minority tracts) (Table 3).
Perishable items within each category: There was a lower variety of perishable items in the breads
and cereals category (mean = 2.07 ± 1.70) compared to other categories (mean = 4.67 ± 2.58 ~ 6.20
± 4.09, p < 0.01) (Table 4). Table 5 shows perishable items within each category. Of all stores, 76.7%
had at least one variety of perishable item under all categories, but few carried more than half of
perishable items.
3.3. Depth of Stock
Depth of stock was not required in the original rule. Only one store did not meet the depth-of-stock
requirement in the proposed and final rule (i.e., three or more items per variety) under the fruits and
vegetables category and breads and cereals category (Table 3). No significant difference in depth of
stock was detected between stores in high and low SNAP/high and low racial minority tracts (Table 3).
3.4. Total Stocking
Overall, 80% of all stores were compliant with the total stocking requirement (including
categories, varieties, and depth of stock) in the original and final rule, but 66.7% would need
to expand their offerings to meet the total stocking requirement in the proposed rule (Table 3).
Among SNAP-authorized stores, 88.5% were compliant with the total stocking requirement in the
original and final rule, but 61.5% would need to expand their offerings to meet the total stocking
requirement in the proposed rule (Table 3). No difference was detected between stores in high and low
SNAP/high and low racial minority tracts in meeting the total stocking requirement of the original or
final rule (80% in both tracts), as well as that of the proposed rule (53.3% in high SNAP and high racial
minority tracts and 80% in low SNAP and low racial minority tracts) (Table 3).Int. J. Environ. Res. Public Health 2019, 16, 1052 9 of 23
Table 3. Proportion of stores meeting the different versions of variety, perishable categories, depth of stock, and total stocking requirements (n = 30).
Original Rule (%) Proposed Rule (%) Final Rule (%)
All Stores High 1 Low 2 p Value All Stores High 1 Low 2 p Value All Stores High 1 Low 2 p Value
Variety 3 83.3 86.7 80 1 33.3 26.7 40 0.7 83.3 86.7 80 1
Perishable categories 4 83.3 80 86.7 1 83.3 80 86.7 1 83.3 80 86.7 1
Depth of stock 5 100 100 100 96 93.3 100 1 96 93.3 100 1
Total stocking 6 80 80 80 33.3 26.7 40 0.7 80 80 80
SNAP Authorized SNAP Authorized SNAP Authorized
High Low p value High Low p value High Low p value
stores (n = 26) stores (n = 26) stores (n = 26)
Variety 3 92.3 92.3 92.3 38.5 30.8 46.2 0.688 92.3 92.3 92.3
Perishable categories 4 92.3 84.6 100 0.48 92.3 84.6 100 0.48 92.3 84.6 100 0.48
Depth of stock 5 100 100 96.1 92.3 100 1 96.1 92.3 100 1
Total stocking 6 88.5 84.6 92.3 1 38.5 30.8 46.2 0.688 88.5 84.6 92.3 1
1 Tracts where the mean of the proportion of black and Hispanic residents and SNAP participating households are 31.5% and 37.6%, respectively. 2 Tracts where the mean of the proportion
of black and Hispanic residents and SNAP-participating households are 2.8% and 3.1%, respectively. 3 “Variety” refers to different types of foods. For example, apples, cabbage, and squash
in the fruits and vegetables category would be variety of 3. The following does not meet the variety requirement: having different brands and sizes; having the same item but with varying
ingredients (e.g., plain sausage and spicy sausage); or having the same item but offering different types of that item (e.g., Granny Smith and Red Delicious apples). Minimum requirements
under the original rule, proposed rule, and final rule are 3, 7, and 3, respectively. 4 “Perishable categories” refers to categories with perishable items- that is, items that are either frozen
staple food items, or fresh, un-refrigerated, or refrigerated staple food items that will spoil or suffer significant deterioration in quality within 2 to 3 weeks. Minimum requirements under
the original rule, proposed rule, and final rule are 2, 3, and 2, respectively. 5 “Depth of Stock” refers to the minimum number of units of every variety; that is, if the depth of stock is 3,
stores must have at least three units per variety. For example, if apples are going to be counted in the fruits and vegetables category, at least three apples and/or products with the apple as
the first ingredient, such as applesauce or apple juice, need to be stocked in the store. Food items that are in storage and not available on the shelves at the time of auditing were not
counted. Minimum requirements under original rule, proposed rule, and final rule are 1, 3, and 3, respectively. 6 “Total stocking” considers the category, variety, and depth of stock.
For example, seven varieties in each category with a depth of stock of 3 results in a total stocking of 84 (i.e., 4 categories × 7 varieties × 3 depth of stock). Minimum requirements under the
original rule, proposed rule, and final rule are 12, 84, and 36, respectively.Int. J. Environ. Res. Public Health 2019, 16, 1052 10 of 23
Table 4. Mean of variety, variety of perishable items, depth of stock, and total stocking in each category (n = 30).
Variety of Perishable Items
Variety (mean ± SD) Depth of Stock Total Stocking
(mean ± SD)
All stores High 1 Low 2 p-value All stores High 1 Low 2 p-value All stores High 1 Low 2 p-value All stores High 1 Low 2 p-value
Fruits and Vegetables 8.53 ± 3.16 a 8.60 ± 3.18 8.46 ± 3.25 0.910 6.20 ± 4.09 c 6.20 ± 4.14 6.20 ± 4.18 / 3.94 ± 0.31 e 3.88 ± 0.44 e 4.00 ± 0.00 e 0.326 33.62 ± 12.63 f 33.9 ± 13.08 f 33.33 ± 12.62 f 0.904
Meat Poultry and Fish 7.83 ± 3.06 a 7.80 ± 2.78 7.87 ± 3.42 0.954 4.67 ± 2.58 c 4.53 ± 2.72 4.80 ± 2.51 0.782 4.00 ± 0.00 e 4.00 ± 0.00 e 4.00 ± 0.00 e 31.20 ± 12.13 f 31.20 ± 11.13 f 31.20 ± 13.45 f 1.000
Breads and Cereals 7.80 ± 3.32 a 7.87 ± 3.09 7.73 ± 3.63 0.915 2.07 ± 1.70 d 1.60 ± 1.45 2.53 ± 1.85 0.136 3.98 ± 0.14 e 3.95 ± 0.19 e 4.00 ± 0.00 e 0.326 30.84 ± 13.48 f 30.74 ± 12.84 f 30.93 ± 14.54 f 0.970
Dairy 5.40 ± 3.04 b 5.27 ± 3.24 5.53 ± 2.92 0.815 4.80 ± 2.54 c 4.60 ± 2.61 5.00 ± 2.54 0.674 4.00 ± 0.00 e 4.00 ± 0.00 e 4.00 ± 0.00 e 21.47 ± 11.91 f 20.80 ± 12.49 f 22.13 ± 11.70 f 0.765
All categories 29.57 ± 11.39 29.53 ± 10.82 29.60 ± 12.32 0.988 17.73 ± 8.49 16.93 ± 8.89 18.53 ± 8.29 0.614 3.96 ± 0.18 e 3.93 ± 0.26 e 4.00 ± 0.00 e 0.326 117.12 ± 45.66 f 116.65 ± 44.06f 117.60 ± 48.75 f 0.956
Variety of perishable items
Variety (mean ± SD) p-value p-value Depth of stock p-value Total stocking p-value
(mean ± SD)
SNAP-authorized
33.15 ± 6.21 20.04 ± 6.31 3.96 ± 0.20 e 131.30 ± 25.80 f
stores (n = 26)
0.010 * 0.001 ** 0.702 0.000 ***
Non-SNAP-authorized
6.25 ± 9.84 2.75 ± 4.27 4.00 ± 0.00 e 25.00 ± 39.38 f
stores (n = 4)
a–bMeans within a column with different superscripts differ (p < 0.05). Homogeneity of variances was not violated. c–d Means within a column with different superscripts differ.
Homogeneity of variances was violated. Welch F (3, 62.079) = 15.772 (p = 0.000). e n = 4 was assigned to a variety of 3 or more. f Calculated based on estimated and assigned variety and
depth of stock for the purpose of comparison between tracts, not to be taken literally. 1 Tracts where the mean of the proportion of black and Hispanic residents and SNAP-participating
households are 31.5% and 37.6%, respectively.2 Tracts where the mean of the proportion of black and Hispanic residents and SNAP-participating households are 2.8% and 3.1%, respectively.
* significant at p < 0.05; ** significant at p < 0.005; *** significant at p < 0.001.
Table 5. Estimate of the proportion of perishable items out of the total items recorded in each category.
≥1 Perishable Item >50% Perishable Items
(in %, n = 30) All Stores (in %, n = 30) Stores with < 10 Items in Each Category (in %)
All stores High 1 Low 2 p value All stores High 1 Low 2 p value High 1 Low 2 p value
Fruits and Vegetables 90 86.7 93.3 1 73.3 * 73.3 * 73.3 * 55.6 (n = 5/9 stores) 75 40 0.524
Meat, Poultry, and Fish 90 93.3 86.7 1 76.7 * 66.7 * 86.7 * 0.39 70.6 (n = 12/17 stores) 70 71.4 1
Breads and Cereals 80 73.3 86.7 0.651 16.7 * 6.7 * 26.7 * 0.33 21.4 (n = 3/14 stores) 0 50 0.055
Dairy 86.7 86.7 86.7 86.7 * 86.7 * 86.7 * 1 86.2 (n = 25/29 stores) 85.7 86.7 1
All categories 76.7 66.7 86.7 0.39 10 * 0 20 * 0.224
* As per the instructions, a maximum of 10 varieties were recorded for each category during store auditing. Stores that were recorded to have met 10 varieties were likely to have carried
more than 10 varieties, so the proportions of perishable items in those stores were estimates. 1 Tracts where the mean of the proportion of black and Hispanic residents and SNAP
participating households are 31.5% and 37.6%, respectively. 2 Tracts where the mean of the proportion of black and Hispanic residents and SNAP participating households are 2.8% and
3.1%, respectively.Int. J. Environ. Res. Public Health 2019, 16, 1052 11 of 23
4. Discussion
This study set out to measure food availability among small retailers and whether disparities
exist for minority populations in census tracts classified as food deserts in Providence, RI, with the
aim of helping to inform future stocking rules for SNAP-authorized stores in low-income low-access
(LILA) areas as defined in Appendix B, with 1/2 mile used as the indicator of low access. Overall, most
stores met all requirements—including variety, perishability, and depth of stock—in the original and
final rules, and a higher number of stores would have also met all requirements in the proposed rule
if the dairy variety requirement had been excluded. No disparity was observed between high and
low SNAP/high and low racial minority tracts in meeting the different requirements in all categories
in the original, final, and proposed rule, or in perishability within categories. Detailed findings are
discussed below.
4.1. Variety
Among SNAP-authorized stores, 100% reached or exceeded three varieties, and 96.2% reached
or exceeded seven varieties in the fruits and vegetables category, with 80.8% reaching or exceeding
10 varieties, indicating the feasibility of a more stringent requirement pertaining to fruits and vegetables
than the current requirement of three varieties. Among SNAP-authorized stores, 84.6% reached or
exceeded seven varieties in the meat, poultry, and fish category, suggesting the proposed rule towards
meat, poultry, and fish varieties would not be extremely untenable. On average, the dairy category
had a significantly lower number of varieties compared to the other three categories; fewer than half of
the SNAP-authorized stores carried seven dairy varieties, confirming the concerns that meeting the
proposed rule would be challenging for the dairy category. Although the proposed rule expanded
the definition of “variety” for dairy to having each main ingredient (e.g., cow, goat, almond, rice, soy)
by product type (e.g., milk, yogurt, cheese, butter, infant formula) be considered a discrete variety,
there was a lower variety of traditional dairy products to begin with compared to the other three
categories. Future policies may retain the current rule of three dairy varieties, but should ensure
those are nutrient-dense options. Consistent with the Dietary Guidelines for Americans, cream cheese,
cream, and butter should be considered ineligible varieties, as they are not counted toward dairy intake
in the Dietary Guidelines for Americans [21]. Additional investigation to inform the definition of
eligible varieties within dairy staples and to identify barriers to stocking dairy products is warranted.
4.2. Perishability
In this study, 92.3% of all retailers met the perishability requirements under all the rules.
Similarly, a study by Powell et al. which used the same audit tool and found that among 113 small
retailers in Chicago found that 94.6% were compliant with the original and final rule and 93.8% met
the proposed rule [53]. These findings, similar to an analysis from FNS that estimated 98% of small
SNAP-authorized stores already stock sufficient perishable foods required in the proposed rule [31],
suggest that the concern of insufficient space for perishable foods was not well-founded. This study
explored perishability within categories, although it was not proposed in the revisions of the SNAP
inventory policy. Limited perishable varieties within categories could be related to several barriers.
A report by Frazao et al. suggests that SNAP participants, when provided with additional SNAP
dollars, fail to increase spending and consumption on fruits and vegetables [54]. Bodor et al. also
pointed out the limited shelf space in small retail stores, which may require a reduction of certain
non-perishable items in exchange for perishable foods, potentially leading to profit loss [33].
4.3. Depth of Stock
Most retailers in this study carried three or more units of each variety, which is in favor of future
expansion of depth-of-stock requirements. Future studies could investigate the practicality of the
depth-of-stock requirement of 6 under the first-proposed rules, as it was not assessed in this study.Int. J. Environ. Res. Public Health 2019, 16, 1052 12 of 23
The expansion of depth-of-stock could be an important strategy in improving dietary intake, informed
by previous evidence. For example, a one-unit increase in the availability of varieties in fruits and
vegetables in corner stores was respectively associated with a 12% and 15% increase in customers’
likelihood to purchase fruits and vegetables [26].
4.4. Total Stocking
Most stores (80.0%) met the final rule that required 36 staple food items, particularly
SNAP-authorized stores (88.5%). Although only 38.5% of the SNAP-authorized stores met the proposed
rule in all four categories (84 items), 73.1% met the proposed rule when the dairy category was excluded
(data not shown in Tables). The finding that most retailers were able to meet a stricter rule before
the final rule went into effect highlights the potential for small food stores to expand their offerings.
This conclusion is consistent with findings by Powell et al. that 81.4% of stores met the variety
requirements under the original and final rule, and 22.1% met the variety requirements under the
proposed rule, with the least variety in the dairy category (i.e., only 23% of the stores carried at least
seven dairy varieties) [53].
Although no disparity was detected between high and low SNAP/high and low racial minority
tracts in meeting the different requirements or in perishability within categories, descriptively, in stores
with fewer than 10 breads and cereals varieties, 50% of stores in the low SNAP and low racial minority
tracts carried >50% perishable varieties in the breads and cereals category, while none of the stores
in high SNAP and high racial minority tracts did. It should be noted that non-Hispanic black and
Hispanic populations were grouped as high SNAP and high racial minority tracts, potentially masking
important differences, as some evidence suggests lower healthful food access and diet quality among
non-Hispanic black populations compared to Hispanic populations [4,55,56].
The ability for small retailers to meet the proposed stricter requirement is important in improving
food access. Along with various efforts that aim to improve diet quality [57,58], food access serves as a
crucial determinant, particularly for residents in geographically isolated locations lacking healthful
food outlets [9,59]. Nationally, approximately 80% of SNAP benefits were redeemed in supermarkets
and superstores in 2016 [60]. However, evidence from regional studies indicates that SNAP participants
with more severe food insecurity shop predominantly at smaller retailers [26], and small retailers have
a large share of all SNAP redemptions in low-income neighborhoods, regardless of the presence
of supermarkets [23]. Studies of corner stores, gas-marts, dollar stores, and pharmacies have
associated increased stocking of healthful foods with increased purchases of healthful foods [25–27].
Lower availability of produce was associated with lower purchases of produce and higher purchases
of sugar-sweetened beverages in bodegas [28]. Therefore, interventions in small retailers where choices
are limited may be a promising solution to help improve the diet quality of low-income populations.
Previous research has identified important challenges that might hinder adequate healthful food
provision among small retailers. For example, in a study by Ross et al., store owners identified barriers
to expanding food offerings, including low customer demand, high amounts of potential spoilage,
and unfair pricing at the wholesaler [34]. Ross et al. suggest that if the proposed rule were to be
considered again, the requirements could be revised proportionally to the size of the store and that
administrative support and oversight from the USDA should be increased, as they are currently
lacking. In particular, stores were largely unaware of the revisions in inventory requirements [34].
Nevertheless, a study by Haynes-Maslow et al. points out that the revision of the inventory rule
for the Women, Infants, and Children Program in 2009 raised similar concerns, but the new rule has
partly contributed to improved diet quality of its participants, and few stores dropped out due to their
inability to meet the inventory requirements [35].
To address challenges in healthful food provision, many innovative strategies have been
developed and implemented successfully at the local level, with positive evaluations by stakeholders.
These include the Food Trust’s Healthy Corner Store Initiative, ChangeLab Solutions Healthy Small
Food Retailer Certification Program, Shop Healthy NYC, Baltimore Healthy Stores, Wholesome Wave,Int. J. Environ. Res. Public Health 2019, 16, 1052 13 of 23
and BrightSide [61–63]. Successful interventions have included incentives, improvement of store
capacity of stocking and marketing healthful foods, provision of training and technical assistance
for store owners, connecting store owners with local partners to encourage healthful food sourcing,
and produce delivery to stores [61–63]. Additionally, small retailers that struggle with sustaining
adequate food varieties may consider cyclical inventory strategies to optimize flexibility of food
provisions as seasons shift.
Some limitations of the present study must be noted. First, data collected for this study were
cross-sectional and reflected food availability in stores only during the audit timeframe. No qualitative
data were collected to reflect perceived food availability and feasibility of expansion from stores’
perspectives, which might require further investigation. Additionally, pricing of food items was
not assessed, but is a prioritized factor in food choice among low-income populations [64,65].
Finally, identification of food deserts based on census tract boundaries does not necessarily reflect food
shopping behavior. Future studies may consider a multifactorial approach to identifying food desert
areas, such as considering store proximity and walkability [66]. Though this study only measured
food store environments and did not investigate its association with purchase behavior and the dietary
intake of customers, many previous studies have associated low provision of healthful foods with low
diet quality, and improved provision with increased purchasing and intake [26,67,68].
Several strengths of this study should be highlighted as well. First, data were collected prior to
implementation of the final rule, allowing for assessment of the prior inventory status. Census tracts
were carefully selected, aiming for specific characteristics of interest in order to reflect the demographic
composition and healthful food access among small retailers in Providence. A broad sample coverage
of 73% of the small retailers helped reduce risk for selection bias so that the findings were representative
of the actual environment, and increased the generalizability of the findings to other low-income
low-access communities as defined in this study, in Providence and cities with a similar demographic
makeup and SNAP participation rate. Additional studies in rural areas are needed to demonstrate if
similar conclusions can be applied.
Further investigations among SNAP-authorized small retailers are warranted to help inform
the efficacy and feasibility of the extension of the perishability requirement within categories, and if
existing efforts at the local level could be expanded to a larger scale to support retailers in meeting the
extension. Active communication between policy enforcement agencies and store owners are required
to ensure sustainable operations, while moving towards the improvement of food accessibility.
5. Conclusions
During November and December of 2018, most SNAP-authorized stores (88.5%) sampled from a
selected LILA area in Providence, RI were already compliant with the final rule prior to its implementation,
and 73.1% already met the proposed minimum of seven varieties in three categories other than dairy.
Future expansion of inventory requirements could potentially lead to increased healthful food availability
without imposing undue burdens on small retailers in Providence, RI, excluding increased requirements
for the dairy variety. If expansions of the requirements were to occur, stakeholders should draw on insights
from existing initiatives to assist in a successful implementation. Other initiatives looking to improve
healthful food access should borrow current knowledge from SNAP and balance the competing interest
among consumers, agricultural sectors, and food distribution sectors [69]. The findings of this study
advocate for the future expansion of SNAP inventory requirements, which may be one important strategy
in improving healthful food availability and help to facilitate the improvement of diet quality of food
purchases from small retailers in food deserts.
Author Contributions: Conceptualization, M.V. and Y.H.; methodology, M.V. and Y.H.; software, Y.H..; validation,
M.V., A.T. and J.T.; formal analysis, Y.H.; investigation, Y.H. and K.T.; resources, Illinois Prevention Research
Centers Nutrition and Obesity Policy Research and Evaluation Network Collaborating Center; data curation, Y.H.;
writing—original draft preparation, Y.H.; writing—review and editing, M.V., A.T. and J.T.; visualization, Y.H. and
M.V.; supervision, M.V.; project administration, M.V.; funding acquisition, M.V.Int. J. Environ. Res. Public Health 2019, 16, 1052 14 of 23
Funding: This study was supported by the National Institute of Food and Agriculture Food systems, health,
and well-being: understanding complex relationships and dynamics of change (RI0018-NC1196).
Acknowledgments: The authors appreciate the Illinois Prevention Research Centers Nutrition and Obesity Policy
Research and Evaluation Network Collaborating Center for developing the audit instrument and giving us
permission to use it for this study. We would like to acknowledge Haley Parker, Xintong Guan and Elie Perraud
at the University of Rhode Island for their support and feedback in the review of the study. We would like to also
thank store owners and employees for their consent and assistance during store auditing.
Conflicts of Interest: The authors declare no conflict of interest.
Appendix A. Inventory Requirements for SNAP-Authorized Retailers [49]
Original rule Proposed rules Final rule
Feb 2016 Dec 2016 Jan 2018
Staple food categories 4 4 4 4
Varieties in each category 3 7 7 3
Minimum number of categories
2 3 3 2
that must include perishable foods
1 item of 6 items of 3 items of 3 items of
Depth of stock for each variety
each variety each variety each variety each variety
Minimum stocking total
(considering categories, varieties, 12 items 168 items 84 items 36 items
and depth of stock)
Appendix B. Definition of Census Tract, Low-Income and Low-Access [40,41]
Census Tracts are small, relatively permanent statistical subdivisions of a county or equivalent entity
that are updated by local participants prior to each decennial census as part of the Census Bureau’s
Participant Statistical Areas Program. The primary purpose of census tracts is to provide a stable
set of geographic units for the presentation of statistical data. Census tracts generally have a
population size between 1200 and 8000 people, with an optimum size of 4000 people.
A low-income (LI) tract is defined as any tract that meets any one of the three criteria: (1) the poverty
rate is 20% or greater; (2) median family income is ≤ 80% of the state-wide median family income;
(3) the tract is in a metropolitan area and has a median family income ≤80% of the metropolitan
area’s median family income.
A low-access (LA) tract is defined as having a significant number or share of individuals far from a
supermarket, supercenter, or large grocery store. Three measures of LA was provided in the Atlas:
(1) At least 500 people or at least 33 percent of the population is greater than 1/2 mile from the nearest
supermarket, supercenter, or large grocery store for an urban area or greater than 10 miles for a
rural area.
(2) At least 500 people or at least 33 percent of the population is greater than 1 mile from the nearest
supermarket, supercenter, or large grocery store for an urban area or greater than 10 miles for a
rural area.
(3) At least 500 people or at least 33 percent of the population is greater than 1 mile from the nearest
supermarket, supercenter, or large grocery store for an urban area or greater than 20 miles for a
rural area.Int. J. Environ. Res. Public Health 2019, 16, 1052 15 of 23
Int. J. Environ. Res. Public Health 2019, 16 FOR PEER REVIEW 18
Appendix
AppendixC.
C.Illinois
IllinoisPRC
PRCNOPREN
NOPRENFood
FoodStore
StoreSNAP
SNAPForm
FormInt. J. Environ. Res. Public Health 2019, 16, 1052 16 of 23 Int. J. Environ. Res. Public Health 2019, 16 FOR PEER REVIEW 19
Int. J. Environ. Res. Public Health 2019, 16, 1052             17 of 23
Int. J. Environ. Res. Public Health 2019, 16 FOR PEER REVIEW         20
Int. J. Environ. Res. Public Health 2019, 16, 1052             18 of 23
Int. J. Environ. Res. Public Health 2019, 16 FOR PEER REVIEW         21
Int. J. Environ. Res. Public Health 2019, 16, 1052                                                             19 of 23
Int. J. Environ. Res. Public Health 2019, 16 FOR PEER REVIEW                                                        22

References
1.    Hales, C.M.; Carroll, M.D.; Fryar, C.D.; Ogden, C.L. Prevalence of Obesity Among Adults and Youth: United
      States, 2015–2016; NCHS Data Briefs., No.288; National Center for Health Statistics: Hyattsville, MD, USA,
      October 2017. Available online: https://www.cdc.gov/nchs/products/databriefs/db288.htm (accessed on
      8 February 2018).
2.    Semega, J.; Fontenot, K.; Kollar, M. U.S. Income and Poverty in the United States: 2017; U.S. Government Printing
      Office: Washington, DC, USA, September 2018. Available online: https://www.census.gov/data/tables/
      2018/demo/income-poverty/p60-263.html (accessed on 19 January 2019).
3.    Levine, J.A. Poverty and Obesity in the U.S. Diabetes 2011, 60, 2667–2668. [CrossRef] [PubMed]
4.    Wang, D.D.; Leung, C.W.; Li, Y.; Ding, E.L.; Chiuve, S.E.; Hu, F.B.; Willett, W.C. Trends in Dietary Quality
      Among Adults in the United States, 1999 Through 2010. JAMA Intern. Med. 2014, 174, 1587–1595. [CrossRef]
      [PubMed]
5.    Larson, N.I.; Story, M.T.; Nelson, M.C. Neighborhood Environments: Disparities in Access to Healthy Foods
      in the U.S. Am. J. Prev. Med. 2009, 36, 74–81. [CrossRef] [PubMed]
Int. J. Environ. Res. Public Health 2019, 16, 1052 20 of 23
6. Franco, M.; Diez Roux, A.V.; Glass, T.A.; Caballero, B.; Brancati, F.L. Neighborhood characteristics and
availability of healthy foods in Baltimore. Am. J. Prev. Med. 2008, 35, 561–567. [CrossRef] [PubMed]
7. Singleton, C.R.; Affuso, O.; Sen, B. Decomposing Racial Disparities in Obesity Prevalence: Variations in
Retail Food Environment. Am. J. Prev. Med. 2016, 50, 365–372. [CrossRef] [PubMed]
8. Baker, E.; Schootman, M.; Barnidge, E.; Kelly, C. The role of race and poverty in access to foods that enable
individuals to adhere to dietary guidelines. Prev. Chronic Dis. 2006, 3, 1–11.
9. Walker, R.E.; Keane, C.R.; Burke, J.G. Disparities and access to healthy food in the United States: A review of
food deserts literature. Health Place 2010, 16, 876–884. [CrossRef] [PubMed]
10. Hillier, A.; Cannuscio, C.C.; Karpyn, A.; McLaughlin, J.; Chilton, M.; Glanz, K. How far do low-income
parents travel to shop for food? Empirical evidence from two urban neighborhoods. Urban Geogr. 2011, 32,
712–729. [CrossRef]
11. Ver Ploeg, M.; Breneman, V.; Farrigan, T.; Hamrick, K.; Hopkins, D.; Kaufman, P.; Lin, B.H.; Nord, M.;
Smith, T.; Williams, R.; Kinnison, K. Report to Congress: Access to Affordable and Nutritious Food: Measuring
and Understanding Food Deserts and Their Consequences; U.S. Department of Agriculture Economic Research
Service: Washington, DC, USA, June 2009; pp. 1–150. Available online: https://www.ers.usda.gov/webdocs/
publications/42711/12716_ap036_1_.pdf?v=41055 (accessed on 14 February 2018).
12. Osorio, A.E.; Corradini, M.G.; Williams, J.D. Remediating food deserts, food swamps, and food brownfields:
Helping the poor access nutritious, safe, and affordable food. AMS Rev. 2013, 3, 217–231. [CrossRef]
13. Rummo, P.E.; Guilkey, D.K.; Ng, S.W.; Popkin, B.M.; Evenson, K.R.; Gordon-Larsen, P. Beyond supermarkets:
Food outlet location selection in four US cities over time. Am. J. Prev. Med. 2017, 52, 300–310. [CrossRef]
14. Block, J.P.; Subramanian, S.V. Moving beyond “food deserts”: Reorienting United States policies to reduce
disparities in diet quality. PLoS Med. 2015, 12. [CrossRef] [PubMed]
15. Supplemental Nutrition Assistance Program (SNAP): What Can SNAP Buy? Available online: https:
//www.fns.usda.gov/snap/eligible-food-items (accessed on 19 February 2019).
16. Supplemental Nutrition Assistance Program Participation and Costs. Available online: https://fns-prod.
azureedge.net/sites/default/files/pd/SNAPsummary.pdf (accessed on 10 January 2018).
17. Nord, M.; Golla, A.M. Does SNAP Decrease Food Insecurity? Untangling the Self-Selection Effect;
U.S. Department of Agriculture Economic Research Service: Washington, DC, USA, October 2009.
Available online: https://naldc.nal.usda.gov/download/36558/PDF (accessed on 7 February 2018).
18. Ratcliffe, C.; McKernan, S.-M.; Zhang, S. How much does the supplemental nutrition assistance program
reduce food insecurity? Am. J. Agric. Econ. 2011, 93, 1082–1098. [CrossRef] [PubMed]
19. Leung, C.W.; Willett, W.C.; Ding, E.L. Low-income Supplemental Nutrition Assistance Program participation
is related to adiposity and metabolic risk factors. Am. J. Clin. Nutr. 2012, 95, 17–24. [CrossRef] [PubMed]
20. Condon, E.; Drilea, S.; Jowers, K.; Lichtenstein, C.; Mabli, J.; Madden, E.; Niland, K. Diet Quality of Americans
by SNAP Participation Status: Data From the National Health and Nutrition Examination Survey, 2007–2010; U.S.
Department of Agriculture Food and Nutrition Service: Washington, DC, USA, May 2015. Available online:
https://fns-prod.azureedge.net/sites/default/files/ops/NHANES-SNAP07-10-Summary.pdf (accessed
on 15 January 2018).
21. 2015–2020 Dietary Guidelines for Americans, 8th ed.; US Department of Health and Human Services,
US Department of Agriculture: Washington, DC, USA, 2015. Available online: http://health.gov/
dietaryguidelines/2015/guidelines/ (accessed on 10 January 2018).
22. Andreyeva, T.; Tripp, A.S.; Schwartz, M.B. Dietary quality of Americans by supplemental nutrition assistance
program participation status: A systematic review. Am. J. Prev. Med. 2015, 49, 594–604. [CrossRef] [PubMed]
23. Ma, X.; Liese, A.D.; Hibbert, J.; Bell, B.A.; Wilcox, S.; Sharpe, P.A. The Association between Food Security and
Store-Specific and Overall Food Shopping Behaviors. J. Acad. Nutr. Diet. 2017, 117, 1931–1940. [CrossRef]
[PubMed]
24. Shannon, J. What does SNAP benefit usage tell us about food access in low-income neighborhoods?
Soc. Sci. Med. 2014, 107, 89–99. [CrossRef] [PubMed]
25. Song, H.-J.; Gittelsohn, J.; Kim, M.; Suratkar, S.; Sharma, S.; Anliker, J. A corner store intervention in a
low-income urban community is associated with increased availability and sales of some healthy foods.
Pub. Health Nutr. 2009, 12, 2060–2067. [CrossRef] [PubMed]You can also read