ANALYSIS OF EUROPEAN POST-CONSUMER TEXTILE WASTE FOR AUTOMATED SORTING - DIVA
←
→
Page content transcription
If your browser does not render page correctly, please read the page content below
Master thesis in Sustainable Development 2021/1
                                         Examensarbete i Hållbar utveckling

                     Analysis of European post-consumer
                      textile waste for automated sorting
                                                  María Marín Pérez

DEPARTMENT OF
EARTH SCIENCES
 INSTITUTIONEN FÖR
  GEOVETENSKAPER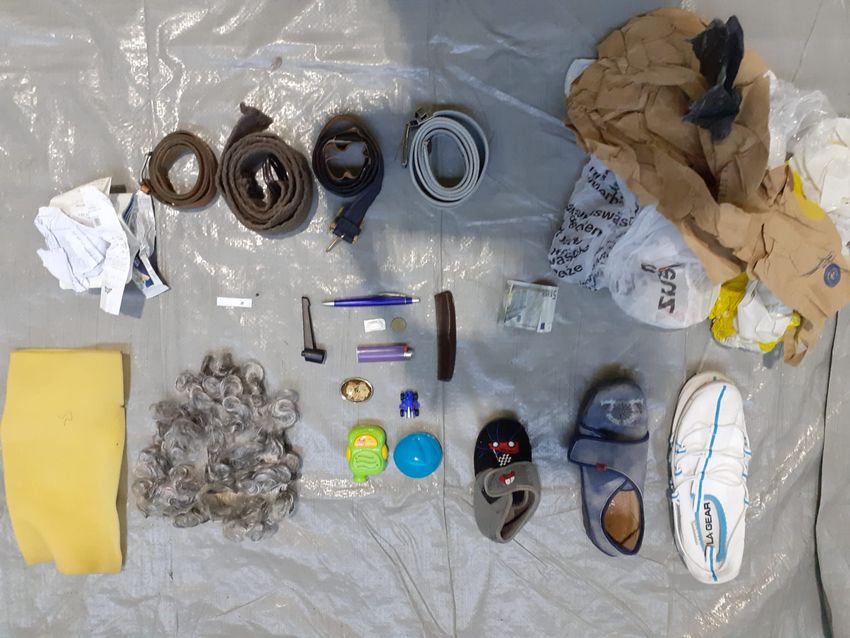
Master thesis in Sustainable Development 2021/1
                       Examensarbete i Hållbar utveckling

Analysis of European post-consumer
 textile waste for automated sorting
                                    María Marín Pérez

            "Post-consumer textiles bales", Maria Marin Perez, 2020.

                   Supervisor: Ambjörn Lätt
           Subject Reviewer: Sara Anderson
Copyright © María Marín Pérez and the Department of Earth Sciences, Uppsala University. Published at
Department of Earth Sciences, Uppsala University (www.geo.uu.se), Uppsala, 2021.
Content
1.      INTRODUCTION ......................................................................................................................................... - 1 -
1.1         Aim............................................................................................................................................................. - 1 -
2.      BACKGROUND ........................................................................................................................................... - 2 -
     2.1        What is SIPTex?..................................................................................................................................... - 2 -
     2.2 Political goals related to the project ......................................................................................................... - 3 -
     2.3 Textile recycling......................................................................................................................................... - 4 -
        2.3.1 Fibre-to-fibre textile recycling in Sweden ............................................................................................ - 4 -
3. METHODS ........................................................................................................................................................ - 7 -
     3.1        The Nirone scanner ................................................................................................................................ - 7 -
     3.2        Samples .................................................................................................................................................. - 9 -
     3.3. The analysis................................................................................................................................................. - 9 -
        3.3.1 Label reading limitations .................................................................................................................... - 11 -
     3.4. Questionnaire ............................................................................................................................................ - 11 -
4.      RESULTS .................................................................................................................................................... - 12 -
     4.1 Quantitative analysis results....................................................................................................................... - 12 -
        4.1.1 Boer group........................................................................................................................................... - 12 -
        4.1.2 Red Cross ............................................................................................................................................ - 16 -
        4.1.3 Trasborg ............................................................................................................................................. - 16 -
        4.1.4. Summary results ................................................................................................................................. - 18 -
     4.2 Questionnaire results .................................................................................................................................. - 19 -
5.      DISCUSSION .............................................................................................................................................. - 21 -
6.      CONCLUSIONS .......................................................................................................................................... - 23 -
8.      AKNOWGLEDMENTS .............................................................................................................................. - 24 -
8. REFERENCE LIST ......................................................................................................................................... - 25 -
9. Appendix .......................................................................................................................................................... - 28 -
     Appendix A. Spreadsheet results. .................................................................................................................... - 28 -
     Appendix B. Questionary questions................................................................................................................. - 31 -
Analysis of European post-consumer textile waste for automated sorting MARÍA MARÍN PÉREZ Marín, M., 2020: Analysis of European post-consumer textile waste for automated sorting. Master thesis in Sustainable Development at Uppsala University, No. 2021/1, 31 pp, 30 ECTS/hp Abstract: The textile industry is linked to several major environmental problems, as a consequence there is an interest at European level to reduce the impact of the industry. In Sweden there are several initiatives to increase the circularity of textile for example by promoting fibre-to-fibre textile recycling. To facilitate this type of recycling the SIPTex project was created to build an industrial automatic textile sorting facility able to offer the high-quality sorted fractions required for fibre-to-fibre recycling. This study developed a quantitative analysis to assess the composition of 1.5 tons of post-consumer textile. The results showed that 52% of the analysed material were high quality fibre garments - mainly cotton,19% lower quality fibre blends and 28%, uncategorizable garments and items not suited for the sorting facility- as shoes or oversized pieces-. The results will contribute to optimize the material inbound in the SIPTex. Keywords: Sustainable development, fibre-to-fibre recycling, post-consumer textile, automated textile sorting, SIPTex. María Marín Pérez, Department of Earth Sciences, Uppsala University, Village 16, SE- 752 36 Uppsala, Sweden
Analysis of European post-consumer textile waste for automated
sorting

MARÍA MARÍN PÉREZ
Marín, M., 2020: Analysis of European post-consumer textile waste for automated sorting. Master thesis in Sustainable
Development at Uppsala University, No. 2021/1, 31 pp, 30 ECTS/hp

Summary: The production of textiles is linked to several environmental problems. As a reaction there is a general interest at a
European level to reduce the impact of the industry and promote circularity in the system. There are several Swedish initiatives
promoting fibre-to-fibre recycling of textiles - a process that allow to produce new thread from used textiles - to reduce textile
waste and the environmental footprint in the production chain. One of them, the SIPTex, is about to open an industrial
automatic textile sorting facility in the south of Sweden to sort post-costumer textile and offer high-quality material for the
fibre-to-fibre recycling industry. The SIPTex project aims to overcome the main barrier for this type of recycling, that is to
channelize large volumes of mixed post-costumer textiles to high-quality recyclable products. This study analysed 1.5 tons of
post-consumer textile from three different actors around Europe to assess the material composition and provide to the SIPTex
operator with information about the material characteristics. This will facilitate the optimization of the flows from the post-
consumer textile suppliers to the fibre-to-fibre recycling partners. The results showed that 52% of the analysed material were
high quality fibre garments - mainly cotton-,19% lower quality fibre blends and 28% uncategorizable garments and items not
suited for the sorting facility. The study concludes that at the moment there is a large amount of sorting residues -low quality
fibre blends and items not suited for the sorting facility- that are not optimal at the moment for fibre-to-fibre recycling. Hence
the value of low-quality fibre blends should be maximized in other processes.

Keywords: Sustainable development, waste management, post-consumer textile, automated textile sorting.

María Marín Pérez, Department of Earth Sciences, Uppsala University, Villavägen 16, SE- 752 36 Uppsala, Sweden
1. INTRODUCTION

The textile industry is attaining much attention nowadays since it is linked to several environmental problems. The
sector is considered “the fourth largest contributor to resource´s use and greenhouse gas emission accounting
respectively for the share of textile consumed in the EU-28” (EuRic, 2019 p.2), the cultivation of textile fibre
crops also “has the potential to contribute to food deficits, and may interfere with the growing of food crops”
(Manshoven et al. 2019, p. 21 ). In addition, this industry causes pollution of air, soil and water in the producing
countries (Schmidt, 2016 p. 15).
In the European Union (EU) there is an “apparent average consumption” of around 9.5 million tons of textile
products, and an average of 19.1 kg per citizen per year. The apparent average consumption is calculated by
adding the European textile production and imports minus exports from 2007 in the EU-27 (JRC 2014, p. 27).
Hence the European Union members are mayor contributors to all the environmental issues associated with the
textile production. As a consequence, there is a general interest at European level to reduce the environmental
impact in the textile sector. The European Commission has communicated the will of expanding the textile
activity in the European region and increasing the circularity and the innovation in the sector (European
Commission, 2019). Furthermore, the 2018´s amendments in the Waste Directive Framework 2008/98/EC stated
that all member states must set up a separate textile collection by January 2025 (Directive (EU) 2018/851) and that
“the preparing for reuse and recycling of municipal waste shall be increase to a minimum of 55% by weight.”
(Directive (EU) 2018/851). Textile waste is considered municipal waste in the Waste Directive Framework
(Directive (EU) 2018/ 851), therefore the goal of increasing the preparing for reusing and recycling municipal
waste also refers to textile waste.
Sweden is already taking some actions to follow the European directions to increase the circularity in the textile
sector. This paper will focus on one of them, the project SIPTex, an industrial scale automated textile sorting
facility in Malmö that is expected to start operating during 2020. The facility will be equipped with sorting
technology based on visual and near-infrared spectroscopy that enable detection of fibre types and colours
(Elander, 2019). SIPTex will facilitate a future high-quality recycling, since one of the main barriers for textile
recycling is the mix of materials and colours (Manshoven et al. 2019, p. 19).

    1.1 Aim

One of the main challenges that the sorting facility will face is to develop the market for sorted post-consumer
material and match inbound and outbound textile streams. Therefore, this research will analyse SIPTex inbound
material from potential suppliers, such as manual sorters, to assess quality and composition of the sorted waste
streams. The aim of this research is to increase knowledge on quality and characteristics of post-consumer textile
streams in Europe in order to optimize the SIPTex sorting process and to understand how to use the textile streams
from inbound to outbound markets in a better way. At this regard, the following research question will guide this
paper:
What is the material composition of the different textile streams from potential suppliers of SIPTex?
The results of this study will increase the knowledge about the composition of discarded textile at a Nordic
level and the composition of pre-sorted recycled fractions at a European level. SIPTex will use this
information to optimize their future operations. Moreover, the outcome of this study can be useful for any
stakeholder in the recycling textile sector and facilitate the implementation of recycling textile activities in
the European region.

                                                        -1-
2. BACKGROUND
This section will point out different key concepts for a better understanding of this paper.
2.1 What is SIPTex?
SIPTex stands for the “Swedish Innovation Platform for Textile Sorting” and it is a project funded by
Vinnova – the Swedish innovation agency and their funding programme Challenge-Driven Innovation. The
project is in the third phase of a project series and is led by IVL, Swedish Environmental Research Institute.
The sorting facility will be operated by Sysav, a municipal waste management company that operates in the
south of Skåne (Sysav, 2019). Moreover, the project is supported by the following project partners:
Berendsen, Boer Group, Eco TLC, Gina Tricot, H&M, Human Bridge, Ica, Ikea, Kappahl, Swedish Chemicals
Agency, Gothenburg City (Kretslopp och vatten), Malmö City, Salvation army, Swedish Environmental
Protection Agency, Re:newcell, Red Cross, Stadium, Stockholm water and waste and VTT (IVL, 2019).
The aim of SIPTex (phase 3) is to build an industrial scale automatic textile sorting facility in Malmö equipped
with a combination of technologies, visual (VIS) and near-infrared (NIR) spectroscopy able to sort textiles in
different fibre types and colours (Elander, 2019) to adapt to current and future textile recycling processes. The
technology has already been tested in a pilot project plant (SIPTex phase 2) in Avesta (160 km northwest of
Stockholm) for one year, and it has been proved that the SIPTex sorting technology produces sorted textile waste
fractions with very high purity rates (Elander, 2019). The facility will start operating during the autumn of 2020
and it has a total sorting capacity of 24 000 tons per year with three working shifts (Lätt, 2020).
The idea of a national sorting textile facility in Sweden has been considered and studied for some years
now. In 2015 Carlsson et al published the Feasibility study Re: Textile- planning a Swedish collection and
sorting plant for Used textiles. The study presents the risks and motivations of creating such a facility. The
following paragraphs will sum up the key aspects of the feasibility study relevant for this paper.
Among the motivations, the report lists the economic, environmental and social incentives for a national
facility. Concerning the economic aspects, the facility will increase the value of the discarded textile that is
being exported abroad now for 1-2 SEK/kg. A refine sorting could increase the price of the exported textile
up to 4-5 SEK/kg. Moreover, the sorting textile could lead to a creation of new products and business
opportunities in the area.
Regarding the environmental motivations, a better sorting of textile will amplify the opportunities of a
future manufacturing of the sorted products, and therefore reduce the volume of textiles that are incinerated
nowadays because there are no options for remanufacturing. Consequently, it will have a positive impact on
the management of discarded textiles according to European Waste hierarchy, since this will enable an
improvement from incineration to recycling/reuse.
Finally, considering the social benefits, the study assert that the sorting facility would increase the number
of job opportunities and develop a new sector in the area.
Another important consideration reported is the analysis of the future textile exports in Sweden.
The main countries where Sweden is exporting clothes for second-hand markets might decrease their
demand in the future. This is due to increasing life standard that could lead to a creation of an internal stock
for the second-hand markets. If that is the case, Sweden will have an increased volume of discarded textiles
to manage.
Despite of those motivations the study finds out that “realistic conditions do not permit a profitable, fully
commercial sorting facility. There is a need to further value-adding features, which that must be developed
in order to ensure the feasibility of such a national facility” (Carlsson et al.2015, p. 16). The study points
out different critical factors that must be approach for a success in the facility and provides the following
recommendations (Carlsson et al 2015, p. 16):
1. Hire regular workforce for the installation instead of the voluntary workers. The sorting sector at the
moment relies mainly in voluntary work.
-2-2. Increase the quality of the incoming material. It is suggested to collaborate with the material providers
partners to increase the quality of the incoming material and therefore the revenues.
3. Increase the productivity in the sorting centre.
4. Increase the value of the output by innovating in the process or develop new products.
5. Apply automated sorting
6. Implement new business models like web services.
7. Provide a parallel technical and administrative services.
This study will contribute to the recommendation number 2 about increasing the quality of the incoming material.
The knowledge about the composition of the inbound material will allow Sysav to negotiate with providers and
increase the inbound quality by for example introduce new pre-sorting routines.
2.2 Political goals related to the project
The creation of the SIPTex facility is also a response to different political goals set at European, regional
and national level. The following paragraphs list the different goals and legislation that SIPTex will
contribute to.
1. Latest amendment in the European Waste Directive from April 2018.
All state members have to implement separate textile collection before January 2025. At the same time “the
preparing for reuse and recycling of municipal waste shall be increase to a minimum of 55% by weight.”
(Directive (EU) 2018/851). The textile waste is considered municipal waste in the Waste Directive Framework
(Directive (EU) 2018/851) therefore the goal to increase the recycling of municipal waste also include the increase
of textile recycling.
2. Nordic council of Ministers.
The Nordic council of ministers, a forum for a Nordic cooperation, has developed the Nordic textile strategy to
increase the sustainability of the textile sector in the Nordic region. The main goals are to “increase the collection,
sorting, reuse and recycling within the Nordic region” (Palm et al., 2014 p.9).
The report lists 13 necessary changes that are needed to achieve the sustainability in the region. The changes
suggested in the report (Palm et al., 2014 p. 14) are the following:
1. Increase transparency in data collection and textiles flow
2. Increase active lifetime of textile products
3. Changed consumer behaviour for textile products
4. Increase attractiveness of collection
5. Increase collection of used textiles
6. Introduced/increased services for (certified) de-branding of corporate textiles for recycling in the Nordic
regions
7. Increase reuse
8. Increased and improved sorting of collected textiles
9. Improved management of used textile a textile waste flows for more coordinated and efficient handling
10. Increased recycling
11. Increased share of textile-to-textile recycling
12. Increased market for recycled textiles
13. Reduced use of toxic compounds in textiles
3. Naturvårdsverket (Swedish Environmental Protection Agency)
The Swedish government commissioned the Swedish Environmental Protection Agency (EPA) in 2014 to
investigate and propose sustainable options for textile waste management (Naturvårdsverket, 2016, p. 8). As a
result, the Swedish EPA published a report of the assignment in 2016, Förslag om hantering av textilier –
Redovisning av regeringsuppdrag (Proposals for handling textiles - Accounting of government assignments in
English), and it proposes the following goals:
-3-• “By 2025, the amount of textile waste in the residual waste will be reduced by 60 percent compared to
base year 2015.” (Naturvårdsverket, 2016, p.59)
• “In 2025, 90 percent of separately collected textile waste will be prepared for reuse or recycling. The
waste hierarchy should be applied, and material recycling should primarily be in the form of recycling for
new textiles.” (Naturvårdsverket, 2016, p. 59)
2.3 Textile recycling
Textile recycling is a growing sector facing many challenges. The non-reusable textiles are often recycled for
use in industrial processes or as upholstery or insulation, but also as composites, when not incinerated. Less
than 1% of the discarded textile are recycled into new fibres for clothing (Manshoven et al. 2019, p.16). The
two existent textile recycling techniques are mechanical and chemical:
Mechanical recycling
There are different methods in mechanical recycling, depending on the garment and the composition. The most
common method is to cut or tear textiles for industrial rags or padding. Other textiles are treated with heat and
converted into non-woven textiles used for insulation or upholstery.” (Östlund et al. 2015, p. 28).
However, fibre-to-fibre is the technique that produce the most valuable output in mechanical recycling. This
technique tear, card and spin used fabrics into new thread. The recycled threads have lower quality than virgin
materials since the fibres get shorten during the recycling process, but the quality of the product can increase if the
recycled thread is blended with virgin fibres during the spinning. Cotton and wool are optimum materials for
fibre-to-fibre recycling. (Östlund et al. 2015, 29).
Chemical recycling
In chemical recycling new fibres are made by dissolving or melting old fibres. Cotton and cellulose-based
fibres (viscose, lyocell, modal) need to be dissolved, while synthetic polymer fibres (polyamide, polyester,
polyurethane and acrylic) need to be melted. Since different fibres needs different treatments, mixed
composition in fabrics is a challenge in the recycling process (Östlund et al.2015, p. 31).
Nevertheless, fibre-to-fibre chemical recycling is also possible with the available technology, but it is still
not done in industrial scale yet, one example is the recycling of polyester by the company Taijin (Schmidt et
al. 2016,p. 22). In Sweden there are some chemical recycling projects as well, the company Re: newcell dissolves
natural fibres into a raw material called “Circulose pulp” suitable for creating textile fibre (Re: newcell, 2020).
The forestry company Södra, is another company working with textile chemical recycling, their patented process
OnceMore dissolves textile waste and cellulose from wood to create textile fibre. (Södra, 2020).––
2.3.1 Fibre-to-fibre textile recycling in Sweden
In Sweden there is a general interest in promoting the fibre-to-fibre textile recycling, following the
recommendation of the Swedish EPA. The previous mentioned report Proposals for handling textiles -
Accounting of government assignments set the goals of increasing textile recycling by 2025 and it promotes fibre-
to-fibre recycling over other types of recycling (Naturvårdsverket, 2016, p. 61). It also states - paraphrasing
Schmidt et al. (2016) - that life cycle analysis demonstrates that mechanical material recycling has slightly higher
environmental benefit in the short term (Naturvårdsverket, 2016, p. 40). Despite the recommendations there are
several technological and logistical challenges in the fibre-to-fibre process. The main ones are the following:
Challenge number one is mixed fibres. Most textiles are made by fibre blends, and that constitutes a
problem for sorting and recycling. The sorting of textile is so far done mainly manually and the multifibre
textiles complicate the sorting (IVL, 2016). Concerning chemical recycling, the process requires only pure
fractions (Palme et al. 2017. p.1) and at the moment there are technological challenges in fibre separation and
fibre quality according to Manshoven et al. (2019, p.16)
In addition, the textiles are often mixed with plastic or metal elements like zippers, buttons or decorations
that also aggravate the recycling process. (Elander & Ljungkvist, 2016 p.18)
-4-Challenge number two is chemicals in textiles. The production of textiles involves the use of a great variety
of chemicals, from pesticides and fertilizer when growing natural fibres, to chemical colourants in the
production and other chemical components to add special properties to the textiles as for example flames
retardants and water repellents. Some of those chemicals are designed to remain in the finished products.
(Swedish Chemical Agency, 2013, p.18)
The report Hazardous chemicals in textiles by the Swedish Chemicals Agency (Kemikalieinspektionen) has
investigated the use of hazardous chemicals in the textile production. The mapping of chemicals in garments
for the study was estimated, since many of the chemicals are considered confidential by the manufacturer
(Swedish Chemical Agency 2013, p. 24). The difficulties to assess the types of chemicals in garments can
adverse the recycling process according to Hanna Ljungkvist (IVL, 2015). For example, the presence of the
chemicals in the textiles can create undesirable reactions in chemical recycling processes causing technical
problems, such as decreased durability or need of an additional process for purification (Schmidt et al 2016, p.26).
In addition, the lack of knowledge about the presence of chemicals in textiles is a concern for the companies that
want to use recycled fibres from used textiles. (Schmidt et al., 2016, p. 25).
Challenge number three is the collection of textiles. The volume of collected post-consumer textile remains
low (IVL, 2015), this also means a low volume available for sorting. In addition, it represents a waste of
resources since a high volume of clothes is being incinerated instead of recycled (Watson et al. 2018, p.14).
Watson et al. (2018) provide in the study “Used Textile Collection in European Cities” a chart with the
textile collection data in different European countries. However new regulations as the mandatory separate
textile collection in the EU from 2025 (Directive (EU) 2018/851) and the current investigations about the
extended producer responsibility for textiles in Sweden (Regeringen, 2019) will contribute to increase the
amount of textile collected.
Table 1. Post-consumer textile collected some European countries (Watson et al. 2018, p.16).
Moreover, the research program Mistra Future Fashion published in 2016 the report Critical aspects in design for
fibre-to-fibre recycling of textile a study including the critical factors in fibre-to-fibre textile recycling from the
perspective of fashion companies, textile sorters and textile recyclers. The study analysed the textile waste before,
during and after the recycling process. The factors rated with medium to large impact were the following (Elander
et al. 2017, p.13):
- Availability of textile recycling technology.
- Lack of economic viability of textile sorting and recycling.
- Lack of guidance on ownership of used textiles/textile wastes.
- Lack of information regarding content in textiles for recycling.
-5-- Market prices for recycled textile fibre.
- Presence of non-textile materials in textile products.
- Quality of textile fibres for recycling.
- Trade barriers for textile waste.
- Use of mixed textile fibres in textile products.
-6-3. METHODS
The present study aims to analyse and quantify the material composition of post-consumer textiles from three
different companies. To do so, a quantitative research study has been performed where 1,759 post-consumer
textile garments have been sorted according with their label’s information and characteristics in 17 different
categories. For the items with no label or non-legible label this study used a Nirone scanner to evaluate the
garment’s fibre.
Label reading was used as the main technique because it allowed to create more sorting categories than the
scanner. The next section will detail the categories detected by the scanner.
For a better understanding of the results, a questionnaire was sent to the different organizations that participate in
the analysis -Boer Group, Trasborg and the Red Cross- to have a deeper knowledge of their sorting processes.
3.1 The Nirone scanner
The Nirone Scanner is a handheld material scanner “equipped with next-generation NIR-technology” (Spectral
Engines, 2020). The NIR technology is an optical material identification able to “separate mono-materials from
blended textiles” (Zitting, 2020). The Nirone scanner is able to detect the main fibre in a garment only if:
1. The fibre or mix of fibres are categorized and registered in the cloud-based scanner library. The registered
categories are cotton, polyester, viscose, polyamide, wool and polyester + cotton blends.
2. The concentration of the fibre in the garment is high. Usually when the concentration of the fibre is higher
than around 90 %, but this threshold varies for different fibres. The only exception is the category
polyester + cotton, where the scanner detects garments with a composition 70 % polyester +30 % cotton.
If the garment is made with a fibre not registered in the scanner, or if the fibre concentration is below the scanner
threshold, the scanner categorizes the garment as “unknow”.
The thresholds of the scanner differ depending on the fibre. The threshold values are not given by the scanner
provider; therefore, it was included in this study to scan samples of cotton, polyester, viscose, polyamide and wool
with a fibre concentration from 80% to 100%, and different combinations of polyester + cotton blends to find out
the scanner thresholds for the different categories. The results are the following:
Fibre Max. value detected Min. value detected Maximum value unknow
COTTON 100 % 89 % 86 %
WOOL 100 % 82 % X
VISCOSE 100 % 90 % 88 %
POLYAMIDE 100 % X 88 %
POLYESTER 100 % 92 % 89 %
POLYESTER + COTTON 70 PES/30 COTT 75 PES/15 COT X
Table 2. Empirical scanner threshold values.
Early in the investigation some limitations were detected in the scanning, frequently the results of the scanner did
not coincide with the information on the label. This could be due limitations in the scanner performances -since
the device is still in the pilot stage and there is not any error rate available at the moment- or because the
information in the label is not accurate. This study did not have the possibility to check with a third method to add
accuracy.
Some of the errors that have been detected appear below. They are ranked from more to less often:
-7--A 100 % linen garment was categorized as cotton. (Very often)
-100 % - 99 % cotton garments were categorized as “unknow”. (Very often)
-A 80% linen + 20 % cotton garment was categorized as cotton (Often)
-A 80 % cotton + 20 % polyester was categorized as cotton. (Often)
-100 % - 98 % cotton garments were categorized as viscose. (Often)
-100 % acrylic item was categorized as wool. (Extremely rare)
- A garment with the composition 58 % cotton+ 12 % viscose + 28 % polyester + 2 % elastane, was scanned four
times in a row and the results were “Viscose” one time and “Cotton” three times. (Extremely rare)
Those errors were discussed with Spectral Engines and they clarify that linen, viscose and cotton are cellulosic
based fabrics with similar molecular structure, therefore the scanner sometimes might detect them incorrectly. The
structure of the fibres can lead to errors sometimes as well. Polymers are sometimes spun as a core of a fibre,
which means that it cannot be detected with the scanner. Moreover, softeners and impurities in the fabrics could
also make detection of the fibres difficult. Focusing in the last error, about scanning the same item several times
with different results, Spectral Engines explains that it is a matter of statistics to find the correct result. Finally,
some garments had different fibre composition in different parts of the items, so depending where the scanning is
done the results might vary, and therefore also the result from label reading and scanning might not match.
(Zitting, 2020)
The Nirone scanner is developed by Spectral Engines. The scanner is a small device (Figure 1) easy to control
with an app in any phone or tablet connected via Bluetooth. To analyse a garment, the material must be place on
top of the scanner and the scanner sends the information to a cloud platform with material analysis algorithms and
data storage where the material is analysed. The results are sent to the mobile or tablet and shown in the app
within 3 seconds. The cloud platform allows a fast data collection and analysis (Spectral Engines, 2020) that
makes the analysis of big amounts of garments easier.
This study borrowed the Nirone scanner from LSJH, a finish waste management company that is implementing
the use of the scanner in their textile sorting process.
Fig. 1: Nirone scanner and textile samples.
-8-3.2 Samples
The three companies that provided the textiles analysed in this report were chosen by Sysav, since their textile
flows are interesting for SIPTex in this phase. Two of the three actors-The Red Cross and Boer- are SIPTex
partners. The companies have different types of products and sorting processes and all of them delivered the
material to the sorting facility in Malmö.
Red Cross Sweden
The Red Cross is one of the world’s largest humanitarian networks, and the largest humanitarian organization in
Sweden. Red Cross Sweden have about 300 stores around the country where they sell second-hand items. Since
2013 the organization sell the unsold textiles, bags and shoes to recycling partners. (Svenska Röda Korset, 2020).
Trasborg
Trasborg is Danish company running since 1917. The company collect clothes from donations and containers
located all over the Denmark, then the textiles is sorted and exported mainly to Europe and to Africa. The clothes
that cannot be sold to recycling partners, about 20%, are incinerated for energy recovery. (Trasborg, 2020)
Boer group
Boer Group have been collecting, sorting and preparing textiles, worn clothing and shoes for reuse for over 100
years. The organisation comprises three collection companies and seven sorting companies in the Netherlands,
Belgium and Germany, one recycling company in the Netherlands as well as an innovative platform. (Boer group,
2020)
3.3. The analysis
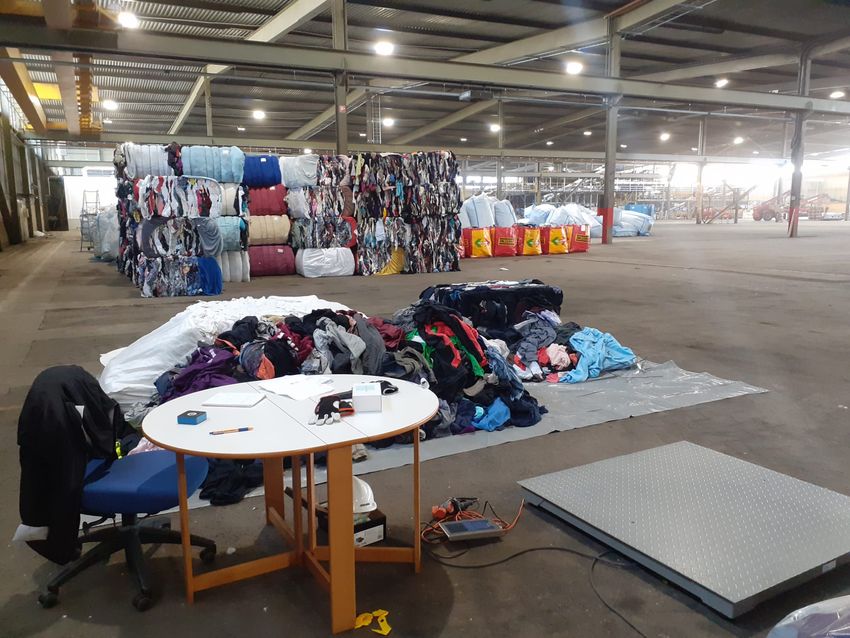
The analysis of the materials took place in Malmö in the SIPTex facility, placed in the city´s industrial area,
during May and June 2020. The sorting station can be observed in figure number two. The materials from the
different companies, and the different subfractions were analysed individually, so the fractions were never mixed.
During the sorting each garment was analysed individually and sorted according to the information on the label. If
the garment did not have a label or if it was wash out, the garment was scanned and sorted according with the
scanner results. If the results from the scanner were not conclusive the item was categorized as unknow.
The number of categories in the sorting process were different depending on the analysed fraction. Not all
categories were found in all fractions. For example, during the analysis of a fraction that mainly contained jeans,
the material was sorted in four different categories, while the analysis of the materials coming from the charity
required 17 different categories. The categories developed in the study are the following:
Category name Fibre content Description of the category
Cotton ≥ 89 % include garments that has been detected with a
concentration of cotton ≥ 89 %.
Viscose ≥ 90 %. include garments that has been detected with a
concentration of viscose ≥ 90 %.
Polyester-cotton blends include garments composed by cotton and polyester.
Polyester-cotton blends P>C include polyester-cotton blends items in winch the
concentration of polyester is higher than cotton. *
Polyester-cotton blends C≥P include polyester-cotton blends items in winch the
concentration of cotton is greater or equal is higher
than polyester. *
-9-Unknow include garments with no label, no legible label and
that could not be detected with the scanner either.
Most likely this fraction contains fibres blends of low
quality not detectable by the scanner, but since the
scanner present some limitations in the performance
this category might include some HQ garments as
well.
Acrylic HQ (High ≥ 90 % include garments that has been detected with a
Quality) concentration of acrylic ≥ 90 %.
Acrylic LQ (Low < 90 %. include garments that has been detected with a
Quality) concentration of acrylic < 90 %.
Wool HQ ≥ 82 %. include garments that has been detected with a
concentration of wool ≥ 82 %.
Wool LQ < 82 %. include garments that has been detected with a
concentration of cotton < 82 %.
Polyester ≥ 90 %. include garments that has been detected with a
concentration of polyester ≥ 90 %.
Polyamide ≥ 90 %. include garments that has been detected with a
concentration of polyamide ≥ 90 %.
Garments ≥ 3 fibres include garments composed by three or more fibres
2 fibres garments include garments composed by two fibres
Linen ≥ 90 % include garments that has been detected with a
concentration of linen ≥ 090 %.
Low-volume pure include items with pure fibres found in
fractions the fractions, but with too small volume to constitute
an independent fraction, e.g. silk and Tencel.
Double shell garments include garments composed of more than one shell.
The most common double shell items were jackets
and coats. Multi-layer garments with more than one
fibre are not suited for sorting in SIPTex.
Very small items include very small items as socks, small baby clothes
and small underwear pieces
Mixed home textiles include beddings and blankets bigger than 2x2
not suited for SIPTex meters, curtains, carpets, hats, pillows and elastic
(M.H.T.N.S.S) sheets. Those products are not suited for sorting in
SIPTex.
Shoes include all types of shoes. Shoes are not suited for
sorting in SIPTex.
Table 3. Sorting categories created for this study.
*Those categories were used when the polyester-cotton blend category was very numerous. Therefore, when
polyester-cotton blend P > C / C ≥ P categories were used the polyester-cotton blend category was unused.
**Sometimes an initial fraction was divided in two, like the case of Acrylic HQ and LQ and Wool HQ and LQ
This was decided because acrylic and wool were the main materials in one fraction and it was consider relevant to
analyse what percentage of high and low quality of both fibres were included in the fraction.
After sorting all the textiles for every fraction, either with label reading or scanning the categories where weighted
using an industrial scale, and the results were recorded in kilograms.
- 10 -Fig. 2: Sorting station in Malmö.
3.3.1 Label reading limitations
The European regulation nº 1007/2011 regulates garment labelling in the EU. The regulation establishes the rules
for an accurate reporting of the material and percentages in the label. Nevertheless, there are few rules that allow
some flexibility in the labelling. For example, the Article 7.2 that regulate pure textile products labelling, establish
that a textile “containing no more than 2% by weight of extraneous fibres” can be consider composed by the same
fibre in the label, since it considers that the extraneous fibres are technically unavoidable during the
manufacturing. In the same case, carded items are allowed to be label as pure fibres, and to have no more than 5%
of an extraneous fibre for the same reasons. The fibres from decorations do not have to be reported if they do not
exceed the 7% of the weight of the finished product. The Article 11 about “Multi-component textile products”
states that for this type of products it is not compulsory to report the textile components that are not main linens
and represent less than 30% of the total weight of the product (European Parliament, 2011). It should be taken in
consideration that some of the items analysed might be older than this legislation, hence do not fulfil the given
requirements. However, there is also a Council Directive from 1971 where textile labelling is regulated, this this
Directive in not as extensive as the regulation from 2011, but it contains the labelling of pure fibres garments with
the same rules as in 2011 (Directive (EU) 71/307).
3.4. Questionnaire
In order to have a deeper understanding of the sorting process, all the companies that provided post-consumer
textiles filled in a questionnaire about their sorting process in details. This study chooses to perform a
questionnaire instead of interviews because the information pursued were mainly specific data – like the number
of fractions in the sorting process or the geographical area of the textile collection- and because of lack of time
among companies involve in the process. Appendix II includes the questionnaire that was sent to the companies.
- 11 -4. RESULTS
The result presented in this section are:
1. The outcome of the quantitative analysis performed on the post-consumer textile.
2. The information collected from the questionnaires filled in by the different companies is analysed.
4.1 Quantitative analysis results
The following chapter will present the findings from the different fractions analysed. Different pie charts will
represent the percentage of each category over the total. The categories smaller than 1 % of the total weight have
been omitted in the pie charts, but they are presented in Appendix I, a spreadsheet containing the number of kilos
of the different categories, fractions and companies. The chapter also contains a description of the material
analysed, nevertheless not all fractions have been analysed in detailed, only the relevant ones in terms of size,
content or if they specially stand out in comparison with other categories or fractions.
To understand the results better is important to be reminded about the difference between this study´s definitions
of “fraction” and “category”. A fraction constitutes the clothes that have been sorted in the same group by a
provider -they can have something in common like the fraction “broken jeans” or they might not be related and be
a wild mix-. A category constitutes the clothes from different fractions sorted according to specific requirements
(for example “Cotton”). Therefore, this study sorted the given fractions into created categories.
4.1.1 Boer group
This study analyses seven different fraction from Boer Group. The material from Boer was presented in
compressed bales around 300 – 500 kg tied with metal wires.
Fraction 1. Broken jeans.
A sample of 220 kg was analysed from a 528 kg bale. The content of the bale ware mostly jeans. The cotton
category included mainly jeans 100 % cotton according to the label, but very often jeans were a blend of a high
concentration of cotton with a bit elastane, a common combination is 95 % - 98 % cotton blend with 5 % -2 % of
elastane. The unknow category in this fraction is composed mainly of jeans with lower quality material
compositions. The analysed jeans were very often a blend of cotton, polyester and elastane or viscose. Very
common combinations were Cotton 70 % - 80 %, polyester 15 % -20 % and elastane 2 % - 5 %. The Polyester -
cotton blend category includes mainly working clothes like overalls or working trousers and the concentration of
polyester in those garments was usually higher than cotton, a common combination was 65 % polyester and 35 %
cotton.
BROKEN JEANS
Unknow
26%
Polyester cotton
blends
5%
Viscose
Cotton
1%
68%
Fig 3. The different categories in the fraction “broken jeans” from Boer.
- 12 -Fraction 2. Knitted items.
A sample of 220 kg was analysed from a bale of 434 kg. The fraction was composed mainly from knitted items of
various fibres, particularly relevant from this fraction was the high number of scarfs. The main fibre in this
fraction was acrylic and it was classified into two different categories: high quality acrylic when the acrylic
concentration in the garment was greater or equal than 95 % and low-quality acrylic when the concentration of
acrylic was lower than 95 % and was blended with a second fibre. The unknow category includes garments with
no label, illegible label and those non-detected by the scanner. The unknow category in this fraction is particularly
high because the Nirone scanner is not programmed to detect acrylic, therefore the unlabelled acrylic garment was
never detected by the scanner and as a result, classified as unknow. As a result, most likely the category
“unknown” is composed by acrylic items or low-quality blends. Knitted cotton garments were also very common
in this fraction and the cotton concentration in those garments were 100 % very often. The content of wool
detected was very low, just 3 % of HQ wool (≥ 80 %). Since this fraction is the one most likely to contain a
greater number of wool garments a LQ (< 80 %) wool category was also consider, in that case only 3 % kg of LQ
wool were detected. The wool garments were usually mixed with other fibres as acrylic, but blends of different
types of wool like Kashmir or mohair were very common as well.
KNITTED ITEMS
Garments ≥ 3
Double shell 2 fiber garments
fibers Cotton
garments 3%
4% 15%
1%
Wool HQ
Polyester Viscose
3%
2% 1%
Wool LQ
3% Polyester cotton
blends
2%
Acrylic HQ
19%
Unknow
27%
Acrylic LQ
20%
Fig 4. The different categories in the fraction “knitted items” from Boer.
Fraction 3. Coloured wipers.
A sample of 221 kg was analysed from a 481 kg bale. This fraction contained mainly sweatpants and sweatshirts
with and without zippers. It was detected a high number of garments with mixture of different materials. For
example, hoodies made with a polycotton blend but with some parts of the garments, as the hood made just with
cotton or with a different proportion of a polycotton blend. This category also contained several embroider
garments, some of those decorations were made with polyester thread. The main category in this fraction was
polyester cotton blends, those garments were classified in two different categories: blends with higher amount of
polyester (a common blend was 60 % + 40 %) and garments with equal or higher amount of cotton, (a common
blend was 80 % + 20 %).
- 13 -Garments ≥3 2 fibers
fibers COLOURED WIPERS garments
2%
8% Polyester
3%
Cotton
26%
Unknow
15%
Viscose
1%
PCB P>C
11%
PCB C≥P
34%
Fig 5.The different categories in the fraction “coloured wipers” from Boer.
Fraction 4. White clothes.
A sample of 219 kg was analysed from a bale of 406 kg. This fraction contained white items, mostly long-sleeved
shirts and blouses. The main category in this fraction was cotton. In comparison to other fractions, the categories
“garments ≥ 3 fibres” and “2 fibres garments” were much heavier. The white clothing was composed by a vast
array of different blends. None of the blends were common enough to constitute an independent category. Some
examples of 2 fibres garments are linen blends with cotton, viscose or wool, polyester-viscose and cotton-viscose.
In the category garments ≥ 3 fibres the combinations are like the previous ones but also including elastane in the
blends. Moreover, this fraction was the only one where it has been detected a high amount of HQ linen, but as it
has been said before linen was also a common fibre in blends. The category “unknow” is most likely composed by
low quality fibres blends garments and linen items that are not legible for the scanner.
WHITE CLOTHES
Linen
2 fibers garments 4%
10%
Garments ≥ 3
fibers
7% Cotton
Polyester 42%
2%
Unknow
19%
PCB C≥P PCB P>C Viscose
3% 8% 5%
Fig 6. The different categories in the fraction “white clothes” from Boer.
- 14 -Fraction 5. Terry clothes.
A sample of 219 kg has been analysed from 355 kg bale. This fraction contains mainly bathrobes with their belts.
The main category in this fraction was cotton, composed mainly of 100% pure cotton bathrobes. The other
garments in the cotton category were bathrobes blended with 2-10% other fibres. Terry clothes were the most even
fraction regarding type of garment and type of fibre. It also contained the highest amount of HQ cotton in
comparison with the other fractions analysed. The unknow category was entirely composed by bathrobes as well,
most likely HQ cotton, but the scanner could not detect those items.
TERRY CLOTHES
Double shell
garments
1%
Unknow
32%
PCB Cotton
1% 66%
Fig 7. The different categories in the fraction “terry clothes” from Boer.
Fraction 6. Dark coloured cotton.
A sample of 219 kg has been analysed from a 370 kg bale. This fraction contained mainly long-sleeved shirts and
pyjama bottoms with plaid pattern in dark colours. The analysis found out a lot of merchandising tote bags in
this fraction. The main category in this fraction was cotton, none of the other categories was especially relevant
but the “double shell garments” in comparison with the other fractions is higher. That fraction contains mainly
double shell jackets and shirts where the different shells are formed by different fibres. The category “unknown”
in this fraction is composed mainly by merchandising tote bags and low-quality fibre blends.
Double shell 2 fibers garments
garmentsGarments ≥ 33%
DARK COLOURED COTTON
Line
2% fibers 1%
Polyester
2%
1%
Unknow
19%
Cotton
PCB C≥P 58%
3%
PCB P>C
5%
Viscose
6%
Fig 8. The different categories in the fraction “dark coloured cotton” from Boer.
- 15 -4.1.2 Red Cross
The material from the Red Cross was not pre-sorted in different fractions and it was delivered in 5 kg bags of
wild mixes. A sample of 220 kg of material has been analysed. The material analysed contained all types of
garments, a large proportion of baby clothes, but also home textiles and accessorizes. The largest category from
the Red Cross was cotton and the second largest category was home textiles not suited for the SIPTex sorting,
containing pillows, yarns, big beddings, carpets, curtains, elastic sheets, suspenders, hats and caps. The third
major category was double shell garments (also not suited for SIPTex), mainly winter jackets with double shells
and inner filling. The fraction also contained shoes, accessories and a large number of socks and particularly
small items, as kids’ underwear and swimwear pieces. The category “unknown” from the Red Cross was
composed by items that most likely are low quality fibre blends.
Shoes
RED CROSS 1%
[Cite el origen M.H.T.N.S.S. Cotton
aquí.] 22 % 26 %
Very small items
2%
Viscose
Double shell
2%
garments PCB P>C
8% 2%
Low volumen pure fractions 1% PCB C≥P
5%
2 fibres garments
Garments ≥ 3
3% fibres Unknow
7% Polyester Wool LQ Wool HQ 13 %
6% 1% 1%
Fig 9. The different categories in the Red Cross material.
4.1.3 Trasborg
The material from Trasborg was not pre-sorted in different fractions and it was delivered in compressed bales of
400-500 kg wild mix. The material analysed was used to send to African or South Asian markets, nevertheless
Trasborg decided to stop those shipping, therefore the company prognoses to have big stocks of this material from
now on. This type of material represent the 47% of the total collection from the company (Trasborg, 2020)
A sample of 223 kg was analysed from a bale of around 450 kg. The material was a wild mix of garments, but
mostly home textiles, particularly beddings. Other items found were bags with clothes inside, brand new items in
the original package, sponges, fabric leftovers, recycled blended fibres items, decorative serviettes and many
pieces of fabrics. The largest category in the material from Trasborg was cotton, mainly composed by small size
beddings. The oversized beddings were categorized as mixed home textiles not suited for the SIPTex, this
category also includes cushions, carpets, elastic sheets, duvets and curtains. The category very small items was
composed mainly by rolled socks. The material also contained some non-textile items, as toys, jewellery and
plastics bags. The category “unknown” includes many small beddings, most likely cotton, and some small home
textiles, neither detected by the scanner.
- 16 -TRASBORG
[Cite el origen Polyester cotton
aquí.]
Polyester Very small items
6% blends 2%
1%
Double shell items
2%
Cotton
41 %
Unknow
27 %
M.H.T.N.S.S
21 %
Fig 10. The different categories in Trasborg material.
The material from the different actors was overall clean, in good conditions and good smell. Extremely dirty or
stinky garments were very rare. In the figure 11 some of the extraneous items found during the analysis can be
observed.
Fig. 11.. Example of extraneous items found in the analysed material.
- 17 -4.1.4. Summary results
The following section combine the results from the three different actors and present the calculation and
percentages of pure fibres and fibres blends. In total numbers (the addition of the same categories from the
different fraction and companies) the analysis has detected:
• 920 kg of pure fibres. Ranking the pure categories in descending order, the results are the following:
1º Cotton (780 kg)
2º Polyester (44 kg)
3º Acrylic (HQ) (42 kg)
4º Viscose (29 kg)
5º Linen (13 kg)
6º Wool (HQ) (8 kg)
7º Low volume pure fractions (4 kg)
8º Polyamide (1kg)
Low volume pure
PURE FIBERS fractions
Viscose Wool 0% Linen
Acrylic 3% 1% 1%
Polyester 5%
5%
Cotton
85%
Fig 12. Percentages of pure fibres from the three analysed actors combined.
• 341 kg lower quality fibre blends. Ranking the low-quality fibre blends categories in descending order,
the results are the following:
1º Polyester cotton blends - include the categories C ≥ P and P > C - (177 kg)
2º Garments ≥ 3 fibres (61 kg)
3º 2 fibre garments (50 kg)
4º Acrylic (LQ) (44 kg)
5º Wool (LQ) (9 kg)
- 18 -LOWER QUALITY FIBRE BLENDS
Wool L.Q
2%
Aclylic L.Q
19%
Polyester cotton
blends
48%
2 fiber garments
14%
Garments ≥ 3
fibres
17%
Fig 13. Percentage of the lower quality fibres blends categories from the three analysed actors combined.
All the remaining categories that might include fibre blends as double shell garments or mixed home textiles not
suited for the SIPTex, has been excluded because those items are not suited for sorting in SIPTex. The category
unknow has also been excluded because the content is uncertain, but most likely it is composed by low quality
fibre blends.
4.2 Questionnaire results
The following chart displays all the information provided by the three companies analysed.
Red Cross Trasborg Boer Group
1. How are the textiles collected?
Shops and external Containers on public places. Containers in public and
collaborations. private places.
2. What is the textile origin?
Sweden Denmark Belgium, Germany, the
Netherlands + collaboration
with several European partners.
3. How is the material sorted?
By hand. By hand By hand.
Pre-sorting Pre-sorting
Fine sorting Fine sorting
- 19 -4. How many different fractions are in the sorting process?
Usually 9, but it can vary 120 + fine sorting 350 approx.
depending on the location.
5. What are the main markets for your products at the moment?
Second-hand clothing and Second-hand clothing, export Second-hand clothing,
recycling. to Africa, industrial wipers. insulation material, upholstery
and industrial wipers.
6. Observations and future actions.
They plan to increase the The quality of collected textiles
number of the sorting fractions. has decrease over the
last years, so the non-reusable
They will stop sorting fractions
fractions will increase.
as wipers because they do not
pay off.
Table 4. Results from the questionnaires.
- 20 -You can also read