Data Analytics for Predicting COVID-19 Cases in Top Affected Countries: Observations and Recommendations - MDPI
←
→
Page content transcription
If your browser does not render page correctly, please read the page content below
International Journal of
           Environmental Research
           and Public Health

Article
Data Analytics for Predicting COVID-19 Cases in Top
Affected Countries: Observations
and Recommendations
Abdelrahman E. E. Eltoukhy 1 , Ibrahim Abdelfadeel Shaban 2, * , Felix T. S. Chan 3              and
Mohammad A. M. Abdel-Aal 1
 1    Systems Engineering Department, King Fahd University of Petroleum and Minerals, Dhahran 31261,
      Saudi Arabia; Abdelrahman.eltoukhy@kfupm.edu.sa (A.E.E.E.); mabdelaal@kfupm.edu.sa (M.A.M.A.-A.)
 2    Faculty of Engineering, Helwan University, Helwan 11795, Egypt
 3    Department of Industrial and Systems Engineering, The Hong Kong Polytechnic University, Hong Kong,
      China; f.chan@polyu.edu.hk
 *    Correspondence: i.a.shaban@connect.polyu.hk

 Received: 26 August 2020; Accepted: 25 September 2020; Published: 27 September 2020

 Abstract: The outbreak of the 2019 novel coronavirus disease (COVID-19) has adversely affected many
 countries in the world. The unexpected large number of COVID-19 cases has disrupted the healthcare
 system in many countries and resulted in a shortage of bed spaces in the hospitals. Consequently,
 predicting the number of COVID-19 cases is imperative for governments to take appropriate actions.
 The number of COVID-19 cases can be accurately predicted by considering historical data of reported
 cases alongside some external factors that affect the spread of the virus. In the literature, most of the
 existing prediction methods focus only on the historical data and overlook most of the external factors.
 Hence, the number of COVID-19 cases is inaccurately predicted. Therefore, the main objective of this
 study is to simultaneously consider historical data and the external factors. This can be accomplished
 by adopting data analytics, which include developing a nonlinear autoregressive exogenous input
 (NARX) neural network-based algorithm. The viability and superiority of the developed algorithm
 are demonstrated by conducting experiments using data collected for top five affected countries in
 each continent. The results show an improved accuracy when compared with existing methods.
 Moreover, the experiments are extended to make future prediction for the number of patients afflicted
 with COVID-19 during the period from August 2020 until September 2020. By using such predictions,
 both the government and people in the affected countries can take appropriate measures to resume
 pre-epidemic activities.

 Keywords: COVID-19; pandemic; data analytics; neural network

1. Introduction
      By January 2020, the COVID-19 outbreak that originated in China has spread globally, with the number
of infected persons rising to 6,479,495 and a fatality of about 383,015 persons (https://www.worldometers.info/
coronavirus. Last accessed 3 June 2020). With the global spread of this infectious disease, the World Health
Organization (WHO) designated it as a pandemic. Besides the personal tragedies and casualties brought by
this pandemic, the economic implications of this pandemic are significant. Most of the affected countries
locked their borders and ordered closure of factories, restaurants, big malls, and clubs. Consequently,
the world is suffering from an economic recession as the global economic losses are estimated to approach
USD 23 trillion (the Economist, “Covid carnage,” 21 March 2020). This dire situation motivates researchers
to conduct research on COVID-19 focusing on two main areas: medicine and engineering.

Int. J. Environ. Res. Public Health 2020, 17, 7080; doi:10.3390/ijerph17197080     www.mdpi.com/journal/ijerph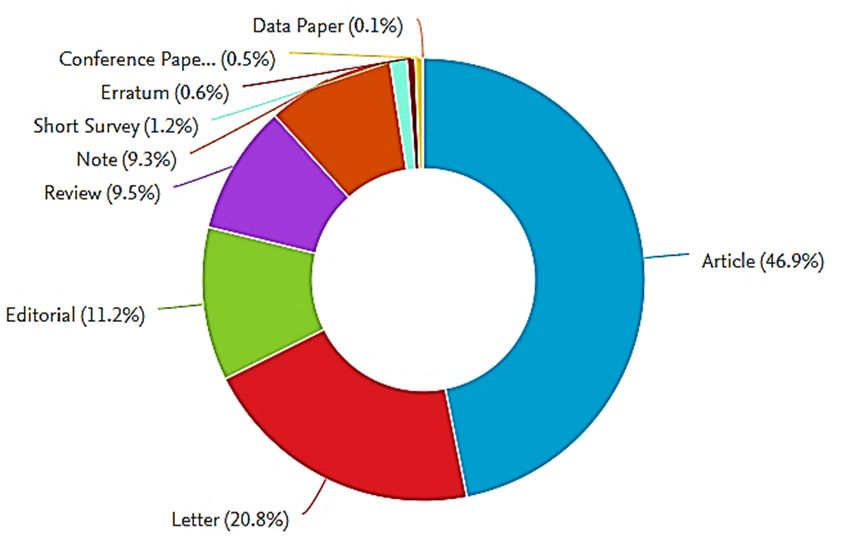
Int. J. Environ. Res. Public Health 2020, 17, 7080                                                     2 of 25

      In the area of medicine, most of research has focused on understanding the symptoms of
COVID-19 [1], characterizing it [2], and finally estimating its incubation periods [3]. Literature survey
shows that the incubation period of the viral infection ranges from 4 to 14 days and many patients are
asymptomatic [4]. This disease has a high infection rate; thus, it is very important to accurately predict
and estimate the number of people affected by COVID-19. This motivates researchers to focus on
another research area, the engineering aspect. This area is concerned with the prediction of COVID-19
cases. In the literature, there are two main methods used for prediction. The first method is the
statistical and mathematical modeling, whereas second method is data analytics.
      As for statistical methods, they have been applied to predict the COVID-19 cases in different
countries like Italy [5,6], Iran [7,8], Spain and France [9]. Beside the statistical methods, the mathematical
modeling and simulation have been utilized to predict the new COVID-19 cases in China [10] and
Saudi Arabia [11]. Moreover, Papastefanopoulos et al. [12] have compared the accuracy of six
time-series forecasting approaches, namely, ARIMA, Holt–Winters additive model (HWAAS), TBAT,
Facebook’s Prophet, DeepAR, and N-Beats, in predicting the progression of COVID-19. Similarly,
Hernandez-Matamoros et al. [13] have developed an ARIMA model to predict the spread of the
virus, while considering some factors like the population and the number of infected cases. There are
other studies that focus on collecting and analyzing posts related to COVID-19 from social media
sites [14–16]. This is because the keyword search trends related to COVID-19 on search engines
proved to be tremendously helpful in predicting and monitoring the spread of the virus outbreak.
Although statistical and mathematical modeling and simulation have been widely adopted, they cannot
consider a massive amount of data. Hence, the number of COVID-19 cases is poorly predicted.
This drawback can be avoided by using the data analytics method.
      Indeed, data analytics has infrequently been applied to the study of COVID-19, as few studies
have been reported in the literature. For example, Chen et al. [17] have utilized data analytics to predict
the number of COVID-19 cases to avoid overwhelming hospital capacity in Taiwan. Zhou et al. [18]
have coupled Geographic information system (GIS) and data analytics together to identify the infection
network of COVID-19. Additionally, machine learning and artificial intelligence tools have been
utilized to develop COVID-19 prediction approaches. Wieczorek et al. [19] have developed a forecasting
model for COVID-19 new cases based on the deep architecture of Neural Network using NAdam
training model. Pinter et al. [20] have developed a hybrid machine learning approach to forecast
COVID-19 cases in Hungary. For extensive study and more details about the forecasting approaches
for COVID-19, the interested readers are referred to the work by Bragazzi et al. [21] who review the
potentials of applying artificial intelligent and big data based approaches in predicting and managing
the COVID-19 Pandemic outbreak. The pitfall of the previous studies is that they have focused on
historical data of confirmed COVID-19 cases, while some studies have considered some factors like
temperature and patient sex. Indeed, many other important external factors that affect the spread of
the disease have been completely ignored. These important factors include population, median age
index, public and private healthcare expenditure, air quality as a CO2 trend, seasonality as month of
data collection, number of arrivals in the country/territory, and education index. This results in an
inaccurate prediction of the number of COVID-19 cases.
      The drawback in the previous studies has motivated us to conduct this study with the objective
of predicting the number of COVID-19 cases while simultaneously considering the historical data of
patients with COVID-19, and most of the external factors that affect the spread of the virus. To consider
these massive data, data analytics has been utilized to develop a nonlinear autoregressive exogenous
input (NARX) neural network-based algorithm. To demonstrate the efficiency of the developed
algorithm, experiments have been conducted to predict the number of COVID-19 cases in top five
affected countries in each continent.
      The remainder of the study is organized as follows. In Section 2, we briefly present the literature
review, whereas the research gap and contribution are presented in Section 3. The main procedure
Int. J. Environ. Res. Public Health 2020, 17, 7080 3 of 25
of the NARX neural network-based algorithm is described in Section 4. Sections 5 and 6 present the
results of the experiments and conclusions of the study, respectively.
Int. J. Environ. Res. Public Health 2020, 17, x 3 of 26
2. Literature Review
2. Literature Review
2.1. Bibliographic Summary for COVID-19
2.1. Bibliographic
Before investigatingSummary for COVID-19
the literature on COVID-19, we conducted a brief bibliographic search about
COVID-19 for twoinvestigating
Before purposes. Firstly, to find on
the literature outCOVID-19,
the number weofconducted
research works
a brief published on search
bibliographic COVID-19
about COVID-19 for two purposes. Firstly, to find out the number of research
and secondly, to identify the different research areas focusing on COVID-19. For those purposes, works published on
COVID-19 and secondly, to identify the different research areas focusing on
we used some keywords like COVID-19, novel coronavirus, and Hubei pneumonia. It was found that COVID-19. For those
purposes, we used some keywords like COVID-19, novel coronavirus, and Hubei pneumonia. It was
more than 8000 research documents have been published on this topic. Figure 1 shows the different
found that more than 8000 research documents have been published on this topic. Figure 1 shows the
types ofdifferent
research documents published on COVID-19. By looking at Figure 1, it can be observed that
types of research documents published on COVID-19. By looking at Figure 1, it can be
the vastobserved
majority thatofthe
published works
vast majority are in the
of published form
works areofinjournal
the formarticles, whereas
of journal a small anumber
articles, whereas small of
research
number of research works have appeared as conference papers. This is because most conferences been
works have appeared as conference papers. This is because most conferences have
canceled due
have to the
been outbreak
canceled due toofthe
theoutbreak
COVID-19of thepandemic
COVID-19[22]. pandemic [22].
FigureFigure 1. Types
1. Types of documents
of documents published
published ononCOVID-19
COVID-19 disease
disease(from Scopus
(from Database).
Scopus Database).
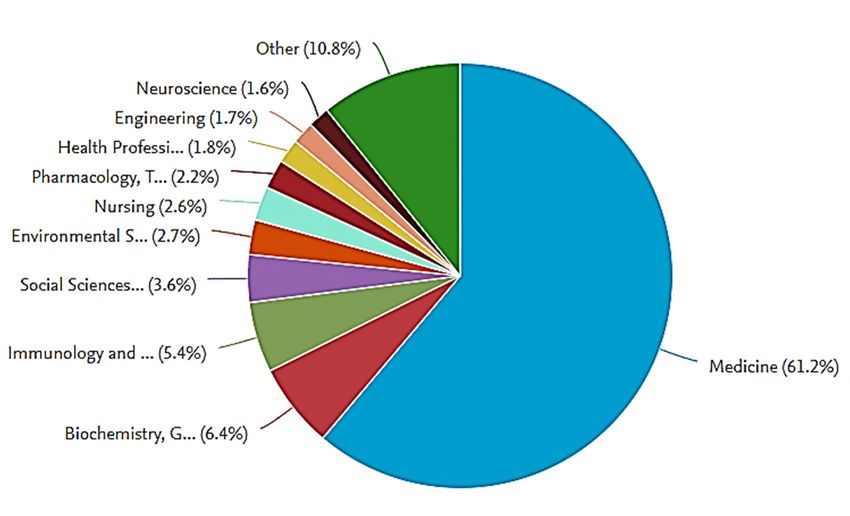
Bibliographic search is then continued to identify the different research areas focusing on
Bibliographic search is then continued to identify the different research areas focusing on COVID-19.
COVID-19. The findings are presented as a pie chart in Figure 2. As COVID-19 is a novel disease, it
The findings are presented as a pie chart in Figure 2. As COVID-19 is a novel disease, it is noticed
is noticed that the majority of these research works (around 61%) has focused on medicine, whereas
that thethe
majority
rest areof these research
distributed works
in different (around
areas, 61%) has focused
like biochemistry, on medicine,
social sciences, whereas the
and engineering. rest are
These
distributed in different areas, like biochemistry,
research areas are discussed in the next section.social sciences, and engineering. These research areas
are discussed in the next section.
2.2. COVID-19 Related Works
In this section, we discuss the different research areas that have considered COVID-19, including
medicine and engineering.
In the field of medicine, most of the early research on COVID-19 is focused on understanding
the symptoms of the disease [1], characterizing it [2], and finally estimating its incubation periods [3].
In addition, Wang et al. [23] have reported that the elderly are more likely to die from COVID-19,
because of their underlying comorbidities [24]. However, the virus attacks not only the elder people but
also children [25]. This means that everybody can be infected by COVID-19. Moreover, Zhuang et al. [8]
have showed that people infected with COVID-19 are asymptomatic in many cases.Int. J. Environ.
Int. J. Environ. Res. Public
Res. Public HealthHealth
2020,2020,
17, 17,
7080x 4 of 26 4 of 25
Figure 2. Classifications of COVID-19 publications based on the subject area (Scopus database).
Figure 2. Classifications of COVID-19 publications based on the subject area (Scopus database).
COVID-19 has a long incubation period of 4 to 14 days, and in many cases, patients are
2.2. COVID-19 Related Works
asymptomatic [4]; thus, it has a high infection rate. Therefore, it is of great importance to predict
In this section, we discuss the different research areas that have considered COVID-19, including
and estimate the number of people affected by COVID-19. This motivates researchers to focus on
medicine and engineering.
the engineering aspect of this disease, that is, the prediction of COVID-19 cases. Usually, prediction
In the field of medicine, most of the early research on COVID-19 is focused on understanding
can betheconducted
symptomsusing of the traditional statistical methods.
disease [1], characterizing it [2], andFor example,
finally Remuzzi
estimating and Remuzzi
its incubation periods [3]. [5] and
Tuite etInal. [6] have utilized the statistical methods to predict the number of
addition, Wang et al. [23] have reported that the elderly are more likely to die from COVID-19, COVID-19 cases in Italy.
Similarly, the number
because of COVID-19
of their underlying cases has[24].
comorbidities been predicted
However, in different
the virus attacks countries/territories
not only the elder people such as,
but also
Iran [7,8], Spain,children [25]. This
and France [9].means that everybody can be infected by COVID-19. Moreover, Zhuang
et al. [8]
Beside thehave showed methods
statistical that peopleasinfected
mentioned with COVID-19
above, the aremathematical
asymptomatic modeling
in many cases.and simulation
COVID-19 has a long incubation period of 4 to 14 days, and in many cases, patients are
including Logistic Growth and Susceptible-Infected-Recovered (SIR-model) have been utilized to predict
asymptomatic [4]; thus, it has a high infection rate. Therefore, it is of great importance to predict and
the new COVID-19 cases in China [10] and Saudi Arabia [11]. Moreover, Papastefanopoulos et al. [12]
estimate the number of people affected by COVID-19. This motivates researchers to focus on the
have investigated
engineering aspect and of compared
this disease, the accuracy
that of six time-series
is, the prediction of COVID-19forecasting
cases. Usually, approaches,
prediction can namely,
ARIMA, Holt–Winters additive model (HWAAS), TBAT, Facebook’s Prophet,
be conducted using traditional statistical methods. For example, Remuzzi and Remuzzi [5] and Tuite DeepAR, and N-Beats, in
predicting
et al. the progression
[6] have of COVID-19.
utilized the In a similar
statistical methods work,
to predict the Hernandez-Matamoros
number of COVID-19 cases et in
al.Italy.
[13] have
Similarly,
developed an ARIMAthe number
model ofto
COVID-19
predict the cases has been
spread of thepredicted
virus. The in different
developed countries/territories
model consists of such
ARIMA
as, Iran [7,8], Spain, and France [9].
parameters, including the population of the country, the number of infected cases, and polynomial
functions. Beside
Ivorratheetstatistical
al. [26] methods as mentioned
have proposed a new above, the mathematical
mathematical model modeling and simulation
for predicting the spread
including Logistic Growth and Susceptible-Infected-Recovered (SIR-model) have been utilized to
COVID-19 outbreak in China. The proposed model, θ-SEIHRD model, considers a fraction θ of
predict the new COVID-19 cases in China [10] and Saudi Arabia [11]. Moreover, Papastefanopoulos
detected cases over the realized total infected cases.
et al. [12] have investigated and compared the accuracy of six time-series forecasting approaches,
There
namely, areARIMA,
other studies that focus
Holt–Winters on model
additive collecting and analyzing
(HWAAS), posts related
TBAT, Facebook’s Prophet,toDeepAR,
COVID-19 and from
social media
N-Beats, sites. This is because
in predicting keyword
the progression ofsearch trends
COVID-19. In related
a similartowork,
COVID-19 on search engines
Hernandez-Matamoros proved
et al.
tremendously
[13] havehelpful
developed in predicting
an ARIMA and model monitoring
to predict thethespread
spreadofofthe thevirus.
virusThe outbreak.
developed Qin et al. [14]
model
consists
developed a of ARIMA parameters,
prediction techniqueincluding
based the on population
the lagged of the country,
series the number
of social media of infected cases,
search indexes to
and polynomial functions. Ivorra et al. [26] have proposed a new mathematical
forecast the number of new suspected COVID-19 cases. The considered social media search indexes model for predicting
the spread COVID-19 outbreak in China. The proposed model, θ-SEIHRD model, considers a fraction
include common COVID-19 symptoms such as dry cough, fever, pneumonia, etc. In another study
θ of detected cases over the realized total infected cases.
by Li et al.There
[15], are
theother
dailystudies
trendthatdata related to specific keyword search such as “coronavirus” and
focus on collecting and analyzing posts related to COVID-19 from
“pneumonia”, has been acquired from
social media sites. This is because keyword Googlesearch
Trends, Baidu
trends Index,
related and SinaonWeibo
to COVID-19 search Index
enginessearch
engines to investigate
proved tremendously andhelpful
monitor new COVID-19
in predicting cases. the
and monitoring Li spread
et al. [16]
of thehave
viruscollected
outbreak.data
Qin eton the
posts related to COVID-19 that are posted by Chinese users on Weibo using an automated Python
programming script. The collected data have been analyzed quantitatively and qualitatively in order
to recognize trends and characterize key themes. Other applications using social media to predict
COVID-19 cases have been reported by Shen et al. [27] and Ayyoubzadeh et al. [28]Int. J. Environ. Res. Public Health 2020, 17, 7080 5 of 25
The major drawback of statistical methods and mathematical modeling is their inability to consider
massive amounts of data. This leads to poor prediction of the number of COVID-19 cases. This drawback
can be avoided by using data analytics, which is explained in the next section.
2.3. Data Analytics
Data analytics is one of the efficient tools in discovering the relationships, trends, and other useful
information existing in a body of data. The number of data analytics tools is large. Among these
tools, the neural network is one of the most efficient tools in uncovering the relationship between an
output (i.e., response) and multiple inputs (i.e., indicators) [29,30]. This efficiency has been applied in
handling different applications, including stock price forecasting in the financial industry [31], flight
delay prediction in aviation industry [32–34], organ prediction in healthcare sector [35], and demand
forecasting in the railway industry [36].
These previous studies reveal the importance of data analytics for prediction purposes.
This motivates researchers to adopt data analytics in the domain of COVID-19. For example,
Chen et al. [17] utilized data analytics to predict the number of COVID-19 cases to avoid overwhelming
hospital capacity in Taiwan. The pitfall of this research work is that it has only focused on historical
data of the number of COVID-19 cases while considering a limited number of factors, like travel and
occupation. Another research work by Zhou et al. [18] coupled Geographic information system (GIS)
and data analytics together to identify the infection network of COVID-19. Additionally, machine
learning and artificial intelligence tools have been utilized by many studies to develop COVID-19
prediction approaches. Wieczorek et al. [19] have developed a forecasting model for COVID-19 new
cases based on the deep architecture of Neural Network using NAdam training model. However,
the pitfall of this study is the focus on one dataset, called total number of confirmed COVID-19 cases,
while overlooking many other factors. Magesh et al. [37] have proposed an AI-based algorithm for
predicting COVID-19 cases using a hybrid Recurrent Neural Network (RNN) with a Long Short-Term
Memory (LSTM) model. The authors have conducted their experiments while considering some
demographic factors like sex, age, and temperature. Indeed, many other social factors were not
considered in their model. Pinter et al. [20] have developed a hybrid machine learning approach
to forecast COVID-19 cases in Hungary. The proposed hybrid approach encompasses the adaptive
network-based fuzzy inference system and multi-layered perceptron-imperialist competitive algorithm.
A machine learning-based approach for predicting COVID-19 new cases has been proposed in the
study by Tuli et al. [38], who have used an iterative weighting for fitting Generalized Inverse Weibull
distribution. For extensive study and more details about the forecasting approaches for COVID-19,
the interested readers are referred to the work by Bragazzi et al. [21] who have reviewed the potentials of
applying artificial intelligent and big data based approaches in predicting and managing the COVID-19
Pandemic outbreak. These previous studies show successful application of data analytics in multiple
areas. Therefore, it is reasonable to use data analytics in this study.
From the above, it is clear that most of the data analytics studies have focused on historical data
of confirmed COVID-19 cases, while some studies have considered some factors like temperature and
patient sex. Indeed, many other important external factors that affect the spread of the disease have
been completely ignored. These important factors include population, median age index, public and
private healthcare expenditure, air quality as a CO2 trend, seasonality as month of data collection,
number of arrivals in the country/territory, and education index. This results in a poor prediction of
the number of COVID-19 cases.
3. Research Gaps and Contribution
A thorough examination of the literature reveals some observations, which can be outlined as
follows. First, there is no previous study that simultaneously considers the historical data of the
number of COVID-19 cases and most of the external factors that affect the spread of the virus. Secondly,
there is no research work that provides future prediction of the number of COVID-19 cases usingInt. J. Environ. Res. Public Health 2020, 17, 7080 6 of 25
data analytics techniques. Therefore, efforts of the government to improve the healthcare system in
the affected countries are greatly hampered. Consequently, in this research work, we have tried to
fill this gap by proposing a data analytics algorithm, in which all the aforementioned features can be
simultaneously considered.
This paper has the following contributions. Firstly, in contrast to the existing approach [17,18],
which only focuses on the historical data of persons infected with COVID-19, we propose a more
robust approach. Our approach simultaneously considers the historical data of COVID-19 cases
alongside most of the external factors that affect the spread of the disease. These external factors include
population, median age index, public and private healthcare expenditure, air quality as a CO2 trend,
seasonality as month of data collection, number of arrivals in the country/territory, and education index.
To consider all those massive number of factors, we develop a nonlinear autoregressive exogenous
input (NARX) neural network-based algorithm. This algorithm is developed because it is the most
appropriate one to handle time-based factors, like the number of COVID-19 cases. Moreover, NARX
algorithms have been successfully applied in different research areas, as shown in Section 2.3.
Second, instead of predicting the number of COVID-19 cases in one or two countries [7–9], we use
our algorithm to predict the number of COVID-19 in multiple countries, including top five affected
countries in each continent. This is fruitful as it gives wide information about the spread of COVID-19
in different parts of the world.
Lastly, it has been observed in the literature that most research papers have not provided future
prediction of the number of COVID-19 cases. As opposed to these previous research papers, we use
the trained data produced from our algorithm to make future prediction of the number of COVID-19
cases. By using such predictions, both the government and people in the affected countries can take
appropriate measures to resume pre-epidemic activities.
4. Data Analytics for Predicting New Daily Cases of COVID-19
In this section, we present how data analytics can be used in predicting the new daily cases of
COVID-19. Instead of using the traditional approaches, which either focus on historical data or assume
a normal distribution for the number of daily cases, we use a data analytics approach. In particular,
this approach has the ability to consider a massive amount of data, including historical data of daily
cases besides other external factors. The proposed methodology includes a nonlinear autoregressive
exogenous input (NARX) neural network-based algorithm. The main steps of this algorithm are
presented as follows:
Step 1: Collecting the data. The data have been collected from online websites, including
“Worldometers” [39], “Our World in Data” [40], “World Bank Open Data” [41], and the
official website of the World Health Organization (WHO). Besides, human development
reports have been used to pick other kind of information, like median age and education
index [42]. The scope of this study includes collecting data for about 189 countries/territories
by focusing on two types of data: main data and other external factors. The main data include
considering the number of confirmed coronavirus disease cases/day, the number of deaths
due to coronavirus disease/day, and the total number of confirmed cases [39,40]. The external
factors, on the other hand, include considering the factors that affect the spread of coronavirus
disease. Note that the data have been collected for about 224 days, from 31 December 2019
until 10 August 2020. This leads naturally to set the size of data at 224.
Step 2: Preprocessing the data. While collecting the data, it was observed that data were not
always available for the whole 189 countries/territories. To alleviate this situation, a
refinement was performed by ruling out any countries/territories that suffer from data
unavailability. This results in cancelling around 39 countries/territories, so that only 150
countries/territories have been considered. Our preliminary goal is to predict the new cases
for all 150 countries/territories. However, this is not reasonable for two reasons. Firstly, it
is not possible to present all the results in a single study due to page limitation. Secondly,Int. J. Environ. Res. Public Health 2020, 17, 7080 7 of 25
it is computationally expensive to run this algorithm for 150 countries/territories. For the
above reasons, we have limited our scope to considering the most affected countries in each
continent. By doing so, the top five affected countries/territories have been considered from
each continent. More details are presented in Section 5.
Step 3: Identifying the input sets. These sets contain historical data of some information alongside the
external factors. These sets can be outlined as follows:
i. Main set, which includes two main information: the number of deaths due to
coronavirus disease/day and the total number of confirmed cases;
ii. External factor set that comprises the factors that affect the spread of coronavirus
including population [42], median age index [41], public and private healthcare
expenditure [41], air quality as a CO2 trend [42], number of arrivals in the
countries/territories [41], and education index [42]. There is another factor that should
be considered, called seasonality. Before incorporating this factor in the model, it
should be clarified here that, in most countries, we can find cities with different seasons.
For example, Iran has four seasons in its different cities [43]. Other examples include
USA, China, Saudi Arabia, and Egypt. This observation indicates that, to consider
the seasonality using seasons as a factor, the cities should be the scope of the study.
Since the scope of this study is not cities but the countries, seasonality factor using
seasons themselves cannot be considered in our algorithm. To find a compromise for
this situation, the month of collecting data is selected to capture the seasonality in the
proposed algorithm. It should be noted that the main data for the daily COVID-19
cases have been collected from the website “Our World in Data”, corrected through the
website “Worldometers”. Next, the data have been doublechecked and refined by the
data from the official website of WHO. In addition, because the considerable predictors
are diverted, and they are not available on one database, their data have been collected
from several websites. In further details, the data that have been collected from the
website “World Bank Open Data” are the median age, number of arrivals, and health
expenditure as a percentage of GDP [41], while the education index has been collected
from United Nations Development Programme [42].
Step 4: Test of hypothesis using regression analysis. Since our study goal is to accurately predict the
number of COVID-19 cases, we should focus on the most influential external factors. To do
so, test of hypotheses using regression analysis should be conducted for each external factor.
These hypotheses can be outlined as follows:
Hypothesis # 1. H0 : The population has not a significant effect on the COVID-19 spread. H1 : The population
has a significant effect on the COVID-19 spread.
Hypothesis # 2. H0 : The median age index does not have a significant effect on the COVID-19 spread. H1 :
The median age index has a significant effect on the COVID-19 spread.
Hypothesis # 3. H0 : The public healthcare expenditure does not have a significant effect on the COVID-19
spread. H1 : The public healthcare expenditure has a significant effect on the COVID-19 spread.
Hypothesis # 4. H0 : The private healthcare expenditure does not have a significant effect on the COVID-19
spread. H1 : The private healthcare expenditure has a significant effect on the COVID-19 spread.
Hypothesis # 5. H0 : The air quality as a CO2 trend does not have a significant effect on the COVID-19 spread.
H1 : The air quality as a CO2 trend has a significant effect on the COVID-19 spread.Int. J. Environ. Res. Public Health 2020, 17, 7080 8 of 25
Hypothesis # 6. H0 : The number of arrivals in the countries/territories does not have a significant effect on
the COVID-19 spread. H1 : The number of arrivals in the countries/territories has a significant effect on the
COVID-19 spread.
Hypothesis # 7. H0 : The education index does not have a significant effect on the COVID-19 spread. H1 :
The education index has a significant effect on the COVID-19 spread.
Hypothesis # 8. H0 : The seasonality as month of collecting data does not have a significant effect on
the COVID-19 spread. H1 : The seasonality as month of collecting data has a significant effect on the
COVID-19 spread.
After outlining the test of hypothesis, the regression analysis has been conducted, in which the
p-value is calculated. If the p-value < 0.05, which is the significance level in this study, we reject the
null hypothesis H0 and go in favor of the alternative hypothesis H1 . If p-value ≥ 0.05, we cannot reject
the null hypothesis H0 . By doing so, the significant factors have been picked, including all the previous
external factors except public health expenditure and air quality as a CO2 trend. More details about
test of hypothesis using regression analysis are shown in Section 5.1.
Step 5: Designing the neural network structure. We have utilized the feedforward time-delay neural
network as this structure has been commonly used in the literature due to its efficiency [44].
This network is composed of three main layers: input, hidden, and output. Regarding the
activation function, the sigmoid function has been selected because it is efficient in reflecting
the non-linear relationship among multiple factors.
Step 6: Training the neural network. To achieve this goal, the supervised learning method has been
adopted. In this method, 70% of the data have been used for training purposes, whereas the
rest have been reserved for validation and testing purposes.
Step 7: Predicting new cases of COVID-19. The trained data, known as the output of the network,
have been used to predict the new cases of COVID-19 in the period from August 2020 until
September 2020.
Figure 3 represents diagrammatically the structure of the neural network. It should be noted
that neural network is a common artificial intelligence technique. Indeed, this technique uses the
idea of information flow between brain neurons, which is represented as a network via arrows
and nodes. Arrows represent the input details and the output information, whereas nodes stand for
the neurons. Usually, the nodes or neurons receive the input data, then analyze it to give suitable
outputs. This straightforward movement of data from several input points is the simplest way to
obtain an output. Such network structure is called feedforward neural network (FF), which has been
used in our algorithm. Usually, feedforward neural network is either single layer feedforward neural
network, as shown in the left-hand side of Figure 3, or multiple layers feedforward neural network, as
shown in the right-hand side of Figure 3. In multiple layers feedforward neural network, the input
layer is indirectly connected with the output layer by means of hidden layers (i.e., each layer in the
network is in connection with the next layer). In particular, the input is connected to the first hidden
layer, and this layer is connected to the next hidden layer. These connections move forward in this
sequence until reaching to the output layer.
As mentioned earlier, the neural network structure adopted in this research is feedforward neural
network with multiple layers. The type of the neural network is NARX neural network. The analysis
of this network is based on the time-series modeling [45]. This means that it uses data obtained at
successive times in the past in order to predict data in the future. Therefore, it is commonly used as
a predicting tool in different fields, such as predicting the solar radiations per day [46], predictingInt. J. Environ. Res. Public Health 2020, 17, 7080 9 of 25
electricity price of day-ahead [47], and the prediction of bearing life [48]. As any neural network, input
data are processed in the NARX neural network through the nodes using the following function:
a(t) = f (a(t − 1), a(t − 2), . . . ., a(t − na ), b(t − 1). b(t − 2), . . . , b(t − nb )) (1)
where a(t) is the output of the NARX neural network at time t. On the other hand, the values
a(t − 1), a(t − 2), . . . ., a(t − n) are the outputs of the NARX neural network in the past, whereas na is
the number of delays in the output. The values b(t − 1). b(t − 2), . . . , b(t − nb ) are the inputs of NARX
neural network, and nb is the delay in the inputs. From this equation, it is clear that, in order to get an
output a(t) at time t, not only the input data is used but also the output data of the past should be
used as well. For example, in order to predict the number of COVID-19 tomorrow a(t), the input data
b(tInt.
− 1J.)Environ.
. b(t − Res. . . . , Health
2), Public b(t − 2020, 17, xused. Besides, the predicted data of today and the past few
nb ) are 9 ofdays
26
a(t − 1), a(t − 2), . . . ., a(t − na ) will be used as well.
Input Layer Hidden Layers Output Layer
Input Layer Output Layer
Single layer Multiple layers
Figure 3. Structure of neural network.
As mentioned earlier, the neural network structure adopted in this research is feedforward
After presenting the algorithm, some questions might be asked. One of these questions is “is
neural network with multiple layers. The type of the neural network is NARX neural network. The
seasonality
analysis ofa this
factor that might
network haveonanthe
is based impact on themodeling
time-series results?”.[45].
Before
Thisanswering
means thatthis question,
it uses data it
should be clarified here that, in most countries, we can find cities with different
obtained at successive times in the past in order to predict data in the future. Therefore, it is seasons. For example,
Iran has fourused
commonly seasons in its different
as a predicting cities
tool in [43]. fields,
different Othersuchexamples includethe
as predicting USA,
solarChina, Saudi
radiations perArabia,
day
and[46], predicting electricity price of day-ahead [47], and the prediction of bearing life [48]. As any be
Egypt. This observation indicates that, to consider the seasonality as a factor, the cities should
theneural
scopenetwork,
of the study.
inputSince
data the
are scope of this
processed study
in the NARX is not citiesnetwork
neural but countries,
through wethehave considered
nodes using thethe
month of data
following collection as a measure of seasonality to overcome the above situation.
function:
The proposed algorithm deals with variable population size, meaning that countries with higher
( )= ( − 1), ( − 2), … . , ( − ), ( − 1). ( − 2), … , ( − ) (1)
population size impact more on the algorithm than lower population size countries, which can induce
a high
where ( ) is the
uncertainty in output
the predictions.
of the NARX The question here is “How
neural network at timethis fluctuation
. On the otherwas accounted
hand, for in
the values
the (algorithm?”
− 1), ( − 2), … . , (to−avoid
Indeed, ) arethe
thehigh
outputs of the NARX
fluctuation in theneural networkthe
predictions, in the
bestpast, whereassetting
parameter
foristhe
thealgorithm
number ofshoulddelaysbe inused,
the output. The valuesthe (proposed
while adopting − 1). ( algorithm
− 2), … , ( in−prediction
) are the[49].
inputs
Forofthis
NARX neural
purpose, network,
the Taguchi and hasisbeen
method the delay in the
adopted, asinputs.
shownFrom this equation,
in Section 5.2. it is clear that, in order
to get an output ( ) at time , not only the input data is used but also the output data of the past
5. should
Experiments
be usedand Results
as well. For example, in order to predict the number of COVID-19 tomorrow ( ),
the input data ( − 1). ( − 2), … , ( − ) are used. Besides, the predicted data of today and the
After presenting the NARX neural network-based algorithm that helps in predicting the new
past few days ( − 1), ( − 2), … . , ( − ) will be used as well.
cases of COVID-19, it is necessary to present the effectiveness of the algorithm. For this purpose, some
After presenting the algorithm, some questions might be asked. One of these questions is “is
experiments are conducted while considering the top five affected countries from each continent, as
seasonality a factor that might have an impact on the results?”. Before answering this question, it
shown
shouldin be
Table 1. Note
clarified herethat
that,the
in experiments
most countries, of we
thiscan
case
findstudy
citieshave
withbeen performed
different seasons.using an Intel i5
For example,
CPU and 2.52 GHz clock speed laptop. The memory is 8 GB RAM and runs the
Iran has four seasons in its different cities [43]. Other examples include USA, China, Saudi Arabia, Windows 10 software.
and Egypt. This observation indicates that, to consider the seasonality as a factor, the cities should be
the scope of the study. Since the scope of this study is not cities but countries, we have considered
the month of data collection as a measure of seasonality to overcome the above situation.
The proposed algorithm deals with variable population size, meaning that countries with higher
population size impact more on the algorithm than lower population size countries, which can induce
a high uncertainty in the predictions. The question here is “How this fluctuation was accounted for
in the algorithm?” Indeed, to avoid the high fluctuation in the predictions, the best parameter settingInt. J. Environ. Res. Public Health 2020, 17, 7080 10 of 25
In addition, the algorithm is coded in MATLAB2019a. The results of experiments are presented in the
following subsections.
Table 1. Top five affected countries in each continent.
Continent Country
Europe Spain, Italy, UK, Russia, and France
North and South America USA, Brazil, Canada, Peru, and Ecuador
Asia Turkey, Iran, China, India, and Saudi Arabia
Africa Egypt, South Africa, Morocco, Algeria, and Nigeria
5.1. Test of Hypothesis Using Regression Analysis
Before conducting the experiments of this study, we have collected the external factors that seems
to affect the spread of coronavirus. These factors include population, median age index, public and
private healthcare expenditure, air quality as a CO2 trend, seasonality as month of data collection,
number of arrivals in the countries/territories, education index, and the month of collecting data.
Since our study goal is to accurately predict the number of COVID-19 cases, only the most influential
external factors should be considered. Towards this goal, the test of hypothesis using regression
analysis has been adopted using Minitab software [32,50], in which the number of COVID-19 cases
and their related external factors have been collected for about 160 countries/territories. Note that the
regression analysis has been conducted with a significance level of 5% [32]. The results of hypothesis
test are summarized in Table 2.
Table 2. Results of regression analysis.
Hypothesis p Value Decision Interpretation
Hypothesis # 1: population 0.000 Reject H0 and pick H1 Population is significant
Hypothesis # 2: median age index 0.041 Reject H0 and pick H1 Median age index is significant
Hypothesis # 3: public healthcare Cannot Reject H0 and Public healthcare expenditure
0.523
expenditure reject H1 is not significant
Hypothesis # 4: private Private healthcare expenditure
0.000 Reject H0 and pick H1
healthcare expenditure is significant
Hypothesis # 5: air quality as a Cannot Reject H0 and Air quality as a CO2 trend is
0.476
CO2 trend reject H1 not significant
Hypothesis # 6: number of Number of arrivals in the
arrivals in the 0.000 Reject H0 and pick H1 countries/territories is
countries/territories significant
Hypothesis # 7: education index 0.047 Reject H0 and pick H1 Education index is significant
Hypothesis # 8: seasonality as Seasonality as month of
0.000 Reject H0 and pick H1
month of collecting data collecting data is significant
By looking at the results presented in Table 2, it is noticed null hypothesis H0 related to Hypotheses
# 1, 2, 4, 6, 7, and 8 is rejected, and the alternative hypothesis H1 is picked. This means that the
external factors like population, median age index, private healthcare expenditure, number of arrivals,
education index, and month of collecting data have a significant effect on the number of COVID-19
cases. This is because p-values of these factors, which appear in boldface, are lower than the significance
level, which is 5% in this study. In contrast, the null hypothesis H0 related to Hypotheses # 3 and 5
cannot be rejected, meaning that alternative hypothesis H1 is rejected. This indicates that external
factors like public healthcare expenditure and CO2 trend do not have significant effect on the number
of COVID-19 cases. Based on the above test of hypothesis, our experiments are further conducted
while considering only the significant external factors, meaning considering all the factors except
public healthcare expenditure and CO2 trend.Int. J. Environ. Res. Public Health 2020, 17, 7080 11 of 25
5.2. Parameter Settings of NARX Neural Network-Based Algorithm
After selecting the most influential factors, it is the time for conducting the prediction experiments.
However, before doing so, the best parameter setting of NARX neural network-based algorithm
should be determined. Towards this end, the most influential parameters are selected, and their
corresponding levels are determined [33,51,52], as shown in Table 3. To select the best parameter
settings, Taguchi method has been utilized as it is one of the effective tools in determining the
best parameter settings by applying an orthogonal array and signal-to-noise (S/N) ratios [49,51–53].
The orthogonal array approach can be defined as an economic approach that is commonly adopted
with an objective of minimizing the number of conducted experiments. The S/N ratio can be described
as a performance indicator that indicates the quality of each conducted experiment. Since our Taguchi
experiment includes four parameters with three levels, the orthogonal array L9 should be selected in
our experiments, which have been conducted using Minitab software.
Table 3. Levels for the NARX neural network- based algorithm.
Parameter Level 1 Level 2 Level 3
Learning rate 0.01 0.1 0.3
Momentum 0.1 0.3 0.5
Number of neurons in the first hidden layer N/2 = 112 N = 224 1.5 × N = 336
Number of neurons in the second hidden layer 0 N/2 = 112 N = 224
N : it equals the number of input data, which is 224 in this study.
Figure 4 illustrates the average S/N ratio of the selected parameter at each level, while using our
proposed algorithm. Since our algorithm aims at predicting the COVID-19 cases, the objective in
this study is to minimize the error between the predicted and real values. Based on this observation,
the parameter level should be selected based on the smaller is better criterion. This means that the
level with small average S/N ratio is better than the level with higher average S/N ratio. By applying
this criterion in Figure 4, the best level for the parameters 1, 2, 3, and 4 should be set at are levels 2, 3, 3,
2, respectively. These levels appear in a boldface in Table 3.
5.3. Performance of the NARX Neural Network-Based Algorithm
In this section, we report the performance of the NARX neural network-based algorithm. It should
be noted that the performance of the algorithm has been evaluated using a commonly used performance
indicator, called root mean square error (RMSE) [44]. The RMSE is used to reflect the error between real
and predicted values of COVID-19 cases. Besides, the correlation has been calculated to indicate the
closeness of the predicted data to observed data. To select the suitable correlation test, the normality of the
observed and predicted COVID-19 cases should be checked. By doing so, it has been noticed that both the
observed and predicted COVID-19 cases are not normally distributed. This observation naturally leads to
using Spearman correlation test [54–56]. To measure the model uncertainty, the error standard deviation
has been calculated [57]. Details of the results are presented in Table 4.
By looking at Table 4, it is noticed that the value of the RMSE is low in most African and Asian
countries. This is because the values of predicted and real cases are a bit low if compared with other
countries. It is also observed that that the value of the RMSE is a bit large in some countries like USA,
Spain, and China. For instance, RMSE = 420 while considering USA. At a first glance, an RMSE value
of 420 can give the impression of a large difference between predicted and real values, implying a
poor performance of the proposed algorithm. Indeed, 420 is not that big at all, because predicted or
real values reach up to 48,529. Thus, 420 is not a big figure if compared with 48,529, meaning that
the performance of the algorithm is still reasonable, while handling a large number of COVID-19
cases. To summarize, we can say that the proposed algorithm produces large RMSE when the real
and predicted values are large, and vice versa. This indicates the consistency and robustness of the
proposed algorithm.Int. J. Environ. Res. Public Health 2020, 17, 7080 12 of 25
Int. J. Environ. Res. Public Health 2020, 17, x 12 of 26
Figure 4. Main effect plot for S/N ratio while using the NARX neural network-based algorithm.
Figure 4. Main effect plot for S/N ratio while using the NARX neural network-based algorithm.
53. Performance of the NARX Neural Network-Based Algorithm
Table 4. Results of the NARX neural network-based algorithm.
In this section, we report the performance of the NARX neural network-based algorithm. It
should be noted that the performance of theNARX Neural
algorithm hasNetwork-Based Algorithm
been evaluated using a commonly used
performance
Continent indicator,
Country called root
Root mean
Mean square
Square error ( ) [44].
Spearman The
Correlation is used to reflect the
Error Standard
error between real and predicted values of COVID-19 cases. Besides, the correlation Deviation
Error (RMSE) has been
Correlation Factor p-Value
calculated to indicate the closeness of the predicted data to observed data. To select the suitable
correlation test, Spain
the normality of the300
observed and predicted0.9687
COVID-19 cases0.000 902.74
should be checked. By
Italy noticed that both
doing so, it has been 71 the observed and predicted
0.9725 COVID-190.000 215.38
cases are not normally
Europe
distributed. This UK 113 leads to using Spearman
observation naturally 0.9770 correlation test
0.000 343.13
[54–56]. To measure
Russia the error standard
the model uncertainty, 150 deviation has been 0.9748 0.000 of the results
calculated [57]. Details 420.57
are
France
presented in Table 4. 189 0.9753 0.000 587.11
USA 786 0.9882 0.000 23,792.25
North and Brazil 1146 0.9828 0.000 3463.52
South Canada 54 0. 9566 0.000 163.93
America Peru 148 0.9716 0.000 423.08
Ecuador 18 0.9712 0.000 57.03
Turkey 78 0.9753 0.000 251.77
Iran 56 0.9784 0.000 170.81
Asia China 14 0.9319 0.000 34.36
India 180 0.9946 0.000 550.63
Saudi
56 0.9720 0.000 171.79
Arabia
Egypt 20 0.9696 0.000 61.55
South
79 0.9847 0.000 241.57
Africa Africa
Morocco 28 0.9461 0.000 85.74
Algeria 7 0.9740 0.000 22.87
Nigeria 19 0.9695 0.000 57.61
Regarding the correlation, it is observed that the correlation factor is larger than 0.9 in all countries
with p-value of zero. This means a strong positive significant correlation between the observed and
predicted data, which indicates a closeness of the predicted data to the observed data. This reflects
the high accuracy of the proposed algorithm. By looking at the error standard deviation, it indicates
low error variability in countries characterized with low number of COVID-19 cases and vice versa.
This confirms the stability and reliability of the proposed algorithm.Int. J. Environ. Res. Public Health 2020, 17, 7080 13 of 25
5.4. Performance Analysis
After presenting the performance of the proposed algorithm, there is a question that might be
asked here, “what is the advantage of the proposed algorithm over the existing traditional method
in the literature?”. To answer this question, our experiments have been further extended to make a
comparison between our proposed algorithm and the traditional method that can be represented in the
study by Chen et al. [17]. Note, both studies have the same objective, which is predicting the number
of COVID-19 cases. However, both studies are different in their considered factors. The study by
Chen et al. [17] has only focused on historical data of the number of COVID-19 cases while considering
a limited number of factors, like travel and occupation. In contrast, our study has the same focus as the
study Chen et al. [17], besides, it has considered many external factors that overlooked in their study.
These factors include population, median age index, public healthcare expenditure, private healthcare
expenditure, air quality as a CO2 trend, education index, and seasonality as month of collecting data.
The experiment results obtained from both approaches are summarized in Table 5.
Table 5. Comparison of the results obtained from the NARX neural network-based algorithm and
traditional methods.
RMSE of NARX Neural RMSE of Traditional Improvement of NARX over
Continent Country
Network-Based Algorithm Methods Traditional Method (%)
Spain 300 49,492 99.39
Italy 71 257 72.38
Europe UK 113 988 88.56
Russia 150 371 59.59
France 189 1973 90.42
USA 786 15,840 95.04
Brazil 1146 3891 70.55
North and
Canada 54 162 66.64
South America
Peru 148 2229 93.36
Ecuador 18 777 97.68
Turkey 78 336 76.79
Iran 56 152 63.10
Asia China 14 334 95.81
India 180 615 70.73
Saudi Arabia 56 140 60.07
Egypt 20 32 37.07
South Africa 79 149 46.98
Africa Morocco 28 45 38.10
Algeria 7 12 39.78
Nigeria 19 27 28.76
Improvement (%) = (RMSETraditional − RMSENARX ) × 100/RMSETraditional [58].
By looking at Table 5, the results show that the NARX neural network-based algorithm is more
accurate than the traditional method. This outperformance is due to considering more factors that
affect the spread of COVID-19, such as the external factors like the population, the health expenditures,
and others. This results in an accurate prediction for the proposed algorithm. In contrast to the
proposed algorithm, the traditional method only focusses on the historical data and neglect many
external factors. Hence, some important factors that affect the spread of the virus are neglected, leading
finally to a poor prediction of the number of COVID-19 cases.
This section establishes that the proposed algorithm gives improved results when compared
with the traditional method. Thus, the significance of utilizing this algorithm in real practice is
further affirmed.
5.5. What Next in the Future?
So far, we have presented the performance of the proposed algorithm and its advantage over the
existing methods. It is fine, but still, there are some questions that have not been answered like “what
next in the future?”, “how can we benefit from the algorithm in predicting future cases of COVID-19?”,Int. J. Environ. Res. Public Health 2020, 17, 7080 14 of 25
“when will COIVD-19 end?”. Answering these questions necessitates extending our experiments, in
which we use the trained data to predict the number of future cases of COVID-19. In the experiments
of the previous sections, we observe that in the countries that control the spread of COVID-19, the peak
in the number of daily cases appeared after 3–4 months. This observation has been taken as a reference
to predict future COVID-19 cases in the countries where the disease is yet to peak. It is interesting to
recall that the future prediction has been done for about two months, in the period from August 2020
until September 2020. The results of these experiments are presented in Figures 5–8, which represent
the future
Int. predictions in Europe,
J. Environ. Res. Public Health 2020,North
17, x and South America, Asia, and Africa, respectively.
15 of 26
Spain
10,000
8,000
Number of cases
6,000
4,000
2,000
0
2019/12/31 2020/2/19 2020/4/9 2020/5/29 2020/7/18 2020/9/6 2020/10/26
Date
Observations Predictions Future Predictions
7,000
Italy
6,000
Number of cases
5,000
4,000
3,000
2,000
1,000
0
2019/12/31 2020/2/19 2020/4/9 2020/5/29 2020/7/18 2020/9/6 2020/10/26
Date
Observations Predictions Future predictions
U.K.
10,000
8,000
Number of cases
6,000
4,000
2,000
0
2019/12/31 2020/2/19 2020/4/9 2020/5/29 2020/7/18 2020/9/6 2020/10/26
Date
Observations Predictions Furutre predictions
Figure 5. Cont.Int. J. Environ. Res. Public Health 2020, 17, 7080 15 of 25
Int. J. Environ. Res. Public Health 2020, 17, x 16 of 26
Russia
14,000
12,000
Number of cases
10,000
8,000
6,000
4,000
2,000
0
2019/12/31 2020/2/19 2020/4/9 2020/5/29 2020/7/18 2020/9/6 2020/10/26
Date
Observations Predictions Furutre predictions
12,000 France
10,000
Number of cases
8,000
6,000
4,000
2,000
0
2019/12/31 2020/2/19 2020/4/9 2020/5/29 2020/7/18 2020/9/6 2020/10/26
Date
Observations Predictions Furutre predictions
Figure 5. Future prediction of COVID-19 cases in European countries.
countries.
After presenting the future prediction of COVID-19 cases in European countries, we have some
observations, which are outlined as follows:
• In most European countries, like Italy, UK, and Russia, the number of cases has already reached
its peak before our future prediction. Based on this observation, we predict that the number of
future COIVD-19 cases will decrease gradually during the period from August 2020 until
September 2020. It is worth to mention that our predicted reduction in the number of COVID-
19 cases appear during August 2020. The abovementioned reduction is because of strict
compliance with the precaution guidelines established by WHO.
• In contrast to most of European countries, the situation in Spain and France is quite similar, as
the number of cases has raised recently and formed another peak. In Spain, the second peak has
been already formed, therefore, our algorithm predicts a gradual decrease during the period
from August 2020 until September 2020. In France, the algorithm predicts a slight increase
followed by a gradual decrease in the number of cases during the same period.You can also read