Intercomparisons, error assessments, and technical information on historical upper-air measurements - ESSD
←
→
Page content transcription
If your browser does not render page correctly, please read the page content below
Earth Syst. Sci. Data, 13, 2471–2485, 2021
https://doi.org/10.5194/essd-13-2471-2021
© Author(s) 2021. This work is distributed under
the Creative Commons Attribution 4.0 License.

            Intercomparisons, error assessments, and technical
             information on historical upper-air measurements
       Noemi Imfeld1,2 , Leopold Haimberger3 , Alexander Sterin4 , Yuri Brugnara1,2 , and Stefan Brönnimann1,2
                    1 OeschgerCentre for Climate Change Research, University of Bern, Bern, Switzerland
                               2 Institute of Geography, University of Bern, Bern, Switzerland
                     3 Department of Meteorology and Geophysics, University of Vienna, Vienna, Austria
                 4 All-Russian Research Institute of Hydrometeorological Information – World Data Centre,

                                                 Obninsk, Russian Federation
                                 Correspondence: Noemi Imfeld (noemi.imfeld@giub.unibe.ch)

                                Received: 21 December 2020 – Discussion started: 15 January 2021
                             Revised: 26 April 2021 – Accepted: 28 April 2021 – Published: 3 June 2021

       Abstract. Upper-air data form the backbone of weather analysis and reanalysis products, particularly in the
       pre-satellite era. However, they are particularly prone to errors and uncertainties, especially data from the early
       days of aerology. Information that allows us to better characterize the errors of radiosonde data is important. This
       paper reports on an attempt to collect data from historical upper-air intercomparisons and from historical error
       assessments reaching back to the 1930s. The digitized numerical data will be made available through Copernicus
       Climate Change Services; here we publish the full information that includes images, literature, and other meta-
       data that may be relevant and can be used to inform homogenization approaches or reanalysis production. The
       data collection described in this paper is available on PANGAEA: https://doi.org/10.1594/PANGAEA.925860
       (Imfeld et al., 2021).

1   Introduction                                                    Haimberger et al., 2012). However, most homogenization ap-
                                                                    proaches rely entirely on statistics.
                                                                       An alternative would be to use information on the mea-
Despite the advanced use of satellite data in analysis systems,     surement system and corresponding errors. Such information
upper-air data from weather balloons still form the backbone        is sometimes available from direct comparisons, from other
of weather analysis and reanalysis products. This is particu-       systematic trials or analyses, or even from laboratory tests.
larly the case in the pre-satellite era. Although surface-only      Compiling such information might support future homoge-
reanalyses have become highly successful (Compo et al.,             nization efforts and might inform future reanalysis projects.
2011; Laloyaux et al., 2018; Slivinski et al., 2019), better        Grant et al. (2009) used a physics-based correction approach
results could be gained by assimilating the available upper-        to obtain consistent corrections; error classes were diagnosed
air data (Hersbach et al., 2017), which on a large scale reach      based on the shape of the error profile. Today, assimilation
back to the 1910s (Stickler et al., 2014; Ramella et al. 2014;      systems could possibly make use of such additional informa-
Durre et al. 2018). However, the quality and homogeneity            tion, e.g., to better define online bias correction schemes.
of radiosonde data are a serious issue and could hamper the            Within Copernicus Climate Change Services (C3S) con-
proper use of these data in reanalyses. Statistical methods         tract C311c, a database of error characterizations of ra-
have been used to generate more consistent radiosonde prod-         diosonde was compiled. In particular, the database contains
ucts (e.g., Lanzante et al., 2003; Sherwood et al., 2008; Zhou      data from radiosonde intercomparison campaigns. These
et al., 2021; Dai et al., 2011). Some homogenization methods        data will be incorporated into the global radiosonde data set
successfully make use of the background departures from re-         such that reanalyses and other applications can make use of
analysis data sets (RAOBCORE, Haimberger 2007; RICH,

Published by Copernicus Publications.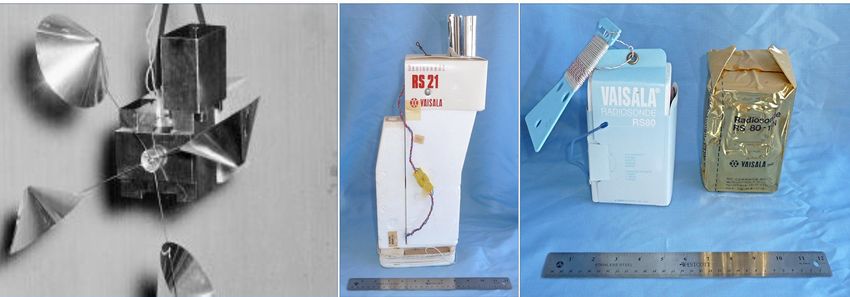
2472                                                  N. Imfeld et al.: Intercomparisons of historical upper-air measurements

them. However, only the numerical data such as the ascents         1935, in the context of an International Week, Norway and
from intercomparisons can be made available via C3S. Here          Sweden agreed to launch additional ascents at two locations,
we present and publish the complete documentation which            Nesbyen and Filipstad, 296 km apart (Nyberg et al., 1942)
includes the data themselves and also additional metadata          with the same radiosonde types in order to compare the in-
such as imaged graphical data, handbooks, technical litera-        strument errors. These data are part of our collection.
ture translated from Russian, and an expert interview.                The first World Meteorological Organization (WMO) in-
   The paper is organized as follows. Section 2 gives an           tercomparison of radiosondes took place in Payerne, Switzer-
overview of the history of radiosonde intercomparisons and         land, in 1950 (Painter, 1950) as many countries had started
error assessments. This is important to understand the mate-       operational upper-air networks after the Second World War
rial at hand. Section 3 describes the compilation and structure    and the WMO was a newly founded body to coordinate such
of the database. In Sect. 4 we discuss findings and present ex-    activities. Intercomparisons then increased in anticipation of
amples. Conclusions are drawn in Sect. 5.                          the International Geophysical Year (IGY) in 1957/58. A re-
                                                                   gional intercomparison was performed in Brussels in 1954
                                                                   (Malet, 1955), and a second global intercomparison of ra-
2     Historical background
                                                                   diosondes was organized in Payerne in 1956 in preparation
2.1    Intercomparison campaigns
                                                                   of the IGY (Beelitz, 1958). Further global intercomparisons
                                                                   took place in 1968 (in several countries; see Kuzenkov and
Upper-air measurements, particularly in the early decades,         Shlyakhov, 1976), 1984/85 (UK/USA), 1993 (Japan), and
were extremely demanding in terms of instrumentation pos-          1995/7 (USA/Russia). In addition, important regional inter-
ing a challenge for their first designers (e.g., Diamond           comparisons were carried out in Payerne (1981; Richner and
et al. 1937; Lange, 1937). Measurement devices need to be          Phillips, 1982) and Crawley, UK (1987 and 1992; Bond et al.,
lightweight and operate under an extremely large range of          1988), as well as in the former Soviet Union (FSU) in 1984
conditions (e.g., they need to cover a temperature range from      and 1985 (Kazakova, 1998; Karhunen et al., 1987; Zaitseva
30 to −80 ◦ C within an hour or a pressure range from 1040 to      et al., 1989). For some campaigns, however, precise informa-
10 hPa), and each instrument only operates for a short time.       tion on the radiosondes were missing (e.g., Goltsova et al.,
The instruments are exposed to radiation, freezing clouds,         1974), or the comparison was made against other thermome-
and strong winds. Both systematic and random errors in these       ters but not radiosondes (e.g., Krechmer et al., 1969), which
situations are large. Furthermore, the data transmission and       are thus not added to the database.
processing introduce uncertainties.                                   The raw data from past intercomparisons are often not
   Scientists such as Gustave Hermite were aware of the over-      available electronically (for some campaigns not even on pa-
heating of sensors due to radiation at high altitudes already      per), and distribution is limited. For some campaigns, how-
in the very beginning of unmanned balloon flights. His ob-         ever, assessments and statistics have survived, and perhaps
servations, in 1893, of high temperature at 16 km were there-      these are the more important products.
fore considered erroneous (Hermite, 1893). To overcome this           Today, radiosonde intercomparisons have become a stan-
problem, several strategies were selected including statisti-      dard procedure within the WMO to assure the quality of the
cal approaches (comparing day and night ascents), intercom-        global radiosonde network, and the most recent intercom-
parisons (parallel measurements with manned and unmanned           parisons took place in 2001 (Brazil), 2005 (Mauritius), and
balloons; Labitzke 1999), and laboratory studies (better char-     2010 (China) (Nash et al., 2006; da Silveira et al., 2006;
acterization of instruments). The same strategies have been        Nash et al., 2011). Within the Global Climate Observing
used until the present.                                            System (GCOS), the GCOS Reference Upper-Air Network
   Already in the early years it was considered important          (GRUAN) (Bodeker et al., 2016) was established as a ref-
to coordinate and compare results (Assmann et al., 1898).          erence, with which the radiosonde quality was further en-
In 1896, the program of “International Days” was estab-            hanced (Seidel et al., 2009).
lished: 1 d per month on which participating countries per-
formed simultaneous ascents based on a telegraphic signal          2.2   Characterization of errors and instruments
(Brückner, 1899). The International Aeronautical Commis-
sion agreed then in 1909 that balloons should be launched          There are other ways to characterize the error of a radiosonde
at 07:00 Greenwich time (Dines, 1912). Later one “Inter-           than intercomparisons with other radiosondes. For instance,
national Week” per year was added. These coordinated as-           statistics of day vs. night ascents can be used to estimate the
cents were interrupted during the First World War and re-          radiation error. Radiosondes and sensors can be analyzed in
sumed in the 1920s. In 1927, two French scientists managed         the lab, and well-understood influences (e.g., the lag) can
to transmit the measurements through a radio transmitter to        be modeled (Dirksen et al., 2014). It is therefore important
the ground. This was the start of the development of a world-      also to compile information from such sources. Brönnimann
wide radiosonde network, and the need for further intercom-        (2003) has compiled some of the early information. Reports
parisons was stated (Jeannet et al., 2016). For instance, in       are available, for instance, for the Finnish (Väisälä, 1941,

Earth Syst. Sci. Data, 13, 2471–2485, 2021                                         https://doi.org/10.5194/essd-13-2471-2021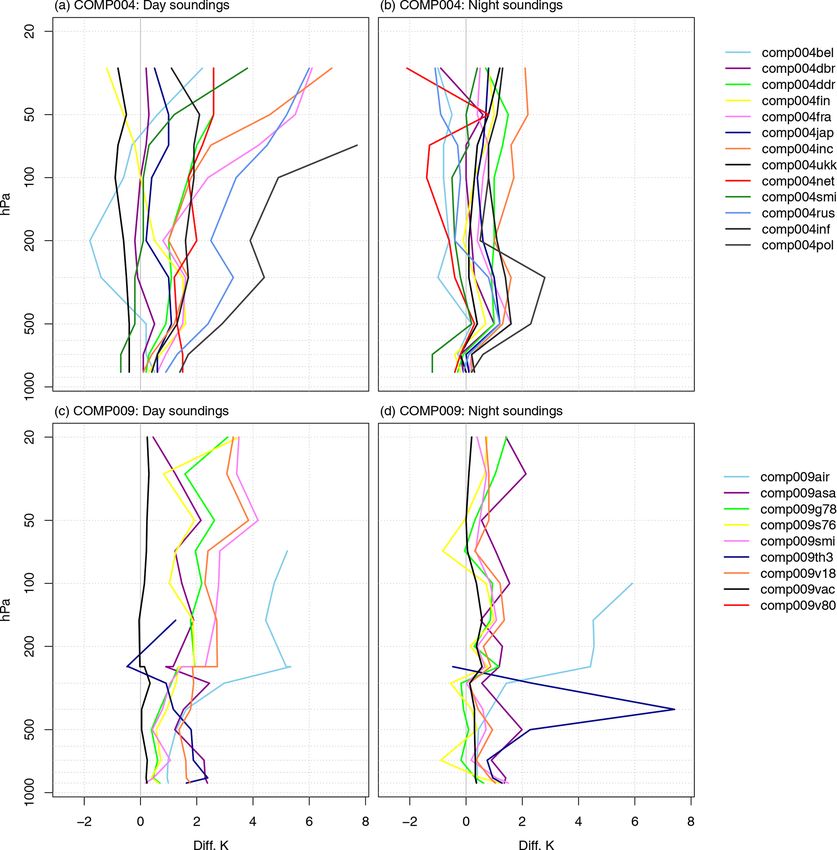
N. Imfeld et al.: Intercomparisons of historical upper-air measurements                                                    2473

1949; Raunio, 1950), German (Scherhag, 1948), and UK Met          to provide a comprehensive summary of radiosondes and
Office (Scrase, 1954) radiosondes.                                station histories from different countries has been made by
   In the FSU, a considerable number of studies on radioson-      Gaffen (1993). By contacting a vast amount of weather ser-
des have been conducted (e.g., Balagurov and Fridzon, 1983;       vices, she established a document of historical changes in
Balagurov et al., 1984; Shlyakhov and Kuzenkov, 1973;             radiosonde instruments and practices for 49 countries cover-
Zaichikov 1957 and 1962; Zaitseva et al., 1989), whereof re-      ing the period between the 1930s and 1990s. The summary
ports and correction values are available at the All-Russian      reports on the radiosondes used in the 1990s, as well as previ-
Research Institute of Hydrometeorological Information –           ously used radiosondes. Further, it lists a large amount of ra-
World Data Centre (RIHMI/WDC) in Obninsk, Russia. A               diosondes including their sensor types of temperature, pres-
selection of these error assessments has been added to our        sure, and humidity measurements and applied corrections.
database as well.                                                    WMO established a table of common codes for radioson-
   In the early days, measurements were not fully opera-          des, but prior to the 1960s radiosonde descriptions are equiv-
tional, and procedures and instruments were changing and          ocal and their coverage is by no means exhaustive (WMO,
not always well documented. Although several error sources        2019). A comprehensive list including radiosondes from
were known (e.g., the lag error) and understood, it is some-      the very early days of aerology (e.g., the British Biram’s
times unclear whether a correction (e.g., of the radiation er-    anemometer suspended from a kite in 1883) up to 2014 has
ror) was performed or not. It is therefore important to also      been compiled by Steven Schröder from the Texas A&M
compile handbooks from early times. Our compilation con-          University (personal communication). This inventory cov-
tains the handbook for the Lang radiosonde which gives in-        ers even small instrumentation changes or changes in trans-
sights into lag corrections that had been applied to the Lang     mission frequencies. It relates each radiosonde to a unique
radiosondes in 1940 (Reichsamt für Wetterdienst, 1940). A         reference identifications and where possible to the codes es-
set of handbooks has also been collected by the “Museum           tablished by WMO. For example, for the Vaisala radioson-
of Radiosondes of North America”. Its contents can, how-          des, more than 200 different radiosonde types are found in
ever, only be accessed on request and are not available online    the collection including the earliest radiosonde developed
(see http://radiosondemuseum.org/, last access: 17 Septem-        in 1931. Figure 1 shows three different Vaisala radioson-
ber 2020). Detailed technical descriptions of the very early      des from 1937, 1971, and 1981 that are part of Schröder’s
radiosonde systems up to the 1950s can also be found in           list, as well as our database. It is also worth mentioning the
Dubois et al. (2002) and, for example, for the British ra-        radiosonde collection from an association devoted to find-
diosondes in Lander (1946) and Lange (1937). For the FSU,         ing radiosondes in Europe. Their website offers a detailed
Zaitseva (1993) summarized the different radiosonde sys-          though not very systematic description of sensors of very
tems for a period starting in the 1920s.                          old to more recent radiosondes including pictures of the
   In the context of the IGY, Beelitz (1958) compiled the         radiosondes (http://radiosonde.eu/RS03/RS03A01.html last
information on current and planned operational corrections.       access: 17 September 2020).
This compilation of Beelitz is useful to determine in what           A large collection of radiosondes has also been compiled
countries and for which radiosondes corrections have been         by the aforementioned “Museum of radiosondes from North
applied, and it can be found in our database. Many countries      America” that includes radiosondes used worldwide, as well
started operational corrections of the soundings only after the   as artifacts such as balloons and batteries.
IGY of 1957/58.
                                                                  3     The database
2.3   History of station networks
                                                                  3.1    Compilation of the database
In order to relate error estimates derived from intercompar-
isons or error assessments to the operationally used radioson-    For the compilation of the database, we started by creat-
des by weather services, it is important to know the changes      ing a list of intercomparison campaigns, comprising global
a station network underwent and to be able to identify ra-        (WMO organized), regional, and national campaigns based
diosondes properly. This is especially relevant regarding the     on existing documents (e.g., Jeannet et al., 2016). This list
missing international standards of early radio soundings. A       of regional and national intercomparisons is, however, not
range of radiosonde manufacturers has existed since the early     exhaustive. Not all intercomparisons are equally important
1930s that used different sensor types or radiation shielding     with the prospect of building a global data set. National in-
or applied different corrections to the data, which often led     tercomparisons were less important, and those focusing on
to difficulties when comparing soundings that had been con-       specific parts such as the boundary layer (e.g., Kaimal et al.,
ducted in different countries (Painter, 1950).                    1980) also were not of high priority. Rather, we set priority
   A station history of a network needs to include instrumen-     on historical campaigns (i.e., the first intercomparison cam-
tation changes, applied corrections, launching procedures,        paigns that were conducted), assuming that these data are
and also information on transmission systems. An attempt          more error-prone and hence corrections more important.

https://doi.org/10.5194/essd-13-2471-2021                                        Earth Syst. Sci. Data, 13, 2471–2485, 2021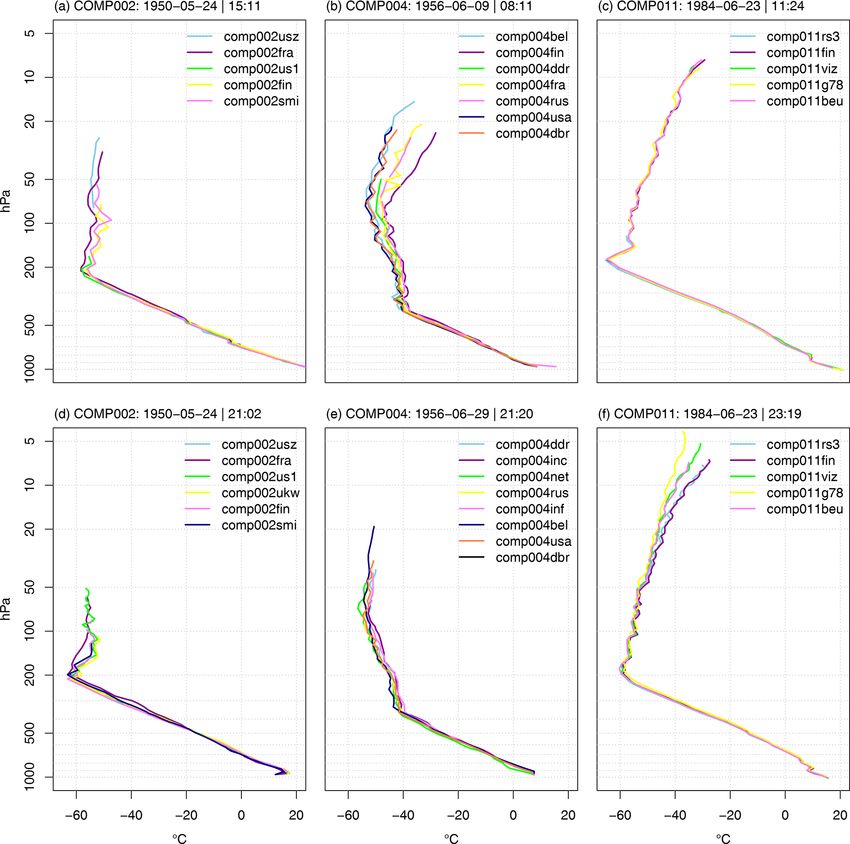
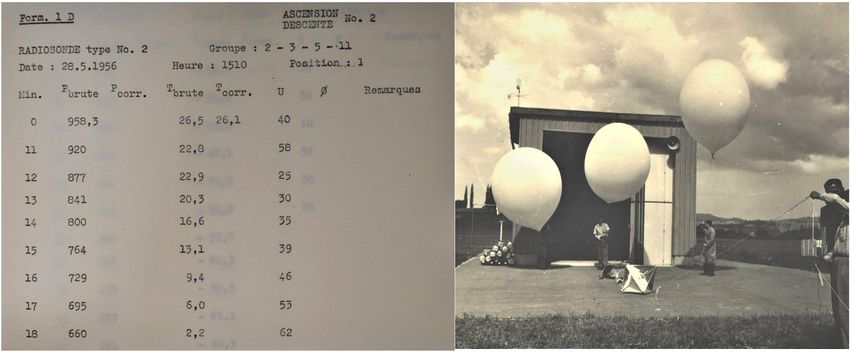
2474                                                     N. Imfeld et al.: Intercomparisons of historical upper-air measurements

Figure 1. Three types of Vaisala radiosondes. Left: the Vaisala RS11 was introduced in 1937 and won a gold medal in the world fair at Paris
(vaisala.com). Middle: Vaisala RS21 from 1971 (https://radiosondemuseum.org, last access: 21 December 2020). Right: Vaisala RS80-N
from 1981 with its original packaging (https://radiosondemuseum.org, last access: 21 December 2020). All three radiosondes have been used
in the intercomparison campaigns in our collection. They correspond to comp002fin (left), comp009van (middle), and comp009v80 (right).
Note that the introduction dates may vary because of slight modifications of the instruments.

Figure 2. Left: sounding data from the 1956 campaign held in Payerne, Switzerland, from the archive of MeteoSwiss in Payerne (own image).
Right: at the beginning of the campaign, soundings were performed with four radiosondes on a train of balloons (archive of MeteoSwiss).
Within the course of the campaign this procedure changed to 13 radiosondes on a train of several balloons.

   We searched the archives of the MeteoSwiss aerolog-                  standard. There is no agreed standard, so only pairwise com-
ical station of Payerne (Switzerland, e.g., Fig. 2) and                 parisons can be made. The database contains data for the
RIHMI/WDC Obninsk (Russia) to obtain raw data from early                variables temperature, pressure, relative humidity, geopoten-
intercomparisons and obtained further data via interlibrary             tial height, wind speed, and wind direction. However, not all
loan. Furthermore, we also searched for other literature (in-           campaigns cover all variables.
cluding laboratory, statistical, etc.). We consulted WMO with              We made quality checks of the digitized data (mainly the
regards to data from more recent intercomparison campaigns              ascent data) to find digitizing errors. These checks included
and had meetings with scientists who performed radiosonde               simple consistency checks, e.g., whether the data are within a
intercomparisons in the 1970s and 1980s (Hans Richner,                  reasonable range, whether pressure is decreasing, and cross-
ETH Zürich, and Pierre Jeannet, MeteoSwiss, Payerne). The               checks of geopotential altitude with the hydrostatic balance.
interview with Hans Richner was recorded and can be found               No additional quality control has been performed on the
in the database (in German).                                            data; suspicious values have not been corrected if they corre-
   Digitization of raw data, as well as aggregated data, was            sponded to the values on the original image.
performed based on this list of intercomparisons (Table 1).                With respect to error assessments, we digitized rel-
Raw data allow for independent analyses, but the analyses               evant information from tabular data and even graphi-
performed in the aftermath of the campaigns had all the ex-             cal data (e.g., Fig. 3). The scope of the digitized er-
pert information which might be relevant, and usually the re-           ror assessment is, however, much smaller compared to
sults are preferable (e.g., for determining corrections). How-          the intercomparison campaigns. In addition, studies on
ever, all intercomparisons have the problem of a missing                errors and intercomparisons from the Soviet radioson-

Earth Syst. Sci. Data, 13, 2471–2485, 2021                                               https://doi.org/10.5194/essd-13-2471-2021
N. Imfeld et al.: Intercomparisons of historical upper-air measurements                                                                     2475

Table 1. Digitized intercomparison campaigns between 1935 and 1995 containing raw ascent data and statistics. For full table of intercom-
parison campaigns, refer to the database link provided in Sect. 5.

  ID           Name              Year    Country Location              Participating country or            Data          Literature
                                         code                          radiosonde                          digitized
  COMP001      International     1935    NOR,     Norway and           Jaumotte meteorographs              Ascent data   Nyberg et al. (1942)
               Ascents                   SWE      Sweden
  COMP002      Global            1950    CHE      Payerne              Finland, Swiss, USA (two types      Ascent data   OMI (1951), OMM
               Intercomparison                                         of sondes), France, UK, US Zone     in minutes,   (1952);
                                                                       Germany                             statistics    Nyberg (1952);
                                                                                                                         Painter (1950)
  COMP003      Regional          1954    BEL      Brussels             Western Germany (GRAW H50),         Ascent data   Malet (1955)
               Intercomparison                                         Netherland (KNMI-Philips),          in minutes
                                                                       UK (KEW MK 2),
                                                                       USA (AN/AMT 4, Bendix 403
                                                                       Mc/s)
  COMP004      Global            1956    CHE      Payerne              Belgium JRM,                        Ascent data   OMM (1956);
               Intercomparison                                         West Germany (Graw H50),            in minutes,   Väisälä (1957);
                                                                       East Germany (Lang, improved        statistics    Beelitz (1958)
                                                                       version),
                                                                       USA (AN/AMT4),
                                                                       Finland (Vaisala),
                                                                       France (Metox),
                                                                       Japan (CMO-S 56),
                                                                       India C (chronometric),
                                                                       UK (Kew Mk IIB),
                                                                       Netherlands (Philips)
  COMP005      Global            1968    JPN,     Tateno, Stuttgart,   Finland, Federal Republic of Ger-   Statistics    Kuzenkov and
               Intercomparison           DEU,     Saint Petersburg,    many, Japan, FSU, UK, France                      Shlyakho (1976);
                                         RUS,     Bracknell                                                              Shlyakhov and
                                         GBR                                                                             Kuzenkov (1973)

  COMP007      ASOND-78          1978    CHE      Payerne              Vaisala RS18,                       Ascent data   Richner and Philips
                                                                       VIZ 1292,                           at standard   (1981)
                                                                       Swiss BASORA                        pressure
                                                                                                           level
  COMP009      SONDEX-81         1981    CHE      Payerne              AIRSONDE Univ. Bonn,                Statistics    Richner and Philips
                                                                       ASA Swiss Army Weather                            (1982)
                                                                       Service,
                                                                       Graw RSG78 DWD,
                                                                       Sprenger E076 Sprenger,
                                                                       Swiss SMI,
                                                                       Thommen Swiss Artillery
                                                                       Weather Service,
                                                                       Vaisala RS18 Univ. Zurich,
                                                                       Vaisala RS21 Vaisala Helsinki,
                                                                       Vaisala RS80 Vaisala Helsinki,
                                                                       VIZ 1392 ETH Zurich
  COMP010      Regional          1984    RUS      Northern Atlantic    Meteorit-RKZ,                       Statistics    Kazakova (1998)
               Intercomparison                                         RS21 (CORA)
  COMP011      Global            1984    GBR      Beaufort Park        Finland (RS80-15N),                 Ascent data   Hooper (1986)
               Intercomparison                                         UK (RS3),                           in minutes
               (WMO)                                                   USA (VIZ 1392-510),                 and at
                                                                       OCAN (1524-511),                    standard
                                                                       Federal Republic of Germany         pressure
                                                                       (G78C)                              levels
  COMP012      Regional          1984    BLR      Minsk (former        FSU (RKZ-2),                        Statistics    Karhunen et al.
               Intercomparison                    Soviet Union)        Finland (RS80-15N)                                (1987)

https://doi.org/10.5194/essd-13-2471-2021                                                   Earth Syst. Sci. Data, 13, 2471–2485, 2021
2476 N. Imfeld et al.: Intercomparisons of historical upper-air measurements
Table 1. Continued.
ID Name Year Country Location Participating country or Data Literature
code radiosonde digitized
COMP013 Global 1985 USA Wallops Island Australia (Philips RS4 MK3), Ascent data Schmidlin (1988)
Intercomparison Finland (Vaisala RS80-15N), in minutes
(WMO) India (Mk-III), and at
United States (VIZ Model 1392), standard
Graw M60 pressure
levels
COMP014 Regional 1985 RUS Northern Atlantic FSU (RKZ-2), Statistics Zaitseva et al. (1989)
Intercomparison Finland (RS80-15N)
COMP015 Regional 1987 GBR Crawley UK-RS3, Statistics Bond et al. (1988)
Intercomparison AIR (pre-operational),
Vaisala RS80-15,
Vaisala RS80-15L,
Vaisala RS80-15N
COMP016 Global 1989 KAZ Dzhambul FSU (MARS-2), Ascent data Ivanov et al. (1991)
Intercomparison (former Soviet China (SMA-TC-1/SMA-GZZ), in minutes
(WMO) Union) Finland (RS80-15N), and at
USA (VIZ 1392), standard
UK (AIR IS-4A) pressure
levels
COMP018 Global 1993 JPN Tsukuba Japan (RS80 and RS2-91), Ascent data Yagi et al. (1996)
Intercomparison Finland (RS80-15N, RS80-15LH, in minutes
(WMO) and RS80-15U), and at
USA (AIR IS-4A-1680HS and standard
AIR IS-4A-403L), pressure
USA (VIZ Mark II) levels
des found at the RIHMI/WDC Obninsk were translated (summarized in Table 1) and a table of error assessments
into English and are incorporated into the database. (summarized in Table 2) (see Fig. 4 for structure of database).
The full collection of translated literature is publicly Both types are linked to a third thread of information, a list
available under https://github.com/MBlaschek/CEUAS/tree/ of radiosondes, which reports information on the radiosonde
master/CEUAS/public/intercomparisons (last access: 14 Jan- type and relates them to operationally used radiosondes.
uary 2021). To relate all types of information, we introduced a spe-
cific nomenclature for the campaigns, error assessments, and
radiosondes. Intercomparison campaigns are named COM-
3.2 Database structure
PXXX, where XXX relates to one campaign. All information
Intercomparisons can have different setups: different ra- related to one campaign is named correspondingly. Error as-
diosondes can be flown on the same balloons, on differ- sessments are named CORRXXX.
ent balloons at the same time, different balloons at different
times, or even different balloons at different times and dif- 3.2.1 Intercomparisons
ferent places. The comparison of pressure is, for example,
only possible if instruments are flown on the same balloon; A summary of each intercomparison campaign for which
then time can be used as the common axis in the data format. digitized data are available in our database can be found
Also, the intercomparison campaigns are sometimes accom- in Table 1. Note that a more comprehensive summary on
panied by statistical evaluations that present relative errors intercomparison campaigns can be found in the database
per radiosonde type, pressure level, etc. This information is itself, which also includes intercomparison campaigns for
also important as it embodies the expert knowledge of the which we were not able to find either raw or aggregated
authors, such as applied corrections. An organization of the data. The information on each intercomparison is structured
data must thus be found that retains all the original infor- uniformly. All performed soundings and all profiles of the
mation while also making use of the evaluated data and that different radiosondes from these soundings are listed in two
allows easy access to metadata and original images. separate lists, a list of soundings and a list of profiles (COM-
We structured the database therefore along two main PXXX_ListProfiles and COMPXXX_ListSoundings). Every
threads of information: a table of intercomparison campaigns sounding is assigned an identification (COMPXXX_XXX)
Earth Syst. Sci. Data, 13, 2471–2485, 2021 https://doi.org/10.5194/essd-13-2471-2021N. Imfeld et al.: Intercomparisons of historical upper-air measurements 2477 Figure 3. Radiosonde temperature biases due to radiation for different radiosonde types, pressure levels, and solar elevation angles (from Teweles and Finger, 1960). chronologically. Every profile is then assigned this sounding some campaigns, sounding lists are available, but we could identification, including in addition two digits that identify not find the raw data. We still consider these lists important, the radiosonde (or profile) (COMPXXX_XXX_XX). Pro- as they report on the sounding schedule during the campaign files may correspond to the same sounding, but they were and they allow us to estimate the number of performed as- launched on different balloons. Thus, start times of profiles cents. from the same sounding can differ. The profile identifica- For some campaigns, aggregated results (statistics) that tion links to the digitized ascent data and to the images that stem from analyses performed in the aftermath of the cam- have been digitized. Ascent data can be available in minute paign are available (for some, only the aggregated results are or standard level pressure data, though minute data are pre- available; see Table 1). These aggregated results are either ferred as they allow for the comparison of pressure sensors. comparisons between pairs of radiosondes, comparisons to The prefix “m” or “s” indicate whether the data are avail- a reference radiosonde, or comparisons to the mean of all able as minute data or on standard pressure levels. An exam- other radiosondes. The available information includes mean ple of the digitized ascent data is shown in Fig. 5 (left). For differences, standard deviations, standard errors, significance https://doi.org/10.5194/essd-13-2471-2021 Earth Syst. Sci. Data, 13, 2471–2485, 2021
2478 N. Imfeld et al.: Intercomparisons of historical upper-air measurements
Figure 4. Schematic view of database structure based on the three tables for intercomparison campaigns, error assessments, and radiosondes.
A common nomenclature links the different elements of the database, i.e., the digitized data files, the metadata, the source files, and the
respective radiosondes.
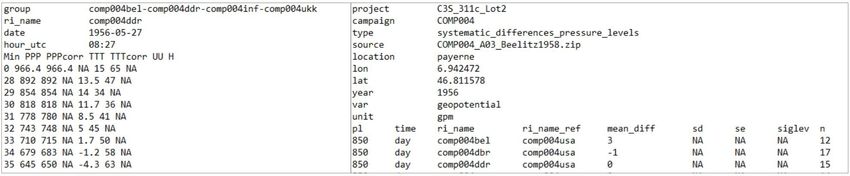
Figure 5. Left: example of data format for a radiosonde profile based on minute data. Right: example of data format for aggregated results.
Both data files can be linked to the lists of profiles and the lists of soundings of the respective campaign.
levels, and the number of profiles used for the calculation isons, specify the participating radiosondes, or report on the
of the statistics. Abbreviations thereof are mean_diff, sd, se, methods used to calculate aggregated results.
siglev, and n. For the aggregated results, however, the amount
of information differs. For example, not for every campaign
3.2.2 Error assessments
is it known how many pairs of comparisons have been used
for the calculation of the statistics. The standardized files for Error assessments are either in digitized form as aggregated
statistics are named in addition to the campaign number with results, in graphical form, or in reference to publications (and
the variable they contain (e.g., temperature, pressure, etc.), the tables therein). A summary of error assessments that are
the aforementioned abbreviation (“m”/“s”) for minute and part of the database can be found in Table 2. Error assess-
pressure data, and whether they contain day or night compar- ments can report overall errors, estimations of lag or radia-
isons. An example of the file structure is seen in Fig. 5 (right). tion errors of a radiosonde, or also results from laboratory
All digitized data (the profile data and the statistics) are measurements or calibration information. Error assessments
linked to a radiosonde type, which is further described in of temperature include further information, such as the solar
a radiosonde table (see Sect. 3.2.3). The metadata of each elevation related to the temperature error, and for tempera-
campaign are available in a sub-folder of the respective cam- ture they are mostly made on standard pressure levels. Not
paign, and they mostly describe the setup of the intercompar- for all radiation errors is the solar elevation angle known, nor
Earth Syst. Sci. Data, 13, 2471–2485, 2021 https://doi.org/10.5194/essd-13-2471-2021N. Imfeld et al.: Intercomparisons of historical upper-air measurements 2479
Table 2. Digitized error assessment in our database for different radiosonde types. For full table of error assessments, refer to the database
link provided in Sect. 5.
ID Literature Countries or radiosondes Format in database Digitized data
CORR001 Väisälä (1941) Finland Not included – article under
copyright
CORR002 Scherhag (1948) Different radiosondes used in Digitized Radiation error for geopotential
Germany for pressure levels and solar ele-
vations
CORR003 OMM (1952) Finland, Swiss, USA (two types Digitized Pressure differences from labora-
of radiosondes), France, UK, US tory measurements
Zone Germany Radiation errors for temperature
Time lag errors for temperature
CORR004 Scrase (1954) Great Britain Not included – article under
copyright
CORR005 Marfenko (1957) FSU Translated literature and tables
CORR006 Väisälä (1957) Belgium JRM, Literature
West Germany (Graw H50),
East Germany (Lang, improved
version),
USA (AN/AMT4),
Finland (Vaisala),
France (Metox),
Japan (CMO-S 56),
India C (chronometric),
UK (Kew Mk IIB),
Netherlands (Philips)
CORR007 Teweles and Finger (1960) Japan, Finland, UK, USA, Digitized Radiation error for different pres-
Canada, FSU sure levels and solar elevations
for temperature
CORR008 Zaichikov (1962) FSU/RZ-049, A-22, RKZ-1 Translated literature and tables
CORR009 Zaichikov (1964) FSU/RZ-049 and A-22-III Translated literature and tables
CORR010 Marfenko and Markelova FSU/RKZ Translated literature and tables
(1965)
CORR011 Marfenko (1969) FSU/A-22-IV and RKZ-2 Digitized Radiation errors, lag errors,
statistics of intercomparison of
the two sondes
CORR012 Balagurov and Fridzon FSU/RKZ Translated literature and tables
(1983)
CORR013 Marfenko (1983) FSU/Meteorit-RKZ Translated literature and tables
CORR014 Balagurov et al. (1984) FSU/RKZ and MARZ Translated literature and tables
CORR015 Fridzon (1989) FSU/Titan Meteorit-2 Translated literature and tables
CORR016 Fridzon (1990) FSU/RKZ and MARZ Translated literature and tables
CORR017 Luers and Eskridge (1995) USA/VIZ and Vaisala RS80 Translated literature and tables
CORR018 Kazakova and Fridzon RUS/RZ-049 and A22-III Translated literature and tables
(2011)
can it be derived, because the time when the soundings were The list of error assessments contains the links to the dig-
performed is not available. The digitized error assessments itized data, as well as metadata (e.g., methods of calcula-
is stored in a folder CORRXXX, where XXX corresponds to tions) and images (CORRXXX_Sources). For error assess-
the identification as seen in Table 2 or the table error assess- ments from the RIHMI/WDC the original literature in Cyril-
ments in the database. lic and the translations thereof are made available.
https://doi.org/10.5194/essd-13-2471-2021 Earth Syst. Sci. Data, 13, 2471–2485, 20212480 N. Imfeld et al.: Intercomparisons of historical upper-air measurements
3.2.3 Radiosondes table This has the advantage that pressure sensors can be com-
pared. For campaigns for which profile data are only avail-
The list of radiosondes includes specifications of the instru- able at standard pressure levels (e.g., COMP007), compar-
ments that are mainly based on metadata from the individ- isons of temperature (or other) data may also contain differ-
ual campaigns. Each radiosonde type has a unique identifier ences that stem from the pressure sensors and not the tem-
(UID) that refers to the WMO-Code for radiosondes (if avail- perature measurements.
able) and more importantly to the UID from the compilation More than 10 years after the second international inter-
of Schröder described in Sect. 2.3. Despite the comprehen- comparison, in 1968/69, different temperature reference ra-
siveness of Schröder’s list, we were not able to relate all ra- diosondes were compared in Japan, FSU, Germany, and the
diosondes used in our comparison to the list by Schröder, UK (Kuzenkov and Shlyakhov, 1976). For these compar-
and we extended his list with additional instruments. In the isons, summary statistics but no raw ascent data have been
database, the radiosondes have their own nomenclature, the found at the RIHMI/WDC.
ri_name (compXXXzzz), whereof XXX refers to the cam- Despite improved radiosonde technologies, after the inter-
paign the radiosonde has been used in and zzz to the ra- comparisons held in Payerne in 1978 and 1981, the main
diosonde itself. For the complete list of radiosondes, please conclusions still pointed out the importance of radiation
refer to the database with the link provided in Sect. 5. correction and the need for laboratory tests (Philips et al.,
1981; Richner and Philips, 1982). Systematic differences
4 Discussion between radiosondes changed from the early campaigns in
1956 (COMP004) to 1982 (COMP009); however, they still
In the course of the three early regional and international remain evident, though systematic differences in upper-levels
campaigns held in Payerne 1950/1956 and Brussels 1954, the decreased (Fig. 6). Regarding these statistics, metadata are
magnitude of discrepancies between radiosondes types was important because often different calculation methods were
recognized. As a result of these intercomparisons, it was em- applied which also resulted in considerably different results
phasized that further intercomparisons are highly needed and (see, for example, a comparison of calculation methods in
that efforts should be put into correcting these errors and har- Beelitz, 1958). Statistics have the advantage that they con-
monizing instruments (Beelitz, 1958; Nyberg, 1952; Painter, tain all relevant information, such as for which radioson-
1950). Nyberg (1952) concluded in their report on the first in- des lag or radiation corrections have been applied. However,
ternational intercomparison (COMP002) that the systematic also the statistics should be considered with care. For exam-
differences between the six radiosondes compared are con- ple, the nighttime soundings for COMP009 (Fig. 6d) show
siderable and primarily related to radiation and lag errors. outliers for two radiosonde differences. For the radiosonde
For Europe, upper-air weather maps were drawn at that time comp009air, the difference value seems to increase systemat-
based on at least seven different radiosonde types (Painter, ically with height, whereas the outlier for comp009th3 only
1950). Until then, however, only for the Finnish radiosondes occurs on one pressure level. We could hypothesize that it
had radiation corrections been applied, which likely made the stems from a measurement error but have no means to con-
European network even less homogeneous (Nyberg, 1952). firm this. As stated above the data presented are checked for
As a result of the second international comparison in 1956 digitizing errors, but outliers are not flagged. This has to be
(COMP004), technical recommendations were formulated to considered when using the data. In this context, it should
harmonize radiosonde construction. Correction values with be noted that some results may only be of limited practical
respect to the US radiosondes were reported that could be value, as modifications have been made on the radiosonde
applied to the present radiosonde network for increasing ho- or software after the experiment took place. This was the
mogeneity (Beelitz, 1958). Such corrections are, however, case for Airsonde, Graw RSG 78, and Vaisala RS80 used in
different from corrections of lag or radiation errors, as their COMP009, and it might also be true for earlier campaigns.
goal is not to correct for physical errors. Data from more recent campaigns are easier to interpret
When interpreting the data from earlier intercomparison as more metadata are available and station histories are more
campaigns, some considerations have to be addressed. Re- carefully documented. As of 1984, the first of four phases
garding the operational networks at times, it is not entirely of the WMO-organized intercomparison campaigns was held
clear what kind of procedures were followed by the differ- in Beaufort Park, UK (Hooper, 1986). These intercompari-
ent weather services (e.g., which radiosondes were corrected son campaigns followed standard procedures in the setup of
for radiation and lag errors). Also, the soundings performed experiments, the calculation methods, and the software, and
during the intercomparison campaigns may not be fully com- for all instruments relevant information on sensors and ap-
parable to operational soundings (Nyberg, 1952). The inter- plied corrections were carefully documented. Link radioson-
comparisons were conducted by experts taking more precau- des were used (i.e., radiosondes without instrument changes)
tionary measures that may not have been taken in operational that allow us to relate results between the different cam-
soundings. Nevertheless, estimated biases are useful. Fortu- paigns (Hooper, 1986; Bond et al., 1988). The same prac-
nately, for most of the campaigns minute data were found. tices were adopted in the regional campaign held at Craw-
Earth Syst. Sci. Data, 13, 2471–2485, 2021 https://doi.org/10.5194/essd-13-2471-2021N. Imfeld et al.: Intercomparisons of historical upper-air measurements 2481 Figure 6. Example of the mean differences between pairs of sondes for day and night soundings with respect to the US sonde AN/AMT-4 for COMP004 (a, b) and to the Vaisala sonde RS21-12CN (Navaid) for COMP009 (c, d). Both comparison campaigns were conducted in Payerne in 1956 and 25 years later in 1981. ley in 1987. Comparisons showed a marked increase in the ground departures has been performed for the four WMO consistency of radiosondes due to technological advances intercomparisons, COMP011, COMP013, COMP016, and (Hooper, 1986; Bond et al., 1988). Figure 7 shows three day- COMP018 (Rupnig, 2020), but results are ambiguous. A fur- time and three nighttime soundings from COMP002 (1950), ther comparison of the statistics presented herein with the COMP004 (1956), and COMP011 (1984). Despite it being differences from operational data is, however, beyond the exemplary, the discrepancy between temperature measure- scope of this paper. ments in radiosondes is much smaller in upper-levels, and Despite the successful search of early radiosonde inter- soundings reached much higher levels for COMP011. The comparisons, it should also be noted that for very recent cam- technological improvements that made the soundings less la- paigns, such as Mauritius 2005 (Nash et al., 2006), the orig- bor intensive also allowed research teams to focus on other inal ascent data have not been found. This stresses the need aspects. More soundings were conducted per day to evalu- for proper archiving and data retrieval systems. ate the effects of different solar angles, and systematic differ- On a large scale, radiosonde data reach back to the 1910s ences of nighttime soundings could be evaluated (Bond et al., (e.g., Stickler et al., 2014). For this period, no sources report 1988). on intercomparison campaigns. However, on “International The data presented herein can also inform us about ho- Days”, radiosonde ascents have been conducted in different mogenization procedures. A preliminary study comparing countries synchronously. These data, which remain undigi- the differences of intercomparison campaigns with differ- tized, could provide further information on biases of these ences from operational radiosondes and reanalysis back- very early soundings. https://doi.org/10.5194/essd-13-2471-2021 Earth Syst. Sci. Data, 13, 2471–2485, 2021
2482                                                     N. Imfeld et al.: Intercomparisons of historical upper-air measurements

Figure 7. Example of the raw digitized temperature data for Payerne 1950 (COMP002; a, d), Payerne 1956 (COMP004; b, e), and Beaufort
Park 1984 (COMP011; c, f). The upper row shows soundings during different times of day, and the lower row shows soundings during
different times of night. Note that the different times of day lead to considerably different solar angles. Nevertheless, the development of
radiosondes is nicely visualized, in particular the increased consistency between radiosondes in 1984.

   Notwithstanding the more challenging interpretation of               6   Conclusions
the early radiosonde intercomparisons, for the purpose of es-
timating biases in early radiosonde data, the now digitally             For the early intercomparison campaigns of radiosondes, so
available data from the early campaigns (e.g 1950, 1953,                far no data have been digitally available. Especially for this
1956, 1968) are very important. With this database, these               time, however, quantitative estimates for errors of radioson-
data are now publicly available without restrictions.                   des are available, and thus making use of this newly digitized
                                                                        data can prove very useful, for example, for future reanaly-
                                                                        sis products assimilating upper-air data. This paper presents
5   Data availability
                                                                        a database of upper-air sounding intercomparisons and er-
The full database is made available through PANGAEA                     ror assessments mainly focusing on data from historic ra-
(https://doi.org/10.1594/PANGAEA.925860) (Imfeld et al.,                diosonde intercomparisons and error assessments as these are
2021). In addition, the digitized ascent data will be available         more error-prone. The structure of the database allows us to
at Copernicus Climate Data Store (https://cds.climate.                  combine digitized soundings and graphical sources, as well
copernicus.eu/cdsapp#!/search?type=dataset, last access:                as metadata. This should serve to better correct for errors in
June 2021) in “insitu-comprehensive-upper-air-observation-              historical upper-air data, which will contribute to future re-
network” which is expected to become public in summer                   analysis efforts.
2021.

Earth Syst. Sci. Data, 13, 2471–2485, 2021                                                https://doi.org/10.5194/essd-13-2471-2021
N. Imfeld et al.: Intercomparisons of historical upper-air measurements 2483
Author contributions. NI and SB wrote the manuscript and set Compo, G. P., Whitaker, J. S., Sardeshmukh, P. D., Matsui, N., Al-
up the database. NI organized the digitization, converted the data, lan, R. J., Yin, X., Gleason, B. E., Vose, R. S., Rutledge, G.,
and completed the database. YB contributed to the digitization, Bessemoulin, P., Brönnimann, S., Brunet, M., Crouthamel, R. I.,
database structure, and writing of the manuscript. AS carried out Grant, A. N., Groisman, P. Y., Jones, P. D., Kruk, M., Kruger, A.
the archive work and translation from RIHMI/WDC. SB and LH C., Marshall, G. J., Maugeri, M., Mok, H. Y., Nordli, Ø., Ross,
led the project and contributed to the database organization and the T. F., Trigo, R. M., Wang, X., Woodruff, S. D., and Worley, S.
writing of the manuscript. J.: The Twentieth Century Reanalysis Project, Q. J. Roy. Meteor.
Soc., 137, 1–28, 2011.
da Silveira, R. B., Fisch, G. F., Machado, L. A. T., Dall’Antonia,
Competing interests. The authors declare that they have no con- A. M., Sapucci, L. F., Fernandes, D., Marque, R., and Nash, J.:
flict of interest. WMO Intercomparison of GPS Radiosondes, Alcãntra, Brazil,
20 May–10 June 2001, WMO Instruments and Observing Meth-
ods Report 90, WMO, Geneva, 2006.
Acknowledgements. We thank all the students who helped in Dai, A., Wang, J., Thorne, P. W., Parker, D. E., Haimberger, L., and
digitizing the historical data, Hans Richner for informing us about Wang, X. L.: A new approach to homogenize daily radiosonde
the campaigns held at Payerne, and NASA for sharing their collec- humidity data, J. Climate, 24, 965–991, 2011.
tion of intercomparison campaigns. Diamond, H., Hinman Jr., W. S., and Dunmore, F. W.: The develop-
ment of a radio-meteorograph system for the Navy Department,
B. Am. Meteorol. Soc., 18, 73–99, 1937.
Dines, W. H.: The Vertical Temperature Distribution in the Atmo-
Financial support. The work was supported by the Copernicus
sphere over England, and Some Remarks on the General and Lo-
Climate Change Service C311c Lot2.
cal Circulation, Philos. T. R. Soc. Lond., 211 253–278, 1912.
Dirksen, R. J., Sommer, M., Immler, F. J., Hurst, D. F., Kivi, R., and
Vömel, H.: Reference quality upper-air measurements: GRUAN
Review statement. This paper was edited by Qingxiang Li and data processing for the Vaisala RS92 radiosonde, Atmos. Meas.
reviewed by two anonymous referees. Tech., 7, 4463–4490, https://doi.org/10.5194/amt-7-4463-2014,
2014.
Dubois, J. L., Multhauf, R. P., and Ziegler, C. A.: The invention
and development of the radiosondes, with a catalog of upper-
References atmospheric telemetering probes in the National museum of
American History, Smithsonian Institution, Smithsonian Institu-
Assmann, R., Moedebeck, H., and Hergesell, H.: Zur Geschichte tion Press, Washington, DC, 2002.
der internationalen Ballonfahrten, Illustrierte Aeronautische Mit- Durre, I., Yin, X., Vose, R. S., Applequist, S., and Arnfield, J.: En-
teilungen, 1898, 49–51, 1898. hancing the Data Coverage in the Integrated Global Radiosonde
Balagurov, A. M. and Fridzon, M. B.: Investigation of the temper- Archive, J. Atmos. Ocean. Tech., 35, 1753–1770, 2018.
ature impact on humidity sensors of radiosonde RKZ and capa- Fridzon, M. B.: Estimation of temperature and humidity measure-
bilities of its rationing, CAO Proceedings, 151, 28–33, 1983. ment errors at radiosondes on the USSR aerological network,
Balagurov, A. M., Fridzon, M. B., and Dozortsev, A. P.: Estimat- Meteorologia and Gydrologia, 5, 114–118, 1989.
ing the time constant of radiosondes’ sorption humidity sensors, Fridzon, M. B.: On research of metrological characteristics of ra-
Meteor. Gidrol., 4, 114–117, 1984. diosondes’ humidity sensors, CAO Proceedings, 168, 48–56,
Beelitz, P.: Bearbeitung der Ergebnisse der Radiosonden-Aufstiege 1990.
anläßlich des 2. Weltvergleichs von Radiosonden in Payerne Gaffen, D. J.: Historical changes in radiosonde instruments and
(Schweiz) 1956, Meteorologische Abhandlungen, Band VII, practices, WMO Instruments and observing methods Report No.
Heft 4, Dietrich Reimer, Berlin, 1958. 50, WMO/TD-No. 541, WMO, Geneva, 1993.
Bodeker, G. E., Bojinski, S., Cimini, D., Dirksen, R. J., Haeffe- Goltsova, K. L., Marfenko, O. V., Petrosyants, M. A., and Reshetov,
lin, M., Hannigan, J. W., Hurst, D. F., Leblanc, T., Madonna, V. D.: Intercomparison of the Soviet and the American systems
F., Maturilli, M., Mikalsen, A. C., Philipona, R., Reale, T., for ship radiosounding, Meteor. Gidrol., 12, 92–97, 1974.
Seidel, D. J., Tan, D. G. H., Thorne, P. W., Vömel, H., Grant, A. N., Brönnimann, S., Ewen, T., and Nagurny, A.: A New
and Wang, J.: Reference Upper-Air Observations for Climate: Look at Radiosonde Data Prior to 1958, J. Climate, 22, 3232–
From Concept to Reality, B. Am. Meteorol. Soc., 97, 123–135, 3247, 2009.
https://doi.org/10.1175/BAMS-D-14-00072.1, 2016. Haimberger, L.: Homogenization of radiosonde temperature time
Bond, F., Edge, P., and Nash, J.: Final report on the advanced ra- series using innovation statistics, J. Climate, 20, 1377–1403,
diosonde intercomparison held at Crawley 1987, Met Office, 2007.
Bracknell, 1988. Haimberger, L., Tavolato, C., and Sperka, S.: Homogenization of
Brönnimann, S.: A historical upper air data set for the 1939–1944 the global radiosonde dataset through combined comparison with
period, Int. J. Climatol., 23, 769–791, 2003. reanalysis background series and neighboring stations, J. Cli-
Brückner, E.: Bericht über den VII. internationalen Geographen- mate, 25, 8108–8131, 2012.
Kongress, Jahresbericht der Geographischen Gesellschaft von Hermite G.: L’exploration de la haute atmosphère. Ascension du
Bern, 17 (1898–1899), Geographische Gesellschaft Bern, 187– ballon l’Aérophile, L’Aérophile, 1, 45–55, 1893.
194, 1899.
https://doi.org/10.5194/essd-13-2471-2021 Earth Syst. Sci. Data, 13, 2471–2485, 20212484 N. Imfeld et al.: Intercomparisons of historical upper-air measurements Hersbach, H., Brönnimann, S., Haimberger, L., Mayer, M., Villiger, Luers, J. K. and Eskridge, R. E.: Temperature correction for the VIZ L., Comeaux, J., Simmons, A., Dee, D., Jourdain, S., Peubey, and Vaisala Radiosondes, J. Appl. Meteorol., 34, 1241–1253, C., Poli, P., Rayner, N., Sterin, A. M., Stickler, A., Valente, M. 1995. A., and Worley, S. J.: The potential value of early (1939–1967) Malet, L. M.: Comparaison régionale de radiosondes – Bruxelles upper-air data in atmospheric climate reanalysis, Q. J. Roy. Me- 4.11.54–19.11.54, Inst. Roy. Mét., Publ. Série A 3, Uccle, 1955. teor. Soc., 143, 1197–1210, 2017. Marfenko, O. V.: Random (Accidental) errors of radiosonde RZ- Hooper, A. H.: WMO International radiosonde comparison Phase 1 049, CAO Proceedings, 22, 35–39, 1957. Beaufort Park, UK 1984, WMO Instruments and observing Marfenko, O. V.: Estimating the accuracy of radiosounding results methods, Report No. 28, WMO, Geneva, 1986. in the upper-air network of the Soviet Union, Meteor. Gidrol., 3, Imfeld, N., Haimberger, L., Sterin, A., Brugnara, Y., and Brön- 14–21, 1969. nimann S.: Intercomparisons, Error Assessments, and Techni- Marfenko, O. V.: Metrological investigation of the method for pres- cal Information on Historical Upper-Air Measurements, PAN- sure measurement in atmospheric radiosounding, CAO Proceed- GAEA, https://doi.org/10.1594/PANGAEA.925860, 2021. ings, 147, 3–9, 1983. Ivanov, A., Kats, A., Kurnosenko, S., Nash, J., and Zaitseva, N.: Marfenko, O. V. and Markelova, K. I.: Findings of radiation errors WMO International Radiosonde Comparison, Phase III, Dzham- of thermistor radiosonde RKZ in flying conditions, CAO Pro- bul, USSR, 1989, WMO Instruments and observing methods, ceedings, 67, 24–30, 1965. Report No. 40, WMO, Geneva, 1991. Nash, J., Smout, R., Oakley, T., Pathack, B., and Kurnosenko, S.: Jeannet, P., Philipona, R., and Richner, H.: Swiss upper-air bal- The WMO Intercomparison of Radiosonde Systems – Final Re- loon soundings since 1902, in: From weather observations to port, Vacoas, Mauritius, 2–25 February 2005, WMO/TD No. atmospheric and climate sciences in Switzerland. Celebrating 1303, OM Report No. 83, WMO, Geneva, 21–27, 2006. 100 years of the Swiss Society for Meteorology: A book of Nash, J., Oakley, T., Vömel, H., and Wei, L. I.: WMO Intercom- the Swiss Society for Meteorology, edited by: Willemse S. and parison of high quality radiosonde systems, Yangjiang, China, Furger M., Vdf Hochschulverlag AG ETH Zürich, 141–167, 12 July–3 August 2010, WMO Instruments and Observing Meth- 2016. ods Report 107, WMO, Geneva, 238, 2011. Kaimal, J. C., Baynton, H. W., and Gaynor, J. E.: The Boulder low- Nyberg, A.: On the comparison of radiosonde data in Payerne, level intercomparison experiment, NOAA/NCAR Boulder At- May 1950, Sveriges Meteorologiska Och Hydrologiska Institut, mospheric Observatory, 189, 1980. Stockholm, 1952. Karhunen, P., Trifonov, G. P., and Yurmanov, V. A.: The intercom- Nyberg, A., Bergeron, T., and Palmén, E.: Synoptisch-aerologische parison of the Soviet radiosonde system “Meteorit-2-MARS-2- Bearbeitung der Internationalen Registrierballonaufstiege in Eu- 0KA-3” with the Finnish system MicroCORA, Meteor. Gidrol., ropa in der Zeit 17.–19. Oktober 1935, Geogr. Ann., 24, 51–93, 11, 111–115, 1987. 1942. Kazakova, N. N.: On the comparison of temperature and wind OMI: Comparaison Mondiale des Radiosondes, Acte Final, sounding data obtained by different systems, AARI Proceedings, Vol. I, Station Centrale Suisse de Météorologie, Organisation 409, 93–111, 1998. Météorologique Internationale, 1951. Kazakova, N. N. and Fridzon, M. B.: Assessment of uniformity (ho- OMM: Comparaison Mondiale des Radiosondes, World Compar- mogeneity) of the data series of temperature-wind sounding of ison of Radiosondes, Acte Final, Vol. III, Station Centrale Su- the atmosphere at the Russian Antarctic stations, Problemi Ark- isse de Météorologie, Organisation Météorologique Mondiale, tiki i Antarktiki, 1, 41–55, 2011. Zurich, March 1952. Krechmer, M. V., Shlyakhov, V. I., Glagolev, Y. A., Kuzmicheva, OMM: Comparaison Mondiale des Radiosondes, World Compari- N. A., Kuzenkov, A. F., Markelova, K. I., and Yurchuk, V. son of Radiosondes, Recueil des Radiosondages, Complet Re- A.: Individual results of comparison between upper-air radio- sults of Radiosoundings. Vol. I, Technical Informations, Organi- thermometers, Meteor. Gidrol., 10, 98–102, 1969. sation Météorologique Mondiale, Zurich, July 1956. Kuzenkov, A. F. and Shlyakhov, V. I.: Implementing the programme Painter, E. E.: International radiosonde trials, Weather, 5, 307–310, of international comparisons of upper-air radiosondes, CAO Pro- 1950. ceedings, 118, 33–39, 1976. Phillips, P. D., Richner, H., Joss, J., and Ohmura, A.: ASOND- Labitzke, K.: Die Stratospäre: Phänamene, Geschichte, Relevanz, 78: An Intercomparison of Vaisala, VIZ and Swiss Radiosondes, Springer Verlag, Berlin Heidelberg New York, 177 S., 1999. Pure Appl. Geophys., 119, 1–19, 1981. Laloyaux, P., de Boisseson, E., Balmaseda, M., Bidlot, J.-R., Broen- Ramella Pralungo, L., Haimberger, L., Stickler, A., and Brönni- nimann, S., Buizza, R., Dalhgren, P., Dee, D., Haimberger, L., mann, S.: A global radiosonde and tracked balloon archive on Hersbach, H., Kosaka, Y., Martin, M., Poli, P., Rayner, N., Ruste- 16 pressure levels (GRASP) back to 1905 – Part 1: Merging and meier, E., and Schepers, D.: CERA-20C: A coupled reanalysis of interpolation to 00:00 and 12:00 GMT, Earth Syst. Sci. Data, 6, the twentieth century, J. Adv. Model. Earth Sy., 10, 1172–1195, 185–200, https://doi.org/10.5194/essd-6-185-2014, 2014. https://doi.org/10.1029/2018MS001273, 2018. Raunio, N.: Amendments to the computation of the radiation error Lander, A. J.: The British Radiosonde, Weather, 1, 21–24, 1946. of the Finnish (Väisälä) radiosonde, Geophysica, 4, 14–20, 1950. Lange, K. O.: The 1936 radio-meteographs of Blue Hill Observa- Reichsamt für Wetterdienst: Technische Vorschrift für die Ra- tory, B. Am. Meteorol. Soc., 18, 107–126, 1937. diosonde, Modell Lang, Vorläufige Form, Reichsamt für Wetter- Lanzante, J. R., Klein, S. A., and Seidel, D. J.: Temporal homoge- dienst, Juli 1940. nization of monthly radiosonde temperature data. Part I: Method- ology, J. Climate, 16, 224–240, 2003. Earth Syst. Sci. Data, 13, 2471–2485, 2021 https://doi.org/10.5194/essd-13-2471-2021
You can also read