USER'S GUIDE HRV Standard HRV Premium - Kubios HRV
←
→
Page content transcription
If your browser does not render page correctly, please read the page content below

Kubios HRV
                         (ver. 3.3)

                 USER’S GUIDE
                              HRV Standard
                              HRV Premium

                         June 5, 2019

                    Mika P. Tarvainen, Ph.D.
                     Jukka Lipponen, PhD
                  Juha-Pekka Niskanen, PhLic
                   Perttu O. Ranta-aho, MSc

©Kubios Oy 2016-2019 / www.kubios.com / support@kubios.com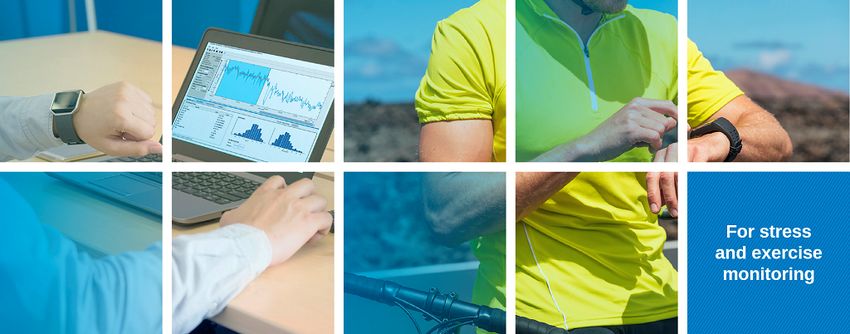
Contents
1 Overview                                                                                                                                                                                 4
  1.1 About Kubios HRV . .        .   .   .   .   .   .   .   .   .   .   .   .   .   .   .   .   .   .   .   .   .   .   .   .   .   .   .   .   .   .   .   .   .   .   .   .   .   .    4
  1.2 System requirements         .   .   .   .   .   .   .   .   .   .   .   .   .   .   .   .   .   .   .   .   .   .   .   .   .   .   .   .   .   .   .   .   .   .   .   .   .   .    4
  1.3 Release notes . . . .       .   .   .   .   .   .   .   .   .   .   .   .   .   .   .   .   .   .   .   .   .   .   .   .   .   .   .   .   .   .   .   .   .   .   .   .   .   .    6
  1.4 Installation . . . . . .    .   .   .   .   .   .   .   .   .   .   .   .   .   .   .   .   .   .   .   .   .   .   .   .   .   .   .   .   .   .   .   .   .   .   .   .   .   .    6
  1.5 Uninstallation . . . . .    .   .   .   .   .   .   .   .   .   .   .   .   .   .   .   .   .   .   .   .   .   .   .   .   .   .   .   .   .   .   .   .   .   .   .   .   .   .    6

2 Supported data formats and devices                                                                                                                                                       7

3 Beat detection and pre-processing                                                                                                                                                       10
  3.1 Beat detection algorithms . . . . . . . . . . . . . . . . . . . . . . . . . . . . . . . . . . . .                                                                                   10
  3.2 Artefact correction algorithms . . . . . . . . . . . . . . . . . . . . . . . . . . . . . . . . . .                                                                                  11
  3.3 IBI time series trend removal . . . . . . . . . . . . . . . . . . . . . . . . . . . . . . . . . .                                                                                   12

4 Kubios HRV user interface                                                                                                                                                               13
  4.1 RR interval series options . . . . . . .                        .   .   .   .   .   .   .   .   .   .   .   .   .   .   .   .   .   .   .   .   .   .   .   .   .   .   .   .   .   13
  4.2 Data browser . . . . . . . . . . . . . .                        .   .   .   .   .   .   .   .   .   .   .   .   .   .   .   .   .   .   .   .   .   .   .   .   .   .   .   .   .   14
  4.3 Results view . . . . . . . . . . . . . .                        .   .   .   .   .   .   .   .   .   .   .   .   .   .   .   .   .   .   .   .   .   .   .   .   .   .   .   .   .   16
      4.3.1 Results overview . . . . . . . .                          .   .   .   .   .   .   .   .   .   .   .   .   .   .   .   .   .   .   .   .   .   .   .   .   .   .   .   .   .   17
      4.3.2 Time-domain results view . . .                            .   .   .   .   .   .   .   .   .   .   .   .   .   .   .   .   .   .   .   .   .   .   .   .   .   .   .   .   .   18
      4.3.3 Frequency-domain results view                             .   .   .   .   .   .   .   .   .   .   .   .   .   .   .   .   .   .   .   .   .   .   .   .   .   .   .   .   .   18
      4.3.4 Nonlinear results view . . . . .                          .   .   .   .   .   .   .   .   .   .   .   .   .   .   .   .   .   .   .   .   .   .   .   .   .   .   .   .   .   18
      4.3.5 Time-varying results view . . .                           .   .   .   .   .   .   .   .   .   .   .   .   .   .   .   .   .   .   .   .   .   .   .   .   .   .   .   .   .   18
  4.4 Menus and toolbar buttons . . . . . .                           .   .   .   .   .   .   .   .   .   .   .   .   .   .   .   .   .   .   .   .   .   .   .   .   .   .   .   .   .   20

5 Saving the results                                                                                                                                                                      21
  5.1 ASCII text file . . . . . . . . . . . . . . . . . . . .                                 .   .   .   .   .   .   .   .   .   .   .   .   .   .   .   .   .   .   .   .   .   .   .   21
  5.2 PDF report . . . . . . . . . . . . . . . . . . . . .                                    .   .   .   .   .   .   .   .   .   .   .   .   .   .   .   .   .   .   .   .   .   .   .   21
  5.3 Matlab MAT-file (available in Premium) . . . . . .                                      .   .   .   .   .   .   .   .   .   .   .   .   .   .   .   .   .   .   .   .   .   .   .   22
  5.4 ”SPSS friendly” batch file (available in Premium)                                       .   .   .   .   .   .   .   .   .   .   .   .   .   .   .   .   .   .   .   .   .   .   .   23

6 Kubios HRV preferences                                                                                                                                                                  24

7 Kubios HRV analysis parameters                                                                                                                                                          29

A Appendix: Polar Flow export (available in Premium)                                                                                                                                      31

B Appendix: Kubios HRV figures                                                                                                                                                            33

References                                                                                                                                                                                39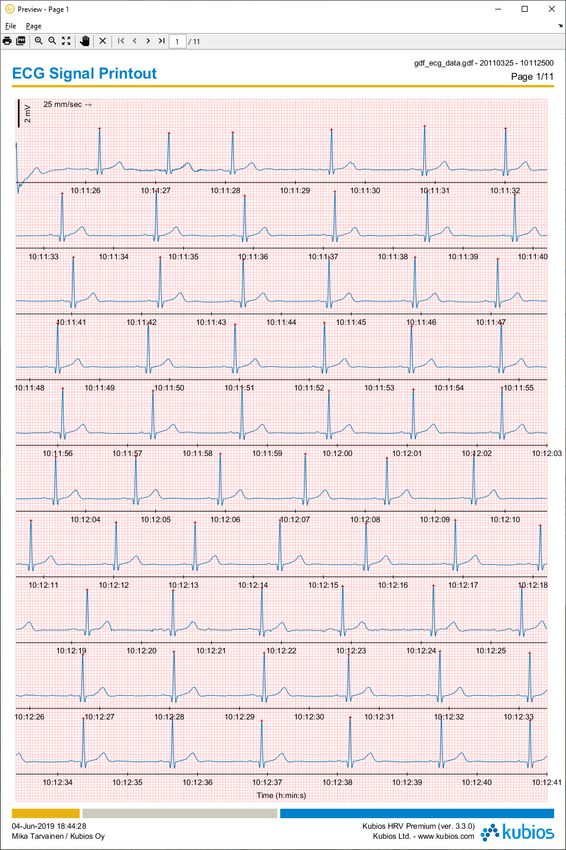
3

      Abbrevations
       ACQ      AcqKnowledge data file format (Biopac Inc.)
       ANS      Autonomic nervous system
       ApEn     Approximate Entropy
       AR       Autoregressive (model or process)
       ASCII    Text file using the ASCII character set, which is the most common format for English-
                language text files
       CSV      Comma separated value (file format)
       DFA      Detrended fluctuation analysis
       ECG      Electrocardiogram
       EDF      European data format (file format)
       EDR      ECG derived respiration
       EE       Energy expenditure
       FFT      Fast Fourier transform
       GDF      General data format (file format)
       GUI      Graphical user interface
       HF       High frequency (refers to HRV frequency band, by default 0.15-0.4 Hz)
       HR       Heart rate
       HRV      Heart rate variability
       IBI      Inter-beat-interval (same as RR interval)
       LF       Low frequency (refers to HRV frequency band, by default 0.04-0.15 Hz)
       MAT      MATLAB data file format (Mathworks Inc.)
       MSE      Multiscale entropy
       NNxx     Number of successive RR interval pairs that differ more than xx msec
       PDF      Portable document format (file format)
       pNNxx    Relative number of successive RR interval pairs that differ more than xx msec
       PNS      Parasympathetic nervous system
       PPG      Photoplethysmogram (measurement of blood volume changes)
       QRS      QRS complex of electrocardiogram
       RMSSD    Root mean square of successive RR interval differences
       RPA      Recurrence plot analysis
       RR       Time interval between successive ECG R-waves (RR interval, same as IBI)
       SampEn   Sample entropy
       ShanEn   Shannon entropy
       SDANN    Standard deviation of the averages of RR intervals in 5-min segments
       SDNN     Standard deviation of normal-to-normal RR intervals
       SDNNI    Mean of the standard deviations of RR intervals in 5-min segments
       SI       Stress index
       SNS      Sympathetic nervous system
       SPSS     Statistical analysis software package(IBM Corp.)
       TINN     Triangular interpolation of normal-to-normal intervals
       TRIMP    Training impulse
       VLF      Very low frequency (refers to HRV frequency band, by default 0-0.04 Hz)

©Kubios Oy 2016-2019
4

      1     Overview

      1.1     About Kubios HRV

      Kubios HRV is a powerful heart rate variability (HRV) analysis software. With Kubios HRV, you can turn
      your ECG or HR monitor into a powerful tool to probe the cardiovascular system or to evaluate the effect
      of stress and recovery on heart health. The software is suitable for clinical and public health researchers,
      professionals working on human well-being, or sports enthusiasts� for anybody who want to perform
      detailed analyses on heart rate variability, e.g. to examine autonomic nervous system function.
      The first versions of the Kubios HRV were developed as part of academic research work carried out at
      the Department of Applied Physics, University of Eastern Finland, Kuopio, Finland. Earlier versions of
      Kubios HRV has been described in two scientific publications [17, 25]:

             Niskanen J-P, Tarvainen MP, Ranta-aho PO, and Karjalainen PA. Software for advanced HRV analysis. Comp
             Meth Programs Biomed, 76(1):73-81, 2004.

             Tarvainen MP, Niskanen J-P, Lipponen JA, Ranta-aho PO, and Karjalainen PA. Kubios HRV – Heart rate
             variability analysis software. Comp Meth Programs Biomed, 113(1):210-220, 2014.

      Kubios HRV is a scientifically validated software and the most commonly used HRV analysis software
      for scientific research. This is evidenced by the fact that the two publications listed above have attracted
      over 1 000 citations.
      Kubios HRV is currently available as two alternative products:

             Kubios HRV Standard: Freeware HRV analysis software for non-commercial research and per-
             sonal use. Supports HR data from most common HR monitor manufacturers and computes most
             commonly used time- and frequency-domain HRV parameters. Software is operated through an
             easy-to-use GUI and analysis results can be saved as PDF report or text file.
             Product page: https://www.kubios.com/hrv-standard.
             Kubios HRV Premium: Full featured HRV analysis software for scientific research and profes-
             sional use. Supports wide range of ECG, PPG and HR data and computes all commonly used
             time-domain, frequency-domain and nonlinear HRV parameters. In addition, Kubios HRV Premium
             includes improved pre-processing, ECG derived respiration, time-varying analysis and extended
             exporting options. Analysis results can be saved as illustrative PDF reports, CSV text file, MATLAB
             MAT file and also in a ”SPSS friendly” batch file.
             Product page: https://www.kubios.com/hrv-premium.

      A summary of the features is given in Table 1.
      Please visit at https://www.kubios.com/, where you can find current information on the software, download
      updates, find tutorials and information about HRV and how to use the software. If you have any trouble
      or questions regarding the software, please check first if your particular problem or question has
      an answer in the FAQ/troubleshooting section at the software homepage! You can also follow us
      on Facebook, LinkedIn, Twitter, Instagram and YouTube.

      1.2     System requirements

      Kubios HRV was developed using MATLABr1 and was compiled to a standalone application with
      the Matlab Compiler. Therefore, in addition to Kubios HRV the MATLAB Runtime also needs to
      be installed. The latest installers for Kubios HRV and MATLAB Runtime can be downloaded from
      https://www.kubios.com/download. Please note that the MATLAB Runtime is free and does not require
      the user to have a Matlab license. System requirements for running Kubios HRV are similar to those
          1 MATLABr .   ©1984-2019 The Mathworks, Inc.

©Kubios Oy 2016-2019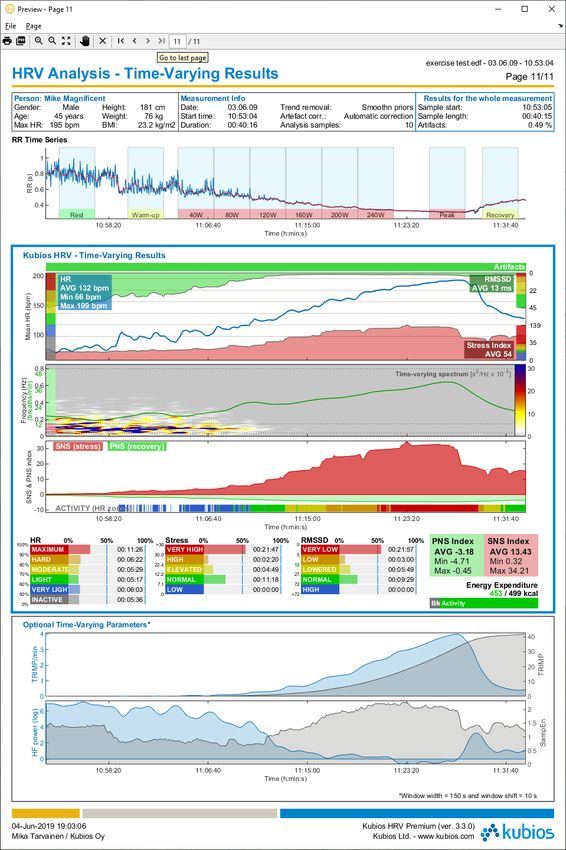
1.2 System requirements                                                                                              5

                  Table 1: Summary of Kubios HRV Standard and Kubios HRV Premium features

          FEATURES                                                                          Standard       Premium
          Data support
          • IBI or RR interval data files: Garmin and Suunto FIT files, Polar TXT files,
          custom formatted text and CSV files
          • ECG/PPG data files: EDF/EDF+, GDF, Biopac ACQ3, Cardiology XML,                 −
          ISHNE Holter ECG, and custom formatted text and CSV files
          • Supported HR monitors: ActiHeart, emWave, Firstbeat Bodyguard, Garmin
          (Forerunner and Fenix series), Polar (V800), Suunto (Ambit and Spartan se-
          ries), Zephyr BioHarness
            → Direct export from Polar Flow (RR/IBI data from all Polar Flow compatible     −
          monitors when H6, H7 or H10 heart rate sensor is used in measurement)
          • Supported ECG/PPG devices: Actiwave Cardio, AliveCor Kardia, Biopac, Bit-       −
          tium Faros, Empatica E4, Mindfield MindMaster, Shimmer and several clinical
          Holter and ECG monitors

          Pre-processing
          • Built-in QRS detector for accurate detection of ECG R-waves and pulse wave      −
          detector for PPG data
          • Artefact correction methods: Threshold based RR correction algorithm / Au-          /−/−        /   /
          tomatic RR correction algorithm / ECG based R-wave correction
          • Smoothness priors method for removing very low frequency trend compo-
          nents when performing short-term HRV analysis

          Analysis options
          • Automatic analysis sample generation (based on predefined CSV file)             −
          • Stress index, PNS index and SNS index
          • Time-domain parameters: Mean RR and HR, min/max HR, SDNN, RMSSD,
          pNN50, HRV triangular index, TINN etc.
          • Frequency-domain parameters: VLF, LF and HF band powers (in absolute,
          relative and normalised units), peak frequencies and LF/HF ratio
          • Spectrum estimation methods: Welch’s periodogram / Lomb-Scargle peri-               /−/         /   /
          odogram / AR spectrum estimate
          • Basic nonlinear parameters: Poincaré plot, approximate entropy (ApEn),
          sample entropy (SampEn) and detrended fluctuation analysis (DFA)
          • Additional nonlinear parameters: correlation dimension (D2 ), recurrence plot   −
          analysis (RPA), multiscale entropy (MSE)
          • Built-in algorithm for ECG derived respiration (EDR) providing an accurate      −
          estimate of respiratory rate, which is needed in reliable RSA component esti-
          mation
          • Time-varying analysis: instantaneous values for energy expenditure (EE),        −
          training impulse (TRIMP), stress index, PNS/SNS indexes, and all time-domain
          and frequency-domain HRV parameters and certain nonlinear parameters.
          Spectrogram with Fire-colormap

          Reports and results export
          • HRV reports (PDF reports) including: time-domain, frequency-domain and              /−          /
          nonlinear results / Time-varying analysis results
          • ECG print (PDF report) showing the raw ECG trace for selected time period       −
          • HRV analysis results export options: PDF file / Text file / MATLAB MAT file         /     /−    /   /
          • “SPSS friendly” batch file export (ideal for group analyses or repeated mea-    −
          surements)

      of Matlab (see https://www.mathworks.com/support/sysreq/) and only 64-bit operating systems are sup-
      ported. Please note that correct version of MATLAB Runtime (available at Kubios download page)
      must be installed in order to run Kubios HRV.

           Windows (7 SP1 or 10, 64-bit) operating system with 4 GB of RAM, 3-5 GB of disk space, screen
           resolution of 1024×768 or higher, and the MATLAB Runtime installation.
           Mac OS X (Sierra, High Sierra or Mojave) operating system with 4 GB of RAM, 3-5 GB of disk
           space, screen resolution of 1024×768 or higher, and the MATLAB Runtime installation

©Kubios Oy 2016-2019
1.3 Release notes                                                                                                    6

            Linux distribution (see qualified distribution at Mathworks site) with 4 GB of RAM, Intel or AMD x86-
            64 processor, 4-6 GB of disk space, screen resolution of 1024×768 or higher, hardware accelerated
            graphics card supporting OpenGL 3.3 with 1GB GPU memory, graphical desktop environment, and
            the MATLAB Runtime installation.

      1.3   Release notes

      The version history of the most significant updates and changes made in Kubios HRV is given in the
      release notes. Going though the latest release notes is recommended always before updating to a new
      version. Up-to-date and detailed release notes can be found from https://www.kubios.com/release-notes.

      1.4   Installation

      In order to run Kubios HRV, you need to install Kubios HRV and MATLAB Runtime on your computer.
      Installers can be download from https://www.kubios.com/download. The first time you launch Kubios
      HRV, you will be prompted to activate the software for the the current computer using your personal
      License key. In order to get the License key, fill in the order form at https://www.kubios.com/. A short
      description of the installation process at different operating systems is given below.

            Windows: Make sure that you have administrative privileges (you will need them to install Kubios
            HRV). In order to install Kubios HRV on a Windows computer, you need to first install the MATLAB
            Runtime on your computer. After you have installed the MATLAB Runtime, run the Kubios HRV
            installer file and follow the instructions given in the setup wizard to complete installation. You can
            launch Kubios HRV by using the Desktop icon (if created) or by selecting it from the Start Menu.
            Please note that Kubios HRV also starts the MATLAB Runtime and may take some time especially
            with older computers. The first time you start Kubios HRV, you also need to activate the software
            using your personal license key.
            Mac OS: Download the the MATLAB Runtime and the Kubios HRV application bundle. First install
            the MATLAB Runtime on your computer. After you have installed the MATLAB Runtime, move the
            Kubios HRV application bundle into Applications on your computer. Kubios HRV is then ready to
            be launched.
            Linux: Install the MATLAB Runtime by extracting the MATLAB Runtime zip package and exe-
            cuting the installer command ./install as root. Do not change the default MATLAB Runtime
            install directory if you do not have a special need to change it. Kubios HRV assumes that MATLAB
            Runtime is installed in the default directory. Otherwise the MATLAB Runtime directory has to be
            given as an argument to the run_kubioshrv script. Kubios HRV can be installed using the deb
            (Ubuntu/Debian) or rpm (Fedora/SUSE/RedHat) package using your package manager. Further-
            more, Kubios HRV can also be installed without a package manager by extracting the tar.gz file
            to a directory of your choosing. To run Kubios HRV, select it from the menu of your desktop envi-
            ronment or run the command kubioshrv-standard or kubioshrv-premium in the terminal. If you
            have installed Kubios HRV using the tar.gz package, go to the directory you extracted the package
            and run ./run_kubioshrv in the terminal.

      1.5   Uninstallation

            Windows: The software can be uninstalled using the ”Windows Settings > System > Apps &
            Features” (Windows 10) or ”Control Panel > Programs and Features” (Windows 8 and 7). However,
            the uninstaller does not remove your preferences settings or license file. These have to be deleted
            manually and can be found in the following folders:
                 Kubios HRV Standard
                 C:\Users\\AppData\Roaming\Kubios\KubiosHRVStandard
                 C:\ProgramData\Kubios\KubiosHRVStandard

©Kubios Oy 2016-2019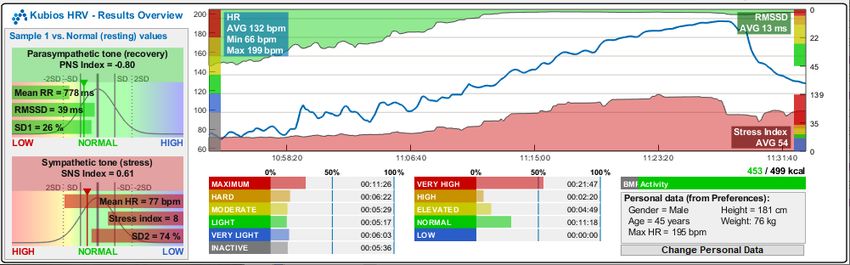
7

                   Kubios HRV Premium
                   C:\Users\\AppData\Roaming\Kubios\KubiosHRVPremium
                   C:\ProgramData\Kubios\KubiosHRVPremium
            Mac OS: Move the installed applications (MATLAB Runtime and Kubios HRV application) to trash.
            Linux: Remove the MATLAB Runtime by deleting the directory it was installed in (default
            /usr/local/MATLAB/MATLAB_Runtime/v91). If you have installed Kubios HRV using a deb or rpm
            package, use your package manager to uninstall the kubioshrv package. If you have installed
            Kubios HRV using the tar.gz package, just delete the directory it was extracted in. However, the
            preferences and license file have to be deleted manually from the ~/.kubios directory.

      2    Supported data formats and devices

      The different file formats and devices that are compatible with Kubios HRV are described here. Features
      available only in the Premium version are indicated in the text and an overview of differences between
      these versions is given in Table 1.
      Kubios HRV supports the following data formats:

              1.     Polar TXT and HRM files (Polar Electro Ltd.)                        (*.txt,*.hrm)
              2.     Suunto FIT files (Suunto Ltd.)                                         (*.fit)
                     Suunto SDF, STE and XML files (older formats)                    (*.sdf,*.ste,*.xml)
              3.     Garmin FIT files (Garmin Ltd.)                                         (*.fit)
              4.     RR interval text files                                           (*.txt,*.dat,*.csv)
              5.     Custom text data files (only RR data)                            (*.txt,*.dat,*.csv)

              Available only in Premium version:
              6.    Direct export from Polar Flow (in FIT format)                           (*.fit)
              7.    ECG and PPG data text files                                       (*.txt,*.dat,*.csv)
              8.    Custom text data files (RR, ECG and PPG data)                     (*.txt,*.dat,*.csv)
              9.    Biopac ACQ3 files (Biopac Systems Inc.)                                 (*.acq)
              10. Cardiology XML files                                                      (*.xml)
              11. European data format (EDF and EDF+) files                                 (*.edf)
              12. General data format (GDF) files                                           (*.gdf)
              13. ISHNE Holter ECG data format files                                        (*.ecg)
              14. Zephyr BioHarness ECG and RR data files                                   (*.csv)

              15.    Kubios HRV Matlab MAT files                                             (*.mat)

      When using Polar, Suunto or Garmin HR monitors, make sure that your device can measure and
      store RR intervals in beat-to-beat. From averaged data (e.g. HR values at every 5 seconds) you are
      not able to analyse HRV. In addition to standardized HR monitor file formats, a support for plain RR
      interval text files (ASCII files) is provided. The input text file can include RR interval values in one or two
      column format, i.e. the RR interval values can be given as:

                                           Type 1                    Type 2

                                             0.759              0.759     0.759
                                             0.690              1.449     0.690
                                             0.702              2.151     0.702
                                             0.712              2.863     0.712
                                             0.773              3.636     0.773
                                                  ..                 ..        ..
                                                   .                  .         .

      In Type 2 format, the first column includes the time indexes of R wave detections (zero time for the first

©Kubios Oy 2016-2019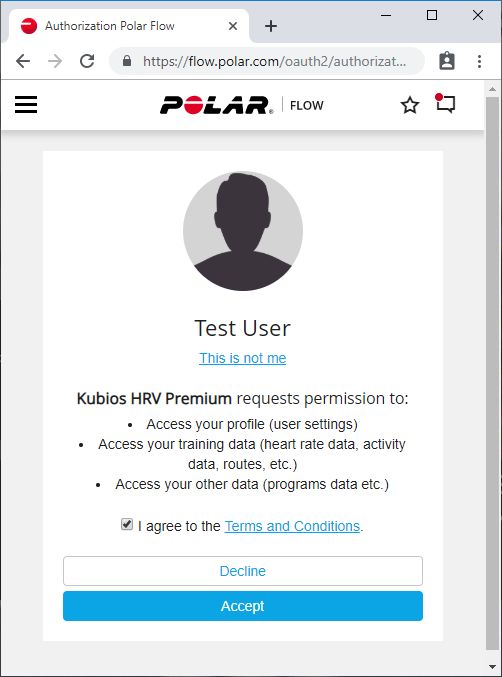
8

      detection in this example) and second column the RR interval values. The RR interval values above are
      given above in seconds, but also millisecond values can be used.
      Similarly, ECG data can be given as input in text file formatted as shown below

                                          Type 1                  Type 2

                                           -0.173                 0     -0.173
                                           -0.119             0.002     -0.119
                                           -0.025             0.004     -0.025
                                            0.091             0.006      0.091
                                            0.218             0.008      0.218
                                                 ..                ..         ..
                                                  .                 .          .

      where the first column on Type 2 format is the time scale in seconds for the ECG data. The sampling
      rate of this example file is thus 500 Hz (samples per second). If ECG data is given according to the Type
      1 format, user is prompted to enter the sampling rate manually.
      In addition to above text file formats, a custom text file option is also provided. Using this option you can
      import text files including header lines and/or several data columns. Once you have selected an input
      file, an interface for importing the file into Kubios HRV is opened. This interface and the options that you
      need to set according to your data file are shown in Fig. 1.

                                                                          Options to be set based on the data file:

                                                                          • Number of header lines
                                                                          • Column separator (tab/space, comma,
                                                                          or semicolon)
                                                                          • Data type (ECG, PPG or RR)
                                                                          • Data column (the ordinal number of data
                                                                          column)
                                                                          • Data units (µV, V or mV for ECG / ms or
                                                                          s for RR)
                                                                          • Time index column (the ordinal number
                                                                          of time indexes)
                                                                          • Time units (units of time indexes in ms, s
                                                                          or date/time format)
                                                                          • ECG sampling rate in Hz (if no time index
                                                                          column is defined for ECG)

                                                                          Once you have specified the above values
                                                                          for your file, press OK to proceed to open-
                                                                          ing the file.

                    Figure 1: The interface for importing custom text data files into Kubios HRV.

      In addition to above text file formats, Kubios HRV supports the Zephyr BioHarness file format (CSV
      file), Cardiology XML, and four binary data formats (Biopac ACQ3, EDF, GDF and ISHNE ECG). The
      EDF/EDF+ are open file formats quite generally used for storing biomedical signal data. The ISHNE ECG
      is a standard output format for Holter ECG data described in [1]. When any of these binary files are read
      to the software, Kubios HRV automatically tries to determine the ECG channel from the channel labels.
      If the ECG channel cannot be determined (or more than one channels are identified as ECG channels),
      the software prompts the user to select the appropriate channel.

©Kubios Oy 2016-2019
9
A list of commonly used devices, which are known to be compatible with Kubios HRV is given in Table
2. Please note that this is not a complete list, many other devices may also support exporting the data
in Kubios HRV compatible format.
Finally, the software supports also MATLAB MAT files saved by Kubios HRV. When you are using Kubios
HRV, you can save the analysis session into a MATLAB MAT file as described in Section 5.3. The
MAT files include all the analysis results and settings as well as the raw data (ECG, PPG or RR data).
Therefore, you are able to reopen the analysis session by opening the saved MAT file again in Kubios
HRV.
Table 2: Commonly used ECG or HR measurement devices known to be compatible with Kubios HRV.
Devices Data type Kubios HRV input option
Actiheart (CamNtech Ltd.) IBI RR text file
Actiwave Cardio (CamNtech Ltd.) ECG EDF
Biopac system with ECG module (Biopac Systems Inc.) ECG Biopac ACQ3
Cortium C3** (Cortrium Ltd.) ECG EDF
Faros (Bittium) ECG/IBI EDF
Empatica E4 (Empatica Inc.) PPG Custom text file
emWave (HeartMath Inc.) IBI Custom text file
Firstbeat Bodyguard (Firstbeat Technologies Ltd.) IBI SDF file
Garmin (Forerunner and Fenix) HR monitors* (Garmin IBI FIT file
Ltd.)
GE CardioSoft and CASE systems (GE Healthcare) ECG Cardiology XML
Kardia** (AliveCor Inc.) ECG EDF
Mindfield MindMaster (Mindfield Biosystems Ltd.) ECG EDF
Polar HR monitors* (Polar Electro Ltd.) IBI FIT file or HRM/RR text file
Shimmer ECG and PPG systems (Shimmer Sensing) ECG/PPG Custom text file
Suunto (Ambit and Spartan) HR monitors* (Suunto Ltd.) IBI FIT/SDF/STE/XML files
Zephyr BioHarness (Zephyr Tech. Corp.) ECG/IBI Zephyr BioHarness CSV
* Make sure that the model supports beat-to-beat data export (IBI data). A direct export from Polar Flow
is available in Premium version (supports any Polar Flow compatible monitor with H6, H7 or H10
heart rate sensor).
** Requires converter available from device manufacturer
©Kubios Oy 2016-201910
3 Beat detection and pre-processing
3.1 Beat detection algorithms
Kubios HRV Premium has a built-in accurate QRS and pulse wave detectors for detecting heart beats
from ECG and PPG data, respectively.
In case ECG data is imported into Kubios HRV Premium, the R-wave time instants are automatically
detected by applying the built-in QRS detection algorithm. This in-house developed detection algorithm
is based on the Pan–Tompkins algorithm [19]. The detector consists of a preprocessing part followed
by decision rules. The preprocessing part includes bandpass filtering of the ECG (to reduce power
line noise, baseline wander and other noise components), squaring of the data samples (to highlight
peaks) and moving average filtering (to smooth close-by peaks). The decision rules include amplitude
threshold and comparison to expected value between adjacent R-waves. Both of these rules are adjusted
adaptively every time a new R-wave is acceptably detected. Before R-wave time instant extraction, the
R-wave is interpolated at 2000 Hz to improve the time resolution of the detection. This up-sampling
will significantly improve the time resolution of R-wave detection when the sampling rate of the ECG is
relatively low (200 Hz or higher recommended).
The pulse wave detector is based on matched filtering approach. Firstly maximum of 1st derivative
representing the steepest part of the pulse wave is used for initial pulse location estimation. Secondly,
template for the pulse wave (and matched filter) is constructed using the initial pulses. Decision of the
final pulse wave locations are defined by comparing the filtered signal against varying threshold and
comparing normalized error between the template and PPG signal. Allowed normalized error between
template and pulse wave under inspection can be adjusted in software preferences. That is, the smaller
the acceptance threshold percent is the more similar the pulse wave have to be with the template in order
to be accepted.
The accuracy of the pulse wave detection algorithm is shown in Fig 2. The left panel showing the Bland-
Altman plot illustrating the agreement between detected PP intervals and corresponding RR intervals
during a resting measurement. The right panel shows error percentages of commonly used HRV param-
eters estimated from PP interval compared to RR interval time series. Used dataset contains 20 healthy
volunteers with wide age scale (20 to 50 years). Error between the RR and PP time series is -0.01±5.16
ms (mean ± SD). This ±5 ms error in heart beat detection produces approximately ±10% maximum
errors to the HRV parameters.
Figure 2: Accuracy of the PP interval vs. RR interval during resting measurement is presented on left
panel. In right panel, errors between the PRV and HRV parameters are presented. Blue box indicates
region between the 25-75 percentile and black lines are maximum and minimum value.
©Kubios Oy 2016-20193.2 Artefact correction algorithms 11
3.2 Artefact correction algorithms
Artefacts in the IBI time series can cause significant distortion to HRV analysis results, and thus, all
artefacts should be either corrected or excluded from analysis as recommended also in [27]. Typical
artefacts include missing, extra or misaligned beat detections as well as ectopic beats such as premature
ventricular contractions (PVC) or other arrhythmias.
Kubios HRV includes two methods for correcting artefacts and ectopic beats present in the IBI data: 1)
Threshold based correction, in which the artefacts and ectopic beats are simply corrected by compar-
ing every RR interval value against a local average interval� 2) Automatic correction (only available in
Premium), in which artefacts are detected from a time series consisting of differences between succes-
sive RR intervals. In addition to these IBI data based correction methods, the beat detections can be
corrected manually when ECG data is used for analysis (see Section 4.2).
The threshold based artefact correction algorithm compares every IBI value against a local average
interval. The local average is obtained by median filtering the IBI time series, and thus, the local average
is not affected by single outliers in IBI time series. If an IBI differs from the locale average more than
a specified threshold value, the interval is identified as an artefact and is marked for correction. The
threshold value can be selected from:
• Very low: 0.45 sec (threshold in seconds)
• Low: 0.35 sec
• Medium: 0.25 sec
• Strong: 0.15 sec
• Very strong: 0.05 sec
• Custom, for setting a custom threshold in seconds
For example, the “Medium” correction level will identify all IBIs that are larger/smaller than 0.25 seconds
compared to the local average. The correction is made by replacing the identified artefacts with interpo-
lated values using a cubic spline interpolation. Please note that the thresholds shown above are when
60 bpm hear rate and are adjusted according to mean heart rate (i.e. lower thresholds for higher heart
rate). The correction level should be adjusted individually, because inter-individual difference in HRV
are quite significant and therefore a fixed threshold does not work optimally for all subjects. The optimal
threshold is the lowest correction level which identifies all artefacts but does not identify too many normal
RR intervals as artefacts.
In the automatic artefact correction algorithm, artefacts are detected from dRR series, which is a time
series consisting of differences between successive RR intervals. The dRR series provides a robust way
to separate ectopic and misplaced beats from the normal sinus rhythm. To separate ectopic and normal
beats, time varying threshold (Th) is used. To ensure adaptation to different HRV levels, the threshold is
estimated from the time varying distribution of the dRR series. For each beat, quartile deviation of the 90
surrounding beats is calculated and multiplied by factor 5.2. Beats within this range cover 99.95% of all
beats if RR series is normally distributed. However, RR interval series is not often normally distributed,
and thus, also some of the normal beats exceed the threshold. Therefore, decision algorithm is needed
to detect artefact beats.
Ectopic beats form negative-positive-negative (NPN) or positive-negative-positive (PNP) patterns to the
dRR series. Similarly long beats form positive-negative (PN) and short beats negative-positive (NP)
patterns to the dRR series. Only dRR segments containing these patterns are classified as artefact beats.
Missed or extra beats are detected by comparing current RR value with median of the surrounding 10
RR interval values (medRR). A missed beat is detected if current RR interval (RR(i)) satisfies condition
RR(i)
− medRR(i) < 2T h (1)
2
and an extra beat is detected if two successive RR intervals (RR(i) and RR(i+1)) satisfy condition
|RR(i) + RR(i + 1) − medRR(i)| < 2T h. (2)
©Kubios Oy 2016-20193.3 IBI time series trend removal 12
Detected ectopic beats are corrected by replacing corrupted RR times by interpolated RR values. Sim-
ilarly too long and short beats are corrected by interpolating new values to the RR time series. Missed
beats are corrected by adding new R-wave occurrence time and extra beats are simply corrected by
removing extra R-wave detection and recalculating RR interval series.
3.3 IBI time series trend removal
Another common feature that can alter the analysis significantly are the slow linear or more complex
trends within the analysed time series. Such slow nonstationarities are characteristic for HRV signals
and should be considered before the analysis. The origins of nonstationarities in HRV are discussed, e.g.,
in [3]. Two kinds of methods have been used to get around the nonstationarity problem. In [29], it was
suggested that HRV data should be systematically tested for nonstationarities and that only stationary
segments should be analysed. Representativeness of these segments in comparison with the whole
HRV signal was, however, questioned in [9]. Other methods try to remove the slow nonstationary trends
from the HRV signal before analysis. The detrending is usually based on first order [13, 15] or higher
order polynomial [22, 15] models. In addition, Kubios HRV software includes an advanced detrending
method originally presented in [26]. This method is based on smoothness priors regularisation and is
suitable also for more complex trends of the time series. The method works like a time-varying highpass
filter, smoothing the data according to the value of the smoothing parameter. The bigger the smoothing
parameter is the lower is the cutoff frequency of the filter. We recommend using the smoothness priors
method for removing IBI time series nonstationarities. The cutoff frequency should be below the low
frequency band (< 0.04 Hz) not to remove any parts of the normal short term HRV.
©Kubios Oy 2016-201913
4 Kubios HRV user interface
In this section, the graphical user interface (GUI) of Kubios HRV analysis software explained. Please
note that functionalities available in the GUI depend on the version you are using (Standard or Premium).
All the screen captures shown in this documentation are taken from the Kubios HRV Premium. Features
available only in Premium are mentioned in the text.
The user interface window of Kubios HRV is shown in Fig. 3. The user interface is divided into three
segments: 1) the RR interval series options segment on the top left corner, 2) the data browser segment
on the top right corner, and 3) the results view segment on the bottom. These segments are described
in Sections 4.1, 4.2 and 4.3, respectively.
Figure 3: The graphical user interface of Kubios HRV analysis software.
4.1 RR interval series options
The RR interval series options shown in Fig. 4 includes two functions: 1)Artifact correction and 2) Sam-
ples for analysis. The artifact correction options can be used to correct artifacts from a corrupted RR
interval series. The user can select between two methods: 1) Automatic correction (available only in
Premium) and 2) Threshold correction. The automatic correction is an accurate algorithm for detecting
artifacts (missed, extra and misaligned beat detections) as well as ectopic beats. The threshold correc-
tion simply compares every beat interval against a local mean RR, and identifies the beat as artifact if
it exceeds the specified threshold. The threshold should be selected individually, because normal vari-
ability in RR intervals can be quite different between individuals, and therefore, a fixed threshold could
©Kubios Oy 2016-20194.2 Data browser 14
over or under correct the RR data. For details on these correction algorithms, see Section 3.2.
Figure 4: The RR interval series options segment of the user interface.
When using any of the correction methods, Kubios HRV displays on the RR data axis the corrected RR
interval time series in blue and original uncorrected data in light grey as shown in Fig. 5 A. In this case,
the RR interval data includes two clear artifacts: 1) a simulated ectopic beat at 10:13:40 (short interval
followed by longer interval) and 2) a simulated missed beat detection at 10:15:30, which are both nicely
corrected by using the automatic correction. The number of corrected artifacts in the whole recording
is given under the Artifact correction controls and the number of artifacts corrected from the analysis
sample is given under Samples for analysis controls. A piecewise cubic spline interpolation method is
used in the corrections.
The importance of artifact correction is highlighted in Figs. 5 B-C. Please observe that having only two
artifacts within the 5-min analysis segment has a significant effect on the time-domain HRV parameters,
especially on SDNN, RMSSD and TINN. Thus, even single artifacts should always be either corrected
or excluded from analysis. On the other hand, the number of corrected beats should not be too high
(preferably4.2 Data browser 15
A) RR artifact correction in Kubios HRV
B) Without artifact correction C) Artifacts corrected
Figure 5: RR interval artifact correction. A) The artifact corrected series is visualized on top of the raw
RR interval series, summary of corrected beats within the recording is given on the right side of RR
data axis. Time-domain analysis results B) before artifact correction and C) after the artifacts have been
corrected.
displayed in bigger size. The ECG and RR interval data axes can be controlled by using Sliders (scrolling
the data), Range edit boxes (to change data range shown on the axes), and Y-limit edit boxes (to change
the y-axis scaling). The range of the ECG axis is displayed as a grey patch on the RR axis, which can be
moved with left mouse button. ECG and RR axes can also be locked (Lock toggle button) and scrolled
together.
The main functionalities of the data browser segment are described below.
Correcting beat detections – If ECG (or PPG) data is available, each detected beat is marked
in the ECG axis with a “+” mark. Each mark can be moved or removed by right clicking it with
the mouse (NOTE: By selecting Remove several, you can remove all detections after or before
the current beat, or to remove beat detections within given interval. These options are useful for
removing beat detections from noisy signal segments). In addition, new beat markers can be added
by either right clicking some other marker and selecting ”Add”, or by pressing the ( ) button on the
right hand side of the ECG axis. Moved or added beat markers are by default snapped to closest
ECG maximum, but manual positioning can also be achieved by pressing the ( ) button on the
right hand side of the ECG axis (manual positioning should be used in case of PPG data). The
changes made in beat detection markers will be automatically updated to RR interval series.
ECG printout – A printout of the ECG (or PPG) is generated when pressing ( ). An example of
the ECG printout is shown in Fig. 16. When clicking on the button for displaying a printout of the
ECG recording, a popup window will appear in which you can select the range for the ECG to be
printed (e.g. the whole recording or the range of the analysed sample). In addition, you can adjust
©Kubios Oy 2016-20194.3 Results view 16
Figure 6: The data browser segment of the user interface.
“print speed” in mm/sec of the ECG in this popup window. Once you have defined the range for
ECG printout and clicked the OK button, the ECG signal is displayed in a preview window where
it can be easily printed or saved into a PDF file (see Section 5.2 for details on the preview window
functionalities).
Data markers – Below the ECG (or PPG) data axis, you find controls for scrolling the markers of
the recording session. These controls are hidden if marker data is not available.
Mouse gestures/shortcuts
– Pan (scroll, SHIFT + scroll) and zoom (CTRL + scroll) data on RR and ECG data views by
using mouse scroll wheel.
– Pan both RR and ECG data views by dragging with middle mouse button.
– Add a new analysis sample (CTRL + left mouse button + drag) and delete sample (right click
to open menu).
– Move or resize analysis samples by dragging them with left mouse button from the middle of
the sample (to move) or from the left or right edge (to resize).
– Center ECG data view to current cursor position in RR data view (CTRL + left mouse click).
4.3 Results view
The results for the selected RR interval sample are displayed in the results view segment (see Fig.
3, which shows results for a maximal cardiopulmonary exercise test). The results are divided into 1)
Overview, 2) Time-domain, 3) Frequency-domain, 4) Nonlinear, and 5) Time-varying (available only in
Premium) categories. The results of each category are displayed by pressing the corresponding button
on the top of the results view segment. The results are by default updated automatically whenever
analysis samples or analysis settings are changed. The processing time for computing all the analysis
results depends on the length of measurement and number of analysis samples. If the updating of the
results takes too much time, you can disable the automatic update by unchecking the ”Auto-refresh
results” check box on top of the results view segment. When unchecked, you can do all the changes to
the analysis samples and settings at once, and then press the ”Refresh” button when you want to update
the results.
©Kubios Oy 2016-20194.3 Results view 17
4.3.1 Results overview
The results overview section shown in Fig. 7 displays 1) a comparison between HRV parameters of
selected analysis segment and normal resting values and 2) an overview of recording. The normal
values for the HRV parameters (Mean RR, Mean HR, RMSSD, SD1 (%) and SD2 (%)) are obtained or
derived from the quantitative systematic review by Nunan et al. 2010 [18]. The Stress index is the square
root (to make the index normally distributed) of the Baevsky’s stress index proposed in [2] and values of
Baevsky’s stress index between 50 and 150 are considered normal. The six HRV parameters divided
into those reflecting paramsympathetic nervous system (PNS) tone (Mean RR, RMSSD and SD1 (%))
and those reflecting sympathetic nervous system (SNS) tone (Mean HR, Stress index and SD2 (%)) are
illustrated on top of the normal value distributions. These graphs give a quick view about the level of
subject’s HRV with respect to normal values. NOTE: the normal values are from rest measurements, thus
exercise or stressful situations are expected to produce higher heart rate and lower HRV. PNS and SNS
indexes are computed to provide an overall measures of these nervous system activities as compared
to normal resting values.
The overview of the recording includes an illustration of HR, RMSSD and Stress index time trends� HR
zones graph (time spent in each zone)� stress zones (time spent in each stress zone)� and energy
expenditure (basal metabolic rate and activity related energy expenditure). These information are also
provided in the time-varying report sheet (see Section 5.2), where also RMSSD zones are illustrated.
HR, Stress index and RMSSD zones are defined as follows:
HR zones √ Stress zones RMSSD zones
(of HRmax ) ( SI) (Baevsky’s SI)
MAXIMUM: 90–100% VERY HIGH: ≥30 (≥900) VERY LOW:4.3 Results view 18
4.3.2 Time-domain results view
The time-domain results view shown in Fig. 8 A) displays the time-domain HRV parameters in a table
and the RR interval and HR histograms in the two axes. All HRV parameters are calculated from the
detrended RR interval data (if detrending is applied), but mean RR, mean HR as well as min and max
HR values are exceptions (marked with the ∗ symbol). In the edit boxes below the histograms, you can
define fixed lower and upper limits for RR and HR values. These limits are saved in software preferences,
so you only need to enter them once. These limits have effect on how the RR and HR histograms are
displayed, not only in the results view segment but also in the report figure described in Section 5.2. If
you leave the edit boxes empty, the histograms are auto-scaled according to the minimum and maximum
values of the data.
4.3.3 Frequency-domain results view
The frequency-domain results view shown in Fig. 8 B) displays the results for both FFT and AR spec-
trum estimation methods. Both methods are applied to the detrended RR series. The spectra of the
two methods are presented in the two axes (FFT spectrum on the left and AR spectrum on the right).
In Premium version, user can choose in software preferences (see. Section 6) to use Lomb-Scargle
periodogram instead of FFT based Welch’s periodogram. The frequency axes of the spectra are fixed to
range from 0 Hz to the upper limit of HF band plus 0.1 Hz. Thus, for the default frequency band settings
the frequency axis range is 0–0.5 Hz. The results for both spectra are displayed in the table on the
left. If ECG is measured, an estimate of the respiration frequency is also computed. This estimate, i.e.
electrocardiogram derived respiration (EDR) is shown as a vertical line in both spectrum estimates. The
EDR value is also shown below the spectrum Y-limit options.
The frequency-domain results view includes the following settings. The power axes limits, can be ad-
justed with the options below the spectrum axes. The power axes can be selected to have either common
(same limits for FFT/Lomb and AR spectra) or separate upper Y-limits. If common Y-limit is selected,
it can also be entered manually into the edit box beside the selection button. The selected power axis
options apply also for the report sheet. Below the spectrum Y-limits options, there is a checkbox, which
can be used to show/hide the EDR. In addition, you can find settings for the very low frequency (VLF),
low frequency (LF), and high frequency (HF) bands limits. The default values for the bands are VLF:
0–0.04 Hz, LF: 0.04–0.15 Hz, and HF: 0.15–0.4 Hz according to [27]. The default values for the bands
can be restored by pressing the Defaults button. Adjustments to the frequency bands here apply only
for the current session, if you want to change these settings permanently, you need to do it by editing
software preferences (see Section 6).
4.3.4 Nonlinear results view
The nonlinear results view shown in Fig. 8 C) displays all the calculated nonlinear variables in one table.
The Poincaré plot and the DFA results are also presented graphically in the two axes. In the Poincaré
plot (left hand axis), the successive RR intervals are plotted as blue dots and the SD1 and SD2 variables
obtained from the ellipse fitting technique are presented. In the DFA plot (right hand axis), the detrended
fluctuations F (n) are presented as a function of n in a log-log scale and the slopes for the short term and
long term fluctuations α1 and α2 , respectively, are indicated.
4.3.5 Time-varying results view
The time-varying results view shown in Fig. 8 D) displays the time-varying trend of the selected vari-
ables. Time-varying analysis is by default applied to the whole measurement, but you can also change
Preferences to perform time-varying analysis for every analysis sample (see Section 6). You can either
view two selected HRV variables or the time-varying spectrum. Selected variables are plotted in the right
hand side axis (plot style can be changed between line plot and filled patch plot from the toggle button).
You can also choose if you want a backgroung grid and data point markers to be plotted (checkboxes
©Kubios Oy 2016-20194.3 Results view 19
A) Time-domain results view
B) Frequency-domain results view
C) Nonlinear results view
D) Time-varying results view
Figure 8: Results view segments of Kubios HRV: A) Time-domain results, B) Frequency-domain results,
C) Nonlinear results and D) Time-varying results (available only in Premium).
above the axis). When the time-varying spectrum is selected for view, a color bar indicating the power
values is also shown on the right. The color map of the spectrum can be changed with the Color map
dropdown button. The adjustable options for the time-varying analysis include the window width and grid
©Kubios Oy 2016-20194.4 Menus and toolbar buttons 20
interval for the moving window, which is used to calculate the results.
4.4 Menus and toolbar buttons
The user menus and toolbar buttons are located on the upper left hand corner of the user interface.
There are all together four user menus and eight toolbar buttons. The toolbar button icons and their
actions are explained below
Open new data file button is for opening a new data file for analysis.
If the results of the current analysis have not been saved, user is
prompted to do so.
Save results button is for saving the analysis results. The results can
be saved in ASCII, PDF, and MATLAB MAT file format (see Section
5 for details).
Append results to ”SPSS friendly” batch file (available only in
Premium) button is for adding the current analysis session results
into an existing (or creating a new) ”SPSS friendly” batch file (see
Section 5 for details).
Print results button is for printing the current results without opening
report sheet windows.
Report preview button opens the report sheet preview window which
include all the analysis results (see Section 5.2 for details).
Edit preferences button opens a preferences window in which you
can, e.g., change the default values for analysis options (see Section
6 for details).
About Kubios HRV button opens the about dialog of the software,
which includes the version number and contact information. Also
the Kubios HRV End User License Agreement can be viewed in the
about dialog.
Zoom in/out buttons can be used to zoom in or out on the
ECG and RR data axes (please note that in other axes zoom-
ing is not enabled).
Close file button closes the current data file. If the results of the
current analysis have not been saved, user is prompted to do so.
Show/hide markers button toggles between showing and hiding
event marker time points over the ECG and RR axes.
Show/hide marker lines button toggles between showing and hiding
event marker vertical dashed lines over the ECG and RR axes.
All the above actions are also available on the user menus. The File menu includes Open, Save Results,
Save Results As, Append Results to ”SPSS friendly” Batch File, Print Results, Edit Preferences, Close,
and Quit commands. The Quit command of the File menu is for exiting from the software. The File
menu also displays the last nine opened data files. The View menu includes Markers menu and Report
preview command. The Markers menu is for displaying possible stimuli or event markers presented in
the experimental procedure and stored in the data file. If no markers are found from the data file the
Markers menu will be disabled. The Tools menu includes Polar Flow Export option, which provides an
easy way to export all your Polar Flow measurements into your computer in FIT file format to be analyzed
in Kubios HRV (see Appendix A for details). Finally, the Help menu includes links to Kubios HRV User’s
guide, Kubios home page, Kubios Support pages, Contact us by e-mail, License information, and the
About Kubios HRV dialog.
©Kubios Oy 2016-201921
5 Saving the results
The analysis results can be saved by selecting Save Results or Save Results As from the File menu or
by pressing the save button on the toolbar. This will open a file save dialog in which the saving type
can be selected. There are three different types in which the results can be saved: 1) the results can be
written in an ASCII text file for further inspection, 2) the report sheets generated from the results can be
saved in a PDF-file, and 3) the results can be saved in a MATLAB MAT-file (available only in Premium).
In addition to these, Kubios HRV Premium includes the Append to ”SPSS friendly” batch file option to
save session results into existing batch file (ideal for saving group results).
5.1 ASCII text file
When the ASCII text file is selected for the saving type, the numeric results of the analysis will be written
in an CSV formatted text file. The resulting text file includes the following information in the enumerated
order.
1. Software, user, and data file informations
2. Used analysis parameters
3. Samples selected for analysis
4. Results overview
5. Time-domain results
6. Frequency-domain results
7. Nonlinear results
8. Time-varying results
9. RR interval data and spectrum estimates
The columns of the file are separated with comma or semicolon (can be adjusted in software preferences)
so that the results could easily be imported to, e.g., spreadsheet programs such as the Microsoft Excelr
for further inspection. A preview of the CSV formatted text file showing standard analysis results is
presented in Fig. 17 and showing time-varying results in Fig. 18.
5.2 PDF report
The PDF report includes all the analysis results for the current session. The report pages opens in a
preview window where they can be easily printed or saved into a PDF file. Kubios HRV produces one
report page for every analysis sample including all the time-domain, frequency-domain, and nonlinear
analysis results as shown in Fig. 19. In addition, Kubios HRV Premium produces one page (or several
pages if time-varying analysis has been set to apply into analysis samples in Preferences) including time-
varying analysis results as shown in Fig. 20. The RR interval data and the sample selected for analysis
are presented on top of all report pages and the analysis results below them.
When Save Results have been selected, the report page(s) can be saved in a single PDF-file by selecting
Report figure as the saving type in the save dialog. In this case, the report page(s) will not be displayed,
but just saved in the selected PDF-file. If you wish to view the report page(s), choose Report preview
from the View menu or just press the corresponding toolbar button.
The report preview window includes 11 toolbar buttons and File and Page menus on the upper left hand
corners of the windows. The toolbar buttons are explained below
Print button opens a print dialog from which the report page(s) (all
pages, pages in certain range or current page) can be sent to the
selected printer.
Save all pages as PDF-file button is for saving all report page(s) into
a single PDF-file.
©Kubios Oy 2016-20195.3 Matlab MAT-file (available in Premium) 22
Zoom in button if for zooming in (magnifying) the report page.
Zoom out button is for zooming out the report page.
Reset to original size button can be used to restore the original
zoom level. This also resets the size of the corresponding report
preview window to its original size.
Move visible area button is for moving the visible area of the zoomed
report page in the report preview window (just grab the sheet with
mouse and drag it to the desired direction).
Close button is for closing the report preview.
Go to first page button is for displaying the first report page in the
preview.
Go to previous page button is for displaying the previous report
page in the preview.
Go to next page button is for displaying the next report page in the
preview.
Go to last page button is for displaying the last report page in the
preview.
The File menu includes Save All Pages as PDF, Print and Close commands, which are also given as
toolbar buttons described above. The Page menu includes commands for changing the page that is
displayed in the preview window (First page, Previous page, Next page, Last page), which are all also
given as toolbar buttons.
5.3 Matlab MAT-file (available in Premium)
In addition to saving the numeric results into an ASCII text file or saving the report sheet(s) in a PDF-file,
the analysis results can also be saved in a MATLAB MAT-file (compatible with MATLABr R2006b or
later). The MAT-file include all the analysis results and analysis parameters, exactly as they where when
you saved the results. In addition, these files include the raw data (ECG or RR data). This saving option
has two purposes:
1. The main purpose of the MAT-file is that by opening the MAT-file in Kubios HRV, you can return to the
previously performed analyses session as it was (all settings and analysis samples are presented
as they were) when the analysis was originally performed. Thus, the MAT file makes it easy for you
to change something in the analysis (e.g. add a new analysis sample or change some settings) and
re-analyse the data. Thus, we recommend that you save the analysis results always as a MAT-file,
just in case if something needs to be done differently.
2. In addition, the MAT files are useful for anyone working with MATLAB (further analysis or processing
can be performed easily by loading the MAT-files into MATLAB).
The MAT files include a single structured array variable named Res. The Res variable includes the nu-
meric results as well as the RR interval data and all the analysis options. The Res structure includes four
fields which are shortly described as follows
f_name: File name of the analysed data file
f_path: Full path for the analysed data file
CNT: Basic information of the data file (the field name refers to Neuroscan CNT-file
for historical reasons)
HRV: Used analysis options, RR interval data, and all analysis results.
The HRV field is the most essential one of these fields. The HRV field includes six fields the contents
of which are shortly described as follows
©Kubios Oy 2016-20195.4 ”SPSS friendly” batch file (available in Premium) 23
Param: The analysis options used in the calculation of the results
Data: The RR interval data
Summary: Results overview including PNS and SNS indexes
Statistics: Time-domain analysis results
Frequency: Frequency-domain analysis results
NonLinear: Nonlinear analysis results
TimeVar: Time-varying analysis results
The variable names of the different fields are more or less self-descriptive and are not documented
here.
5.4 ”SPSS friendly” batch file (available in Premium)
In Kubios HRV Premium, you can also save the analysis results into a ”SPSS friendly” batch file. This
saving options is ideal for saving group results, for example if you need to analyse HRV data of several
subjects and want to be able to have the group results easily available for statistical testing e.g. in MS
Excel or SPSS. Alternatively, you can use the batch file saving option for saving HRV results of repeated
personal recordings, e.g. to monitor training effect or daily stress levels. Kubios uses Comma Separated
Values (CSV) file format for the batch file, which can be easily imported into many spreadsheet and
statistical software packages (MS Excel, SPSS).
The Append to ”SPSS friendly” batch file functions as follows:
1. When saving the analysis results of the first subject (i.e. when you want to initialise a new CSV
file), select the destination and file name for the new CSV file from the file dialog. In this case,
Kubios HRV will initialise the CSV file by writing the column labels and add the analysis results into
the first row below the column labels.
2. When saving the analysis results of other subjects, simply select the previously saved CSV file. In
this case, Kubios HRV will add the results of the current analysis session into the last row of the
file.
The structure of the ”SPSS friendly” batch file is presented in Fig. 21. Every row of the batch file consists
of the file name string and used analysis parameters values ([1x18] array)� followed by the following
information for every analysis sample: sample info consisting of sample onset/offset time and artifact cor-
rection statistics ([1x2] array), and HRV analysis results ([1x82] array). For more details on the different
HRV analysis variables please see Table 3.
©Kubios Oy 2016-201924
6 Kubios HRV preferences
Kubios HRV includes several settings related to how the ECG or RR interval data is processed and
analysed. The default values for these settings are designed to be suitable for short-term (normal human)
HRV recordings, but may sometimes need to be redefined. Some of these settings can be adjusted in
the user interface to apply for the current analysis session, but in order to make permanent changes into
these settings you need to edit them at software preferences. Preferences can be edited by selecting
Edit Preferences from the File menu or by pressing the corresponding toolbar button. This will open the
preferences window in which the preference values can be redefined. The preferences are divided into
four categories: 1) User information, 2) Input data & pre-processing, 3) Analysis options (divided into
time/frequency-domain, nonlinear and time-varying subcategories), and 4) Report settings.
In the User information settings shown in Fig. 9 you can set up your personal contact information
(Name, Department, and Organization). This information will only be included in the bottom left corner of
the report sheet and in the beginning of the ASCII text file including the analysis results. That is, the user
information is meant just for indicating the person/organisation that has carried out the analysis. The
values given for Gender, Date of birth, Height, Weight and Max HR are used in HR zones and energy
expenditure computations.
Figure 9: Set up preferences window of the software – User information settings.
From the Input data & pre-processing settings shown in Fig. 10, you can change the default input data
type into any of the file formats mentioned in Section 2. The selected input data type is used as the default
data type every time a new data file is opened, so you can save one additional click by defining the data
type you usually work on as the default. The default artifact correction method and acceptance threshold
can be modified here (see Section 3.2). By default the acceptance threshold is set to 5%, meaning that
analysis samples having more than 5% trigger a warning of low quality data. Under Signal type you can
specify if you are using ECG or PPG data for HRV analysis (this has effect on the algorithm applied in
beat detection). If you are using RR or IBI data, this selection does not have any effect. When ECG is
selected as signal type, you can modify QRS detection settings. You can force Kubios to look for the R-
waves either from positive of negative amplitudes, or let Kubios to decide (R-wave polarity=Automatic).
Also, you can manually fix the prior guess for the average RR interval (used by the QRS detector as
initial value), or let Kubios try to estimate it automatically. By default the QRS detection settings are set
to automatic and there is no reason to change them unless you are experiencing problems in R-wave
detection. If PPG is selected as signal type, you can modify the pulse acceptance threshold (not visible
©Kubios Oy 2016-2019You can also read