LokDhaba : Acquiring, Visualizing and Disseminating Data on Indian Elections
←
→
Page content transcription
If your browser does not render page correctly, please read the page content below
LokDhaba : Acquiring, Visualizing and Disseminating Data on
                           Indian Elections
                                     Mohit Kumar                                                                               Chinmay Narayan
                     mohit.kumar@ashoka.edu.in                                                                        chinmay.narayan@amuselabs.com
          Trivedi Centre for Political Data, Ashoka University                                                                  Amuse Labs
                             Haryana, India                                                                                  Uttarakhand, India

                               Sudheendra Hangal                                                                              Priyamvada Trivedi
                  sudheendra.hangal@ashoka.edu.in                                                                  priyamvada.trivedi@ashoka.edu.in
         Trivedi Centre for Political Data, Ashoka University                                             Trivedi Centre for Political Data, Ashoka University
                            Haryana, India                                                                                   Haryana, India
ABSTRACT                                                                                              1     INTRODUCTION
Despite the importance of elections in India, the world’s largest                                     The Indian elections are the largest in the world, currently involving
democracy, data on Indian electoral outcomes has not been easily                                      an electorate of over 900 million people [25]. As specified in the
available for political analysis in the past. This has been due to                                    Indian constitution, elections are held every five years at national
the problems inherent in assembling any data archive of social and                                    (parliamentary), state and local levels, with a “First Past The Post”
political data spanning many decades. In this paper, we shed some                                     system. At the state and parliamentary level, the elections are con-
light on these problems and present some solutions in the context of a                                ducted by the Election Commission of India (ECI) and the state
system we built called LokDhaba. LokDhaba includes the first freely-                                  election commissions in 29 states and 7 union territories. These elec-
available, structured and cleaned data archive on Indian electoral                                    tions generate a fascinating trove of data for understanding political
outcomes at the national or state level from 1962 onwards. To build                                   trends and processes. However, it is difficult to obtain structured
this archive, we overcame the challenges of data scraping, parsing,                                   data for the outcomes of Indian elections in consistent formats over
cleaning, consistency checking and integration between multiple                                       a long period of time. This inhibits fundamental questions political
sources, with the help of some novel tools. LokDhaba is being used                                    scientists would like to ask, such as: What is the pattern in voter
extensively by political scientists, researchers, journalists and others                              turnout over time across the country? Are women participating more,
to better understand long-term electoral trends in India.                                             or less, in the political process? Is the supply of political candidates
                                                                                                      increasing or decreasing over time? How many times does an as-
CCS CONCEPTS                                                                                          pirant for political office contest an election? Are these patterns
                                                                                                      correlated with caste, geography, age, gender or income?
• Information systems → Document representation; Relational
                                                                                                         In this paper, we discuss technical challenges we encountered
database model; Collaborative and social computing systems and
                                                                                                      in the acquisition and dissemination of Indian elections data that
tools; • Computing methodologies → Knowledge representation
                                                                                                      enables the answer to such questions. Over the past three years,
and reasoning.
                                                                                                      we have set up a unique data processing pipeline to process the
                                                                                                      results of all Indian elections since 1962 and make them freely
KEYWORDS                                                                                              available to researchers, journalists and the general public. Our
social database design; data visualization; web application.                                          dataset includes cleaned and harmonized electoral results published
                                                                                                      by the ECI, new primary variables (such as unique identifiers for all
ACM Reference Format:                                                                                 individuals contesting Indian elections), and integration with datasets
Mohit Kumar, Chinmay Narayan, Sudheendra Hangal, and Priyamvada                                       from other reliable sources such as the Association of Democratic
Trivedi. 2020. LokDhaba : Acquiring, Visualizing and Disseminating Data on                            Reforms (ADR), PRS Legislative Research and the Lok Sabha (the
Indian Elections. In ACM SIGCAS Conference on Computing and Sustainable                               lower house of the Indian Parliament). Over this period, we have
Societies (COMPASS) (COMPASS ’20), June 15–17, 2020, Ecuador. ACM,                                    managed to keep our dataset up to date, and absorbed the results of
New York, NY, USA, 11 pages. https://doi.org/10.1145/3378393.3402285
                                                                                                      over 20 state elections and one national election.
                                                                                                         Our data processing pipeline and data dissemination portal is
                                                                                                      called LokDhaba1 . The portal was designed by an inter-disciplinary
Permission to make digital or hard copies of all or part of this work for personal or                 team of computer scientists and political scientists, and is being used
classroom use is granted without fee provided that copies are not made or distributed
for profit or commercial advantage and that copies bear this notice and the full citation
                                                                                                      extensively by researchers2 and journalists3 working with Indian
on the first page. Copyrights for components of this work owned by others than the                    elections data. It was heavily cited by major news outlets across the
author(s) must be honored. Abstracting with credit is permitted. To copy otherwise, or
republish, to post on servers or to redistribute to lists, requires prior specific permission
and/or a fee. Request permissions from permissions@acm.org.                                           1
                                                                                                        In Hindi, Lok means people, and Dhaba means a roadside eatery, often frequented by
COMPASS ’20, June 15–17, 2020, Ecuador                                                                all sections of society
                                                                                                      2
© 2020 Copyright held by the owner/author(s). Publication rights licensed to ACM.                       See https://tcpd.ashoka.edu.in/research-publications/ for a list of research publications.
                                                                                                      3
ACM ISBN 978-1-4503-7129-2/20/06. . . $15.00                                                            See https://tcpd.ashoka.edu.in/press-articles/ and https://tcpd.ashoka.edu.in/data-
https://doi.org/10.1145/3378393.3402285                                                               quoted/ for a list of articles published by various media houses.

                                                                                                243
COMPASS ’20, June 15–17, 2020, Ecuador                                                                                             Kumar and Narayan, et al.

world for the Indian parliamentary elections in 2019, including by the           LokDhaba integrates the election results dataset from the ECI with
BBC and The New York Times. LokDhaba provides the cleaned and                    ADR’s affidavit database.
integrated data in a single portal at https://lokdhaba.ashoka.edu.in/.               The Constituency-Level Elections Archive (CLEA)[17], is the
The data can be freely downloaded and used for any purpose. Users                most comprehensive repository of detailed results for national elec-
can also visualize, bookmark and download data to analyze trends                 tions from around the world. There is also the Socioeconomic High-
over time and space.                                                             resolution Rural-Urban Geographic Dataset on India (SHRUG) [1]
   Our research contributions in this paper are:                                 dataset which contains indicators on demographic, socioeconomic,
                                                                                 firm and political outcomes from 1990-2013. And lastly, individual
    (1) We describe the data processing pipeline that we set up to               scholars too have also released partial datasets on Indian elections
        acquire, process, check and disseminate data. Along the way,             [3, 4, 6, 7, 12, 16, 23].
        we designed solutions to technical challenges that are likely                While many of the above datasets have been used to answer
        to be useful for any longitudinal dataset.                               questions of interest to specific researchers, the LokDhaba dataset
    (2) We shed some light on how to deal with poorly organized                  is more extensive and has undergone rigorous data treatment and
        government records in formats that drift over time. We illus-            consistency checking. It encompasses a comprehensive range of vari-
        trate how our resulting dataset was able to point out errors             ables; for example, it incorporates data about bye-elections, which
        in the original dataset that might otherwise have remained               are generally ignored by other datasets, and attempts to identify
        undiscovered.                                                            unique entities (such as individuals and parties) in the Indian politi-
    (3) We describe ways to enhance the value of the dataset, for                cal sphere. LokDhaba data is also freely available for any purpose.
        example, by resolving ambiguous terms, and by connecting it              LokDhaba allows users to build their own data visualizations, or use
        to other datasets.                                                       it’s API capabilities to use the data for any purpose.
    (4) Finally, we present an open source platform for political
        data dissemination and visualization that may be useful for
        any country with a First Past the Post system of electoral
                                                                                 3     DATA EXTRACTION ON LONGITUDINAL
        democracy.
                                                                                       DATA
   This paper is structured as follows: We begin with a discussion               The Election Commission of India provides a digitized archive of
of related work in the next section. In Section 3, we describe the               the results of all elections conducted by it from 1951 in the form of
data extraction process from the original data. Next, we describe                “statistical reports” on its website [24]. Statistical reports for previous
how we organize and extend the dataset. In Section 5, we discuss the             years were simply digitized from paper archives. Subsequent reports
web application and visualization framework used to disseminate the              have been born-digital, but are available as PDF files, with a few
data. Finally, we report some user feedback, and close by discussing             recent results in spreadsheet form. Each statistical report contains
the impact of our work.                                                          several sections. The most important and voluminous of these is a
                                                                                 section containing detailed constituency-wise election results. This
2    RELATED WORK                                                                section contains the official record of the election in that constituency
                                                                                 and includes the constituency number, names of contesting candi-
Various efforts have been made in the past to work on Indian election
results. Verniers and Jensenius provide a good primer on Indian                  dates, the party each represents, and the number of votes polled. It
election processes and the data generated by them, as well as the                also contains constituency-wide information such as the number of
utility of this data in political science [15]. The primary source of            voters and electors, the number of postal ballots, and the number of
data in this area is the set of verified statistical reports released by         invalid votes.
the ECI after every election [24]. Commercial services like Nielsen,
[27], I-PAC[29], Datanet India [18] and The Center for Monitoring
Indian Economy [11] use this data to generate political insights                 3.1    Format Drift
for their customers. Lokniti [5, 28], a research unit of Center for              As is often the case with longitudinal data, the formats in these
Study of Developing Societies (CSDS) also digitizes election results             statistical reports have drifted considerably over time. Entire sections
along with state and national level surveys; however, their data is              have appeared or disappeared in different years; data sections within
not openly available for downloading and analysis. While a few                   a page have moved relative to each other, or new fields have got
companies like India Votes [19, 26] publicly release party-wise or               introduced. Figs. 1 and 2 show the change in format between the
constituency-wise aggregates, their methods for obtaining, treating              1980 and 2019 statistical reports.
and updating data are opaque, and their data tends to be incomplete.                Sections of the source reports often duplicate information, which
   The Association for Democratic Reforms (ADR) digitizes manda-                 can lead to inconsistencies. (In database terms, they are non-normalized.)
tory affidavits filed by candidates and releases information on educa-           For examples, candidates marked as women in one section of the
tion, occupation, assets, criminal cases, and other individual level             report may be inconsistently marked as men in another section.
attributes on the MyNeta portal. This information on election candi-                There is also inherent complexity in the data, which needs to be
dates has led to a growth in the literature on corruption and elections          resolved manually. For example, periodic reorganization of Indian
in India [2, 8, 9, 33]. However, ADR’s data is not linked with the               states has led to renaming existing states or the creation of new states.
electoral performance of the corresponding individual and spans a                These issues can only be tracked manually; LokDhaba handles this
shorter time range since the affidavits are available only since 2004.           by keeping a small set of mapping files to capture this information.

                                                                           244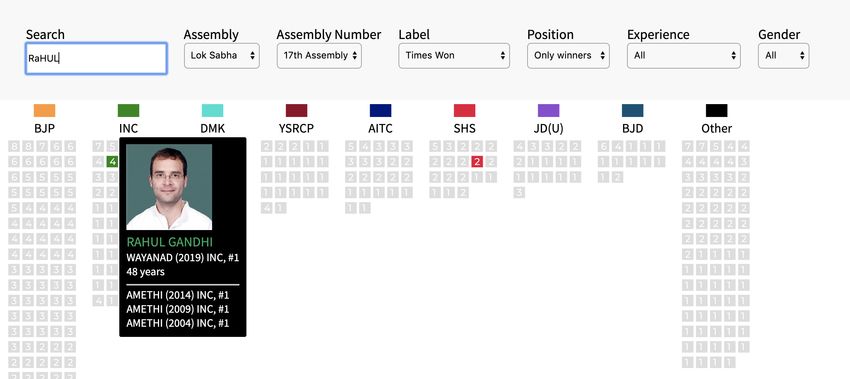
LokDhaba : Acquiring, Visualizing and Disseminating Data on Indian Elections                                          COMPASS ’20, June 15–17, 2020, Ecuador

                                                                                     electoral information about all the candidates in a given constituency.
                                                                                     We build the primary data about candidates by extracting and pars-
                                                                                     ing this section from 342 statistical reports corresponding to all the
                                                                                     elections held since 1962. (Elections in prior years had complicated
                                                                                     rules like multiple winners in a constituency, making it difficult for
                                                                                     our schema to cover them consistently.)
                                                                                        The structure of this results section varies across the statistical
                                                                                     reports in terms of table format and the information present in those
                                                                                     tables. Our high-level pipeline to extract, clean and parse this data is
                                                                                     shown in Fig. 3. This pipeline can be broadly divided into following
                                                                                     stages.

Figure 1: The Detailed Results section of the statistical report of
the 1980 parliamentary elections. The format drifts over time;
different reports have different variants of this format.

                                                                                                Figure 3: Electoral data extraction pipeline

                                                                                     3.2.1 PDF to text conversion. The first step is to use PDF-to-text
                                                                                     conversion tools (or optical character recognition tools in some cases)
                                                                                     to extract text from the PDF file. If the PDF file was created manually,
                                                                                     instead of scanning a paper file, the pdftotext utility [22] gives good
                                                                                     results and preserves the layout of the PDF during conversion.
                                                                                     3.2.2 Handling format drift. After converting the PDF file to text,
                                                                                     we need to parse the text to extract the data in appropriate columns
                                                                                     of a structured format. For this purpose, we initially started by devel-
                                                                                     oping custom parsers written in the Python programming language.
                                                                                     This needed to be done for 342 separate files across all elections.
                                                                                     However, the format drift in the tabular structure of these files makes
Figure 2: The Detailed Results section of the statistical report                     the job of the parser very difficult. Our parser needed a lot of special
of the 2019 parliamentary elections.                                                 case handling to handle format mismatches and this was not a solu-
                                                                                     tion that would scale and be maintainable in the long run. We have
                                                                                     observed that this is a recurrent problem in longitudinal datasets,
3.2     Data Extraction and Parsing Pipeline                                         and therefore it needs a generalizable solution.
To design a database for systematically collecting, analyzing and                       Our overall goal is to develop a family of parsers for a set of
expanding the data on Indian elections, we first needed to extract in-               related formats, in this case, related to Indian elections data. To
formation about constituencies and candidates from all the statistical               enable this, we have to come up with a set of parsing rules that
reports. The constituency-wise detailed results section contains the                 are closely tied to the domain and can be easily provided or vetted

                                                                               245
COMPASS ’20, June 15–17, 2020, Ecuador Kumar and Narayan, et al.
Figure 4: Sample parsing specification program and associated file to parse
by domain experts. It is not known how many different parsing Action Interpretation #Variants
specifications will be needed; hence, the specifications themselves extracts candidate de-
need to be iteratively developed as we discover their limitations. extractCandInfo(s) tails like name, gender, 3
In order to detect parsing failures, we need to incorporate a series age, party from string s
of consistency checks that pro-actively warn us of such failures, extracts constitutency
and allow us to develop new specifications or modify existing ones. details like constituency
extractConstInfo(s) 2
Consistency checks may be simple (a value in a certain column must type, constituency
be of a certain type) or compound (the values in two columns must number from string s
satisfy a certain relationship). extracts vote informa-
extractVoteDetails(s) 1
Our parsing framework consists of a simple, textually-specified tion from string s
but graphically-viewable programming language. This language extracts party informa-
captures the essence of the rules needed to parse the family of input tion like party acronym,
files. To develop these specifications, one can write a few simple extractPartyInfo(s) full name, party type 2
python functions, and does not need to know any parser generation (national or state) from
tools like lex or yacc. The ability to view the parsing specification string s
graphically makes it easy to understand for domain experts who may Table 2: Parsing actions
not be familiar with programming languages.
A program in our language is represented as a tuple S, G, A, L .
Here S is a set of parsing states, G is a set of guarding conditions, and
A is a set of text processing actions. L : S × G → S × A is a function
action specifies that the parser is on the verge of extracting candi-
that assigns a destination state and action to a source
state and a date demographic information like name, age, and gender from the
guarding condition. Specifically, s1 , g1 → s2 , a1 ∈ L implies
upcoming text. The third column of Table 2 represents the number
a state transition from s1 to s2 if the guarding condition g1 holds
of different variations of each parsing method to cover format drift
at s1 ; before completing this transition, the text processing action
across different input files. One example of this drift is a rearrange-
a1 is applied to the input data at s1 . Every guarding condition in
ment of the order of fields in candidate information. In some files
G can be of one of the types shown in Table 1. Further, every text
the candidate’s information follows the order of name, age, gender,
parsing action in A can be of one of the types shown in Table 2. Both
party, valid votes and total votes. In other files, the order of these
the guarding conditions and the parsing actions are fairly domain-
fields or the number of fields changed. Due to these issues we created
specific, but are easy to develop just once, since they refer to intrinsic
different variants of parsing functions. In all, just 8 parsing actions of
properties of the data. Hence, their definitions are relatively stable
four representative methods (extractCandInfo, extractConstInfo,
over time.
extractVoteDetails and extractPartyInfos) were sufficient to cover
Condition Interpretation all the format drift that we saw in 342 files.
true always holds true An example program in our specification language is depicted
startsWith(s) holds true if the line starts with s in Figure 4. This program is written to parse candidate information
endsWith(s) holds true if the line ends with s from a text file whose snippet is shown on the right. This snippet,
contains(s) holds true if the line contains string s taken from an actual ECI input file, shows the regularity in the struc-
ture of the content. It shows a set of lines, one for each candidate’s
Table 1: Guarding conditions
information, followed by a line representing aggregate information
(in red), and then followed by the start of information of another
constituency. The graphically depicted specification on the left side
The set A consists of parsing functions required to extract useful in Fig. 4 captures this regularity using two states s1 and s2 and the
information from a line of text. For example, the extractCandInfo transitions among them. The transition from s1 to s2 captures the
246LokDhaba : Acquiring, Visualizing and Disseminating Data on Indian Elections COMPASS ’20, June 15–17, 2020, Ecuador
fact that after the aggregate result line in the text snippet (in red) we greater than total voters, helped us narrow down errors due to scrap-
expect the file to contain a line for the information related to another ing misalignment. The data type checks helped us to identify missing
constituency (in green). The label contains("Constituency") => and incorrect values in bye-elections, missing candidate names in
extractConstInfo on this transition triggers a state change from s1 12 observations, missing votes for a candidate in 56 observations,
to s2 if the input line contains the string "Constituency". As a result incorrect constituency or candidate types, and missing gender values
of this transition, the parsing method extractConstInfo extracts the in 928 state assembly and 173 national assembly constituencies for
constituency information from the input line. Further, the fact that 9,104 candidates.
there are more than one candidates in a constituency and we need An important objective of our data extraction pipeline is to make
to extract candidate information for all of them is captured by a self the extraction and parsing process as repeatable as possible. This
transition from s2 to itself. It is to be noted that from a given state allows us to handle situations when a new version of the data is
more than one transitions can be triggered based on the input data. released, or when better tools become available (say, for OCR) or
In this scenario the execution of the parser is stopped with detailed even when we find a bug in our own tools or processes. Capturing the
information about the input line in that state. This information is parsing rules in about 20 high-level directives makes this possible,
then used to write a more precise specification of the parser so as to and is vastly preferable to performing various steps manually.
traverse only unambiguous transitions. Our parsing framework can be used in any situation where domain
This specification is passed to a Parser Execution Engine as shown experts and programmers need to work together to convert some
in Fig. 3. This engine takes a text file as an input and executes the source date into a structured format for further processing. It allows
parser specifications to generate a structured database file. Using non-technical users to effectively take part in the process of data
this approach, we were able to cover the parsing of 342 files by 20 extraction and parsing.
different parser specifications.
4 DATA MANAGEMENT AND INTEGRATION
3.2.3 Detecting parsing errors. An important step after getting
In this section, we describe how we organize our dataset extracted
parsed values from the parsing stage is to perform sanity checks
from the ECI’s statistical reports and integrate it with other datasets.
on them. Errors can get introduced at any of the previous stages of
The dataset has to be extendable since several new variables are
the extraction pipeline. For example, PDF to text conversion may
collected by domain experts or field researchers. For example, politi-
not be accurate. Or the parsing phase may wrongly assign the value
cal scientists often study data across a cohesive sub-region within a
of one column to another. During our initial development, it was
state in order to analyze results, trends and swings within such sub-
not unusual that a column like, say, ‘Gender’ would wrongly get
regions. Similarly, they may want to cross-reference this data with
mapped into the ‘Total Votes’ column. To detect such anomalies
data related to administrative units such as districts, and sociological
easily and refine our parser, we developed a consistency checking
data on candidates such as their caste, religion, and whether they
framework. This framework allows domain specialists to express
belong to a political dynasty.
sanity checks for the data in a simple and expressive manner. For
example, a person working with electoral data can specify that the
number of total votes polled in a constituency should be the sum total 4.1 Structuring Election Results
of all the votes polled in that constituency by individual candidates. The data extracted from ECI statistical reports is stored in relational
Consistency checks could also be applied to the type of values in a form, i.e., in several tables, that are almost fully normalized. To
column (a ‘Gender’ column can only contain the values ‘M’, ‘F’, or support analysts who may need the entire dataset on one screen,
‘O’, a ‘Votes’ column can only be a number greater than or equal to scripts are used to stitch the primary tables together and derive a
0), or specify constraints between columns. Any violation of such a single non-normalized dataset. In order to ensure repeatability in the
check indicates a data error has been introduced, and prompts the process, all updates are made only to primary files (under version
user to refine the specification or look closely at the source data. control), and all derived files are generated only from scripts.
Of course, some of these errors also represent an actual problem in
the source data and may require further analysis by a domain expert. 4.2 Primary and Derived Data
Some examples anomalies we observed in our source data were We now describe the schema of our primary tables. The candidates
changing of the type of a constituency within a delimitation (which electoral info table has candidate variables like candidate name,
is not expected; see Section 4.4.3), and more than one candidate sex, party, votes, and the constituency electoral info table has con-
from a party contesting in the same constituency. stituency information like constituency name , electors, voters, with
The consistency checks also helped us to identify special cases in the tuple election type, state name, assembly number, constituency
the data that we were unaware of. In constituencies of the Sikkim leg- number, poll number as a foreign key to each other.
islative assembly, we were not aware that the type of a constituency Using automated scripts, we also compute derived electoral vari-
could have the valid tag “BL”, which marks reservation of the con- ables useful in political analysis such as Valid votes, Turnout per-
stituency for selected backward classes. We were also able to find centage, Vote share percentage, Deposit lost, Vote margin, Margin
out missing results for constituencies. For example, the statistical percentage and ENOP4 .
report for the 7th Parliamentary assembly has data for only 2 con-
stituencies in Assam instead of the expected 10. Similarly, results
for Purnea constituency in Bihar were missing. Also, comparing 4
ENOP is the Effective Number of Parties, a common metric used by political scientists
total voters to electors in a constituency, as total electors have to be to estimate how healthy the competition is in a democracy
247COMPASS ’20, June 15–17, 2020, Ecuador Kumar and Narayan, et al.
Variables related to each individual’s political career like Number on a similarity metric designed specifically for Indian names. It
of times contested, Number of times won, Previous party, Last Con- handles phonetic matching, edit distance based clustering, expected
stituency, Whether incumbent/turncoat/re-contesting are calculated variations like initialization of first and middle names, and expected
with the help of the candidate’s unique identifier, as described in streaks of candidates contesting consecutive elections. Initially, each
Section 4.4.1 below. record in the dataset is given a unique ID and functionality to merge
records within or across clusters is implemented in the interface. A
4.3 Fragmented Elections and Bye-elections human analyst merges or unmerges records based on her knowledge,
While people intuitively associate elections with a specific year (e.g. along with secondary research on every candidate and constituency.
the 1991 national elections, the 1996 state elections, etc.). the year Surf’s user interface makes certain operations in this research easier,
can be a misleading way of relating sets of elections. For example, such as mapping place names and searching for news about a can-
the 1991 national elections in India were not conducted in one state didate. This work has helped us create a unique identifier for every
(Punjab) due to law and order reasons; elections in Punjab to the candidate who has contested any election in the dataset.
same parliamentary House were actually conducted in 1992. Further, 4.4.2 Political Parties. A similar problem is that statistical reports
in the Indian election system, a bye-election is called when a seat often use abbreviations to indicate a candidate’s party. However, the
becomes vacant due to death, resignation or disqualification of an abbreviations given to parties in the source dataset across elections
incumbent. This bye-election election data is provided separately by are inconsistent, making it difficult to track party performance over
the ECI and is released separately from the statistical reports[14]. time. The same parties have been assigned multiple abbreviations,
Bye-election data until 1995 is available as a single spreadsheet with for example, Bharatiya Janata Dal (BHJD, BAJD, BajD, BhJD),
multiple worksheets for national and state elections [13]. Results Aam Aadmi Party (AAAP, AAP), All India Anna Dravida Munnetra
from 1996 to 2008 are released as HTML pages, and results from Kazhagam (ADK, ADMK, AIADMK, AIDMK), Indian National
2009 onward are released as Microsoft Excel files with results for Congress (CONG, INC, INC(I), CON) and so on, for over 300
each constituency in different worksheets. Once again, we see the parties. The same abbreviation is also given to two different parties
presence of format drift. As a result of the difficulty of dealing with ad different times, for example AAP (Aam Aadmi Party, Awami
disparate formats, bye-election data is rarely factored into political Aamjan Party), BJS (Bharatiya Jan Sabha, Bharatiya Jana Sangh,
analyses. However, for the purpose of calculating important met- Akhil Bharatiya Jana Sangh). Considering the inaccuracies this could
rics related to incumbency (the number of sitting members who lead to in aggregating party-wise data, we assign a unique identifier
re-contested, and were elected or lost), it is essential to know the for each party using the same technique used for resolving names
sitting members at the end of an assembly’s term, and therefore, to described in the previous section [20, 21].
handle bye-election data.
To handle all these cases and merge them into a single table with 4.4.3 Electoral Constituencies. In India, a Delimitation Commis-
a consistent schema in LokDhaba, we associate sets of elections with sion periodically reorganizes boundaries of electoral constituencies
assembly (i.e., legislative house) numbers instead of years. There- to account for changes in population as measured by the decadal
fore a particular election in a particular constituency is identified Census of India. Four major delimitations have been made so far,
by a tuple of (“Assembly Number”, “State Name”, “Constituency in 1952, 1962, 1972 and 2002, along with amendments in 2001,
Number” and “Poll Number”). The variable “Poll Number“ is used 2003 and 2008. In each delimitation, two thirds of the constituen-
to accurately record bye-elections data. Increasing Poll Numbers cies for a state are reorganized. This also means a reassignment of
represent successive elections for a seat in a given assembly. constituency numbers and names. As such, there is no authoritative
way to map constituencies across delimitations. As described later,
4.4 Unique Identifiers for Names this requires us to assign a unique identifier for each constituency to
Many political science questions require identifying the trajectory analyse spatial characteristics with respect to an older time period.
of entities such as parties, candidates and constituencies over time.
This needs us to be able to assign unique identifiers to these entities, 4.5 Integration with Other Datasets
when none exist in our source data. 4.5.1 Affidavit Data. Beginning in 2004, it is mandatory for every
election candidate in India to file an affidavit declaring information
4.4.1 Election Candidates. To be able to study the career trajec-
such as their address, education, profession, spouse, criminal cases
tory of every individual candidate, we need a unique identifier for
and financial assets. This data is digitized by the Association of
each person across time – something that the source datasets do not
Democratic Reforms (ADR) and is disseminated on their website
include. This is a complex task because the spelling of the Candidate
[10]. We scrape this data and integrate it with the elections dataset.
Name field in the dataset can be the same for two different individu-
After resolving inconsistencies in candidate names and parties, new
als and can be different over time for the same individual. Candidates
candidate-level primary tables are created with structured fields for
switch parties and constituencies between elections and it is not pos-
this affidavit data.
sible to use the existing set of variables to make a unique identifier
for any single individual. For this reason, a human-in-the-loop entity 4.5.2 Pictures. In order to aid visualizations of candidate perfor-
mapping and resolution system for Indian names called Surf [31] mance, we use the pictures of electoral winners that are available
was designed and implemented to assign a unique identifier for each from the website of PRS Legislative Research, a think-tank that
individual candidate. Surf clusters records based on a resolution tracks performance of legislators. See Fig. 11 for an example of how
variable, which is Candidate Name in the current context, based these pictures are used.
248LokDhaba : Acquiring, Visualizing and Disseminating Data on Indian Elections COMPASS ’20, June 15–17, 2020, Ecuador
4.6 Maps described in the previous section are converted into an SQL data-
In this section, we describe some of the challenges of dealing with base that provides the model. This database is exposed through a
geo-spatial data, required for map visualizations built upon our Python API, and a React-based framework is used for fast rendering
dataset. In India, state-level constituencies are properly nested and of visualizations with client-side filtering.
contained within national constituencies. The present constituency The main ways for an end-user to interact with the data are the
boundaries at both levels were specified in the 2008 delimitation. following:
Unfortunately, official spatial boundaries are not made available • Browse and Download Data: the user can explore and down-
in digital format by the delimitation commission. A group called load the dataset online.
Datameet has developed a novel solution to this problem – it scraped • Data Visualization: the user can build charts and maps to
the GPS locations of the polling stations in the 2014 election, and visualize election results from a political science perspective.
derived approximate constituency boundary maps based on this • Incumbency profile: the user can explore the career per-
data [32]. We adopted these maps as a starting point and applied formance of election candidates using a novel visualization
consistency checking to detect potential problems. interface.
There are a total of 543 national-level and 4120 state-level con-
stituencies. We identified inconsistencies by comparing each con-
5.1 Data Preparation
stituency on area, neighbourhood and mapping of state-level con-
stituencies to the national-level constituency they were contained The front-end access to LokDhaba is characterized by read-only
in. This process helped us find problems with incorrect borders or operations. LokDhaba uses a MySQL database to store and retrieve
missing constituencies in the original maps. We cross-referenced data efficiently. Pre-computed tables are stored for assembly, con-
boundary polygons from the Datameet maps with constituency-wise stituency, party and candidate level tables to provide quick visualiza-
listings from election results. We observed that a few urban con- tions in the front-end.
stituencies were missing. Consistency checks on the area of each An API based on representational state transfer architecture (REST)
constituency also helped us identify some constituencies with sus- is implemented in Python as the interface between the React-based
piciously low area, for example, less that one square kilometer. For front-end and the database. Various pieces of functionality are de-
missing or inconsistent constituencies found in the above steps, we signed as React “routes” to get data for different visualization inputs,
derived the correct shapes using manual digitization of the respec- constituency boundaries, paginated browsing and download. The
tive sub-districts, villages and municipal wards. The geometries of API receives inputs from the user interface via POST requests, cre-
resulting boundaries are simplified further to remove overlaps and ates parameterized SQL queries to extract data from the database,
holes between polygons. and sends it back as JSON objects.
5.2 User Interface
4.7 Data Provenance and Management
The main components for the user interface are as follows.
To store data and manage updates to our database, we use a git
repository which stores all versions of all primary files and scripts. 5.2.1 Browse and Download Data. While LokDhaba incorporates
Data files are stored in CSV format, allowing efficient storage of several visualizations, it is important to enable users to download
revisions of the data, and ensuring no lock-in to any proprietary the raw or filtered datasets to perform their own analysis. It is also
format. Revision control also allows us to track changes down to important for users to zoom in to a specific row in the table if they are
the time and person responsible for the change, and to roll back to interested in a particular election, or a particular candidate, etc. The
any version if necessary. LokDhaba follows an Engineering Change Browse and Download component is designed for viewing, filtering,
Order (ECO) process by which each change has to be first vetted by and sorting raw data for any election. The user selects election type
multiple people before it is introduced in the primary dataset. This and state name, and multiple assemblies of the selected state to
ensures that the data quality remains fairly high. view election results. She can also download raw data, filtered down
LokDhaba has scripts that compute derived data from primary based on any criteria, as a comma separated values (CSV) file. This
data dynamically. To alert us to any loss in data quality, data con- component uses a react-table component to render a large number of
sistency checking scripts run nightly as a cron job. The process for rows as a paginated table. It also supports quick, client-side filtering
extracting data from affidavits and results is also automated using and sorting.
scripts, ensuring that we can re-import data from some source, if and Fig. 5 shows a screenshot of the browse data component with
when it changes. This ensures the repeatability of our process. results for the 2019 Parliamentary elections. Note that the position
is filtered to 1, so as to list only winning candidates. Users can also
filter by any other value on different columns.
5 DATA DISSEMINATION
In addition to extracing and organizing the dataset, we designed 5.2.2 Data Visualization. To implement visualizations in LokD-
a web application with which a user can browse and visualize the haba, we interviewed political scientists and analyzed media reports
data on-demand. The user can download various versions of the to see which visualizations would be the most useful. Based on this
dataset and visualize the political variables spatio-temporally. Keep- analysis, we designed the following time-line charts and visualiza-
ing scalability and consistent user experience in mind, LokDhaba is tions which can be created on-demand by the user for any set of
implemented with a model-view-controller architecture. The tables elections.
249COMPASS ’20, June 15–17, 2020, Ecuador Kumar and Narayan, et al.
Figure 6: LokDhaba visualization of parties contested and rep-
resented in national elections
Figure 5: Browse data to show all position 1 candidates of the
2019 Parliamentary election
(7) Vote share of winners: a heat map of the vote share percent-
age of the winner in each constituency.
(1) Voter turnout: male, female and total voter turnout percent- (8) Party-wise positions: a heat map of the rank of the specified
ages. party’s candidates in each constituency.
(2) Party vote share (contested): vote share percentage of main (9) Party-wise vote share: a heat map of the vote share percent-
parties for seats they contested. (Not all parties contest all age of the specified party’s candidates in each constituency.
seats, especially in the presence of seat-sharing agreements.) (10) NOTA vote: a heat map of the NOTA (None of the Above)
(3) Party vote share (all seats): vote share percentage of the vote share percentage in each constituency.
main parties across all seats.
The data visualization component is designed to visualize aggre-
(4) Party seat share: seat share percentage of the main parties.
gated statistics at a temporal or spatial level. The user selects election
(5) Parties contested and represented: number of parties that
type, state name, visualization, and visualization specific variables
contested and number of parties that got at least one candidate
to be charted or mapped. The individual visualization components
elected.
take returned data from the API to render charts in react-plotly and
(6) Candidates contested/deposit lost: number of candidates
maps in react-leaflet.
who contested the election and number of candidates who
Some screenshots of the visualization components are shown in
lost their deposits.
Figs. 6 to 9. Fig. 6 shows the timeline of parties contested and parties
To enable spatial exploration of election results, we came up with represented over all national assembly assemblies as a bar chart. Fig.
the following set of maps5 . The maps fall into two basic categories: 7 shows the vote shares of the “main” parties6 .
heat maps showing the intensity of a variable (e.g., vote share of Figure 8 shows a heat map of vote shares of candidates from
a party), and categorical maps used to indicate spatial distribution the BJP party in the 17th Parliamentary elections. Fig. 9 shows the
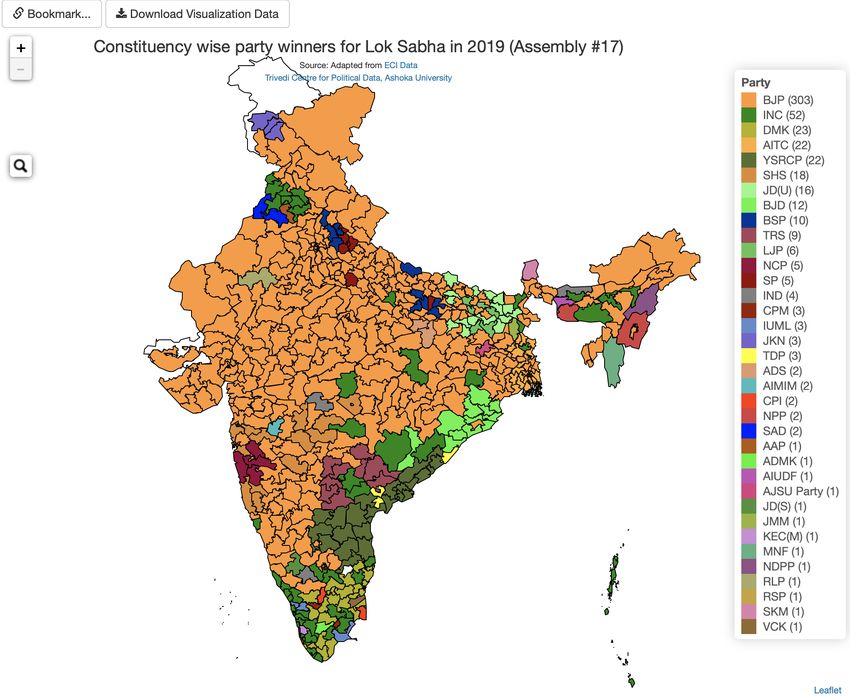
(e.g., winning party across space). constituencies of elected members to the 17th Parliament, color
(1) Constituency type: different colors for constituency type, a coded by party.
field which can be one of (1) General (open for any one to
contest), (2) SC (scheduled caste candidates only) or (3) ST 5.2.3 Incumbency profile. Indian elections feature candidates who
(scheduled tribe candidates only). frequently cross over between parties. Candidates’ affiliations to
(2) Number of candidates: a heat map showing number of can- parties tend to be based on pragmatic rather than ideological consid-
didates contesting in each constituency. erations. There is a steady stream of parties splitting and merging,
(3) Voter turnout: a heat map of the voter turnout percentage in pre-poll and post-poll coalitions, or candidates crossing over from
each constituency. one party to another. There is often an anti-incumbency wave, mean-
(4) Winners by party: party-wise coloring for the winning party ing that a ruling party or legislator may have a disadvantage as voters
in each constituency. Parties are mapped to color that are blame them for poor governance. Assignment of tickets within a
naturally associated with them, using a small color mapping party is also an opaque process, with some parties tending to fa-
file. vor loyalists, while others preferring to rotate their candidates. It is
(5) Winners by gender: gender-wise coloring for the winner in therefore very interesting for political scientists to trace the trajec-
each constituency. tory of individual candidates, and ask who gets nominated, elected,
(6) Victory margin: a heat map of the difference between the re-nominated, re-elected, etc.
winner and first runner-up in each constituency. LokDhaba includes a visualization showing career performance
of elected members or contestants of a specific assembly. In this
5
As shape files for pre-2008 elections are not available, the current version of LokDhaba
6
has maps only for elections post-2008. Parties in the top two positions by seat share in any previous election.
250LokDhaba : Acquiring, Visualizing and Disseminating Data on Indian Elections COMPASS ’20, June 15–17, 2020, Ecuador
Figure 7: LokDhaba visualization of party vote shares in na-
tional elections
Figure 9: Visualization of the winning party in the 2019 national
elections
Figure 8: Visualization of constituency-wise vote shares of BJP Figure 10: Incumbency profile of the 2019 national election win-
candidates in the 2019 national elections ners
visualization, the user can see the complete record of each contestant,
such as their current and previous party affiliations and electoral
performance. This component is designed to enable the user to
view all elected and major-party candidates clustered together by
party, while also depicting their party affiliation in the immediately
preceding assembly, in order to identify turncoats. Winners and
losers are represented by shape, and the shape can be annotated
with a single number, either the candidate’s number of attempts, or
the number of their victories. Upon hovering on a shape, users can
view prior contest information and a photograph of the candidate. A
search function enables the user to narrow down to a specific person Figure 11: Viewing a candidate’s details
or constituency of interest. Users can also filter down by gender or
experience, in order to focus on specific subsets of the candidates.
Fig. 10 shows a snapshot of the winners of the 2019 Parliamentary resulting information on Mr. Rahul Gandhi of the Indian National
elections. Fig. 11 shows the search for the name "Rahul" and the Congress.
251COMPASS ’20, June 15–17, 2020, Ecuador Kumar and Narayan, et al.
6 USER FEEDBACK Finally, data on bye-elections has been an important but neglected
To get a sense of the usability of LokDhaba, we conducted a survey part of the electoral process. Bye-elections can now be empirically
with expert political scientists and journalists who have used LokD- studied and evaluated along with the main elections.
haba7 , and received 13 responses. Most users report using LokDhaba
for research purposes (63.6%). Unsurprisingly, close to half of our 7.3 Training and Outreach
respondents use the platform around the time of an election (45.5%). LokDhaba also enables several initiatives which we broadly classify
They report downloading more charts (90%) than maps (54.5%). as outreach. The first is as a source of data for other data dissemi-
Most users prefer working on LokDhaba on a computer rather than nation initiatives. We are aware of at least two repositories - Jaano
a mobile device (81.8% and 36.4% respectively). Most users report India8 and the Constituency-Level Election Archive (CLEA) at the
that it is easy for them to browse the data (81.9%). However, only University of Michigan9 - that use the data provided by LokDhaba.
63.6% of the users agreed that the visualizations are effective and An unexpectedly pleasant use of LokDhaba has been for instruc-
only 54.5% report that the incumbency profile is intuitive. tion in the classroom and for training inter-disciplinary students.
Google Analytics statistics for the period May 2019-2020 (when LokDhaba is used to train and encourage students to think criti-
there was a national election) showed that there were 10,284 unique cally about data, spot anomalies, and analyze long-term patterns and
users, with 15,383 sessions. Most of the traffic comes to LokDhaba trends. It is used during lectures in classes and in an annual summer
directly (73.95%), followed by organic search (12.42%), followed school attended by undergraduate and post-graduate students, pro-
by social channels like Twitter or Facebook (10.66%), and referrals fessionals and journalists. Our outreach demonstrates to our partners
from other media sources (3%). 89% of users are from India, 5% that building datasets is a non-trivial process and requires careful
from the United States, and 2% from the United Kingdom. The rest work in all phases of the data lifecycle.
are from Singapore, Canada, France, U.A.E, Germany and a few
other parts of the world. 8 FUTURE WORK
The LokDhaba dataset is being continually updated and is expanding
7 CONCLUSIONS AND IMPACT in terms of integration with other datasets. We plan to build more
In this paper, we have described the challenges encountered in as- map-based visualizations, including some that allow longitudinal
sembling and maintaining a high-value longitudinal dataset. We have comparison of results (e.g., vote share of parties across successive
proposed some solutions, including new tools and best practices to elections). We also need to improve our mapping infrastructure and
meet these challenges that we hope will be useful in other domains get more authoritative sources of geo-spatial data. We welcome
as well. collaboration with groups that need to work with election results
Apart from research contributions, LokDhaba has had substantial data.
impact on the state of the practice. We describe some of these impact
areas below. ACKNOWLEDGMENTS
We thank the Trivedi Centre for Political Data team: Saloni Bhogale,
7.1 Application Basim-U-Nissa, Kirti, Venkat Prasath, Rajkamal Singh, Sudesh
The first contribution to the practice is that of an open source appli- Singh, Shivangi Tikekar, and Gilles Verniers, as well as Francesca
cation with a simple user interface to browse and visualize electoral Jensenius, for useful inputs in the design and implementation of
data. The data as well as the web application is freely available for LokDhaba.
download. The LokDhaba application code is maintained as a freely
accessible open source git repository[30] and can easily be used for REFERENCES
other electoral datasets with a First Past the Post system. [1] Sam Asher and Paul Novosad. 2019. Socioeconomic High-resolution Rural-Urban
Geographic Dataset for India (SHRUG). https://doi.org/10.7910/DVN/DPESAK
[2] Rikhil R Bhavnani. 2012. Using Asset Disclosures to Study Politicians Rents: An
7.2 Study of Indian Elections Application to India. In Annual Bank Conferences on Development Economics,
Washington, DC, Vol. 22.
LokDhaba makes several key contributions to the study of Indian [3] Rikhil R Bhavnani and Francesca Refsum Jensenius. 2015. Socio-economic
elections. The first is that it pulls together information from multiple Profiles for India’s Old Electoral Constituencies: 1971 and 2001.
[4] Harry W Blair. 1973. Minority electoral politics in a North Indian state: aggregate
sources with varying formats. Building from ECI’s statistical reports, data analysis and the Muslim community in Bihar, 1952–1972. American political
LokDhaba has variables at both the constituency and candidate level. science review 67, 4 (1973), 1275–1287.
We have also integrated these with data on individuals’ assets and [5] Shankar Bose and VB Singh. 1987. State elections in India: Data handbook on
Vidhan Sabha elections 1952-85.
crime records. In the future, we expect to bring together several [6] Paul R Brass. 1978. Indian election studies. South Asia: Journal of South Asian
indicators of social and political behavior, with the aim of enabling Studies 1, 2 (1978), 91–108.
[7] Kanchan Chandra. 2016. Democratic dynasties: State, party, and family in con-
more research on political candidates. temporary Indian politics. Cambridge University Press.
Secondly, through the assignment of unique identifiers, we are [8] Bikash Chandra Dash. 2004. Civil Society Initiatives and Electoral Reforms.
able to track both politicians and political parties over time and Economic and Political Weekly (2004), 4136–4137.
[9] Raymond Fisman, Florian Schulz, and Vikrant Vig. 2016. Financial disclosure
space. Researchers can now ask a wider array of questions about the and political selection: Evidence from India. Unpublished manuscript, Boston
career trajectory of politicians, when they defect, to which party and Univ (2016).
their subsequent performance. [10] Association for Democratic Reforms. 2019. MyNeta Website. https://myneta.info
8
https://jaanoindia.swaniti.org/
7 9
Susmeet Jain and Keshav Joshi led the pilot study. http://www.electiondataarchive.org./
252LokDhaba : Acquiring, Visualizing and Disseminating Data on Indian Elections COMPASS ’20, June 15–17, 2020, Ecuador
[11] Center for Monitoring Indian Economy. 2000. CMIE: Economic Overview. [22] Derek Noonburg. 1995. xpdfreader. https://www.xpdfreader.com/pdftotext-
[12] Oliver Heath and Adam Ziegfeld. 2018. Electoral Volatility and Turnout: Party man.html
Entry and Exit in Indian Elections. The Journal of Politics 80, 2 (2018), 570–584. [23] Irfan Nooruddin and Pradeep Chhibber. 2008. Unstable politics: fiscal space and
[13] Election Commission if India. 1995. Bye-elections results 1952-1995. https: electoral volatility in the Indian states. Comparative Political Studies 41, 8 (2008),
//eci.gov.in/files/file/2511-details-of-bye-elections-from-1952-to-1995/ 1069–1091.
[14] Election Commission if India. 2019. Detailed Bye-elections results. https: [24] Election Commission of India. 2019. Statistical Reports to parliamentary and
//eci.gov.in/statistical-report/detailed-bye-election-results/ assembly elections in India. https://eci.gov.in/statistical-report/statistical-reports
[15] Francesca R Jensenius and Gilles Verniers. 2017. Studying Indian politics with [25] Shahabuddin Yaqoob Quraishi. 2014. An undocumented wonder: The great Indian
large-scale data: Indian election data 1961–today. Studies in Indian Politics 5, 2 election. Rupa Publications.
(2017), 269–275. [26] Mahendra Singh Rana. 2006. India Votes: Lok Sabha & Vidhan Sabha Elections
[16] Vadim Kagan, Andrew Stevens, and VS Subrahmanian. 2015. Using twitter 2001-2005. Sarup & Sons.
sentiment to forecast the 2013 pakistani election and the 2014 indian election. [27] Nielsen Media Research. 1993. Nielsen Tunes in to Politics: Tracking the Presi-
IEEE Intelligent Systems 30, 1 (2015), 2–5. dential Election Years (1960-1992). Nielsen Media Research.
[17] Ken Kollman, Allen Hicken, Daniele Caramani, David Backer, and David Lublin. [28] Sandeep Shastri, Kondaveeti Chinnaya Suri, and Yogendra Yadav. 2009. Elec-
2011. Constituency-level elections archive. Ann Arbor, mich.: Center for Political toral politics in Indian states: Lok Sabha elections in 2004 and beyond. Oxford
studies, University of michigan. At http://www. electiondataarchive. org, accessed University Press.
may (2011). [29] Sanjeev Kumar Singh. 2018. ELECTION CAMPAIGN MANAGEMENT
[18] Datanet India Private limited. 2019. India Electoral Data. https://www. SERVICES–A START OF NEW ERA IN INDIAN POLITICS. (2018).
electionsinindia.com/ [30] TCPD. 2020. Github repository for the Lokdhaba framework. https://github.com/
[19] Niti Digital Pvt. Ltd. 2019. India Votes : India‘s largest election database. http: tcpd/LokDhaba_JS
//www.indiavotes.com/ [31] TCPD. 2020. Github repository for the Surf codebase. https://github.com/tcpd/surf
[20] B. Nissa and M. Kumar. 2019. Notes on methods, identifying and analysing [32] Datameet Trust. 2019. Github repository for open maps. Bangalore, India.
political parties in Indian elections (working paper). (2019). https://github.com/datameet/maps
[21] M. Kumar Nissa, B. and S. Housekeeper. 2019. Factions and mergers in the Indian [33] Milan Vaishnav. 2017. When crime pays: Money and muscle in Indian politics.
Party System - Evidence from Indian General Elections. (working paper). (2019). Yale University Press.
253You can also read