Roading Asset Maintenance Cost Guidelines - VERSION 1 JUNE 2012
←
→
Page content transcription
If your browser does not render page correctly, please read the page content below
Roading
      Asset
Maintenance
       Cost
 Guidelines
    VERSION 1 § JUNE 2012
Roading
Asset
Maintenance
Cost
Guidelines
VERSION 1 § JUNE 2012
Wayne Hatcher
Ewan Hunter
Ken Mitchel
Opus International Consultants Ltd
© RIMS Committee 2012ABBREVIATIONS BCR Benefit Cost Ratio dTIMS deighton Total Infrastructure Management System FWP Forward Work Program GIS Geographic Information System GPS Government Policy Statement IDS Infrastructure Decision Support IRI International Roughness Index km kilometre KPI Key Performance Indicators KPM Key Performance Measures LGA Local Government Authority LOS Level of Service LTCCP Long Term Council Community Plan MCI Maintenance Cost Index NPV Net Present Value NZTA New Zealand Transport Agency PA Pavement PBC Performance Based Contract PCI Pavement Condition Index RCA Road Controlling Authority SHAM State Highway Asset Manual SU Surface VKT Vehicle Kilometres Travelled ROADING ASSET MAINTENANCE COST GUIDELINES § VERSION 1 5
Contents
Abbreviations		                                           5

1.   OVERVIEW		                                           9

2.   MAINTENANCE CORE PROCESSES                          10
     2.1    Roles and Responsibilities                   10
     2.2    Maintenance Activities                       11
     2.3    Types of Maintenance Activities              11
     2.4    Process and Focus–Physical Work Management   12
		          2.4.1   Advanced Road Asset Management       13

3.0 MAINTENANCE ACTIVITY                                 14
     3.1    What Is Recorded and Why                     14
     3.2    Inputs		                                     14
     3.3    Optimising Maintenance                       15
     3.4    Asset Condition                              17
		          3.4.1   Deferred Maintenance                 17
     3.5    Maintenance Activity Management              18
     3.6    Data Capture                                 18
     3.7    Data Capture Systems                         19
     3.8    Quality Assurance                            19
     3.9    Data Ownership                               20
     3.10   Data Format                                  20
4. USING DATA 21
4.1 Data Analysis 21
4.2 Analysis Methods 22
4.3 Summary Analysis 24
4.3.1 Scheduling Road and Footpath Maintenance 24
5.0 ADVANCED ANALYSIS METHODS 25
5.1 Data mining 25
5.2 Spatial Data 25
5.3 Clustering 26
5.4 Predictive Modelling (dTIMS) 27
5.5 Markov Matrix 30
6. CONCLUSION 31
7. REFERENCES 31
8. REFERENCES 32
APPENDIX 1 35
APPENDIX 2 38
ROADING ASSET MAINTENANCE COST GUIDELINES § VERSION 1 71. Introduction
Improved road asset management depends on collecting reliable data about routine reactive network
maintenance costs and quantities, and applying generic approaches for gathering, analysing and
applying information from maintenance cost data.
The New Zealand Roading network consists of 93,910 km. There are 10,908 km of state highway and
83,001 km of local roads; 61,878.60 km are sealed (65.9%). The 2009 NZ Transport Agency (NZTA)
network statistics for maintenance and operational costs are summarised in Table 1. Typically
roading accounts for more than 50% of local government budget investment.
Table 1 – 2009 Maintenance and Operation Cost Summary
km Maintenance and Operational Cost $/km
Local Roads 83,002 $ 238,243,791 $2,870.34
State Highway 10,908 $ 319,803,780 $29,318.28
Total 93,910 $558,047,571
Asset management seeks to use all known data sources to inform robust decisions about asset
maintenance and renewal. Minimising the asset’s whole of life costs while maintaining a prescribed
level of service is the objective. Robust historic reactive maintenance cost data is a critical component
to make informed asset management judgements.
Data collection and data management principles and electronic tools are well established and
continuing to develop. Advances in computing technology, asset management systems, mobile
devices and connectivity make it easier to review and record operational maintenance activity in an
operationally timely way. They also improve the way asset management data is shared. Nonetheless,
clear roles and responsibilities need to be defined to ensure data quality is maintained. Changes in
operational practice have also allowed greater visibility of the network’s activity and maintenance
status, which enables streamlined fault, asset, and financial management. The information
management demands sometimes require different staff skills or training in the asset management
process.
>> Care should be taken at all stages to consider if data is appropriate, and particularly that
no unrealistic data has crept into the maintenance costs.
ROADING ASSET MAINTENANCE COST GUIDELINES § VERSION 1 92 Maintenance Core Processes
2.1 ROLES AND RESPONSIBILITIES
Road asset management involves ensuring corporate asset management goals, objectives and legal
obligations are met. In road network maintenance operations there should be defined maintenance
standards and strategies which support this intent. The basic cost and activity information being
recorded accurately and consistently is a significant benefit and value to the asset’s overall
management. It is generally a feature of the maintenance contract’s administration and deliverables.
Figure 1: Road asset deterioration and the impact of maintenance activity interventions.
Excellent Decay in condition (deterioration)
Asset Condition
Condition
improvement
(reset)
Minimum acceptable standard
Treatment applied
Poor
Time
Staff, consultants, and contractors involved in collecting and collating maintenance data need to
understand the reasons it is being collected and the potential value the data adds to the overall
asset management process. This makes it possible for innovation to be identified at all levels of the
maintenance process, and improves the likelihood of a quality outcome. Communication between
the participants should be open enough to consider the merits of innovation and new options within
a contract. Road Controlling Authorities (RCA) need to ensure the maintenance data is checked for
accuracy regularly by a designated trained person. The quality of analysis is heavily dependent on
the data quality and timely availability for decision making. Maintenance cost data should be verified
against claimed activity prior to payment as part of standard contract process.
With the increase in maintenance management systems and the range of maintenance cost data
available, there is more demand for the skills to turn the data into useful information. Engineering
science as a discipline has the mix of engineering and data skills needed to add value to organis-
ations seeking to make more use of large and sometimes complicated data sets for front line asset
managers.
10 ROADING ASSET MAINTENANCE COST GUIDELINES § VERSION 12.2 MAINTENANCE ACTIVITIES
Road asset maintenance strategies need to consider how the asset will be maintained during its
life before it is rebuilt. Roading assets are maintained to delay the future date at which expensive
capital replacement would occur. Levels of Service (LOS) are set to determine the asset’s acceptable
performance levels, which vary according to a road’s role and utilisation. A road asset’s deterioration
(decay in condition) and the impact of maintenance activity interventions necessary to sustain it are
illustrated in Figure 1.
Maintenance intervention activity produces an improvement in asset condition which raises the
remaining condition level of the asset above the minimum acceptable level. Depending on the
initial construction and maintenance strategies adopted, the asset can be sustained but at some
point rehabilitation (reconstruction) is required. Understanding the point where the economic and
service benefits of rehabilitation exceed the maintenance strategy’s ongoing costs and performance
limitations is an important asset management function. This requires tracking the extent, nature and
location of network maintenance.
2.3 TYPES OF MAINTENANCE ACTIVITIES
Measured activities are the most relevant input to future maintenance management decisions,
particularly pavement and surfacing activities. Road asset maintenance is broken into categories1.
§§ Pavement (PA), generally resulting from the pavement’s structural performance
§§ Surfacing (SU), from the surfacing layer’s performance e.g. stripping and flushing
§§ Shoulder maintenance
§§ Drainage maintenance
§§ Minor structures/retaining walls
§§ Other.
Activities associated with the highway verge such as vegetation control, signs and delineator
maintenance are often cyclical in nature and driven by levels of service arising from outside
influences. Cyclical maintenance items are commonly contracted on a per kilometre or area basis
rather than as individual items. Historically, drainage, shoulder and pavement (e.g. potholes)
maintenance components have been managed on a cyclic basis. There is a strong trend toward
maintenance activity managed on measured (e.g. m2) or each (ea) basis in modern maintenance
contracts to better identify where costs are incurred on the network.
1
www.nzta.govt.nz/resources/state-highway-asset-management-manual/SM020.html
ROADING ASSET MAINTENANCE COST GUIDELINES § VERSION 1 112.4 PROCESS AND FOCUS – PHYSICAL WORK MANAGEMENT Maintenance work carried out on roading assets requires effective management and accurate contract records with respect to the activity’s nature, extent, cost and location. Maintenance management contracts should define the work’s accurate measurement, coding, recording, and the way it links to the basis for payment. Maintenance contracts should be structured to cover all aspects of these processes and the timely provision of maintenance cost data to the client RCA. Supplying maintenance services (internal or external) to a RCA requires the following base maintenance activity data to be collected as part of the contract: §§ What work was done §§ How much work was done §§ Where the work was done §§ When it was done §§ Why it was done. Typical contracts used to procure maintenance activities for roading management in New Zealand are: §§ Alliances – special arrangements in which groups of organisations combine in partnership and work together. For example, an alliance is currently contracted to operate and maintain the Auckland motorway network in a long-term agreement that began in 2008. §§ Performance-specified contracts – awarded for 10 years to single suppliers who are responsible for providing all services. There are five such contracts operating in New Zealand, including one for maintaining the Auckland Harbour Bridge. Most resurfacing is done under performance- specified contracts. §§ Hybrid contracts – awarded for five years and involve consultants and contractors working in a partnering arrangement to deliver services. §§ Traditional contracts – awarded for varying terms and involve consultants managing suppliers who deliver physical works on the road network, in a similar way to traditional road engineering construction contracts. Most pavement strengthening works and bridge repairs are managed through this type of contract. 12 ROADING ASSET MAINTENANCE COST GUIDELINES § VERSION 1
2.4.1         Advanced Road Asset Management

Advanced asset management requires additional activity status information to increase the
usefulness of data. Examples include:
§§ Already completed maintenance
§§ Maintenance currently being completed or under action
§§ Maintenance programmed for future completion in the Forward Work Programme (FWP)
§§ Deferred maintenance: existing maintenance needs that have not yet been programmed for future
   completion.
If a road asset receives ongoing maintenance inspections and remedial work, the presence, type
and extent of maintenance activity can be considered to reflect the asset’s physical condition. In this
respect the quantum of maintenance work, as reflected by cost or quantity, is a surrogate measure
for condition.

New Zealand RCA’s have asset management objectives to optimise long-term road maintenance.
The aim is to achieve specified levels of service LOS and the desired long-term condition with cost-
effective lifecycle management. Effective asset management requires all available maintenance
history and condition data to be collated and interpreted to assess the merit of the maintenance
activity strategy. This can only be confirmed if there is a robust maintenance cost history.

Use of consistent maintenance activity cost codes and associated activity/fault combinations aid
the structured classification, and subsequent analysis of network maintenance costs. It is also
used by NZTA as a funder to manage investment in road networks. Working examples of coding
are available to network managers (NZ Maintenance Cost and Activity Codes2). A common code
set is of considerable benefit for national analysis of road asset performance and road research
into improving the effectiveness of road design and maintenance treatments in different network
conditions.

2
    www.nzta.govt.nz/resources/state-highway-asset-management-manual/SM020.html

ROADING ASSET MAINTENANCE COST GUIDELINES § VERSION 1                                                  13
3.0 Maintenance Activity
3.1 WHAT IS RECORDED AND WHY
Infrastructure assets are expensive investments, take time to establish, and may have an economic
life of up to 50 to 100 years. The way assets are managed has long-term implications for their ability
to sustain a particular level of service, and the cost of sustaining that level of service3.
Physically managing infrastructure assets includes:
§§ Maintenance - activities that keep an asset in good working order
§§ Renewal - work that replaces an asset that has reached the end of its life with a modern
equivalent asset
§§ Upgrades - totally new assets, or replacing an asset with something better
§§ Disposal - decommissioning and removing assets.
3.2 INPUTS
Road asset management primarily focuses on inputs which require maintenance funding. Inputs
represent the effort or activities which occur during the maintenance process. Outputs are expressed
by the asset’s resulting condition. Managing the limited funding efficiently and effectively is the
road asset manager’s key responsibility. Monitoring usually gives a clear link between finance and
inputs (e.g. maintenance activities in priced contract schedules. The link between existing condition
measurement (output) and identified existing maintenance need (as determined by experienced
practitioners) is sometimes less clear.
Maintenance activities provide the inputs to the maintenance process. The inputs include:
§§ Maintenance costs – $/m2, $/km, $/ea, $/month or day, $/tonne
§§ Frequency (count) – of maintenance activities, collated in the following categories – count/km,
count/month, count/highway
§§ Dates and times of maintenance activities
§§ Policy affecting maintenance activities – these could, for example, minimise maintenance activity
prior to major rehabilitation. Generally policies have a short to medium term effect on the timing
of maintenance activities and may allow for a temporary reduction in the achieved LOS.
More specifically the asset management includes:
§§ What work was done and why – the specific repair type consistently described (Activity coded)
e.g. PA Potfill-Holes (Cost group: Activity-Fault)
§§ How much work was done – the quantity of repair
§§ Where the work was done – location to appropriate measurement tolerance e.g. linear reference
distance (±10 m) or spatial co-ordinates
§§ When work was done – repair date.
Maintenance and renewal work are core ”business as usual” activities for managing infrastructure
assets so they remain capable of providing an economic level of service over the life of the asset.
Infrastructure managers need effective systems for maintaining and renewing assets.
3
www.nzta.govt.nz/resources/planning-programme-funding-manual/
14 ROADING ASSET MAINTENANCE COST GUIDELINES § VERSION 1They need to:
§§ Have a long-term plan to identify and assess risk, prioritise and prepare for work needed on the
infrastructure asset over time
§§ Manage day-to-day work, with systems, plans, policies, and procedures to put the long-term plan
into action, carry out checks and evaluations, and establish audit processes to make sure planned
work has occurred in keeping with policies and procedures, and that it has the desired effect.
§§ Undertake regular reviews to evaluate whether long-term plans and day-to-day maintenance
management activities are effective or can be improved.
3.3 OPTIMISING MAINTENANCE
The Government Policy Statement4 (GPS - currently 2009/10 – 2018/19) was developed and issued
under the Land Transport Management Act 2003. The Act is the main statute for New Zealand’s land
transport planning and funding system. Regional, city and district councils, NZTA and other approved
organisations under the Act can receive money from the National Land Transport Fund for the land
transport activities they deliver. These activities include constructing and maintaining state highways,
local roads and public transport services.
NZTA’s Land Transport Programme considers the following factors (as described in the GPS) when
planning and evaluating strategies and programmes and approving funding for activities:
§§ Increasing national economic growth and productivity improvements in infrastructure and
services provision that enhance transport efficiency and lower the cost of transportation
§§ Considering networks from a national perspective
§§ Achieving value for money
§§ Encouraging integrated planning
§§ Making best use of existing networks and infrastructure
§§ Implementing and fostering a coordinated approach
§§ Considering the impact of volatile fuel price.
All funders expect the optimal level of network maintenance to consider a balance of road user
costs, service levels and life-cycle costs. Asset performance in any network will be tempered by
local economic, geological, and climatic conditions. Asset inspection and maintenance is prioritised
according to risk priority –’higher risks are managed ahead of lower risks – while balancing
frequently occurring lower-level risks such as pavement deterioration, against the preventing rare
and catastrophic risks.
4
www.transport.govt.nz/ourwork/KeyStrategiesandPlans/Documents/Amended-GPS-November-2010.pdf
ROADING ASSET MAINTENANCE COST GUIDELINES § VERSION 1 15Figure 2. NZTA’s guidelines, outcomes, and contract specifications
The maintenance of a local road network that integrates
with the national network and provides for people’s
needs at a cost that they are willing to pay.
VISION
Roads that are maintained at reasonable cost, to a
DESIRED standard that: satisfies the user, provides safe travel,
OUTCOME sustains the asset and is appropriate for their use.
KEY PERFORMANCE Agreed performance measures and target values.
MEASURES
Intervention levels and response times.
CONTRACT SPECIFICATION
RCA’s maintain the LOS and maintenance practices used to align with the objectives of the New
Zealand Transport Strategy, the Land Transport Management Act 2003, and Long Term Council
Community Plans. This gives the best chance of optimising the NZTA funding contribution of network
maintenance activities for the RCA.
Most RCA’s provide road activity management plans to the NZTA annually for review. The RCA
provides a statement on the completeness of their road assessment and maintenance management
system (or equivalent) inventory database. If there is a significant difference between a RCA’s levels of
service and the NZTA’s maintenance guidelines for local roads, this needs to be outlined in the activity
management plan.
16 ROADING ASSET MAINTENANCE COST GUIDELINES § VERSION 13.4 ASSET CONDITION Asset condition measures include: §§ Visual inspections – where faults are noted, usually from a moving vehicle, during the course of a periodic inspection §§ Asset inspection programmes – such as regular programmed inspections by an RCA of their load-bearing and drainage structures, which may report, for instance, that structural integrity of structures is not diminished by lack of maintenance. Programmes can include annual surface rating condition surveys, high speed data collection, roughness surveys, test pit investigations, and targeted strength testing (generally Falling Weight Deflectometer (FWD)) to further assess the network asset condition and performance. Outputs of these investigations indicate the maintenance strategy efficacy, and support area wide pavement treatment selection. §§ Safety inspections – these are safety focused, periodic drive-over inspections, which are expected to form part of a safety management system RCA use for their own asset management purposes (including maintenance activity cost data) e.g. §§ Change in the pavement integrity index (PII) of the sealed network §§ Length of the sealed network overdue for resurfacing §§ Maintenance Costs/network km or VKT §§ dTIMS model forecasts – which make longer term optimised forecasts of network performance based on available network asset information, investment levels and maintenance costs. 3.4.1 Deferred Maintenance Budget pressure on maintenance activity inputs can limit maintenance investment. The level of surfacing treatment may increase replacing more expensive rehabilitation, but ultimately flexibility reduces to the point where rehabilitation cannot be deferred. Maintenance activity costs outside of normal “service level” can increase, resulting in the ratio of reactive to/proactive activities increasing at the same level of investment. It is important to monitor the level of planned maintenance activity on network assets relative to the amount of unplanned or reactive maintenance. Clearly defining and locating activity based maintenance costs is important. This allows areas or activities which require a different maintenance intervention strategy or forward work prioritisation to be identified. Failure to monitor these effects will lead to problems with unplanned maintenance levels and put overall asset performance at risk. Asset management processes should be able to determine the deferred maintenance liability and use the maintenance cost history data to support funding requests, maintenance strategy changes and changes in the asset’s LOS. Methods of assessing the level of deferred maintenance include: §§ Tracking the detail of unplanned maintenance activity per month and calculating the percentage of planned versus unplanned maintenance activity costs per month §§ Dividing the total sealed network length by the average annual rehabilitation length over three years §§ Reviewing the dTIMS trigger model output to identify work that may need to be included in future plans. The trigger model is not investment limited and activates when a trigger condition is exceeded. ROADING ASSET MAINTENANCE COST GUIDELINES § VERSION 1 17
3.5          MAINTENANCE ACTIVITY MANAGEMENT
Maintenance activities in New Zealand have been contracted out through competitive tendering
processes since 1991. Currently NZTA and other RCA’s have a range of contractual arrangements for
road maintenance activity. Some non-pavement roading maintenance activities have been purchased
or supplied on a $/month or $/km basis (e.g. mowing). This has limited use in analysing maintenance
inputs because the cost is spread uniformly across all road sections (cyclic cost) regardless of when
or where inputs actually occur. Effective pavement cost management is aided by segmenting the
roading network into “treatment lengths”. These are defined as contiguous lengths of commonly
performing sections of pavement and generally have common surface treatment type. Measuring
maintenance activity units by dollars, number or m2, period, and location is required to analyse
maintenance activity.

Pavement maintenance is generally the biggest expense, and the basis for purchasing/supplying
pavement maintenance activities has generally been in $/m2. This basis of measurement has the
benefit of reflecting the proportion of the treatment length area under the pavement maintenance
activity. This is useful in considering the economic value of alternate maintenance options into the
future.

As management policy and contract pricing may affect maintenance input initiation in one or two
consecutive years, averaging activity cost inputs over three or more years is appropriate.

3.6          DATA CAPTURE
The following data should be collected about maintenance activity:
§§ What was done (activity)
§§ How much was done (quantity)
§§ Where it was done (to ± 10 m)
§§ Why it was done (fault)
§§ When it was done.

Contract/Asset managers need to ensure that maintenance staff and contractors have adequate
asset condition capture skills, and regularly quality review maintenance data. This provides
the opportunity for feedback about improving the asset maintenance strategies, and confirms
contractors are aware of why the maintenance data is collected, and the impact of poor data on asset
management.

To be effective, condition surveys need to be regular and comprehensive in coverage. While collection
of maintenance data by the staff responsible for programming and carrying out the work has the
advantage of their knowledge about the maintenance work actually undertaken, independent rating
surveys add value as an objective assessment of network condition. Both have value in road asset
management and in supporting the analysis of maintenance activity information. Maintenance
contracts should specify network observation and maintenance activity record keeping requirements
to a standard that allows for effective subsequent analysis. This needs to be balanced with the cost
of maintenance data capture and the contract/asset management benefits that can be derived from
using the data. Timely network observations and analysis positively influences maintenance activity
planning so a time related service level on submission of maintenance data should included in
contracts.

18                                                ROADING ASSET MAINTENANCE COST GUIDELINES § VERSION 1
3.7           DATA CAPTURE SYSTEMS
The business requirement to collect maintenance data should drive the capture process. New
Zealand maintenance contracts increasingly use mobile devices (smartphones, tablets, and laptops)
to capture data. Manual, paper-based processes are also used, and are still effective with some
complex data (e.g. network driveover sheets). Mobile devices can reduce the time needed to record
and duplicate maintenance activities but software and hardware need to be practical to use in the
field. Devices need to be supported by sound data processes, application software, user education,
and quality control or the intended efficiencies may not be realised. Staff within the RCA and the
contracting/consulting organisations need to have the technical skills and clear processes to operate
and support systems used in contracts. The asset management software used should reflect agreed
business rules and be available to all parties for access and update where required.

In recent years systems like RAMM Contractor have been developed and utilised for road
maintenance contracts. The maintenance cost data collected in Contractor tables needs be to be
moved into the RCA accessible maintenance cost tables as part of the contract deliverable. Camera
and global positioning system (GPS) equipped mobile devices and emerging asset management
software makes it possible for more condition and location data to be collected, and additional spatial
analysis and presentation of maintenance activity is possible. Technology can help minimise data
entry duplication, significantly ease data sharing, and reduce transcription error but it needs to be
cost effective and support the maintenance activity management business process. Manual methods
should also be available as back-up where technology is used.

3.8           QUALITY ASSURANCE
Checking maintenance data quality to confirm it is a reasonable and reliable base for analysis is
a constant discipline in asset management. It is important for asset managers to know the data’s
strengths and limitations when using it as a basis for making assessments and recommendations.
RCA’s should plan to improve data quality so it contains a minimum base of three years’ reliable
maintenance activity data to support analysis and decision making. Poor data quality has a negative
effect on the usefulness of maintenance records and the confidence with which they can be used.

The three year minimum data set also gives some balance on the economic effects of changing unit
rates over time.

Regular audits should be programmed to establish the quality of maintenance activity data. From
these the need for further checks or process changes can be determined with contract participants.

Changes of staff (RCA or contractors) need to be well managed so record keeping quality is
maintained and there is a common understanding of network maintenance strategies. Maintenance
activity coding consistency5 and RCA staff/contractor training for the range of treatments relevant to
the network are fundamental to managing network costs, NZTA reporting requirements, analysis to
determine more timely maintenance processes, and for information sharing built on a solid base of
national maintenance records.

       Example:
       NZTA’s “SmartMovez” website has an MS-Excel based sheet for this New Zealand road
       network comparison (Road network condition tool6). This comparison is able to be made
       nationally because of consistent use of maintenance activity descriptions and datasets.

5
    www.nzta.govt.nz/resources/state-highway-database-operation-manual/docs/SM050-appendix-4.pdf
6
    www.smartmovez.org.nz/references/refs/data/road_network_condition

ROADING ASSET MAINTENANCE COST GUIDELINES § VERSION 1                                               19
3.9 DATA OWNERSHIP Asset owners need to define the ownership of contracted maintenance activity data. Contracts should identify ownership of collected maintenance activity and cost data, the submission requirements of the asset’s full maintenance records, and any commercial sensitivity requirements. The data should reflect the detail described in the underpinning maintenance contract and be transferred or made available to the owner on a regular basis. Asset managers also need to have access to current and comprehensive maintenance activity records, as these are used as inputs into longer term maintenance strategy decision making and renewal evaluation. It is more important that the data is collected accurately and regularly, than the particular type of service environment within which it is provided. 3.10 DATA FORMAT Data exchange between organisations is usually transformed into a format such as a delimited text file, spreadsheet, or other agreed electronic data exchange format. Modern database systems are capable of creating data formats commonly used for exchanging data. Highway asset managers need system(s) to facilitate their data management. Given the quantities of data involved, relational databases are more appropriate to use rather than spreadsheets. Practitioners often develop separate database (or spreadsheet) tools to address individual components of the management process (e.g. contract management, communications, inspections). While combining these functions into one integrated package is a common concept, integrated systems are, by their nature, more complicated, expensive, and reliant upon a higher level of computing skill and understanding. This has implications for an organisation’s resources. Additional types of data retained can include: §§ Network and inventory (e.g. drainage, pavements) §§ Maintenance activity costs §§ Communications (such as public enquiries) §§ Documents (e.g. consents) §§ Accidents §§ Planned area type maintenance treatments (such as the Forward Work Programme). Organisations can set up data systems by either purchasing a commercial one or building a system specific to meet its own needs and those of contributing funding organisations. RAMM is the most common road asset system in New Zealand at present. 20 ROADING ASSET MAINTENANCE COST GUIDELINES § VERSION 1
4.           Using Data
As the complexity of maintenance activity data varies considerably, the following items need to be
taken into account before analysing it:
§§ Costs by Treatment Length – for practical maintenance management purposes roading asset
   costs should be linked to defined uniformly performing contiguous sections of the network rather
   than network wide cost allocation. Many networks use treatment lengths but any pragmatic road
   length grouping that enables the network to be divided into uniform treatment areas is useful. For
   rural areas this may be by road rather than individual treatment lengths.
§§ Time frame – the longer time period the entire maintenance data covers the better. In general a
   minimum three year period is useful to overcome potential distortions due to the effects of policy/
   strategy change, area maintenance (e.g. resealing), contract transitions and so on. In addition,
   input costs may vary over time depending on factors such as the suppliers’ pricing policies. For
   maintenance costs, the inventory over the preceding two to three years are most directly relevant.
   In this way, the effect of time on the relative dollar values is insignificant. Adjustments for the
   consumer price index (CPI) can be included in the data cost analysis.
§§ Summarisation/data processing – relevant maintenance data needs to be summarised (e.g.
   averaged and weighted by length) within the selected lengths so the network is appropriately
   represented.
§§ Data Quality – a good understanding of any known limitations of the historical data is important.
   In some situations the data set may be inadequate to support analysis.

4.1          DATA ANALYSIS
Analysis and reporting tools for maintenance activities are a common part of road asset management
practice. They require a reliable maintenance cost history in a form able to be used in computerised
systems (notably, but not exclusively, RAMM to basic spreadsheets) maintained by road network
managers. RAMM provides a generic New Zealand developed asset framework for programming,
recording, sharing, and more consistently locating road maintenance activities between the RCA’s
and contracted entities involved in roading network maintenance and management. RAMM enables
asset managers to benchmark performance and consider peer network performance. The impact of
maintenance activity on network asset performance can be inferred, and refinement of maintenance
activity evaluated.

The options for storing data include spreadsheets, databases, and specific asset management
software. Databases are usually more suitable for long-term use as spreadsheets have limitations on
the numbers of rows of information they can hold and this can be an issue for roading maintenance
records. There is a trade off on matching resources in systems and staff skills for RCA’s for data
management and analysis. Good business discipline (process and quality assurance) is the backbone
of maintenance activity management and its supporting technology.

In New Zealand conditions RCA maintenance records are extremely variable in quality, and older
records are often in a form that is not economic or practical to incorporate in modern electronic
systems. Each new maintenance contract represents an opportunity to establish a level of
maintenance cost recording as a contract output. A well specified contract should allow good
maintenance activities/cost data management and a reliable electronic recording/data transfer
mechanism for the data owner.

ROADING ASSET MAINTENANCE COST GUIDELINES § VERSION 1                                                21
4.2            ANALYSIS METHODS
Maintenance activity cost data can be analysed in a number of ways including through Benefit Cost
and Net Present Value.

TREATMENT ECONOMICS – BENEFIT/COST (B/C) AND NET PRESENT VALUE (NPV)

§§ Benefit Cost (B/C) is used as a mechanism for ranking potential projects. The procedures for
   undertaking this process are well described in the NZTA Economic Evaluation Manual Volume 17
   (Section SP3: General Road Improvements) and NZTA Annual Plan and DLTP Instructions for State
   Highway and RCA’s respectively.
§§ Net Present Value (NPV) reflects locations where an area type treatment is demonstrated to be
   the least cost maintenance option. Procedures for applying this are also laid out in the NZTA
   Economic Evaluation Manual Volume 18 (Section SP1: Road Renewals refers to the NPV process).
Local authorities have been required to operate in a “value for money” environment for some time
and what is being proposed through the Procurement Manual9 is consistent with this requirement.
Case making with a good maintenance cost history can be quite useful for project level prioritisation.
dTIMS modelling also uses economic analysis to prioritise strategies by treatment length when a
network model is based on maintenance cost and activity data extracts.

TRENDS – GENERIC VERSUS SPECIFIC COSTS

Roading network trends may be applied or derived on a general (network level) or specific (project
level) basis. Examples of this are the Maintenance Cost Index (MCI) which is part of the dTIMS
predictive modelling process (Section 5.4 Predictive Modelling); network wide general data used to
derive time based relationships and values (e.g. growth rates); or the data may be more specific i.e.
to the treatment length level. In the roading context it provides better quality output if specific local
relationships are used. This requires:
§§ Appropriate and reliable local data, ideally to a treatment length level
§§ Skills and tools to analyse the data
§§ Knowledge of the network; the underlying geological and climatic processes, materials properties
   and sources, and maintenance practice
§§ If either of the first two are not present then the better option may be to use national or network
   generic data. The third requirement must be used in all analyses.
As with all data based analysis it is critical to ensure that the base data is reasonable. Simple
checking of high and low values for quantities and rates for reasonability should be done before
starting any analysis work.

80/20 RULE ASSESSMENT

The 80/20 Rule is simply that 80% of the maintenance effort is usually required on 20% of the asset.
The graph in Figure 3 illustrates this.

This graph10 is taken from actual records from a state highway network that has 65% of expenditure
occurring over 20% of the network. Maintenance data analysis will enable the asset components in
the 20% to be identified and treated.

7    www.nzta.govt.nz/resources/economic-evaluation-manual/volume-1/index.html
8    www.nzta.govt.nz/resources/economic-evaluation-manual/volume-1/index.html
9    www.nzta.govt.nz/resources/procurement-manual/
10 Figure 9, section 8.2; www.nzta.govt.nz/resources/state-highway-asset-management-manual/docs/SM020-manual.pdf

22                                                  ROADING ASSET MAINTENANCE COST GUIDELINES § VERSION 1
Figure 3 – Cumulative Maintenance Expenditure by Network Length

                         100

                         80
Cumulative Expenditure

                         60

                         40

                         20

                          0

                                             20               40                     60         80              100

                                                      Cumulative Length Maintained

                         Example: Unsealed Roading Maintenance
                         Management Programme development
                         Maintenance cost records were used to develop unsealed road forward works programmes
                         for two road sections of a rural North Island council. This involved analysing historical
                         maintenance information which was largely based on responsive metalling to determine areas
                         with greatest need. The intent of the work was to get the unsealed maintenance materials and
                         technique right to protect the investment in expensive basecourse which could be lost without
                         an effective “capping” wearing course, and to reduce unsealed road service requests. The
                         work also would refine the forward work programme and provide a base for unsealed network
                         performance measures.

                         As originally inferred by the asset engineers, the finding was that the historical unsealed
                         maintenance cost profile had a fit similar to the Pareto principle (80% of the cost in 20% of the
                         locations). The sections were steep terrain with over 100 vehicles/day, and subject to regular
                         intense rainfall events. The analysis of the two areas indicated that one area had more than
                         70/30 (varied topography) and one less than 70/30 (average topography). They used this as
                         a basis for spreading the unsealed maintenance funding in the appropriate proportion and
                         lengths when the forward works maintenance programme was developed.

                         The maintenance contract required the maintenance metal volume data to be reported by
                         the contractor by road name. That information in conjunction with maintenance records and
                         field inspections was the basis of the initial studies’ assumptions. The modified programme
                         treatment lengths (based on topography, gradients, curvature, traffic, and other factors) were
                         assigned high, medium, and low wear rates and the metal volumes distributed across them.
                         The forward work programme was then developed in MS Excel based on maintenance data,
                         and programme iterations were reviewed and field verified for engineering sensibility.

ROADING ASSET MAINTENANCE COST GUIDELINES § VERSION 1                                                                   23
Capturing treatment length information was not viable with the existing contract
arrangements where basic programme compliance was already a challenge. The contractor
was encouraged to improve wearing course application techniques, materials and
management to maximise the period between applications and minimise costs. After some
success in initial trials reliable wearing course material and construction is being continuously
refined
4.3 SUMMARY ANALYSIS
The most common starting point for analysis is in $/km, m2/km, number/km. This process
summarises maintenance activity into each distinct section or treatment length. Summarised data
can be expressed as:
§§ Cost/km
§§ Quantity/km
§§ Count/km.
The maintenance activity records need to be filtered according to activity cost codes to express
directly relevant repairs (e.g. pavement) to maintain condition or level of service. Priority for
intervention would normally be with the asset portions reflecting the highest level of input. This
is where consistent maintenance treatment codes have significant benefits for analysis and
interpretation. It also provides a check to confirm if the network is divided into appropriate treatment
lengths. Where more than one maintenance strategy occurs in a treatment length, a decision to
subdivide further can be considered to reflect practical network management.
4.3.1 Scheduling Road and Footpath Maintenance11
The following example shows a defined condition assessment process including verification and
consultation actions.
Example:
The Council aims to reduce the need for roading repairs by performing routine maintenance
programmes throughout the city. The Council’s process for scheduling road and footpath
maintenance includes the following:
§§ Annual survey – a consulting engineer is employed to survey the conditions of every
road and footpath in the city
§§ Computer analysis – the Council analyses collected road defect data and creates a
provisional maintenance schedule based on a cost/benefit ratio for road users. A cost/
benefit ratio for pedestrians is calculated for the footpaths.
§§ Verification – a Council roading engineer verifies the information and determines the
appropriate treatment for each improvement project
§§ Scheduling – the Council consults with service authorities who regularly perform their
own utility works to ensure there are no potential conflicts. Based on the factors above
and on the Council’s budget, roads and footpaths are scheduled for maintenance.
11
www.wellington.govt.nz/services/rdstraffic/maintpro/maintpro.html
24 ROADING ASSET MAINTENANCE COST GUIDELINES § VERSION 15.0 Advanced Analysis Methods
5.1 DATA MINING
Data mining describes a variety of applied statistical and other data analysis methods, which
are available (sometimes contained within commercial off the shelf software), to operational
maintenance practitioners. A copy of the original operational data can be extracted and linked to
other related financial and quality data in applications optimised for analysis and reporting. This type
of data is sometimes called a “data warehouse”. Reporting from live operational systems can have a
performance impact in some situations.
Example: InRoads Performance Based Contract
The 10 year Performance Based Contract (PBC) requires InRoads to provide monthly reports
on the contract’s current financial position, and to predict future costs, to satisfy management
and governance expectations.
Operational information from contract activity is stored and sourced in the RAMM (asset
management system), EXOR (a maintenance activity job management system) and Vision (a
financial management system). To help redistribute this information, live extracts from each of
the data sources are regularly transferred to an on-site server database.
Custom-built web and office report templates specific to the needs of the contract use the data
in the server database to produce monthly reports. InRoads use a “Pain Gain” report, which
utilises Vision and EXOR data. The report determines the balance of expected asset quantity
delivery, as stipulated in the PBC and associated variations, versus costs of delivery, material
rate costs, and predicts the outcomes at the end of the contract. Other task-specific graphs
using data from Vision enable Inroads to understand the underlying trends of cost versus
Supply, and assess the best way forward in anticipation of the end of contract requirements.
InRoads benefits from having easy up to date access to maintenance activity and cost
information, which improves the reporting process and the quality (and thus trust) placed
on outputs. Asset managers can then focus on their decision making processes with greater
confidence.
5.2 SPATIAL DATA
Viewing data spatially provides an opportunity to identify areas which may need maintenance
intervention or have been absorbing significant maintenance effort. The map-based presentation
is often helpful to indicate at a network level the asset maintenance trends and patterns to a wider
audience when comparing options and strategies. An example of spatial data presentation is shown
in Figure 4.
ROADING ASSET MAINTENANCE COST GUIDELINES § VERSION 1 25Figure 4 – Spatial display network condition for different maintenance funding levels The map views show derived network condition in terms of pavement condition index (PCI) based on using dTIMS to analyse network data including maintenance costs to predict the long term network condition. This way of presenting data has real advantages for quickly identifying and querying areas where maintenance activity on a network is likely to be putting long term condition at risk. The presence of “hotspots” or patterns of maintenance activity is sometimes more easily identified using a spatial view. Linking extracted maintenance activity data to a GIS system enables this type of reporting to relatively easily display current and future work for analysis or public information. These types of tools are becoming increasingly accessible to maintenance management practitioners and are contained in some commercial off the shelf systems. Most RCA’s have their own information (GIS) systems which can display layers populated with any relevant extracted maintenance activity data. 5.3 CLUSTERING Cluster analysis of data involves sorting data into groups (or clusters) so common factors can be identified. This applies statistical rigour to the pattern of occurrence being investigated to confirm it is beyond normal data variance, and the data is sufficient to support the observed pattern. In the context of roading asset management clustering techniques can be used to identify groups within treatment lengths, those which behave similarly e.g. groups with similar levels of high (or low) maintenance activity. Specialist software packages such as SPSS and SAS (statistical analysis software applications) have cluster detection capability but increasingly this functionality is being incorporated into GIS application layers and analytical statistical add-ins for spreadsheets. Cluster analysis has been widely used for accident analysis but applying these techniques across a wider range of roading asset management functions is possible. Both spatial data viewing and clustering are performing similar functions through different means. Knowledge of the maintenance contract environment and the network add considerable meaning to the application of these techniques. In the future spatial tools may aid the packaging of maintenance activity work. 26 ROADING ASSET MAINTENANCE COST GUIDELINES § VERSION 1
5.4 PREDICTIVE MODELLING (dTIMS)
The desire to improve physical works maintenance management on the road asset and gain a better
insight into its future maintenance needs is a universal goal for road managers. dTIMS predictive
pavement modelling in the New Zealand roading context has developed significantly with support
from NZTA and Ingenium/IDS. Reliable maintenance data is essential.
Routine maintenance costs are determined by calculating the cost of repairing various faults such as
cracking and potholes, and adding an allowance for cyclic maintenance and additional maintenance
costs. The basis of the calculation is determined by a particular treatment length’s condition in a
particular year according to the range of deterioration models. These models determine a benefit
cost/NPV value for each possible scenario dTIMS generates. Trigger levels/ranges (Figure 5) are set
based on the network’s level of service limits and local conditions. An example of two intervention
scenarios as they would affect IRI over time is shown in Figure 5.
Figure 5 – dTIMS model Condition Trigger Intervention
Condition Confidence Interval
Existing
Condition Criteria for
Intervention
1
Condition Condition
1 2
2 Trigger Trigger
Interval Interval
Time
Routine maintenance activity and therefore costs increase over time. When the pavement
deteriorates and it becomes necessary to rehabilitate the section, the rehabilitation is valued against
the benefits generated. If an acceptably high benefit cost ratio (BCR) of the planned strategy is not
obtained the net present value (NPV) of the costs is determined. When the NPV cost difference
between the proposed maintenance treatment and the existing maintenance cost is positive, the
action can be funded under the current funding policy. The NPV can only be positive for pavements
that have deteriorated to such an extent that the routine maintenance option becomes more
expensive than the treatment (analysed over the life cycle of the road). This can also be established
by calculating the routine maintenance cost ratio to the strategy cost (e.g. 10%). The strategy cost is
the total agency cost over the analysis period.
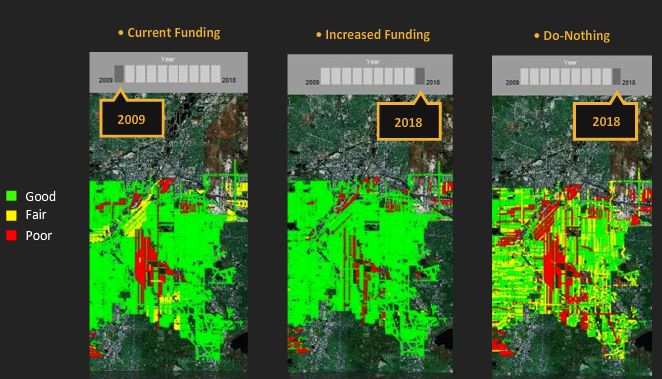
ROADING ASSET MAINTENANCE COST GUIDELINES § VERSION 1 27Figure 6 – Impact Intervention Level on IRI
10
Routine Maintenance Only
8
Intervention level
Overlay at 5 IRI m/km
6
Mean = 3.8 IRI m/km
Roughness in IRI m/km
4
2 Overlay at 4 IRI m/km
Mean = 3.4 IRI m/km
0
5 10 15 20 25 30
Year
The dTIMS pavement deterioration modelling analysis results in range of possible maintenance
activity scenarios that can be presented and compared with the specified FWP. Model scenario
options are:
§§ The trigger model runs with no budget limitation. This is so the deterioration of assets exceeding
trigger levels but which are not addressed in the forward work program (FWP) can be seen
§§ A maintenance only (least cost/do nothing) model
§§ The network performance prediction for the current FWP or specified model
§§ A range of budget constrained optimal models which attempt to optimise the network Pavement
Condition Index (PCI). These can be used to show the impact of alternate funding scenarios
The models provide individual project level outcomes and an overall network condition outcome for
each modelling run as shown in Figure 7. For PCI a higher value (100) is best with a range from
0 –100.
28 ROADING ASSET MAINTENANCE COST GUIDELINES § VERSION 1Figure 7 – dTIMS Network PCI Condition by Budget
80
70
60
Pavement Condition Index (PCI)
50
40
30
20
10
0
2009
2010
2011
2012
2013
2014
2015
2016
2017
2018
2019
2020
2021
2022
2023
2024
2025
2026
2027
2028
Very high Normal
High Least cost
Low Trigger model
Very low Specified model
The initial maintenance cost value is set based on the average of the last three years pavement and
surfacing data or a default value is used if this information is not available. The maintenance cost
index (MCI) is then applied to an expression to calculate an estimate of routine maintenance costs.
In summary, the New Zealand dTIMS process involves:
§§ Calculating the MCI which seeks to model pavement and surfacing maintenance costs to trigger
rehabilitation works
§§ Calculating Routine Maintenance Costs based on the prediction of various faults and unit rates for
repairs plus an additional amount for cyclic and additional maintenance. Planned costs can also
be included if they are known.
ROADING ASSET MAINTENANCE COST GUIDELINES § VERSION 1 295.5 MARKOV MATRIX The Markov Matrix is an advanced statistical tool for measuring the outcome of current maintenance policies. It is a tabular expression of the probability of a change in input level occurring (and hence cost) with time based on the current level of input. From this an appreciation of risk with respect to all likely future conditions is also able to be determined. An example of a portion of a Markov Matrix developed for a state highway network is shown below (Figure 8). An advanced level of data analysis is required to develop a Markov Matrix for a network. Figure 8 – Markov Matrix Example From Figure 8, the percentage probabilities that a section of asset existing at a cost range of $10,000 - $20,000/km in 2010/11 will be: §§ 31.7% for $0 - $1000/km in 2011/12 §§ 16.8% for $1000 - $5000/km in 2011/12 §§ 15.7% for $5000 - $10000/km in 2011/12 §§ 18.1% for $10000 - $20000/km in 2011/12. If it is shown that an increasing percentage of the asset is moving from a high maintenance input state to a lower input state over time then that would be a positive outcome. Conversely, the reverse trend would indicate the need for change in maintenance practices. 30 ROADING ASSET MAINTENANCE COST GUIDELINES § VERSION 1
6.           Conclusion
RCA’s in New Zealand have a wide range of pressures to do more with less, and reducing road
maintenance costs is a potential means of achieving this. Maintenance activity managed in a
well supported contract, with a clear maintenance activity cost data process, is a sound basis
for undertaking analyses and making informed asset management decisions. Realistic quality
assessments and the need for all parties to be aware of why robust maintenance records are
necessary allows more detailed inference and innovation on asset strategies. Technology is positively
influencing the way data is captured and stored, but it does not guarantee quality or good process.
Before any analysis is attempted a good assessment of the data quality is required to ensure the data
is reasonable enough to support the analysis.

The situation and skill set available to each RCA will be different. Information management skills can
add additional analysis options which support better decision making on where maintenance activity
should be focussed, or is where it is not being effective, or is not optimal for the funding available.

There is significant potential to utilise a robust maintenance activity cost history to improve and
optimise future asset performance in a road network.

7.           References
Douglas, Prasad & Tailby. 2007. Unsealed Roading Programme Development (Unpublished Report).
2007.

Finn and MacDougall. 2009. www.inroads.co.nz/assets/Uploads/Public-Documents/
FinnMcDougallIngenium-2010-PaperR2.pdf. www.inroads.co.nz/reports/. [Online] 2009.

NZ Government. 2010. Amended-GPS-November-2010.pdf. [Online] November 2010. www.transport.
govt.nz/ourwork/KeyStrategiesandPlans/Documents/Amended-GPS-November-2010.pdf.

NZ Transport Agency. 2000; Revised 2006. NZTA State Highway Asset Management Manual – SM020
Website. NZTA SHAMM - SM020 Website. [Online] 2000; Revised 2006. www.nzta.govt.nz/resources/
state-highway-asset-management-manual/docs/SM020-manual.pdf.

NZTA. 2009. www.nzta.govt.nz/resources/land-transport-statistics/docs/2008-2009.pdf. www.nzta.
govt.nz. [Online] 2009.

State Highway Asset Management Manual. [Online] New Zealand Transport Agency. www.nzta.govt.
nz/resources/state-highway-asset-management-manual/SM020.html.

T Henning & W Hatcher, IDS Group. 2009. IDS dTIMS PPM – Core Models Training Volume, Appendix B
(DT/2009/1). s.l.: IDS, 2009.

ROADING ASSET MAINTENANCE COST GUIDELINES § VERSION 1                                                 31
You can also read