Aqua: An Earth-Observing Satellite Mission to Examine Water and Other Climate Variables
←
→
Page content transcription
If your browser does not render page correctly, please read the page content below
IEEE TRANSACTIONS ON GEOSCIENCE AND REMOTE SENSING, VOL. 41, NO. 2, FEBRUARY 2003 173
Aqua: An Earth-Observing Satellite Mission to
Examine Water and Other Climate Variables
Claire L. Parkinson
Abstract—Aqua is a major satellite mission of the Earth
Observing System (EOS), an international program centered at
the U.S. National Aeronautics and Space Administration (NASA).
The Aqua satellite carries six distinct earth-observing instruments
to measure numerous aspects of earth’s atmosphere, land, oceans,
biosphere, and cryosphere, with a concentration on water in
the earth system. Launched on May 4, 2002, the satellite is in a
sun-synchronous orbit at an altitude of 705 km, with a track that
takes it north across the equator at 1:30 P.M. and south across the
equator at 1:30 A.M. All of its earth-observing instruments are
operating, and all have the ability to obtain global measurements
within two days. The Aqua data will be archived and available to
the research community through four Distributed Active Archive
Centers (DAACs).
Index Terms—Aqua, Earth Observing System (EOS), remote
sensing, satellites, water cycle.
I. INTRODUCTION
L AUNCHED IN THE early morning hours of May 4, 2002,
Aqua is a major satellite mission of the Earth Observing
System (EOS), an international program for satellite observa-
tions of earth, centered at the National Aeronautics and Space
Administration (NASA) [1], [2]. Aqua is the second of the large
satellite observatories of the EOS program, essentially a sister
satellite to Terra [3], the first of the large EOS observatories,
launched in December 1999. Following the phraseology of
Y. Kaufman, Terra Project Scientist at the time of the Terra
launch, the Terra and Aqua satellites are aimed at monitoring
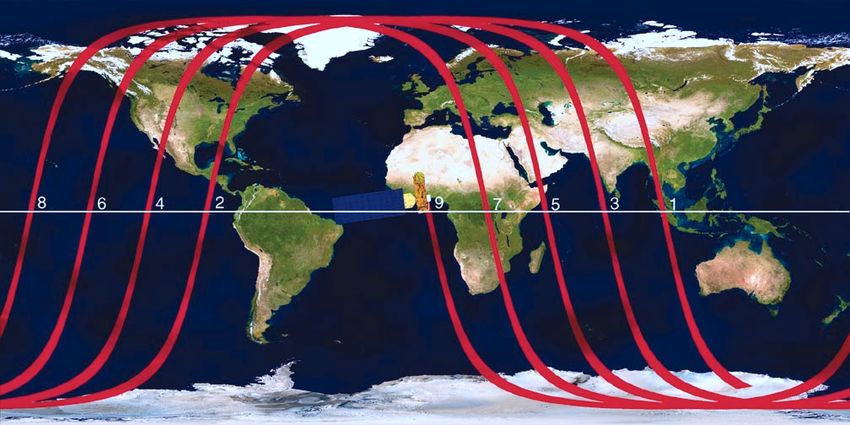
the “health of the planet,” with Terra emphasizing land and Fig. 1. Aqua spacecraft, August 2001, at TRW, Redondo Beach, CA. TRW
Aqua emphasizing water. Both satellites, however, measure was the prime contractor for the Aqua spacecraft bus. The two CERES
instruments are visible near the bottom of the spacecraft, both with protective
many variables in the atmosphere, on the land, and in and on covers. The HSB is immediately above the rightmost CERES, and the AIRS
the oceans. In fact, two of the key EOS instruments are on both is to its left. Above the HSB is one of the two major units of the AMSU
the Terra and Aqua platforms. (AMSU-A2), and above the AIRS is the other (the AMSU-A1). MODIS is at
the top left, and AMSR-E is at the top right (photo by S. Aristei/TRW).
Aqua data are providing information on water in its many
forms: water vapor in the atmosphere; liquid water in the atmos-
tion, heavily dependent on water, and on many other aspects of
phere in the form of rainfall and water droplets in clouds; solid
the earth’s climate system. A particular highlight, in addition to
water in the atmosphere in the form of ice particles in clouds;
the data on the water cycle, are improved atmospheric temper-
liquid water on land in the form of soil moisture; solid water on
ature data, which, along with the humidity measurements, have
land in the form of snow cover and glacial ice; liquid water in the
the potential of leading to improved weather forecasts.
surface layer of the oceans; and solid water in the oceans in the
Aqua carries on board six distinct earth-observing in-
form of sea ice floating in the north and south polar seas. Aqua
struments: the Atmospheric Infrared Sounder (AIRS), the
data are also providing information on land and ocean vegeta-
Advanced Microwave Sounding Unit (AMSU), the Humidity
Sounder for Brazil (HSB), which was provided by the Brazilian
Manuscript received April 29, 2002; revised November 15, 2002. This work National Institute for Space Research, the Advanced Microwave
was supported by the National Aeronautics and Space Administration’s Earth
Science Enterprise, as part of the Earth Observing System (EOS) program, and Scanning Radiometer for EOS (AMSR-E), which was provided
by the EOS Project Science Office. by Japan’s National Space Development Agency, the Moderate
The author is with the Oceans and Ice Branch/Code 971, NASA Resolution Imaging Spectroradiometer (MODIS), and Clouds
Goddard Space Flight Center, Greenbelt, MD 20771 USA (e-mail:
Claire.L.Parkinson@nasa.gov). and the Earth’s Radiant Energy System (CERES) (see Fig. 1).
Digital Object Identifier 10.1109/TGRS.2002.808319 The data from these instruments are being used to examine
U.S. Government work not protected by U.S. copyright.
174                                                  IEEE TRANSACTIONS ON GEOSCIENCE AND REMOTE SENSING, VOL. 41, NO. 2, FEBRUARY 2003

dozens of earth system variables and their interactions. The         data are being processed to provide measurements for 1-km
multiple goals of the mission include enhanced understanding         layers in the troposphere (the lower part of the atmosphere)
of the global water cycle, enhanced understanding of many            and 3–5-km layers in the stratosphere [4]. AIRS is the Aqua
additional elements of earth’s climate system, enhanced under-       instrument with the most substantial technological advances
standing of climate interactions and climate change, enhanced        developed for the Aqua program. Among the advances are a
understanding of the diurnal cycle of variables measured by          temperature-controlled grating and infrared detectors cooled to
both Aqua and Terra, and improved weather forecasting. The           60 K by an active pulse tube cryogenic cooler [5].
mission is planned to last on orbit for six years.                      Further information about the AIRS instrument can be
   Although the Aqua data are available to the research commu-       found in [5]–[9]. Specifically, Aumann et al. [6] provide an
nity as a whole, the science development efforts for the Aqua        instrument overview; Gautier et al. [7] describe the visible and
mission, including the development of the algorithms to be used      near-infrared portion of the AIRS; Strow et al. [8] describe the
in the data processing of the standard data products, are centered   prelaunch spectral calibration; and Gaiser et al. [9] describe
in the following five science teams:                                 the in-flight spectral calibration. Pagano et al. [5] describe
    • the AIRS/AMSU/HSB Science Team, led by M. Chahine              the prelaunch and in-flight radiometric calibration. The 2378
      of NASA’s Jet Propulsion Laboratory;                           infrared channels on AIRS are radiometrically calibrated to
    • the U.S. AMSR-E Science Team, led by R. Spencer of the         standards of the National Institute of Standards and Technology
      University of Alabama, Huntsville;                             [5]. Tests using simulated AIRS data, sample actual AIRS data
    • the Japanese AMSR-E Science Team, led by A. Shibata of         for June 14–18, 2002, and actual MODIS data indicate that
      the Japan Meteorological Agency;                               a geolocation accuracy of 1.7 km is easily achievable for the
    • the CERES Science Team, led by B. Wielicki of NASA’s           AIRS measurements [10].
      Langley Research Center;                                          The primary purpose of the four visible and near-infrared
    • the MODIS Science Team, led by V. Salomonson of                channels on AIRS is to provide diagnostic support for the in-
      NASA’s Goddard Space Flight Center.                            frared retrievals, principally through higher spatial resolution
   This paper provides an overview of the Aqua mission and an        cloud and land data [7]. The secondary purpose centers on re-
introduction to the more specific papers in the remainder of this    search products, including the surface solar radiation flux and
Aqua special issue of the IEEE TRANSACTIONS ON GEOSCIENCE            the height of low-level clouds [7].
AND REMOTE SENSING (TGARS).
                                                                        Powerful as the AIRS is, it shares with all satellite visible
                                                                     and infrared instruments the limitation of having data from un-
                                                                     derneath clouds obscured by the clouds. Clouds cover approx-
                       II. INSTRUMENTS                               imately half the earth at any time, and simulations suggest that
                                                                     no more than about 5% of the AIRS fields of view will be
   The earth-observing instruments on Aqua include two
                                                                     cloud-free [11]. Hence, it is extremely important for the Aqua
(CERES and MODIS) that are near copies of instruments
                                                                     program that the AIRS efforts include cloud-clearing techniques
flying on Terra, two (AMSU and HSB) that are very similar
                                                                     [4], [12] and that the AIRS infrared measurements are com-
to instruments flying on satellites of the National Oceanic and
                                                                     plemented by the measurements from Aqua’s two microwave
Atmospheric Administration (NOAA), and two (AIRS and
                                                                     sounders, the AMSU and the HSB [6].
AMSR-E) that are new. Three of the instruments work closely
                                                                        AMSU, also referred to as AMSU-A, is a 15-channel sounder
together as an atmospheric sounding suite, and these will be
                                                                     consisting of two physically separate units AMSU-A1 and
discussed first.
                                                                     AMSU-A2. The AMSU data are used in conjunction with the
                                                                     AIRS data to obtain atmospheric temperature profiles, with
A. Aqua Sounding Suite: AIRS/AMSU/HSB                                the AMSU being of particular value for obtaining upper-at-
   The three components of the Aqua sounding suite are the           mosphere temperatures and for providing a cloud-filtering
AIRS, the AMSU, and the HSB. All three are cross-track scan-         capability for tropospheric temperature measurements. Twelve
ners obtaining information at multiple levels of the atmosphere      of AMSU’s channels measure radiation with frequencies
and, depending upon atmospheric conditions, sometimes also at        between 50 and 60 GHz and are used predominantly for tem-
the surface.                                                         perature sounding, whereas the other three channels measure
   AIRS is a 2382-channel high-spectral-resolution sounder,          radiation at frequencies of 23.8, 31.4, and 89 GHz and are used
with 2378 channels measuring infrared radiation at wavelengths       predominantly for water vapor and precipitation measurements.
in the range 3.7–15.4 m and the remaining four channels              The horizontal resolution of the AMSU data at nadir is 40.5
measuring visible and near-infrared radiation in the range           km, three times as coarse as the AIRS data.
0.4–0.94 m. Its primary purpose is to obtain atmospheric                The first AMSU instrument was on the NOAA 15 satellite,
temperature and humidity profiles from the surface upward to         launched in May 1998, following 20 years of successful NOAA
an altitude of 40 km, and it is expected to provide substantial      operations with the precursor Microwave Sounding Unit
improvements, especially in the temperature measurements,            (MSU). The AMSU capabilities significantly exceed those
over any previous spaceborne instrument. Its infrared measure-       of the MSU, which had four rather than 15 channels, a much
ments have horizontal spatial resolutions of 13.5 km at nadir,       lower sampling rate, and a nadir resolution twice as coarse as
and its visible and near-infrared measurements have horizontal       that of the AMSU. The additional channels on the AMSU result
spatial resolutions of 2.3 km at nadir. Vertically, the AIRS         in denser spectral sampling and greater vertical resolution than
PARKINSON: AQUA: AN EARTH-OBSERVING SATELLITE MISSION                                                                            175

the precursor MSU. Further information about the AMSU,             Lambrigtsen and Lee [21] describe the scheme for doing this
including its radiometric calibration, can be found in [13].       and the various difficulties involved.
   HSB is a microwave humidity sounder provided to the Aqua
program by Brazil’s Instituto Nacional de Pesquisas Espaciais      B. CERES
(National Institute for Space Research; INPE) following
a December 1996 memorandum of understanding between                   CERES is a broadband scanning radiometer with three
NASA and the Agência Espacial Brasileira (the Brazilian Space      channels, one measuring the shortwave, solar radiation re-
Agency; AEB). It has four channels, one measuring radiation        flected from the earth/atmosphere system in the wavelength
at 150 GHz and the other three measuring radiation bands           band 0.3–5.0 m, one measuring top-of-the-atmosphere total
centered on a strong water vapor absorption line at 183.31 GHz.    reflected and emitted radiative energy in a band from 0.3 m to
The HSB measurements are used to determine humidity, cloud         greater than 100 m, and one measuring top-of-the-atmosphere
liquid water, precipitation, and precipitable water. In the        radiation emitted in the 8–12- m atmospheric window. Sub-
AIRS/AMSU/HSB triplet, the HSB is particularly important           traction of the shortwave measurements from the 0.3–100 m
for allowing accurate humidity profiles to be obtained under       measurements yields a measure of the broadband thermal
overcast conditions and for determining when the cloud liquid      emitted radiation, so that CERES isolates both the shortwave
water content is too high for the AMSU channels to be effective    and longwave broadband components of earth’s radiation
in cloud clearing. Like the AIRS infrared data, the HSB data       budget. Spatial resolution of the CERES data at nadir is 20 km.
have horizontal resolutions of 13.5 km at nadir.                      Aqua carries two CERES instruments, and these are the
   The HSB is a modified version of NOAA’s AMSU-B in-              fourth and fifth CERES in space. The first CERES was
struments, flown along with the AMSU-A since May 1998, on          launched in November 1997 on board the Tropical Rainfall
NOAA 15 and NOAA 16. The AMSU-B is being replaced on the           Measuring Mission (TRMM) satellite; and the second and third
NOAA satellites by the similar Microwave Humidity Sounder          CERES were launched in December 1999 on board the Terra
(MHS) starting with NOAA 17. The NOAA 15 AMSU-B ex-                satellite.
perienced excessive interference from the spacecraft transmit-        Each CERES has the capability of scanning in either of two
ters, impacting the instrument performance, but this problem       scanning modes: fixed azimuth plane and rotating azimuth
has been solved through enhanced shielding on the subsequent       plane. During routine operations, one of the Aqua CERES is
AMSU-Bs, the HSB, and the MHS. Further information about           generally scanning in the fixed azimuth plane mode (cross-track
the HSB and its radiometric calibration can be found in [12]       scanning), and the other is generally scanning in the rotating
and [13], respectively. The calibrations of AMSU and HSB are       azimuth plane mode. Used alone, the data from the fixed
both based on the calibration approach used by NOAA for the        azimuth plane scanning provide a continuation of the mea-
AMSU-A and AMSU-B [13].                                            surements begun in 1984 at the start of the long-running Earth
   Together, the AIRS/AMSU/HSB combination is regarded             Radiation Budget Experiment (ERBE) [22], [23], although
as the most advanced sounding system ever deployed in              with improved spatial resolution and improved accuracies. The
space. It incorporates the advances of the NOAA AMSU-A             rotating azimuth plane scanning is designed to optimize the
and AMSU-B microwave instruments plus the new advances             sampling from different viewing angles. The measurements
provided by the AIRS. Its primary purpose centers on accurate      from the rotating scanning mode are used to convert the fluxes
temperature and humidity profiles, but its data are also being     determined from the fixed scanning mode into appropriate
used to obtain information about several atmospheric trace         fluxes over all view angles, leading to highly accurate radiation
gases, precipitable water, cloud liquid-water content, the         budget measurements.
heights of the tropopause and stratopause, cloud properties, sea      The combination of the broadband thermal emitted radiation
and land surface temperature, surface spectral emissivity, and     with the measurements for the 8–12- m atmospheric window
shortwave and longwave radiative fluxes [14]. Algorithms have      allows an improved isolation of the greenhouse effect of gases
been developed for obtaining temperature and moisture profiles     such as water vapor. Furthermore, using CERES data in com-
from the microwave sounders alone [15], [16], initial temper-      bination with AIRS data allows a direct measurement of the
ature and moisture profiles incorporating the infrared data, to    far-infrared emission at 15–100 m, wavelengths dominated by
be used in operational weather prediction [11], and a full suite   the greenhouse effect of upper tropospheric water vapor. The
of research-quality AIRS/AMSU/HSB data products [4], [17].         CERES data are additionally being used in conjunction with
Microwave-only retrievals are generally used for fields of view    MODIS data, to obtain information on cloud and aerosol prop-
where the cloudiness exceeds 80% [12]. Precipitation is also       erties and to examine the role of these components in the climate
being calculated from the AMSU/HSB microwave data, using           system.
a neural-network technique described in [18].                         Further information about the CERES instrument and algo-
   Details of the AIRS radiative transfer model can be found in    rithms can be found in [24] and [25], and a broader overview of
[19], and details on the creation and validation of AIRS simu-     the EOS studies in radiation and clouds, as well as water vapor,
lated data, used in the development of the retrieval algorithms,   precipitation, and atmospheric circulation, can be found in [26].
can be found in [20]. For the system to perform as planned, the    The CERES Science Team has done considerable work with the
AIRS, AMSU, and HSB instruments need to be aligned and syn-        CERES data from the TRMM and Terra satellites, finding, for
chronized so that, as much as possible, simultaneous observa-      instance, large decadal variability in the mean radiative energy
tions are being made of the same air mass with all instruments.    budget of the tropics [27] and evidence of a strengthening of the
176                                                 IEEE TRANSACTIONS ON GEOSCIENCE AND REMOTE SENSING, VOL. 41, NO. 2, FEBRUARY 2003

tropical atmospheric circulation in the 1990s [28]. Data from the   of MODIS data for deriving information about high clouds [35]
Aqua CERES will allow scientists to extend those studies with       and tropospheric winds [36] in the polar regions.
improved diurnal sampling and to benefit from the synergism
of the broadband CERES radiative data with the cloud, vapor,        D. AMSR-E
precipitation, and other measurements from the Aqua MODIS,             AMSR-E, provided to the Aqua program by the National
AIRS, AMSU, HSB, and AMSR-E instruments.                            Space Development Agency of Japan (NASDA), is a 12-channel
                                                                    conically scanning passive-microwave radiometer measuring
C. MODIS                                                            vertically and horizontally polarized radiation at the microwave
   MODIS is a cross-track scanning radiometer with 36               frequencies of 6.9, 10.7, 18.7, 23.8, 36.5, and 89.0 GHz. It
channels measuring visible and infrared spectral bands in the       builds on the heritage of previous satellite passive-microwave
wavelength range 0.4–14.5 m. It is the one instrument on            instruments, including the Nimbus 7 Scanning Multichannel
Aqua with a science team focused on biological as well as           Microwave Radiometer (SMMR), operational from late 1978
physical measurements of the earth/atmosphere system, and its       through mid-1987, the Defense Meteorological Satellite Pro-
data are being used to generate a wide variety of ocean, land,      gram (DMSP) Special Sensor Microwave/Imager (SSM/I),
and atmosphere products. For the oceans, these include primary      operational since mid-1987, the Marine Observation Satellite-1
productivity, photosynthetically active radiation, coccolith        (MOS-1) and MOS-1b Microwave Scanning Radiometers
concentration, chlorophyll fluorescence, suspended solids and       (MSRs), first launched in 1987, and the TRMM Microwave
organic matter concentrations, sea surface temperature, sea ice     Imager (TMI), launched in November 1997. The AMSR-E
cover, sea ice albedo, and others. For the land, they include net   provides improved spatial resolutions over the earlier satellite
primary productivity, land cover type, a variety of vegetation      passive-microwave instruments, and its 6.9- and 10.7-GHz
indices, fires, land surface temperature and emissivity, snow       channels allow soil moisture, sea ice temperature, and sea
cover, snow albedo, and others. For the atmosphere, they in-        surface temperature measurements that are not obtainable with
clude a cloud mask, cloud optical thickness and microphysical       the SSM/I.
properties, cloud top properties, cloud thermodynamic phase,           The data products that will be produced and archived
aerosol optical depth, aerosol size distribution, total ozone,      routinely from the AMSR-E measurements are rainfall, total
total precipitable water, and temperature and water vapor           column water vapor, total column cloud water, sea surface
profiles [14]. The data products are at spatial resolutions of 1    temperature, sea surface wind speed, sea ice concentration, sea
km, 500 m, and 250 m, which is the finest spatial resolution for    ice temperature, snow depth on sea ice, snow-water equivalent
data from any of the Aqua instruments.                              and snow depth on land, and surface soil moisture [14]. Spatial
   Because MODIS measures visible and infrared radiation, sur-      resolutions of the data vary from approximately 5 km for the
face conditions are obscured in the presence of a substantial       89-GHz channels to approximately 56 km for the 6.9-GHz
cloud cover. Hence, considerable effort has gone into the de-       channels.
velopment of a MODIS cloud mask [29], [30], which serves as            Several of the variables measured by AMSR-E, such as sea
a primary input to many of the other MODIS algorithms, in-          ice, snow cover, and sea surface temperature, are also mea-
cluding those for many of the MODIS atmosphere products as          sured by MODIS, which obtains finer spatial resolution. The
well as the ocean and land products.                                advantage of AMSR-E for these variables is the ability of the
   The Aqua MODIS is the second MODIS instrument in space,          microwave instrument to obtain surface data even in the pres-
the first being on Terra. The Aqua MODIS incorporates some          ence of a substantial cloud cover. This is possible through the
improvements over the Terra MODIS, notably a reduction in op-       inclusion on AMSR-E of several channels measuring at wave-
tical and electronic cross talk among the different bands and an    lengths where there is little atmospheric interference with the
improved radiative response versus scan-angle for the thermal       signal. A second salient feature relevant to the AMSR-E obser-
emissive bands. Also, a gain change has been made in two of         vations is the fact that the radiation measured (microwave) is
the Aqua MODIS bands (bands 31 and 32, measuring at wave-           being emitted by the earth/atmosphere system, and therefore the
lengths of 10.78–11.28 m and 11.77–12.27 m, respectively)           measurements can be made irrespective of whether sunlight is
in order to have these bands saturate at a temperature of about     available. Combined, these two features mean that the AMSR-E
340 K rather than saturating at about 400 K as on Terra. The gain   provides Aqua with an all-weather, day-or-night capability even
change allows greater detail for temperatures below 340 K but       for surface variables. This capability complements the finer spa-
eliminates all detail in temperatures above 340 K. The change       tial resolution of the MODIS data and greatly enhances the value
is aimed at improving the MODIS-derived sea surface temper-         of the Aqua mission for climate studies.
atures calculated from the data of these two bands.                    Further information about the AMSR-E instrument and
   Further information about the MODIS instrument can be            data processing can be found in [37], and further information
found in [31], and further information about its use in land        about AMSR-E algorithm development and data validation
research and ocean research can be found in [32]–[34]. Run-         plans of NASDA can be found in [38]. The U.S. and Japanese
ning et al. [32] further place the MODIS land effort in the         Science Teams have the same algorithms for some variables
larger context of the full EOS effort in land ecosystems and        and separate algorithms for others. The U.S. algorithms are
hydrology. The MODIS atmosphere products are described in           detailed in AMSR-E Algorithm Theoretical Basis Documents
[29] and [30], with the latter covering the cloud products. Gao     (ATBDs) available on the Internet [39], with some of these
et al. [35] and Key et al. [36] look more specifically at the use   algorithms also described and updated in this TGARS Aqua
PARKINSON: AQUA: AN EARTH-OBSERVING SATELLITE MISSION 177
Fig. 2. Schematic of the Aqua orbit, with labels for nine consecutive passes over the equator. The satellite travels north across the equator at 1:30 P.M. and south
across the equator at 1:30 A.M. (schematic by J. Allen).
special issue [40]–[43]. The U.S. rainfall calculations employ there were six ascent burns, concluding on June 17 with Aqua’s
separate schemes for over the oceans versus over the land, reaching its operational altitude of 705 km. The operational orbit
due to the impact on the retrievals of the vastly different is near-polar and sun-synchronous, with an inclination of 98.2
underlying surface, and these are described in [40]. The sea (Fig. 2). Aqua orbits the earth every 98.8 min, each time crossing
ice concentration calculations employ separate schemes for the equator going north at 1:30 P.M. local time and going south
the Northern and Southern Hemispheres. The algorithm for at 1:30 A.M. Because of the broad swaths of the instruments, the
the Northern Hemisphere standard product distinguishes two local times of data collection along the equator range over the
ice types (first-year and multiyear ice) that are distinct and intervals of about 12:50–2:10 P.M. and about 12:50–2:10 A.M.,
abundant in the Arctic, whereas the algorithm for the standard with a somewhat larger range for MODIS and CERES data and
product in the Southern Hemisphere, where there is relatively a somewhat smaller range for the other four instruments, all de-
little multiyear ice, does not discriminate among ice types [41]. pendent on the respective swath widths. Further, because of the
Comiso et al. [41] describe the ice concentration algorithms for convergence of longitude lines near the poles, the time range of
both hemispheres, along with the algorithms for ice tempera- data collection broadens as one moves from the equator toward
ture and snow depth on sea ice. The soil moisture algorithm either pole, with the ranges in the polar regions including all
is based on a multichannel iterative approach described in times of day and night. For the poles themselves, data are col-
[42], and the algorithm for snow depth on land is based on a lected on each orbit, i.e., every 98.8 min. This translates to 14
dense media radiative transfer model and a basic model of the or 15 times a day, depending on the day.
evolution of snow grain radius, described in [43]. The snow The Aqua orbit allows all six earth-observing instruments to
depth algorithm assumes spatially and temporally dynamic obtain global data coverage, although only the CERES instru-
snow pack properties and was selected over an alternative ments have a broad enough swath (limb to limb) to allow global
algorithm assuming static properties, as a result of superior daytime and nighttime coverage in the course of a single day.
performance with test SSM/I data [43]. The other instruments, with swath widths ranging from 1445
Additional information about each of the Aqua instruments km for AMSR-E to 2330 km for MODIS, have low-latitude data
and the full suite of standard data products can be found in [1] gaps between successive orbits, preventing full global daytime
and [14]. Details of the data-product algorithms from the four or nighttime coverage within a day. These data gaps are filled in
U.S. Science Teams can be found in the ATBDs [44]. on subsequent days, with full global coverage from each instru-
ment obtainable in two days.
In contrast to the Aqua orbit, the Terra satellite moves south
III. LAUNCH AND ORBIT
across the equator at 10:30–10:45 A.M. and north across the
Aqua was launched on board a Delta II 7920-10L rocket from equator at 10:30–10:45 P.M. As with Aqua, the broad swaths
Vandenberg Air Force Base in California at 2:55 A.M. Pacific of the Terra instruments and the convergence of longitude lines
Daylight Time on May 4, 2002. As planned, the rocket lifted the greatly increase the range of times of data collection. With Terra
spacecraft to an altitude of 685 km, and over the next 44 days and Aqua both flying, the amount of potential daily data from178 IEEE TRANSACTIONS ON GEOSCIENCE AND REMOTE SENSING, VOL. 41, NO. 2, FEBRUARY 2003
Fig. 3. Global sea surface temperatures averaged for June 2–4, 2002, as derived from early uncalibrated AMSR-E data (image courtesy of NASDA).
the two instruments common to both spacecraft, MODIS and The dataflow from the AIRS visible channels began on May
CERES, is double the amount obtainable from either satellite 26 and from the AIRS infrared channels began on June 12,
alone. This is of significant value in providing information on 2002. The CERES dataflow began on June 18, and the MODIS
the diurnal cycle of some of the rapidly changing variables being dataflow began on June 24. In each case, very quickly after the
examined, such as clouds and aerosols, and in providing im- instrument was turned on, the relevant science team had cre-
proved daily and longer term statistics on those variables. ated images illustrating the successful performance of the in-
Because of the respective late morning and early afternoon strument. Highlights abounded, one being the first infrared spec-
data collection times, Terra and Aqua were formerly named trum from AIRS, establishing that all 2378 infrared channels on
EOS AM and EOS PM, respectively. AIRS were working. A highlight for MODIS was the consis-
tently clean images, free of an undesired striping that had been a
problem with some of the initial images from the Terra MODIS.
IV. EARLY ON-ORBIT PROGRESS Within 24 hours of when MODIS was first turned on in its sci-
ence mode, June 24, a quality image was created of fires occur-
After launch, Aqua underwent a 120-day checkout period,
ring in Australia, a tribute to advances in the data processing
during which the functionalities of the six earth-observing in-
system as well as to the performance of the instrument.
struments and many other hardware and software pieces were
On July 12, after all six instruments were operating, the Aqua
thoroughly checked out. The six earth-observing instruments
direct broadcast system was turned on. This system allows di-
were turned on to earth-observing mode in a carefully scripted
rect access to the raw Aqua data by anyone with direct broad-
sequence that began with the AMSU on May 12, followed two
cast receiving equipment. The next major transition occurred
days later by the HSB. Within days, the AIRS/AMSU/HSB Sci-
on September 1, when the Aqua mission completed its 120-day
ence Team created images from these data streams, mapping
checkout period and was declared operational.
color-coded brightness temperatures for individual channels of
data across the eastern U.S., the western U.S., and Brazil.
The next instrument to be turned on was NASDA’s AMSR-E, V. DATAFLOW, PROCESSING, AVAILABILITY, AND VALIDATION
with its dataflow beginning on May 24. Some initial compli- With all instruments operating, the Aqua dataflow is ap-
cations with the AMSR-E data were analyzed by NASDA and proximately 8.23 Mb/s (89 GB/day): 6847 kb/s from MODIS,
solved only eight days after the initial turn on of the instrument, 1270 kb/s from AIRS, 87.4 kb/s from AMSR-E, 20.0 kb/s from
when on June 1 a command was sent to the instrument to adjust the two CERES combined, 4.2 kb/s from HSB, and 2.0 kb/s
the automatic gain control. Several days later, NASDA created from AMSU. These data are stored on the spacecraft during
two global maps illustrative of the high-quality data from the each orbit, then relayed through Aqua’s X-band antenna from
AMSR-E, one map showing sea surface temperatures (Fig. 3) the spacecraft to ground stations in Poker Flat, AK, Svalbard,
and the other showing a color-composite produced from three of Norway, and, on occasion, Wallops Flight Facility, Wallops
the AMSR-E channels. On June 24, 2002, these two images be- Island, VA. From the ground stations, the data are sent to the
came the centerpiece of the first NASA press release including EOS Data and Operations System (EDOS) at Goddard Space
actual Aqua images. Flight Center (GSFC) in Greenbelt, MD.PARKINSON: AQUA: AN EARTH-OBSERVING SATELLITE MISSION 179
The CERES data move directly from GSFC to Langley Re- Experiment (WINTEX) in March 1999 and from the Chesa-
search Center, where the CERES data processing is carried out. peake Lighthouse and Aircraft Measurements for Satellites
The AMSR-E data are routed instead from GSFC to NASDA’s (CLAMS) aircraft campaign in July 2001 [19]. Fetzer et al.
Earth Observation Center (EOC) in Hatoyama, Japan, where [46] provide an overview of the entire AIRS/AMSU/HSB
the initial AMSR-E data processing is done. EOC makes postlaunch validation program, including a worldwide ra-
near-real-time products available to the Japan Meteorological diosonde network, Atmospheric Radiation Measurement
Agency, the Japan Fishery Information Center, and other (ARM) sites, aircraft campaigns, and 11 individually funded
operational users [37], and transmits processed data back to the focused validation efforts on specific AIRS/AMSU/HSB data
U.S. for two subsequent levels of processing, the first at Remote products. Other articles in this TGARS special issue include,
Sensing Systems in Santa Rosa, CA, and the second at Marshall more specifically, descriptions of planned efforts for validation
Space Flight Center’s Global Hydrology and Climate Center of the AIRS visible/near infrared observations [7], validation
in Huntsville, AL. MODIS data processing is done at GSFC, of the AIRS/AMSU/HSB precipitation measurements [18],
as is much of the data processing for the AIRS/AMSU/HSB South American validation sites for the HSB [12], and early
sounding suite. In the case of the AIRS/AMSU/HSB, however, validation (during the first six months after launch) of the AIRS
the raw data are also transmitted to NOAA’s National Envi- radiances over oceans [47].
ronmental Satellite, Data, and Information Service (NESDIS).
At NOAA NESDIS, the data are reduced to the subset needed
for near-real-time weather forecasting and this subset is sent VI. ANTICIPATED IMPROVEMENTS RELEVANT
TO WEATHER FORECASTING
to weather forecasting centers, all within three hours of data
receipt on the ground. Separately, the standard processing of Certain data products are particularly noteworthy for the
the AIRS/AMSU/HSB data for purposes other than weather level of accuracy anticipated from the Aqua data. Prominent
forecasting is done at GSFC, using the software supplied by among these are the atmospheric temperatures anticipated
the AIRS/AMSU/HSB Science Team. from the AIRS/AMSU/HSB instrument triplet. The goal is to
The processed data from Aqua are available from NASA’s have global rms temperature accuracies of 1 K for every 1-km
Distributed Active Archive Centers (DAACs) as follows. layer of the troposphere [46] and every 3–5-km layer of the
• AIRS/AMSU/HSB data products are available stratosphere [4], [6]. This would match the accuracies now
from the Goddard Space Flight Center DAAC at obtained from balloon-borne radiosondes released at various
http://daac.gsfc.nasa.gov. land locations around the world [46], with AIRS/AMSU/HSB
• CERES data products are available from the Langley Re- making such accuracies available globally, over ocean as
search Center DAAC at http://eosweb.larc.nasa.gov. well as land and at all latitudes. Current satellite atmospheric
• MODIS ocean and atmosphere data products are avail- temperature accuracies for the troposphere are instead approx-
able from the Goddard Space Flight Center DAAC at imately 1.6 K, in 2-km-thick layers, from NOAA operational
http://daac.gsfc.nasa.gov. satellites [21]. Complementing the temperature improvements,
• MODIS land data products are available from the Earth the aim for the AIRS/AMSU/HSB humidity measurements is
Resources Observation System (EROS) Data Center to obtain accuracies of 10% in 2-km atmospheric layers [6],
DAAC at http://edcwww.cr.usgs.gov/landdaac. [46], improved from accuracies of approximately 50% for the
• MODIS snow and ice data products are available from the NOAA data [62] and again matching, and perhaps exceeding,
National Snow and Ice Data Center DAAC at http://www- the 10% radiosonde accuracies in 2-km layers [6], [46]. For
nsidc.colorado.edu. 1-km layers, the aim is for humidity accuracies of 20% [4].
• AMSR-E data products are available from the National Furthermore, the AIRS/AMSU/HSB suite can measure water
Snow and Ice Data Center DAAC at http://www-nsidc.col- vapor in the upper troposphere, to pressure levels of about 100
orado.edu. mb, well above the 300-mb level (about 12 km) that tends to be
The data products are being analyzed for their accuracy the upper limit for conventional radiosondes [6].
through numerous validation efforts. All of the Aqua Science There is much anticipation that the improved atmospheric
Teams have extensive validation programs, and all are using temperature and humidity profiles have the potential of re-
aircraft, ships, and field campaigns in a variety of climatic sulting in improved weather forecasts, through incorporation
zones, as well as intercomparisons with other satellite data. of the AIRS/AMSU/HSB data in weather forecasting models
Only the AIRS/AMSU/HSB validation plans are described in [6], [11]. NASA and NOAA have worked closely on this
detail in this volume (see the following paragraph), although aspect of the Aqua mission, with NOAA scientists prominently
King et al. [29] mention several of the validation efforts for the involved in the development of the algorithms needed for near
MODIS atmosphere products, and Njoku et al. [42] describe real-time products to be available to NOAA and other weather
U.S. validation plans for the AMSR-E soil measurements. Shi- forecasting agencies around the world within three hours
bata et al. [38] provide an overview of the Japanese AMSR-E of data collection. Details on the near real-time products in
Science Team’s validation plans, some of which are being done support of data assimilation for weather forecasting, and on the
jointly with the U.S. AMSR-E Science Team. The U.S. Team’s importance of assimilating cloud-cleared radiances as well as
plans are outlined on the Internet [45]. radiances from cloud-free fields of view, can be found in [11].
Prelaunch, the spectroscopy used in the AIRS radiative No more than about 5% of the AIRS/AMSU/HSB retrievals
transfer algorithm was validated with data from the Winter are fully cloud-free, and, hence, assimilating only cloud-free180 IEEE TRANSACTIONS ON GEOSCIENCE AND REMOTE SENSING, VOL. 41, NO. 2, FEBRUARY 2003
Fig. 4. Schematic indicating the wavelength and frequency ranges of the measurements from each of Aqua’s six earth-observing instruments.
fields of view would greatly limit the value of incorporating advanced products. MODIS is built on the heritage of the
the AIRS/AMSU/HSB data in the forecast models [11]. Advanced Very High Resolution Radiometer (AVHRR), the
Cloud-clearing methodologies for these data are described in Landsat Thematic Mapper, and the Nimbus 7 Coastal Zone
[4] and [17]. Color Scanner (CZCS), and the MODIS data are being used
Although the Aqua data most frequently referred to as to extend records from all of those sensors. For instance,
having the potential for improving weather forecasts are the the MODIS data are being used to extend the records of the
AIRS/AMSU/HSB atmospheric temperatures and humidities, normalized difference vegetation index (NDVI) from AVHRR
other Aqua data products are also potentially of value for (e.g., [48] and [49]), while also being used to generate an
forecasting purposes. For a prime example, the MODIS polar enhanced vegetation index that obtains better detail than the
tropospheric winds show great promise in improving forecasts NDVI, especially in heavily vegetated regions such as the
at high latitudes. Some numerical weather prediction models tropical rainforests [14]. AMSR-E is built on the heritage of
have incorporated wind products from geostationary satellites SMMR and SSM/I and its data will be used to extend time
since the late 1990s, but geostationary satellites are positioned series generated from the precursor instruments for such vari-
over the equator and rarely collect useful data for the polar ables as sea ice and continental snow cover. Sea ice scientists
regions. Conveniently, these are precisely the regions for which are particularly interested to see whether the downward trend
the polar orbiting satellites, such as Aqua, provide the most in ice extents in the Arctic [50] continues, as expected in a
frequent coverage. Key et al. [36] have modified the algorithms strong global warming scenario, or whether it stabilizes or even
for the geostationary satellites to be appropriate for the MODIS reverses. Extending these and other climate records will aid in
data and have tested the modified algorithms on a 30-day Terra the analysis of issues related to global warming and climate
MODIS dataset. The test dataset demonstrates that assimilating change.
the MODIS winds into the forecasting models of the European
Centre for Medium Range Weather Forecasts (ECMWF) and 2) Improved Understanding of the Role of Clouds in Global
the NASA Goddard Space Flight Center Data Assimilation Climate Change
Office (DAO) yields significantly improved forecasts for both
Clouds cover approximately 50% of the globe at any mo-
the Arctic and the Antarctic [36].
ment, are often highly reflective of incoming solar radiation,
and often absorb significant amounts of outgoing longwave ra-
VII. SELECTED ANTICIPATED ADDITIONAL ADVANCES
diation, all of which ensure their importance to the global cli-
The suite of instruments on Aqua, with its visible, infrared, mate system. The Intergovernmental Panel on Climate Change
and microwave measurements (Fig. 4), will allow scientists to (IPCC) has declared clouds and their effects to be the greatest
monitor many earth/atmosphere variables, extend records from uncertainty in determining climate sensitivity to either natural
many previous satellite instruments, and analyze changes in and or anthropogenic changes [51], [52] and has further indicated
interconnections among elements of the total climate system. the critical importance of improved global cloud observations
The following are a few highlights of what can be expected be- [52]. The CERES Science Team and colleagues have made no-
yond those already described. table progress recently using data from the TRMM and Terra
CERES in conjunction with earlier datasets. For instance, they
1) Lengthened Climate Records have provided evidence that the tropical radiative energy budget
All of the Aqua instruments build on the heritage of previous is much more variable than previously thought and that this de-
satellite instruments and will extend records created with the pends critically on changes in mean cloudiness [27]. They have
data from the earlier instruments. For instance, CERES is built also used the TRMM CERES data to examine aspects of the iris
on the heritage of the Earth Radiation Budget Experiment hypothesis [53] that surface temperature increases in the tropics
(ERBE), and the CERES data are being used to extend ERBE could lead to cloud cover decreases, letting more infrared radi-
records [27], [28] as well as to produce considerably more ation out of the earth/atmosphere system (analogous to openingPARKINSON: AQUA: AN EARTH-OBSERVING SATELLITE MISSION 181
the eye’s iris) and perhaps thereby providing a negative feed- absence of sunlight in the high polar latitudes for months at a
back in the global climate system. Analyses of the CERES data time [57]. The AIRS/AMSU/HSB data are obtainable for all lat-
indicate that the relevant tropical clouds are brighter and warmer itudes throughout the year and thus offer the exciting possibility
than previously assumed, in fact so much so that the hypothe- of space-based observations of the Antarctic ozone hole in the
sized negative feedback based on an infrared iris [53] is more midst of the Antarctic winter, supplementing the current TOMS
than counterbalanced by a positive feedback based on visible observations for the rest of the year.
radiation [54]. Another atmospheric trace gas that might be derived from the
Adding the data from the Aqua CERES and MODIS to the AIRS/AMSU/HSB data is carbon dioxide CO . CO is not a
data from the TRMM CERES and Terra CERES and MODIS standard product for the Aqua mission but is a research effort
doubles the incoming dataflow (the TRMM CERES is no within the AIRS/AMSU/HSB Science Team. If successful, this
longer operating) and allows much greater detail in measuring effort could lead to the first satellite-derived global monitoring
the diurnal variations of clouds and radiation components. of the second most important greenhouse gas in earth’s environ-
This should further improve the ability to monitor and analyze ment, exceeded in importance only by water vapor.
clouds and their effects. AMSR-E is expected to provide the first routinely produced
and scientifically validated spaceborne measurements of global
soil moisture [61], advancing on earlier, more limited studies
3) New Spaceborne Observations using data from SMMR, SSM/I, and TMI (e.g., [58] and [59]).
Soil moisture is a key determinant of surface evaporation,
Most of the Aqua data products are products that have been runoff, and water availability for agriculture and other human
generated previously from other spacecraft (although perhaps uses, and is a key for improved hydrologic modeling, weather
from different algorithms and at different resolutions or accura- and climate prediction, and flood and drought monitoring
cies). For instance, the MODIS and CERES products have al- [42]. None of the Aqua instruments is ideal for measuring soil
most all been generated previously from the Terra MODIS and moisture, but the AMSR-E provides a start. Satellite-based
CERES data; most of the AMSR-E products have been gen- soil moisture measurements would most likely be better from
erated previously from SMMR and/or SSM/I data; and many instruments measuring at frequencies of about 1–2 GHz
of the AIRS/AMSU/HSB products have been generated previ- (L-band), although somewhat higher frequencies, as in the
ously from NOAA data. Still, there are some important new lower frequency channels of AMSR-E, are also useable [42].
products (or new aspects), among them being a land evapora- Low frequencies are desired to limit contamination by vegeta-
tion fraction from MODIS data, nighttime ozone measurements tion cover and atmospheric effects. Only the Nimbus 7 SMMR,
from AIRS/AMSU/HSB data, and validated global soil mois- operational from late 1978 through mid-1987, has so far
ture from AMSR-E data. provided long-term global data at a frequency below 10 GHz
The MODIS land evaporation fraction is the energy budget (6.6 GHz specifically). However, because of the difficulties
equivalent of the ratio of actual to potential evapotranspiration of obtaining soil moisture and the coarse spatial resolution
and is calculated by a method based on normalizing the radio- (140 km) of the SMMR 6.6-GHz data, there was no dedicated
metric surface temperature with NDVI values [55]. Potential ap- algorithm development program for deriving soil moisture
plications include water resources management and analysis of from the SMMR data. With AMSR-E, a soil moisture product
vegetation stress and wildlife fire risk. The evaporation fraction is being calculated from the 6.9-, 10.7-, and, to a lesser extent,
is not being derived routinely from the Terra MODIS data, as 18.7-GHz channels, at approximately 60-km spatial resolution
it is expected to be from the Aqua MODIS data, but it has been [42]. The derived values are representative of only about the
tested on the Terra data in preparation for Aqua [55]. The advan- top 1 cm of the soil layer and are valid only under conditions
tages of Aqua over Terra for this product include the early-af- of little or no vegetation. However, low vegetation areas are
ternoon timing (for much of the globe) of the Aqua daytime often precisely those where issues of water availability are
passes [63] and the synergistic value of having AIRS, AMSU, most crucial. Thus, despite the limitations (which also include
HSB, and AMSR-E flying along with MODIS on Aqua. Re- 6.9-GHz radio frequency interference in some regions, as
garding the latter, of particular importance are the temperature discussed in [42]), the AMSR-E soil moisture measurements
and water vapor profiles provided by AIRS/AMSU/HSB and the are an exciting new possibility, and they should serve as an
soil moisture information provided by AMSR-E [55]. important step toward future dedicated soil moisture missions
The AIRS/AMSU/HSB ozone measurements have an advan- measuring at lower microwave frequencies [60]. The dedicated
tage over previous satellite-derived ozone measurements in not missions will obtain soil moisture representative of a deeper
requiring solar radiation and therefore allowing a nighttime as layer of the soil (a few centimeters) and valid over a wider
well as a daytime product. The Total Ozone Mapping Spectrom- range of land conditions than the AMSR-E product [60].
eter (TOMS) has provided a strong record of satellite-derived The 6.9- and 10.7-GHz channels on AMSR-E (not available
ozone measurements since late 1978 [56], and the TOMS data on SSM/I) are also being used to calculate sea ice temperature
will serve as a primary standard against which to validate the [41] and sea surface temperature (SST) (Fig. 3). SSTs are cur-
AIRS/AMSU/HSB ozone product under daylight conditions. rently being calculated from TMI data for the tropics, but the
However, the TOMS measures ultraviolet radiation and there- AMSR-E allows all-weather SST measurements to be obtain-
fore requires sunlight. This is restrictive for examining polar able at higher latitudes as well, not restricted to the 40 S–40 N
phenomena, such as the Antarctic ozone hole, because of the geographic coverage of TRMM.182 IEEE TRANSACTIONS ON GEOSCIENCE AND REMOTE SENSING, VOL. 41, NO. 2, FEBRUARY 2003
The examples in this section and Section VI are provided to [17] J. Susskind, C. Barnet, and J. Blaisdell, “Determination of atmospheric
give a flavor of some of the contributions expected from the and surface parameters from simulated AIRS/AMSU/HSB sounding
data: Retrieval and cloud clearing methodology,” Adv. Space Res., vol.
Aqua mission. Many more details are provided in the individual 21, pp. 369–384, Mar. 1998.
papers of this special issue of TGARS. The Aqua mission [18] F. W. Chen and D. H. Staelin, “AIRS/AMSU/HSB precipitation esti-
will be routinely generating over 100 data products, only a mates,” IEEE Trans. Geosci. Remote Sensing, vol. 41, pp. 410–417, Feb.
2003.
selection of which are described in this volume. For a more [19] L. L. Strow, S. E. Hannon, S. De Souza-Machado, H. E. Motteler, and
comprehensive listing and brief descriptions of the data prod- D. Tobin, “An overview of the AIRS radiative transfer model,” IEEE
Trans. Geosci. Remote Sensing, vol. 41, pp. 303–313, Feb. 2003.
ucts, the reader is referred to [14]. For up-to-date information [20] E. Fishbein, C. B. Farmer, S. L. Granger, D. T. Gregorich, M. R. Gunson,
on the mission, interested readers can check the Aqua science S. E. Hannon, M. D. Hofstadter, S.-Y. Lee, S. S. Leroy, and L. L. Strow,
Web site at aqua.nasa.gov and the science team Web sites “Formulation and validation of simulated data for the Atmospheric In-
frared Sounder (AIRS),” IEEE Trans. Geosci. Remote Sensing, vol. 41,
at www-airs.jpl.nasa.gov, www.ghcc.msfc.nasa.gov/AMSR, pp. 314–329, Feb. 2003.
asd-www.larc.nasa.gov/ceres, and modis.gsfc.nasa.gov. [21] B. H. Lambrigtsen and S.-Y. Lee, “Coalignment and synchronization of
the AIRS instrument suite,” IEEE Trans. Geosci. Remote Sensing, vol.
41, pp. 343–351, Feb. 2003.
ACKNOWLEDGMENT [22] B. R. Barkstrom, “The Earth Radiation Budget Experiment (ERBE),”
Bull. Amer. Meteorol. Soc., vol. 65, pp. 1170–1185, Nov. 1984.
The author thanks Guest Editor C. Kummerow and three [23] B. R. Barkstrom and G. L. Smith, “The Earth Radiation Budget
anonymous reviewers for helpful suggestions on the manuscript Experiment: Science and implementation,” Rev. Geophys., vol. 24, pp.
379–390, 1986.
and the entire Aqua team for making this work possible. [24] B. A. Wielicki, B. R. Barkstrom, E. F. Harrison, R. B. Lee III, G. L.
Smith, and J. E. Cooper, “Clouds and the Earth’s Radiant Energy System
(CERES): An Earth Observing System experiment,” Bull. Amer. Mete-
REFERENCES orol. Soc., vol. 77, no. 5, pp. 853–868, May 1996.
[1] M. D. King and R. Greenstone, 1999 EOS Reference Hand- [25] B. A. Wielicki, B. R. Barkstrom, B. A. Baum, T. P. Charlock, R. N.
book. Greenbelt, MD: NASA Goddard Space Flight Center, 1999, Green, D. P. Kratz, R. B. Lee III, P. Minnis, G. L. Smith, T. Wong, D. F.
pp. 1–361. Young, R. D. Cess, J. A. Coakley Jr, D. A. H. Crommelynck, L. Donner,
[2] M. D. King, R. Greenstone, and W. Bandeen, Eds., EOS Science Plan: R. Kandel, M. D. King, A. J. Miller, V. Ramanathan, D. A. Randall, L.
The State of Science in the EOS Program. Greenbelt, MD: NASA God- L. Stowe, and R. M. Welch, “Clouds and the Earth’s Radiant Energy
dard Space Flight Center, 1999, pp. 1–397. System (CERES): Algorithm overview,” IEEE Trans. Geosci. Remote
[3] “Special issue on EOS AM-1 platform, instruments, and scientific data,” Sensing, vol. 36, pp. 1127–1141, July 1998.
IEEE Trans. Geosc. Remote Sensing, vol. 36, pp. 1039–1353, July 1998. [26] D. L. Hartmann, C. S. Bretherton, T. P. Charlock, M. D. Chou, A. Del
[4] J. Susskind, C. D. Barnet, and J. M. Blaisdell, “Retrieval of atmospheric Genio, R. E. Dickinson, R. Fu, R. A. Houze, M. D. King, K. M. Lau, C.
and surface parameters from AIRS/AMSU/HSB data in the presence of B. Leovy, S. Sorooshian, J. Washburne, B. Wielicki, and R. C. Willson,
clouds,” IEEE Trans. Geosci. Remote Sensing, vol. 41, pp. 390–409, “Radiation, clouds, water vapor, precipitation, and atmospheric circu-
lation,” in EOS Science Plan: The State of Science in the EOS Pro-
Feb. 2003.
gram. Greenbelt, MD: NASA Goddard Space Flight Center, 1999, pp.
[5] T. S. Pagano, H. H. Aumann, D. E. Hagan, and K. Overoye, “Prelaunch
39–114.
and in-flight radiometric calibration of the Atmospheric Infrared
[27] B. A. Wielicki, T. Wong, R. P. Allan, A. Slingo, J. T. Kiehl, B. J. Soden,
Sounder (AIRS),” IEEE Trans. Geosci. Remote Sensing, vol. 41, pp.
C. T. Gordon, A. J. Miller, S.-K. Yang, D. A. Randall, F. Robertson, J.
265–273, Feb. 2003.
Susskind, and H. Jacobowitz, “Evidence for large decadal variability in
[6] H. H. Aumann, M. T. Chahine, C. Gautier, M. D. Goldberg, E. Kalnay, the tropical mean radiative energy budget,” Science, vol. 295, no. 5556,
L. M. McMillin, H. Revercomb, P. W. Rosenkranz, W. L. Smith, D. H. pp. 841–844, Feb. 2002.
Staelin, L. L. Strow, and J. Susskind, “AIRS/AMSU/HSB on the Aqua [28] J. Chen, B. E. Carlson, and A. D. Del Genio, “Evidence for strengthening
mission: Design, science objectives, data products, and processing sys- of the tropical general circulation in the 1990s,” Science, vol. 295, no.
tems,” IEEE Trans. Geosci. Remote Sensing, vol. 41, pp. 253–264, Feb. 5556, pp. 838–841, Feb. 2002.
2003. [29] M. D. King, W. P. Menzel, Y. J. Kaufman, D. Tanré, B.-C. Gao, S.
[7] C. Gautier, Y. Shiren, and M. D. Hofstadter, “AIRS/Vis Near IR instru- Platnick, S. A. Ackerman, L. A. Remer, R. Pincus, and P. A. Hubanks,
ment,” IEEE Trans. Geosci. Remote Sensing, vol. 41, pp. 330–342, Feb. “Cloud and aerosol properties, precipitable water, and profiles of tem-
2003. perature and water vapor from MODIS,” IEEE Trans. Geosci. Remote
[8] L. L. Strow, S. E. Hannon, M. Weiler, K. Overoye, S. L. Gaiser, and Sensing, vol. 41, pp. 442–458, Feb. 2003.
H. H. Aumann, “Prelaunch spectral calibration of the Atmospheric In- [30] S. Platnick, M. D. King, S. A. Ackerman, W. P. Menzel, B. A. Baum, J.
frared Sounder (AIRS),” IEEE Trans. Geosci. Remote Sensing, vol. 41, C. Riédi, and R. A. Frey, “The MODIS cloud products: Algorithms and
pp. 274–286, Feb. 2003. examples from Terra,” IEEE Trans. Geosci. Remote Sensing, vol. 41, pp.
[9] S. L. Gaiser, H. H. Aumann, L. L. Strow, S. E. Hannon, and M. Weiler, 459–473, Feb. 2003.
“In-flight spectral calibration of the Atmospheric Infrared Sounder,” [31] W. L. Barnes, T. S. Pagano, and V. V. Salomonson, “Prelaunch
IEEE Trans. Geosci. Remote Sensing, vol. 41, pp. 287–297, Feb. 2003. characteristics of the Moderate Resolution Imaging Spectroradiometer
[10] D. T. Gregorich and H. H. Aumann, “Verification of AIRS boresight ac- (MODIS) on EOS-AM1,” IEEE Trans. Geosci. Remote Sensing, vol.
curacy using coastline detection,” IEEE Trans. Geosci. Remote Sensing, 36, pp. 1088–1100, July 1998.
vol. 41, pp. 298–302, Feb. 2003. [32] S. W. Running, G. J. Collatz, J. Washburne, S. Sorooshian, T. Dunne,
[11] M. D. Goldberg, Y. Qu, L. M. McMillin, W. Wolf, L. Zhou, and M. R. E. Dickinson, W. J. Shuttleworth, C. J. Vorosmarty, and E. F. Wood,
Divarkarla, “AIRS near-real-time products and algorithms in support of “Land ecosystems and hydrology,” in EOS Science Plan: The State of
operational numerical weather prediction,” IEEE Trans. Geosci. Remote Science in the EOS Program. Greenbelt, MD: NASA Goddard Space
Sensing, vol. 41, pp. 379–389, Feb. 2003. Flight Center, 1999, pp. 197–259.
[12] B. H. Lambrigtsen and R. V. Calheiros, “The Humidity Sounder for [33] C. O. Justice, E. Vermote, J. R. G. Townshend, R. Defries, D. P. Roy,
Brazil—An international partnership,” IEEE Trans. Geosci. Remote D. K. Hall, V. V. Salomonson, J. L. Privette, G. Riggs, A. Strahler, W.
Sensing, vol. 41, pp. 352–361, Feb. 2003. Lucht, R. B. Myneni, Y. Knyazikhin, S. W. Running, R. R. Nemani,
[13] B. H. Lambrigtsen, “Calibration of the AIRS microwave instruments,” Z. Wan, A. R. Huete, W. van Leeuwen, R. E. Wolfe, L. Giglio, J.-P.
IEEE Trans. Geosci. Remote Sensing, vol. 41, pp. 369–378, Feb. 2003. Muller, P. Lewis, and M. J. Barnsley, “The Moderate Resolution Imaging
[14] C. L. Parkinson and R. Greenstone, EOS Data Products Hand- Spectroradiometer (MODIS): Land remote sensing for global change
book. Greenbelt, MD: NASA Goddard Space Flight Center, 2000, research,” IEEE Trans. Geosci. Remote Sensing, vol. 36, pp. 1228–1249,
vol. 2, pp. 1–253. July 1998.
[15] P. W. Rosenkranz, “Retrieval of temperature and moisture profiles from [34] W. E. Esaias, M. R. Abbott, I. Barton, O. B. Brown, J. W. Campbell, K. L.
AMSU-A and AMSU-B measurements,” IEEE Trans. Geosci. Remote Carder, D. K. Clark, R. H. Evans, F. E. Hoge, H. R. Gordon, W. M. Balch,
Sensing, vol. 39, pp. 2429–2435, Nov. 2001. R. Letelier, and P. J. Minnett, “An overview of MODIS capabilities for
[16] , “Rapid radiative transfer model for AMSU/HSB channels,” IEEE ocean science observations,” IEEE Trans. Geosci. Remote Sensing, vol.
Trans. Geosci. Remote Sensing, vol. 41, pp. 362–368, Feb. 2003. 36, pp. 1250–1265, July 1998.You can also read