Development of an Ozone Monitoring Instrument (OMI) aerosol index (AI) data assimilation scheme for aerosol modeling over bright surfaces - a step ...
←
→
Page content transcription
If your browser does not render page correctly, please read the page content below
Geosci. Model Dev., 14, 27–42, 2021
https://doi.org/10.5194/gmd-14-27-2021
© Author(s) 2021. This work is distributed under
the Creative Commons Attribution 4.0 License.

Development of an Ozone Monitoring Instrument (OMI) aerosol
index (AI) data assimilation scheme for aerosol modeling over
bright surfaces – a step toward direct radiance assimilation in the
UV spectrum
Jianglong Zhang1 , Robert J. D. Spurr2 , Jeffrey S. Reid3 , Peng Xian3 , Peter R. Colarco4 , James R. Campbell3 ,
Edward J. Hyer3 , and Nancy L. Baker3
1 Department of Atmospheric Sciences, University of North Dakota, Grand Forks, ND, USA
2 RTSolutions Inc., Cambridge, MA, USA
3 Marine Meteorology Division, Naval Research Laboratory, Monterey, CA, USA
4 NASA Goddard Space Flight Center, Greenbelt, MD, USA

Correspondence: Jianglong Zhang (jianglong.zhang@und.edu)

Received: 29 June 2020 – Discussion started: 8 July 2020
Revised: 12 September 2020 – Accepted: 27 October 2020 – Published: 5 January 2021

Abstract. Using the Vector LInearized Discrete Ordinate Ra-      Ozone Mapping and Profiler Suite (OMPS), and eventually
diative Transfer (VLIDORT) code as the main driver for for-      the Plankton, Aerosol, Cloud and ocean Ecosystem (PACE)
ward model simulations, a first-of-its-kind data assimilation    mission.
scheme has been developed for assimilating Ozone Monitor-
ing Instrument (OMI) aerosol index (AI) measurements into
the Naval Aerosol Analysis and Predictive System (NAAPS).        1   Introduction
This study suggests that both root mean square error (RMSE)
and absolute errors can be significantly reduced in NAAPS        Operational chemical transport modeling (CTM) of atmo-
analyses with the use of OMI AI data assimilation when com-      spheric aerosol particles, including simulation of sources
pared to values from NAAPS natural runs. Improvements in         and sinks and long-range transport of aerosol events such
model simulations demonstrate the utility of OMI AI data         as biomass burning aerosols from fires and dust outbreaks,
assimilation for aerosol model analysis over cloudy regions      is now commonplace at global meteorology centers for air
and bright surfaces. However, the OMI AI data assimilation       quality and visibility forecasts (e.g., Sessions et al., 2015;
alone does not outperform aerosol data assimilation that uses    Lynch et al., 2016). Variational and ensemble-based assim-
passive-based aerosol optical depth (AOD) products over          ilation of satellite-derived aerosol products such as aerosol
cloud-free skies and dark surfaces. Further, as AI assimila-     optical depth (AOD), lidar backscatter measurements, and
tion requires the deployment of a fully multiple-scatter-aware   surface aerosol properties can substantially improve accura-
radiative transfer model in the forward simulations, compu-      cies in CTM analyses and forecasts (Zhang et al., 2008, 2011,
tational burden is an issue. Nevertheless, the newly devel-      2014; Yumimoto et al., 2008; Uno et al., 2008; Benedetti et
oped modeling system contains the necessary ingredients for      al., 2009; Schutgens et al., 2010; Sekiyama et al., 2010; Saide
assimilation of radiances in the ultraviolet (UV) spectrum,      et al. 2013; Schwartz et al., 2012; Li et al., 2013; Rubin et al.,
and our study shows the potential of direct radiance assim-      2017; Lynch et al., 2016).
ilation at both UV and visible spectrums, possibly coupled          Currently, the main satellite inputs for operational aerosol
with AOD assimilation, for aerosol applications in the future.   modeling are AOD products derived from passive-based
Additional data streams can be added, including data from        polar-orbiting imagers, such as the Moderate Resolution
the TROPOspheric Monitoring Instrument (TROPOMI), the            Imaging Spectroradiometer (MODIS), the Visible Infrared

Published by Copernicus Publications on behalf of the European Geosciences Union.
28                                                      J. Zhang et al.: Development of an OMI AI data assimilation scheme

Imaging Radiometer Suite (VIIRS), and the Advance Very              and absorption (e.g., the VIIRS + OMPS product; Lee et al.,
High Resolution Radiometer (AVHRR). Experimentation is              2015). Details of the developed OMI AI assimilation system
proceeding with the use of products from the multi-angle            are presented in the paper, which is organized as follows:
imaging spectroradiometer (MISR) (e.g., Lynch et al., 2016;         datasets used in the study are summarized in Sect. 2. Sec-
Randles et al., 2017; Buchard et al., 2017) and from geosta-        tion 3 discusses the components of the AI-DA system. Sec-
tionary instruments such as Himawari and the Geostationary          tion 4 provides an evaluation of the developed system, and
Operational Environmental Satellite (GOES). A major ad-             Sect. 5 contains a summary discussion.
vantage with such passive-based satellite sensors is that the
AOD is retrieved with high spatial and temporal resolution
over relatively broad fields of view (e.g., Zhang et al., 2014).    2     Datasets and models
For example, MODIS and VIIRS provide near-global daily
daytime coverage (e.g., Levy et al., 2013; Hsu et al., 2019),       Three datasets are used in this study. These are (i) the OMI
and GOES and Himawari are capable of retrieving AOD over            level 2 UV aerosol product (OMAERUV; Torres et al., 2007),
North American and East Asian regions at sub-hourly tem-            (ii) the Aerosol Robotic Network (AERONET; Holben et al.,
poral resolution (e.g., Bessho et al., 2016).                       1998) AOD product, and (iii) reanalysis data from the Naval
   To date, these traditional passive-based satellite AOD re-       Aerosol Analysis and Prediction System (NAAPS; Lynch et
trievals have been limited to darker surfaces and relatively        al., 2016), which was the first operational global aerosol mass
cloud-free conditions. The widely used MODIS Dark Tar-              transport model available to the community. The assimilation
get aerosol data, for instance, are globally available only         system is based on spatial and temporal variations of aerosol
over oceans and dark land surfaces (e.g., Levy et al., 2013).       particles from NAAPS (Zhang and Reid, 2006; Zhang et al.,
The MISR and MODIS Deep Blue aerosol products are also              2008), and the Vector LInearized Discrete Ordinate Radiative
available over some arid environments but are not applica-          Transfer (VLIDORT; Spurr, 2006) code is used to construct
ble to snow- and ice-covered regions (e.g., Kahn et al., 2010;      a forward model for the AI-DA system.
Hsu et al., 2013). Also, none of the abovementioned aerosol
                                                                    2.1    OMI aerosol product
products are valid over cloudy regions.
   In comparison to AOD, the semi-quantitative UV-based
                                                                    UV aerosol index data from the OMI level 2 version 3 UV
aerosol index (AI) has long been used to monitor major
                                                                    aerosol products (OMAERUV) are used in this study. The
aerosol events such as smoke plumes and dust storms, start-
                                                                    OMI is onboard the Aura satellite (launched in 2004) and it
ing with the Total Ozone Mapping Spectrometer (TOMS)
                                                                    observes the Earth’s atmosphere over the UV–visible spec-
from the late 1970s (Herman et al., 1997). AI is derived us-
                                                                    trum with a pixel size of 13 × 24 km at nadir for the global
ing the ratio of observed UV radiances to simulated ones
                                                                    scan mode and a swath of ∼ 2600 km (Levelt et al., 2018).
assuming only a clear Rayleigh sky (e.g., Torres et al.,
                                                                    The daytime equatorial crossing for the Aura platform is
2007). AI retrievals are currently computed using observa-
                                                                    ∼ 13:30. The dataset comprises the UV AI, viewing and solar
tions from sensors with ozone-sensitive channels. For exam-
                                                                    geometries, spectrally dependent surface albedos at the 354
ple, the Ozone Monitoring Instrument (OMI), Ozone Map-
                                                                    and 388 nm spectral channels, terrain pressure, geolocations,
ping and Profiler Suite (OMPS), TROPOspheric Monitoring
                                                                    XTrack and algorithm quality flags, and other aerosol and
Instrument (TROPOMI), and the future Plankton, Aerosol,
                                                                    ancillary parameters. The UV AI is designed to detect UV-
Cloud and ocean Ecosystem (PACE) mission include ozone-
                                                                    absorbing aerosol particles and is based on radiance observa-
sensitive channels that can detect UV-absorbing aerosol par-
                                                                    tions at 354 nm (Iobs354 ) and calculated radiance (Ical354 ) at
ticles, such as black-carbon-laden smoke or iron-bearing
                                                                    354 nm for a Rayleigh (no aerosol) atmosphere (e.g., Torres
dust, over bright surfaces, such as desert, snow- and ice-
                                                                    et al., 2007) defined as
covered regions, and aerosol plumes above clouds (e.g., Tor-
res et al., 2012; Yu et al., 2012; Alfaro-Contreras et al., 2014,                    Iobs354
2016).                                                              AI = −100log10           .                                  (1)
                                                                                     Ical354
   To complement existing AOD assimilating systems, we
have developed an AI data assimilation (AI-DA) system that          Unbiased, noise-reduced, quality-assured AI data are neces-
is capable of assimilating OMI AI over bright surfaces and          sary for AI data assimilation. This is especially important for
cloudy regions for aerosol analyses and forecasts. This study       OMI observations due to this particular sensor suffering from
can be considered one of the first attempts at direct radiance      well-referenced “row anomaly” issues (Torres et al., 2018).
assimilation in the UV spectrum for aerosol applications, as        To remove pixels with row anomalies, only retrievals with
AI can be directly computed from UV radiances and the de-           XTrack flag values of 0 are retained. Also, abnormal AI val-
veloped OMI AI-DA system has all the necessary compo-               ues were identified over mountain regions. Thus, retrievals
nents for a typical radiance assimilation package. In time          with terrain and surface pressure less than 850 hPa are ex-
we expect our assimilation model to merge with AOD or so-           cluded in the study. Finally, only retrievals with OMI AI val-
lar radiance assimilation to influence aerosol loading, height,     ues larger than −2 are used. Therefore, OMI observations

Geosci. Model Dev., 14, 27–42, 2021                                                    https://doi.org/10.5194/gmd-14-27-2021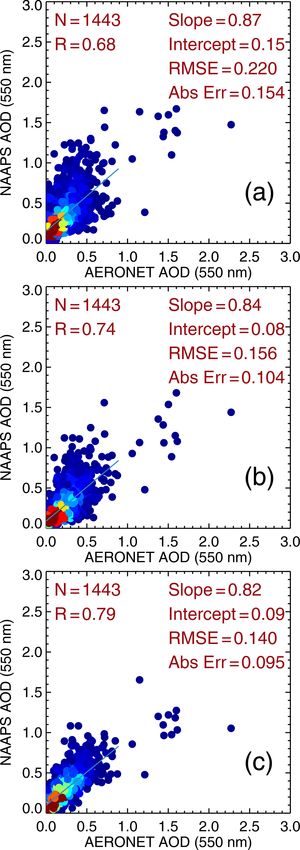
J. Zhang et al.: Development of an OMI AI data assimilation scheme                                                            29

over cloudy skies, which could have negative OMI AI val-          model. In this version, quality-controlled retrievals of AOD
ues, are also included.                                           from MODIS and MISR (Zhang and Reid, 2006; Hyer et al.,
   Both cloud-free and above-cloud AI data satisfying these       2011; Shi et al., 2014) are assimilated into NAAPS through
quality checks are aggregated and averaged in 1 × 1◦              the Naval Research Laboratory Atmospheric Variation Data
(latitude–longitude) bins. As a radiative transfer model run      Assimilation System–AOD System (NAVDAS-AOD; e.g.,
is applied for each observation, the gridded data are used in     Zhang et al., 2008, 2011, 2014). Aerosol source functions,
the assimilation process in order to reduce the computational     including biomass burning, smoke, and dust emissions, are
burden. Averaged parameters for the gridded data include the      regionally tuned based on the AERONET data. Other aerosol
solar and sensor zenith angles, the relative azimuth angles,      processes, including dry deposition over water, are also tuned
the spectrally dependent surface albedos at 354 and 388 nm,       based on AOD data assimilation correction fields. NOAA
the cloud fraction, and the AI values themselves. Additional      Climate Prediction Center (CPC) MORPHing (CMORPH)
quality assurance steps are also applied during the spatial av-   precipitation data are used to constrain the wet removal pro-
eraging process. Isolated high AI values are removed as fol-      cess within the tropics (Joyce et al., 2004). The usage of
lows. First, for a 4 × 4 pixel box, if the mean AI is less than   CMORPH avoids the ubiquitous precipitation bias that ex-
0.7 but an individual AI value is larger than 0.7, then that      ists in all global atmospheric models (e.g., Dai, 2006) and is
one value is removed. Second, if the standard deviation of AI     proven to improve aerosol wet deposition, therefore yielding
values for a 3 × 3 pixel box surrounding a pixel is larger than   better AOD (Xian et al., 2009). The reanalysis agrees rea-
0.5, that individual AI value is likewise removed. Note that      sonably well with AERONET data on a global scale (Lynch
both approaches are essentially homogeneity tests that are        et al., 2016) and also reproduces AOD trends that are in
used for identifying outliers. The thresholds are empirically     good agreement with satellite-based analyses (e.g., Zhang
estimated through visual inspection.                              and Reid, 2010; Hsu et al., 2012). In this study, we use a
                                                                  free-running version of NAAPS reanalysis v1 without AOD
2.2   AERONET data                                                assimilation to provide aerosol fields every 6 h at 1◦ × 1◦
                                                                  (latitude–longitude) resolution.
Version 3 level 2 daytime, cloud-cleared, and quality-assured
AERONET data are used to evaluate the performance of the          2.4   VLIDORT radiative transfer code
OMI AI data assimilation in our study (Holben et al., 1998;
Giles et al., 2019). During daytime, AOD from AERONET             VLIDORT is a linearized, multiple-scatter radiative transfer
instruments are derived by measuring the attenuated solar ra-     model for the simultaneous generation of Stokes 4-vectors
diance typically at eight wavelengths ranging from 340 to         and analytically derived Jacobians (weighting functions) of
1640 nm. In this study, AERONET data are collocated with          these 4-vectors with respect to any atmospheric or surface
NAAPS analyses with and without OMI AI assimilation.              property (Spurr, 2006). The model uses discrete-ordinate
In order to collocate AERONET and NAAPS AOD data,                 methods to solve the polarized plane-parallel RT equations
AERONET AOD values within ±30 min of a given NAAPS                in a multilayer atmosphere, plus the solution of a bound-
analysis time are averaged and used as ground-based AOD           ary value problem and subsequent source function integra-
values for the NAAPS 1 × 1◦ (latitude–longitude) collocated       tion to obtain radiation fields at any geometry and any at-
bins. As AERONET data require a cloud-free line of sight to       mospheric level. VLIDORT has a “pseudo-spherical” ansatz:
the solar disk, the performance of OMI AI data assimilation       the treatment of solar-beam attenuation in a spherical-shell
over overcast regions is not evaluated.                           atmosphere before scattering. Single scattering in VLIDORT
                                                                  is accurate for both line-of-sight and solar-beam spheri-
2.3   NAAPS and NAAPS reanalysis data                             cal geometry. The model has a full thermal emission ca-
                                                                  pability. VLIDORT has two supplements, one dealing with
The NAAPS (http://www.nrlmry.navy.mil/aerosol/, last ac-          bidirectional (non-Lambertian) reflection at the surface and
cess: 18 December 2020) model is a multispecies, three-           the other with the inclusion of surface light sources (SIF
dimensional, Eulerian global transport model using the op-        or water-leaving radiances). Full details on the VLIDORT
erational Navy Global Environmental Model (NAVGEM) as             model may be found in a recent review paper (Spurr and
the meteorological driver (Hogan et al., 2014). NAAPS pro-        Christi, 2019, and references to VLIDORT therein).
vides 6 d forecasts at a 3 h interval with a spatial resolution      VLIDORT is used to simulate the AI in this study. Simu-
of 1/3◦ (latitude–longitude) and 42 vertical levels on a global   lations at 354 and 388 nm are performed for both Rayleigh
scale. NAAPS predicts four aerosol particle classes: anthro-      atmospheres and scenarios with aerosol loadings (four mass-
pogenic and biogenic fine particles (ABF, such as primary         mixing profiles for different aerosol types) taken from the
and secondary organic aerosols and sulfate aerosols), dust,       NAAPS model. In addition to the AI, Jacobian calculations
biomass burning smoke, and sea salt (Lynch et al, 2016).          are needed with respect to these aerosol profiles. Firstly, ra-
   The 2003–2018 NAAPS reanalysis version 1 (v1) (Lynch           diance Jacobians with respect to these four mass-mixing pro-
et al., 2016) is a modified version of the operational NAAPS      files are computed analytically using VLIDORT’s lineariza-

https://doi.org/10.5194/gmd-14-27-2021                                                   Geosci. Model Dev., 14, 27–42, 2021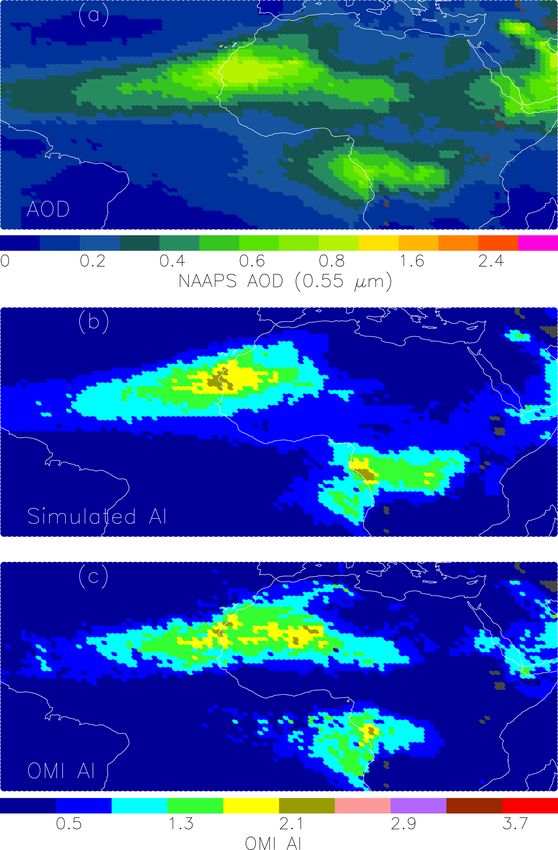
30                                                         J. Zhang et al.: Development of an OMI AI data assimilation scheme

Table 1. Mass extinction efficiencies (σ , m2 g−1 ) and single-       (GEOS-5) model (e.g., Colarco et al., 2014; Buchard et al.,
scattering albedos (ωo ) used in this study.                          2015). Note that the study period is July and August of 2007
                                                                      over Africa, coinciding with the early biomass burning sea-
                       ABF     Dust   Smoke     Sea salt              son associated with lower single-scattering albedo values
                                                                      (Eck et al., 2013). With that in mind, we choose a quite
         σ (354 nm)    7.81    0.56      6.91      0.52
                                                                      low value of 0.85 for the single-scattering albedo value at
         ωo (354 nm)    1.0    0.88      0.85       1.0
         σ (388 nm)    6.96    0.58      6.07      0.52               354 nm (e.g., Eck et al., 2013; Cochrane et al., 2019). A
         ωo (388 nm)    1.0    0.91      0.86       1.0               slightly higher single-scattering albedo of 0.86 is assumed
                                                                      at 388 nm. The slight increase in single-scattering albedo
                                                                      from 354 to 388 nm has also been observed from Solar Spec-
                                                                      tral Flux Radiometer (SSFR) observations during the recent
tion facility; secondly, the associated Jacobians of AI are fur-
                                                                      NASA ObseRvations of CLouds above Aerosols and their
ther derived through a second VLIDORT linearization with
                                                                      intEractionS (ORACLES) campaign (Pistone et al., 2019).
respect to the Lambertian-equivalent reflectivity. The details
                                                                      Scattering matrices for dust, smoke, sea salt, and sulfate (to
of this process are given in the next section.
                                                                      represent ABF) aerosols are based on associated expansion
                                                                      coefficients (e.g., Colarco et al., 2014; Buchard et al., 2015)
3     OMI AI assimilation system                                      taken from NASA’s GEOS-5 model. Also, to reduce com-
                                                                      putational expenses, scalar radiative transfer calculations are
The OMI assimilation system has three components: a for-              performed.
ward model, a 3-D variational assimilation system, and a                 To simulate OMI AI, the Lambertian equivalent reflectiv-
post-processing system. Based on the background NAAPS 3-              ity (LER) at 388 nm (R388 ) is needed for estimating LER
D aerosol concentrations for dust, smoke, ABF, and sea salt           at 354 nm. The R388 is calculated from VLIDORT based on
aerosols, the forward model not only computes the associated          Eq. (2) below, adapted from Buchard et al. (2015), or as
AI values, but also their Jacobians of AI with respect to the
                                                                                   Iaer388 (ρ388 ) − Iray388 (0)
four aerosol mass loading profiles. The 3-D variational as-           R388 =                                          .               (2)
similation system is a modified 3-D NAVDAS-AOD system                          T + Sb (Iaer388 (ρ388 ) − Iray388 (0))
(Zhang et al., 2008, 2011, 2014) that computes increments             Iray388 (0) is the calculated path radiance at 388 nm assuming
for dust and smoke aerosol concentrations based on OMI AI             a Rayleigh atmosphere with surface albedo 0. T and Sb are
data. The post-processing system constructs a new NAAPS               the calculated transmittance and spherical albedo at 388 nm.
analysis based on the background NAAPS aerosol concen-                Iaer388 (ρ388 ) is the computed radiance including 3-D aerosol
trations and increments as derived from the 3-D variational           fields from NAAPS and the 388 nm surface albedo from OMI
assimilation system. Details of the forward model and the             data. In Buchard et al. (2015), an adjusting factor is applied
modified NAVDAS-AOD system are described in this sec-                 to R388 by adding the difference between climatological sur-
tion.                                                                 face albedos at 354 and 388 nm. A similar approach is also
                                                                      adopted in this study, as shown in their Eq. (3).
3.1    Forward model for simulating OMI AI
                                                                      R 0 388 = R388 − (ρ388 − ρ354 ).                                (3)
To construct an AI-DA system, a forward model is needed
to simulate AI using aerosol concentrations from NAAPS.               Here, R 0 388 is surface-albedo-adjusted Lambertian equiva-
In this study, the forward model is built around the VLI-             lent reflectivity at 388 nm. ρ388 and ρ354 are surface albedo
DORT model, following a similar method to that suggested              values at 388 and 354 nm channels that are obtained from the
in Buchard et al. (2015). Here VLIDORT is configured to               OMI OMAERUV data. Finally, the simulated AI (AInaaps ) is
compute OMI radiances and Jacobians as functions of the               given by
observational conditions at 354 and 388 nm using geoloca-
tion information from OMI data such as satellite zenith, solar                                 Iaer354 (ρ354 )
zenith, and relative azimuth angles, as well as ancillary OMI         AInaaps = −100log10                        .                    (4)
                                                                                              Iray354 (R 0 388 )
data (surface albedos at 354 and 388 nm).
   To convert from NAAPS mass loading concentrations to               Here, Iaer354 (ρ354 ) is the calculated radiance at 354 nm using
aerosol extinction and scattering profiles, we require aerosol        NAAPS aerosol fields and the OMI-reported surface albedo
optical properties for the four species at 354 and 388 nm,            at 354 nm (ρ354 ). Iray354 (R 0 388 ) is the calculated radiance as-
which are summarized in Table 1. The optical properties of            suming a Rayleigh atmosphere and the derived value of R 0 388
ABF (assumed to be sulfate in this study), sea salt, dust,            as the surface albedo (Buchard et al., 2015).
and smoke aerosols, including mass extinction efficiencies               The forward-model-simulated OMI AI values are inter-
and single-scattering albedos at 354 and 388 nm, are adapted          compared with OMI AI values as shown in Fig. 1 for the
from NASA’s Goddard Earth Observing System version 5                  study region. A total of 1 month (1–31 July 2007) of NAAPS

Geosci. Model Dev., 14, 27–42, 2021                                                        https://doi.org/10.5194/gmd-14-27-2021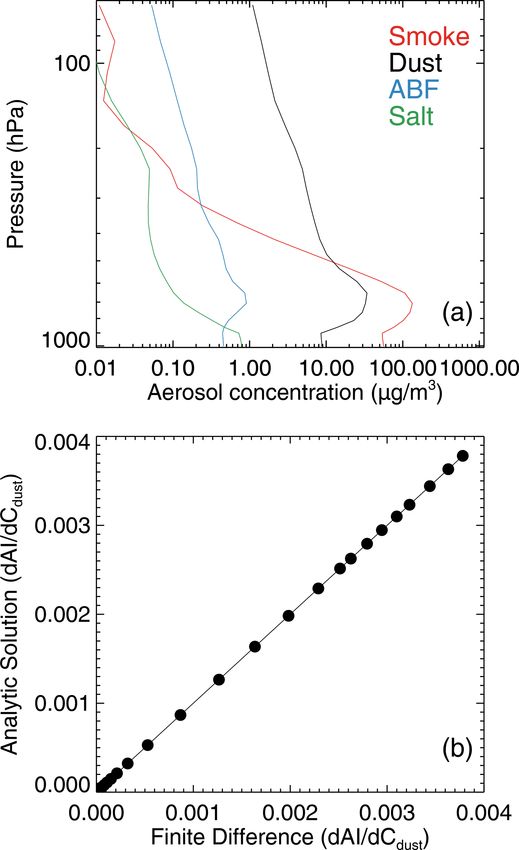
J. Zhang et al.: Development of an OMI AI data assimilation scheme                                                                      31

                                                                       and OMI AI datasets. OMI AI data are grid-averaged in
                                                                       1◦ × 1◦ (latitude–longitude) bins. Also, we focus on Africa
                                                                       in this paper as this area includes dust plumes over deserts
                                                                       and smoke plumes overlying stratus cloud decks. The Arctic
                                                                       is not included as additional efforts may be needed to fully
                                                                       understand the properties of sea ice reflectivity; we leave this
                                                                       topic for a future paper. Only bins that have valid NAAPS
                                                                       and OMI AI data are used to generate Fig. 1. Dust plumes
                                                                       are visible over northern Africa and the Persian Gulf, and a
                                                                       smoke plume from central Africa is also evident. These UV-
                                                                       absorbing aerosol plumes are also captured by OMI AI, as
                                                                       seen in Fig. 1c. Shown in Fig. 1b is the simulated OMI AI us-
                                                                       ing the NAAPS aerosol fields and viewing geometries with
                                                                       surface albedos from OMI. The simulated OMI AI shows
                                                                       similar patterns to those derived from OMI, especially for
                                                                       the dust plumes over northern Africa and smoke plumes over
                                                                       central Africa. An overall correlation of 0.79 is found be-
                                                                       tween simulated and satellite-retrieved OMI AI values, as
                                                                       shown in Fig. 1, suggesting that the forward model is func-
                                                                       tioning reasonably as designed.

                                                                       3.2   Forward model for Jacobians of AI

                                                                       Jacobians of OMI AI with respect to aerosol mass concen-
                                                                       trations are needed for the OMI AI assimilation system. In
                                                                       this study, AI Jacobians (K) are calculated from radiance Ja-
                                                                       cobians with respect to aerosol mass concentrations for four
                                                                       aerosol species (smoke, dust, ABF and sulfate, sea salt) at
                                                                       354 nm (K354,nk = ∂I∂M aer354
                                                                                                 nk
                                                                                                     ) and 388 nm (K388,nk = ∂I∂M aer388
                                                                                                                                     nk
                                                                                                                                         )
                                                                       wavelengths. Here Mnk is the mass concentration for aerosol
                                                                       type, k, and for vertical layer, n. Iaer354 and Iaer388 are radi-
Figure 1. (a) Spatial distribution of NAAPS AODs using NAAPS           ances for the 354 and 388 nm channels, respectively. K354,nk
reanalysis data from the collocated OMI and NAAPS dataset for          and K388,nk are the corresponding radiance Jacobians at 354
July 2007. (b) Simulated AI using NAAPS reanalysis data as shown       and 388 nm, respectively. AI Jacobians can then be calcu-
in (a). (c) Spatial distribution of OMI AI using gridded OMI data      lated through analytic differentiation of the basic formula in
from the collocated OMI and NAAPS dataset for July 2007. Grey          Eq. (1), and, after some algebra, we find the following result:
highlights those 1×1◦ (latitude–longitude) bins that have fewer than
three collocated NAAPS and OMI AI data points for the study pe-         ∂AI
riod.                                                                       = A1 K354,nk (ρ354 ) − A2 K388,nk (ρ388 ) .                 (6)
                                                                       ∂Mnk

                                                                       Here, A1 and A2 are respectively given by Eqs. (7) and (8),
reanalysis data and OMI AI data were used. Note that OMI               as
AI data over both cloud-free and cloudy skies were used.
Since surface albedos included in the OMI data represent                                  100
                                                                       A1 = −                             ,                    (7)
reflectivities under clear-sky situations, the albedo under a                   Iaer354 (ρ354 ) × ln 10
cloudy sky is then computed as

                                                                                                                  ∂Iray354 (R 0 388 )

ρcld = ρclr × (1 − fc ) + 0.8 × fc .                            (5)                        100
                                                                       A2 = −
                                                                                 Iray354 (R 0 388 ) × ln 10             ∂R
Here, ρclr and fc are the clear-sky surface albedo (e.g., ρ354               "                   #
or ρ388 ) and the cloud fraction, both quantities obtained from                (1 − Sb R388 )2
                                                                                                    .                                   (8)
the OMI dataset. Clouds are assumed to be tropospheric                                T
(close to the surface) with a UV albedo of 0.8 such that this
equation applies to both the 354 and 388 nm channels.                  Based on these equations, radiance Jacobians with respect
   Figure 1a shows the spatial distribution of NAAPS AOD               to aerosol particles, K354,nk and K388,nk , are computed at
over central and northern Africa using collocated NAAPS                354 and 388 nm, respectively, using OMI-reported surface

https://doi.org/10.5194/gmd-14-27-2021                                                           Geosci. Model Dev., 14, 27–42, 2021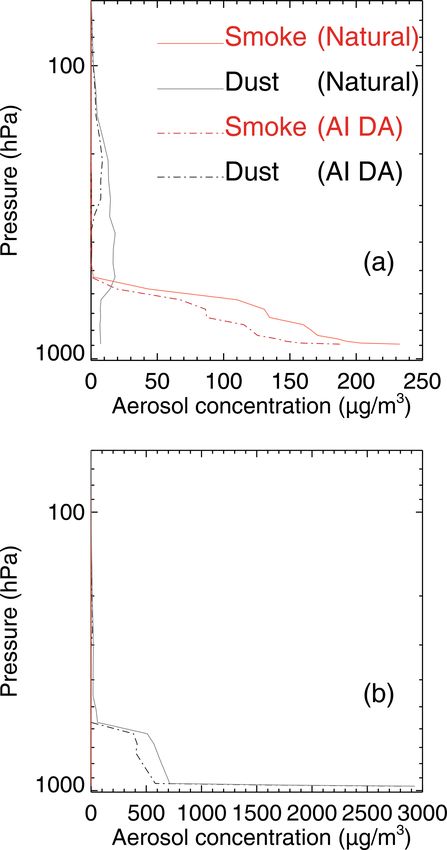
32                                                          J. Zhang et al.: Development of an OMI AI data assimilation scheme

                                                                        3.3   The variational OMI AI assimilation system

                                                                        The OMI AI assimilation system is based on AI simula-
                                                                        tions (with Jacobians) from the forward model. Two prin-
                                                                        ciples underlie the assimilation procedure. First, we assume
                                                                        that OMI AI is sensitive to UV-absorbing aerosol parti-
                                                                        cles, such as NAAPS smoke and dust, or that only smoke
                                                                        and dust are injected high enough into the troposphere to
                                                                        impact AI. Therefore, innovations are limited to modifi-
                                                                        cations of dust and smoke aerosol properties. For classes
                                                                        that do not strongly project onto AI, such as sea salt and
                                                                        ABF aerosols, aerosol concentrations are not modified dur-
                                                                        ing the process. Second, contributions of smoke and dust
                                                                        aerosols to AI (AIsmoke / AIdust ) prior to assimilation are es-
                                                                        timated by multiplying smoke and dust aerosol concentra-
                                                                        tions from NAAPS with Jacobians of AI for the respective
                                                                        smoke and dust aerosols. The ratio of AI innovation from
                                                                        smoke aerosols (1AIsmoke ) to total AI innovation (1AI or
                                                                        OMI AI − AInaaps ) is assumed to be the ratio of AIsmoke
                                                                        to AIsmoke + AIdust . The same assumption holds for dust
                                                                        aerosols.
                                                                           Given these two principles, the overall design concept for
                                                                        the OMI AI assimilation can be expressed as

Figure 2. (a) Vertical distributions of smoke, dust, anthropogenic,                        Pdust HTdust
                                                                        Ca = Cb +                             [y − H (C b )]
and sea salt aerosols for the test case as shown in (b). (b) Scatter                 Hdust Pdust HTdust + R
plot of Jacobians of AI as a function of dust concentration: analytic                               b
versus finite-difference solutions.                                                          Hdust Cdust
                                                                                 ×          b +H      b
                                                                                     Hdust Cdust smk Csmk

albedo values (ρ354 and ρ388 ), followed by a calculation of                               Psmk HTsmk
                      ∂I   (R 0 388 )                                            +                            [y − H (C b )]
the albedo Jacobian ray354∂R          at 354 nm.                                     Hsmk Psmk HTsmk + R
   To check this analytic Jacobian calculation in Eqs. (6)–                                        b
                                                                                             Hsmk Csmk
(8), we compute the aerosol AI Jacobians using a finite-                         ×          b +H      b
                                                                                                                 ,                  (10)
                                                                                     Hdust Cdust smk Csmk
difference (FD) method. Here, the derivative of AI as a func-
tion of the aerosol concentration of a species, k, in layer n, is
computed using                                                          where C b and C a are NAAPS aerosol concentrations for the
                                                                                                                        b
                                                                        analysis and background fields, respectively, Cdust       b
                                                                                                                            and Csmk
 ∂AI    (AI − AI0 )                                                     are background NAAPS particle mass concentrations for dust
     =                 .                                         (9)
∂Mnk   (Cnk − C 0 nk )                                                  and smoke, H (C) is the NAAPS forward model that links
                                                                        NAAPS particle mass concentrations to AI, and H is defined
Here Cnk and C 0 nk are the baseline and perturbed aerosol
                                                                        as ∂H (C)/∂C, which is the Jacobian matrix of AI with re-
concentrations, respectively, and AI and AI’ are computed
                                                                        spect to aerosol concentrations. Y is the observed OMI AI,
using Cnk and C 0 nk , respectively.
                                                                        and Y − H (C b ) is the innovation of AI representing the dif-
   Figure 2b shows the comparison of Jacobians of dust
                                                                        ference between observed and modeled AI values.
aerosols estimated from the analytic and the FD solutions.                                  b
                                                                                     Hdust Cdust                    b
                                                                                                              Hsmk Csmk
Dust, smoke, ABF, and sea salt aerosol concentrations as a                 The        b          b  and       b         b   terms are
                                                                                Hdust Cdust +Hsmk Csmk     Hdust Cdust +Hsmk Csmk
function of altitude are shown in Fig. 2a. To compute FD Ja-            the fractional contribution of innovation from dust and
cobians with respect to dust aerosols, a 10 % perturbation is           smoke aerosol, respectively. These terms are estimated
introduced in the dust profiles. A very close match is found            using NAAPS aerosol concentrations for relatively high
between analytic and FD Jacobians. This validates the ana-              aerosol loading cases (AOD > 0.15). For low aerosol load-
lytical solution used in the study. The analytic solution is of         ing (AOD < 0.15) as reported from NAAPS, it is possi-
course much faster, as a single call to VLIDORT will deliver            ble that NAAPS could underestimate aerosol concentra-
all necessary Jacobians at one wavelength compared to 97                tions. Thus, the fractional contribution of innovations is as-
separate calls to VLIDORT with the FD calculation (base-                signed a value of 1 for the dominant aerosol type based on
line; four species perturbations in the 24-layer atmosphere).           a NAAPS aerosol climatology (Zhang et al., 2008). Note

Geosci. Model Dev., 14, 27–42, 2021                                                          https://doi.org/10.5194/gmd-14-27-2021
J. Zhang et al.: Development of an OMI AI data assimilation scheme 33
b
Hdust Cdust
that the term [y − H (C b )] × b +H b is in obser- Therefore, for regions with OMI AI values larger than 0.8,
Hdust Cdust smk Csmk
vational space. Pdust and Psmk are model error covariance UV-absorbing aerosol particles can be added or removed
matrices for dust and smoke aerosols (e.g., Zhang et al., from air columns based on innovations, which are the differ-
2008, 2011, 2014). R is the observation-based error covari- ences between OMI-reported and simulated AI values. For
Pdust HTdust b
Hdust Cdust regions with OMI AI values less than 0.8, innovations are
ance. The [y − H (C b )] × only used to remove UV-absorbing aerosol particles from air
Hdust Pdust HTdust +R b +H
Hdust Cdust b
smk Csmk
T
Psmk Hsmk b
Hsmk Csmk columns.
and [y − H (C b )] × terms
Hsmk Psmk HTsmk +R b +H
Hdust Cdust b
smk Csmk
represent the estimated increments in model space.
The background error covariance matrix is constructed 4 System evaluation and discussion
from modeled error variances and error correlations follow-
ing the methodology in previous studies (Zhang et al., 2008, 4.1 Evaluating the performance of the AI assimilation
2011). The horizontal background error correlation is gener- system over Africa
ated using the second-order regressive function (SOAR), as
shown in Eq. (11) (Zhang et al., 2008), or Using 2 months of OMI data (July–August 2007), the per-
formance of OMI AI assimilation was evaluated around the
Rxy
C(x, y) = (1 + Rxy /L) exp − . (11) Africa region (20◦ S–40◦ N; 60◦ W–50◦ E). The study region
L was chosen to examine the performance of OMI AI data as-
Here, x and y are two given locations, and Rxy is the great similation over bright surfaces such as the deserts of northern
circle distance. L is the averaged error correlation length and Africa and to study aerosol advection over clouds, in this case
is set to 200 km based on Zhang et al. (2008). Similarly, the smoke off the west coast of southern Africa. In this demon-
vertical error correlation between two pressure levels p1 and stration, two NAAPS runs were performed for the period of
p2 is also based on the SOAR function, this time in pressure 1 July to 31 August 2007, one with and one without the use of
space, based on Zhang et al. (2011): OMI AI assimilation (AI-DA run). Both runs were initialized
with the use of NAAPS reanalysis data at 00:00 UTC 1 July
Zp2
R p dlnp and do not include any other form of aerosol assimilation.
dlnp 2
e− p1 L .
C(p1 , p2 ) = 1 + (12) Figure 3a shows the true-color composite from Aqua
L MODIS for 28 July 2007 over the study region that is ob-
p1
tained from the NASA Worldview site (https://worldview.
Here, L is a unitless number representing vertical correlation earthdata.nasa.gov/; last access: June 2020). Visible in the
length and is set to 0.2. image are the dust plumes from northern Africa transported
The horizontal error variance is based on the root mean to the Atlantic Ocean and smoke plumes from central and
square error (RMSE) of aerosol concentrations, which is southern Africa transported to the west coast of South Africa.
arbitrarily set to 100 µg m−3 for near-surface dust aerosols As indicated by the aggregated OMI AI data for 12:00 UTC
(ground to 700 hPa). The RMSE of dust aerosol mass is as- on 28 July 2007 (Fig. 3b), dust plumes from northern Africa
sumed to decrease as altitude increases and is set to 50 %, are transported to the north corner of the west coast of north-
25 %, and 1 % of the near-surface values for 500–700, 350– ern Africa. Smoke plumes are also visible in the OMI AI plot
500, and 70–350 hPa, respectively. Note that different aerosol in southern Africa and are transported to the west coast and
species have different mass extinction efficiency values. Here over the Atlantic. Comparing Fig. 3a and b, smoke plumes,
we assume that the modeled error in aerosol extinction is the as identified from OMI, are also found over cloudy regions as
same for different aerosol species, and thus the RMSE of the indicated from the MODIS visible imagery. Note that Fig. 3b
smoke aerosol concentration is scaled by the mass extinction shows the OMI AI data used in the assimilation process, and
efficiency ratio between smoke and dust aerosols. The obser- again AI retrievals over both cloud-free and cloudy condi-
vational errors are assumed to be non-correlated in this study tions are included as suggested by Fig. 3b.
(e.g., Zhang et al., 2008). OMI AI values over cloud-free and Figure 3c is the 12:00 UTC, 28 July 2007 NAAPS AOD
cloudy skies are used in the study, and therefore RMSEs of product from the natural run. In comparison, Fig. 3d shows
AI are required for both these situations. Note that, as sug- the same situation, this time with the use of OMI AI data as-
gested by Yu et al. (2012), for the same above-cloud CALIOP similation. Comparing Fig. 3b and d, dust and smoke aerosol
AOD, variations in AI are found to be of the order of 1 for patterns as shown from OMI AI more closely resemble the
cloud optical depth changing from 2 to 20. Thus, we assume NAAPS AOD fields after AI assimilation. Over the north-
that the RMSE of OMI AI is 0.5 for cloud-free skies, in- east coast of Africa, heavy aerosol plumes, as hinted at in
creasing linearly with the cloud fraction up to a value of 1 NAAPS AOD from the natural run (Fig. 3c), cover larger
for 100 % overcast. spatial areas than those inferred from OMI AI data. In com-
Lastly, we assume that detectable UV-absorbing aerosols parison, NAAPS AOD patterns from the OMI AI data assim-
have AI values larger than 0.8 (e.g., Torres et al., 2013). ilation cycle closely resemble aerosol patterns as suggested
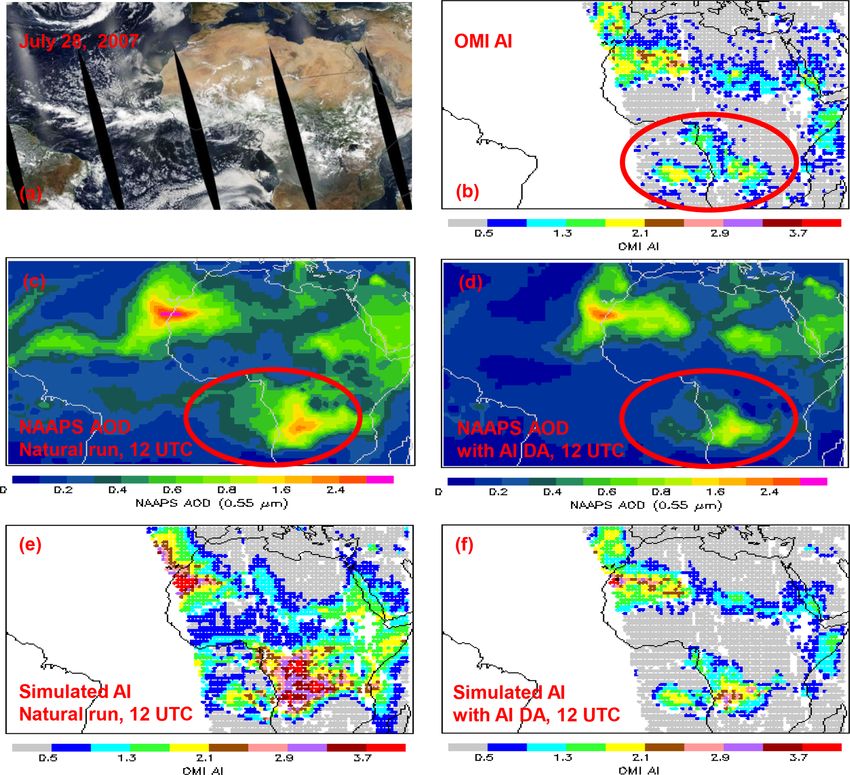
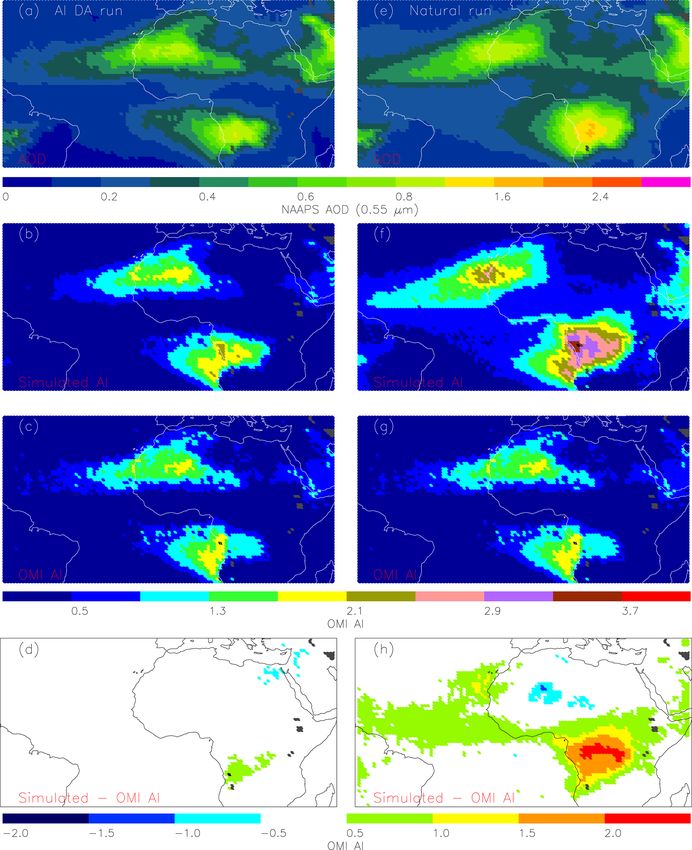
https://doi.org/10.5194/gmd-14-27-2021 Geosci. Model Dev., 14, 27–42, 202134 J. Zhang et al.: Development of an OMI AI data assimilation scheme Figure 3. (a) Aqua MODIS true-color image over central and northern Africa for 28 July 2007. This composite was obtained from the NASA Worldview site (https://worldview.earthdata.nasa.gov/, last access: 18 December 2020). (b) Spatial distribution of gridded OMI AI for 12:00 UTC, 28 July 2007. (c) Spatial distribution of NAAPS AOD from the NAAPS natural run for 12:00 UTC, 28 July 2007. (d) Similar to (c) but using NAAPS AOD from the AI-DA run. (e) Simulated AI using data from (c). (f) Simulated AI using data from (d). from OMI AI data. Also shown in Fig. 3e and f are the simu- study region, the patterns of simulated AI from NAAPS AI- lated AI using NAAPS data from the natural and OMI AI-DA DA runs (Fig. 4b) are similar to patterns shown from OMI runs (data from Fig. 3c and d), respectively. Clearly, with the AI (Fig. 4c). This is also seen in Fig. 4d, which is the dif- use of NAAPS data from the natural run, simulated OMI AI ference between simulated AI from NAAPS AI-DA runs and is overestimated in comparison with OMI AI data (Fig. 3b). OMI AI. In contrast to the situation in Fig. 4d, Fig. 4h, which Simulated AI patterns with the use of NAAPS data from the is the difference between simulated AI from NAAPS natural OMI AI-DA run rather closely resemble AI patterns from runs and OMI AI, shows much larger differences in AI val- the OMI data, again indicating that the OMI AI-DA system ues. is functioning reasonably as designed. While it is not too difficult to make the model mimic the The performance of AI-DA is also evaluated using OMI AI product, proof of real skill lies in any improvements to AI for the whole study period, as shown in Fig. 4. These AOD calculations. To this end, the performance of OMI AI data are constructed using collocated OMI AI and NAAPS assimilation was evaluated with the use of AERONET data. data according to the conditions introduced in Sect. 3. Here, Figure 5a shows the intercomparison of NAAPS AOD ver- Fig. 4a and e are spatial distributions of 2-monthly averaged sus AERONET AOD at 0.55 µm. A total of 1443 collocated (July and August 2007) AODs for NAAPS AI-DA and nat- pairs of NAAPS and AERONET data were compiled for the ural runs, respectively. Figure 4b is the spatial distribution study region over the 2-month test period. Comparing with of the simulated AI using NAAPS data from AI-DA runs, AERONET data, NAAPS AOD from the natural run had a and Fig. 4c is the spatial distribution of OMI AI for the 2- correlation of 0.68, a mean absolute error in AOD of 0.154, month period. Figure 4f and g show similar plots to those in and an RMSE of 0.220. In comparison, with AI assimilation, Fig. 4b and c, but this time for NAAPS natural runs. While NAAPS AOD correlations with AERONET increased to 0.74 simulated AI values from NAAPS natural runs (Fig. 4f) are (Fig. 5b), the absolute error was reduced to 0.104, and RMSE overestimated compared to OMI AI values (Fig. 4g) for the was reduced to 0.156, both roughly a 30 % reduction. Note Geosci. Model Dev., 14, 27–42, 2021 https://doi.org/10.5194/gmd-14-27-2021
J. Zhang et al.: Development of an OMI AI data assimilation scheme                                                                        35

Figure 4. (a) Spatial distribution of NAAPS AOD using NAAPS data from the AI-DA runs for July and August 2007. Only NAAPS data that
have collocated OMI AI data are used. (b) Spatial distribution of simulated AI for July and August 2007 using NAAPS data from the AI-DA
runs. (c) Spatial distribution of gridded OMI AI for July and August 2007.(d) Differences between (b) and (c). (e)–(h) Similar to (a)–(d) but
using NAAPS natural runs. Grey highlights 1 × 1◦ (latitude–longitude) bins that have fewer than three collocated NAAPS and OMI AI data
points for the study period.

that AERONET AOD values are only available for lines of                  Figure 5c shows the comparison of AERONET AOD and
sight that are free of cloud presence for the sun-photometer             NAAPS AOD after AOD assimilation, while Fig. 5b shows
instruments. Also, the slope of AERONET versus NAAPS                     a similar plot but using NAAPS data from AI-DA. Note that
AOD is 0.87 for the NAAPS natural runs, and a similar slope              the same version of the NAAPS model with the same tempo-
of 0.84 is found for the NAAPS AI-DA runs.                               ral and spatial resolutions driven by the same meteorological
                                                                         data was used to construct Fig. 5, and thus the differences
4.2   Intercomparison with AOD data assimilation                         in Fig. 5a, b, and c only result from different aerosol data
                                                                         assimilation methods implemented (no data assimilation for
                                                                         the natural run). A better correlation between AERONET and
Typically, NAAPS reanalyses are constructed through assim-
                                                                         NAAPS data of 0.79 is found using AOD data assimilation.
ilation of MISR and MODIS aerosol products (NAAPS AOD
                                                                         In comparison, the correlation is 0.74 for the AI-DA runs.
assimilation). Thus, the performances of NAAPS AOD and
                                                                         Slightly better RMSE (0.140 versus 0.156) and absolute er-
AI-DA assimilations are compared against AERONET data.

https://doi.org/10.5194/gmd-14-27-2021                                                            Geosci. Model Dev., 14, 27–42, 2021
36 J. Zhang et al.: Development of an OMI AI data assimilation scheme
5 Sensitivity test
As mentioned in Sect. 3, aerosol properties for non-smoke
aerosol types were obtained from the NASA GEOS-5 model
(e.g., Colarco et al., 2014; Buchard et al., 2015). Yet, dif-
ferent smoke aerosol single-scattering albedo (SSA) values
are used in this study, as values for central Africa have a
strong seasonal dependency (e.g., Eck et al., 2013). While
SSA values of 0.85 and 0.86 are used for the 354 and 388 nm
channels, respectively, in our study, we have also examined
the sensitivity of simulated OMI AI with respect to differ-
ing SSA values (Fig. 6). Figure 6a–c show the simulated
AI at 12:00 UTC on 28 July 2007 using NAAPS reanaly-
sis data (Lynch et al., 2016) for three scenarios: SSA values
at 354 and 388 nm of 0.84 and 0.84 (Fig. 6a), 0.85 and 0.85
(Fig. 6b), and 0.86 and 0.86 (Fig. 6c). Over the central Africa
area, where smoke plumes are expected, simulated OMI AI
patterns are similar for Fig. 6a and b, but reduced values of AI
are found when using higher SSA values of 0.86 at both 354
and 388 nm. This is further confirmed by the averaged AI for
the smoke region over central Africa (14.5 to 0.5◦ S latitude
and 10.5 to 30.5◦ E longitude; indicated using the black box
in Fig. 6f) of 0.96, 0.94, and 0.78 for Fig. 6a–c, respectively.
Figure 6d–f show the sensitivity for adjustments of the
SSA values at 388 nm while maintaining a fixed SSA value
of 0.85 at 354 nm. Here the SSA values at 388 nm are set
to 0.85, 0.855, and 0.86 for Fig. 6d–f, respectively. Interest-
ingly, the spectral dependence of SSA seems to affect the
simulated AI significantly, and this phenomenon has also
been reported by previous studies (e.g., Hammer et al., 2016).
The averaged AI values over central Africa (again indicated
by the black box in Fig. 6f) are 0.94, 1.11, and 1.32 for
388 nm SSAs of 0.85, 0.855, and 0.86, respectively. This ex-
ercise suggests that simulated AI is a strong function of SSA
so that both the spectral dependence of SSA values at 354
and 388 nm and reliable SSA values are needed on a regional
basis for future applications.
Interestingly, although simulated AI values are signifi-
Figure 5. (a) Scatter plot of AERONET and NAAPS AOD cantly affected by perturbing SSA values as shown in Fig. 6,
(0.55 µm) using NAAPS data from the natural runs for July– less significant impacts are observed for NAAPS AOD. This
August 2007 over the study region. (b) Similar to (a) but using is found by running the OMI AI-DA for 12:00 UTC on
NAAPS data from the AI-DA runs. (c) Similar to (a) but with AODs 28 July 2007 for SSA values used to generate Fig. 6. For ex-
taken from the NAAPS reanalysis.
ample, for the region highlighted by the black box in Fig. 6f,
the averaged values for the simulated OMI AI are 0.96, 0.94,
and 0.78 using SSA values at 354 the 388 nm channels of
0.84 and 0.84, 0.85 and 0.85, and 0.86 and 0.86, respectively.
ror (0.095 versus 0.104) values are also found for the AOD The corresponding NAAPS AODs are found to be 0.559,
data assimilation runs. This result is not surprising as OMI AI 0.560, and 0.585 after OMI AI-DA, which is a change of less
provides only a proxy for aerosol properties, while passive- than 5 %. Similarly, by fixing the SSA value of the 354 nm
based AOD retrievals are often considered a more reliable channel as 0.85 and perturbing SSA values at 388 nm from
parameter for representing column-integrated aerosol prop- 0.85 to 0.86, a ∼ 30 % change is found in simulated OMI
erties. But still, the evaluation efforts are over a cloud-free AI (from 0.94 to 1.32), yet a ∼ 10 % change is found for the
line of sight as detected from AERONET, and AI-DA may NAAPS AOD (from 0.560 to 0.504) after OMI AI-DA.
further assist traditional AOD data assimilation by providing It is also of interest to investigate the changes in aerosol
AI assimilation over cloudy regions. vertical distributions due to the OMI AI-DA. For this exer-
Geosci. Model Dev., 14, 27–42, 2021 https://doi.org/10.5194/gmd-14-27-2021J. Zhang et al.: Development of an OMI AI data assimilation scheme 37 Figure 6. Spatial distributions of simulated AI at 12:00 Z on 28 July 2007 using NAAPS reanalysis data, with single-scattering albedos of smoke aerosol at 354 and 388 nm taken to be the following: (a) 0.84 and 0.84; (b) 0.85 and 0.85; (c) 0.86 and 0.86; (d) 0.85 and 0.85; (e) 0.85 and 0.855; (f) 0.85 and 0.86. cise, we selected the case of 12:00 UTC on 28 July 2007 and linear, is also observed. AI assimilation helps reduce the compared vertical distributions of smoke and dust aerosols amount of upper troposphere dust (likely to be artifact) but near the peak AI value of the smoke plume (9.5◦ S and does change the layer centroid slightly upwards. We have 20.5◦ E) for the NAAPS natural and AI-DA runs (Fig. 7a). also evaluated NAAPS vertical distributions near a peak dust Note that the differences between OMI DA and natural runs plume region (25.5◦ N and 12.5◦ W) for the case of 12:00 Z as shown in Fig. 7 are essentially an integrated effect of OMI 28 on July 2007 as shown in Fig. 7b. Similar to Fig. 7a, a AI-DA from 00:00 Z on 1 July to 12:00 Z on 28 July 2007. As nonlinear correction to dust aerosol concentrations is also ob- shown in Fig. 7a, the corrections to dust and smoke aerosol served across the vertical domain. concentrations from the AI-DA system seem to be system- atic changes across the majority of vertical layers, instead 5.1 Issues and discussion of moving dust or smoke aerosol plumes vertically. As dust aerosol concentrations are reduced at all layers, a systematic The OMI AI data assimilation system is a proxy for all-sky, correction to smoke aerosol concentrations, although non- all-band modeling system radiance assimilation. It contains https://doi.org/10.5194/gmd-14-27-2021 Geosci. Model Dev., 14, 27–42, 2021
38                                                        J. Zhang et al.: Development of an OMI AI data assimilation scheme

                                                                      counted for when assimilating radiance or OMI AI in the
                                                                      UV spectrum. This requires the inclusion of more dynamic
                                                                      aerosol optical properties in the data assimilation process and
                                                                      properties that vary with region and season. As noted already,
                                                                      even for biomass burning aerosols over South Africa, lower
                                                                      single-scattering albedo values were found at earlier stages
                                                                      of burning seasons (e.g., Eck et al., 2013). A lookup table of
                                                                      aerosol optical properties as functions of region and season
                                                                      will be needed for global implications of OMI AI and future
                                                                      radiance assimilation for aerosol modeling.
                                                                         OMI AI is sensitive to above-cloud UV-absorbing aerosols
                                                                      (e.g., Yu et al., 2012; Alfaro-Contreras et al., 2014), and
                                                                      therefore OMI AI values over cloudy scenes were also used
                                                                      in this study. However, OMI AI cannot be used to infer
                                                                      aerosol properties for aerosol plumes beneath a cloud deck.
                                                                      For regions with high clouds, the use of OMI AI data as-
                                                                      similation will likely result in an underestimation of AOD
                                                                      as below-cloud aerosol plumes are not accounted for. There-
                                                                      fore, only OMI AI data over low cloud scenes are to be used
                                                                      for aerosol assimilation efforts. In addition, although some
                                                                      quality assurance steps were applied in this study for the
                                                                      OMI AI data, lower AI values were observed over glint re-
                                                                      gions near the west coast of Africa. Abnormally high OMI
                                                                      AI values are also seen near the Arctic region – this may be
                                                                      related to the presence of floating ice sheets. Thus, innova-
                                                                      tive and detailed data screening and quality assurance steps
Figure 7. (a) Vertical distributions of smoke and dust aerosol con-   are needed to exclude potentially noisy OMI AI retrievals
centrations over 9.5◦ S and 20.5◦ E at 12:00 Z on 28 July 2007 for    and for further application of OMI AI data assimilation on a
both natural and AI-DA runs. (b) Similar to (a) but over 25.5◦ N
                                                                      global scale.
and 12.5◦ W.
                                                                         Even with these known issues, OMI AI assimilation as
                                                                      presented in the study illustrates a new method for assim-
                                                                      ilating non-conventional aerosol products. Bearing in mind
all the necessary components for such radiance assimilation,          that OMI AI assimilation is essentially radiance assimilation
including a forward model for simulating radiances and AI             in the UV spectrum, this study demonstrates the potential
values and their Jacobians, based on a full vector linearized         of directly assimilating satellite radiance in the UV–visible
radiative transfer model called for every observation. There-         spectrum for aerosol modeling and analyses.
fore, the computational burden is a direct issue associated
with the deployment of calls to a radiative transfer model for
each observation. For the study area in this work, after bin-         6   Conclusions
ning OMI AI data into a 1◦ × 1◦ (latitude–longitude) prod-
uct, it still takes about ∼ 1 CPU day for NAAPS to run for            The OMI aerosol index (AI), which measures the differences
1 month of model time. In comparison, the timescale for run-          between simulated radiances over Rayleigh sky and observed
ning AOD assimilation for 1 month is at the hourly level.             radiances at 354 nm, has been used to detect the presence of
Clearly, there will be an unavoidable computational burden            absorbing aerosols over both dark and bright surfaces. We
of some sort for OMI AI assimilation and by extension for             have constructed a new assimilation system, based on the
future radiance assimilation in the UV–visible spectrum for           VLIDORT radiative transfer code as the major component
aerosol analyses. Performance enhancement methods, such               of the forward model, for the direct assimilation of OMI AI.
as parallel processing (the VLIDORT software is thread-safe           The aim is to improve accuracies of aerosol analyses over
and can be used in parallel environments such as OpenMP)              bright surfaces such as cloudy regions and deserts.
or fast lookup table extraction based on neural networks and             The performance of the OMI AI data assimilation sys-
trained datasets of forward simulation, must be explored in           tem was evaluated over south-central and northern African
order to enable such assimilation applications in near-real           regions for the period of 1 July–31 August 2007. This eval-
time on a global scale.                                               uation was done by intercomparing NAAPS analyses with
   In contrast to the assimilation of retrieved aerosol proper-       and without the inclusion of OMI AI data assimilation. Be-
ties, both aerosol absorption and scattering need to be ac-           sides cloud-free AI retrievals over dark surfaces, OMI AI re-

Geosci. Model Dev., 14, 27–42, 2021                                                      https://doi.org/10.5194/gmd-14-27-2021
J. Zhang et al.: Development of an OMI AI data assimilation scheme 39
trievals over desert regions were also considered. When com- ies (e.g., Lynch et al., 2016; Zhang et al., 2008; 2011, 2014; Ru-
pared against AERONET data, a total ∼ 29 % reduction in bin et al., 2017), and we have made every effort to thoroughly re-
root mean square error (RMSE) with a ∼ 32 % reduction in port our methods so that they may be replicated. AOD fields from
absolute error was found for NAAPS analyses with the use of the NAAPS OMI AI-DA and natural runs over the study region
OMI AI assimilation. Also, NAAPS analyses with the inclu- and period are shared in the Supplement to the paper for readers
who are interested. The NAAPS reanalysis data are available from
sion of OMI AI data assimilation show similar aerosol pat-
the USGODAE website (https://nrlgodae1.nrlmry.navy.mil/cgi-bin/
terns as those in the OMI AI datasets, showing that our OMI datalist.pl?dset=nrl_naaps_reanalysis&summary=Go, last access:
AI data assimilation system works as expected. 18 December 2020, Naval Research Laboratory Monterey, Lynch
This study also suggests that NAAPS analyses with OMI et al., 2016). The OMI OMAERUV data are available from the
AI data assimilation cannot outperform NAAPS reanalysis NASA Goddard Earth Sciences Data and Information Services
data incorporated with MODIS and MISR AOD assimila- Center (GES DISC; https://doi.org/10.5067/Aura/OMI/DATA2004,
tion through validation against AERONET data. This is not Torres, 2006). AERONET data are obtained from the NASA
surprising, as OMI AI is only a proxy for the AOD and is AERONET web page (https://aeronet.gsfc.nasa.gov/cgi-bin/draw_
sensitive to other factors such as surface albedo and aerosol map_display_inv_v3, last access: 18 December 2020, NASA
vertical distribution. Also, AERONET data are only avail- AERONET team, Holben et al., 1998; Giles et al., 2019).
able over cloud-free fields of view, so the performance of our
OMI AI data assimilation system over cloudy regions has not
been evaluated. Supplement. The supplement related to this article is available on-
line at: https://doi.org/10.5194/gmd-14-27-2021-supplement.
There are a number of issues arising from our study. For
example, aerosol optical properties are needed for the OMI
AI-DA system – these have strong regional and temporal sig-
Author contributions. All authors contributed to the overall design
natures that need to be carefully quantified before applying
of the study. Authors JZ and RS coded the system. Author JSR pro-
them to the AI-DA on a global scale. Also, OMI AI retrievals vided valuable suggestions though the study. Author PX assisted
are rather noisy and contain known and unknown biases. Ab- with the evaluation of the system.
normally high OMI AI values are found over mountain re-
gions and polar regions. Sporadic high AI values are also
known to occur for reasons that are still not properly under- Competing interests. The authors declare that they have no conflict
stood. Even though quality assurance steps were proposed in of interest.
this study, detailed analyses of OMI AI data are needed for
future implementation of OMI AI data assimilation in aerosol
studies. Acknowledgements. We thank the NASA AERONET group for
Lastly, AI values are derived from radiances, and thus the the sun-photometer data used in the study. We acknowledge the
AI-DA system presented in the study can be thought of as use of imagery from the NASA Worldview application (https://
a radiance assimilation system for the UV spectrum. This is worldview.earthdata.nasa.gov, last access: 18 December 2020), part
because the AI-DA system contains all the necessary compo- of the NASA Earth Observing System Data and Information System
(EOSDIS).
nents for radiance assimilation based on a forward model for
calculating not only simulated satellite radiances, but also the
aerosol profile Jacobians of these radiances, with both quan-
Financial support. This research has been supported by NASA
tities as functions of observation conditions. This study is
(grant no. NNX17AG52G) and the Office of Naval Research (grant
among the first attempts at radiance assimilation in the UV no. code 322).
spectrum and indicates the future potential for direct radi-
ance assimilation in the UV and visible spectra for aerosol
analyses and forecasts. Review statement. This paper was edited by Samuel Remy and re-
viewed by two anonymous referees.
Code and data availability. The OMI data assimilation scheme
(V1.0) is constructed using VLIDORT and NAVDAS-AOD for
NAAPS analyses and forecasts. The VLIDORT radiative transfer References
mode is the property of RT Solutions Inc. The VLIDORT code is
publicly available and comes with a standard GNU public license Alfaro-Contreras R., Zhang, J., Campbell, J. R., Holz, R.
through direct contact with RT Solutions Inc. (http://www.rtslidort. E., and Reid, J. S.: Evaluating the Impact of Aerosol
com/mainprod_vlidort.html, last access: 18 December 2020). Both Particles above Cloud on Cloud Optical Depth Retrievals
NAAPS and NAVDAS-AOD are proprietary to the Naval Research from MODIS, J. Geophys. Res.-Atmos., 119, 5410–5423,
Laboratory, United States Department of the Navy. Nevertheless, https://doi.org/10.1002/2013JD021270, 2014.
both NAAPS and NAVDAS-AOD are well documented in past stud- Alfaro-Contreras, R., Zhang, J., Campbell, J. R., and Reid, J. S.:
Investigating the frequency and interannual variability in global
https://doi.org/10.5194/gmd-14-27-2021 Geosci. Model Dev., 14, 27–42, 202140 J. Zhang et al.: Development of an OMI AI data assimilation scheme
above-cloud aerosol characteristics with CALIOP and OMI, At- tical depth (AOD) measurements, Atmos. Meas. Tech., 12, 169–
mos. Chem. Phys., 16, 47–69, https://doi.org/10.5194/acp-16-47- 209, https://doi.org/10.5194/amt-12-169-2019, 2019.
2016, 2016. Hammer, M. S., Martin, R. V., van Donkelaar, A., Buchard, V.,
Benedetti, A., Morcrette, J.-J., Boucher, O., Dethof, A., Engelen, Torres, O., Ridley, D. A., and Spurr, R. J. D.: Interpreting the
R. J., Fisher, M., Flentje, H., Huneeus, N, Jones, L., Kaiser, J. ultraviolet aerosol index observed with the OMI satellite in-
W., Kinne, S., Mangold, A., Razinger, M., Simmons, A. J., and strument to understand absorption by organic aerosols: implica-
Suttie, M.: Aerosol analysis and forecast in the European Cen- tions for atmospheric oxidation and direct radiative effects, At-
tre for Medium-Range Weather Forecasts Integrated Forecast mos. Chem. Phys., 16, 2507–2523, https://doi.org/10.5194/acp-
System: 2. Data assimilation, J. Geophys. Res., 114, D13205, 16-2507-2016, 2016.
https://doi.org/10.1029/2008JD011115, 2009. Herman, J. R., Bhartia, P. K., Torres, O., Hsu, C., Seftor, C., and
Bessho, K., Date, K., Hayashi, M., Ikeda, A., Imai, T., In- Celarier, E.: Global distribution of UV-absorbing aerosols from
oue, H., Kumagai, Y., Miyakawa, T., Murata, H., Ohno, T., Nimbus 7/TOMS data, J. Geophys. Res., 102, 16911–16922,
Okuyama, A., Oyama, R., Sasaki, Y., Shimazu, Y., Shimoji, https://doi.org/10.1029/96JD03680, 1997.
K., Sumida, Y., Suzuki, M., Taniguchi, H., Tsuchiyama, H., Hogan, T. F., Liu, M., Ridout, J. A., Peng, M. S., Whitcomb, T. R.,
Uesawa, D., Yokota, H., and Yoshida, R.: An Introduction Ruston, B. C., Reynolds, C. A., Eckermann, S. D., Moskaitis,
to Himawari-8/9- Japan’s New-Generation Geostationary Me- J. R., Baker, N. L., McCormack, J. P., Viner, K. C., McLay,
teorological Satellites, J. Meteorol. Soc. Jpn., 94, 151–183, J. G., Flatau, M. K., Xu, L., Chen, C., and Chang, S. W.: The
https://doi.org/10.2151/jmsj.2016-009, 2016. Navy Global Environmental Model, Oceanography, 27, 116–
Buchard, V., da Silva, A. M., Colarco, P. R., Darmenov, A., Ran- 125, https://doi.org/10.5670/oceanog.2014.73, 2014.
dles, C. A., Govindaraju, R., Torres, O., Campbell, J., and Spurr, Holben, B. N., Eck, T. F., Slutsker, I., Tanre, D., Buis, J. P., Set-
R.: Using the OMI aerosol index and absorption aerosol optical zer, A., Vermote, E., Reagan, J. A., Kaufman, Y., Nakajima,
depth to evaluate the NASA MERRA Aerosol Reanalysis, At- T., Lavenue, F., Jankowiak, I., and Smirnov, A.: AERONET
mos. Chem. Phys., 15, 5743–5760, https://doi.org/10.5194/acp- – A Federated Instrument Network and Data Archive for
15-5743-2015, 2015. Aerosol Characterization, Remote Sens. Environ., 66, 1–16,
Buchard, V., Randles, C., Silva, A., Darmenov, A., Colarco, P., https://doi.org/10.1016/S0034-4257(98)00031-5, 1998.
Govindaraju, R., Ferrare, R., Hair, J., Beyersdorf, A., Ziemba, L., Hsu, N. C., Gautam, R., Sayer, A. M., Bettenhausen, C., Li, C.,
and Yu, H.: The MERRA-2 Aerosol Reanalysis, 1980 Onward. Jeong, M. J., Tsay, S.-C., and Holben, B. N.: Global and regional
Part II: Evaluation and Case Studies, J. Climate, 30, 6851–6872, trends of aerosol optical depth over land and ocean using SeaW-
https://doi.org/10.1175/jcli-d-16-0613.1, 2017. iFS measurements from 1997 to 2010, Atmos. Chem. Phys., 12,
Cochrane, S. P., Schmidt, K. S., Chen, H., Pilewskie, P., Kittel- 8037–8053, https://doi.org/10.5194/acp-12-8037-2012, 2012.
man, S., Redemann, J., LeBlanc, S., Pistone, K., Kacenelenbo- Hsu, N. C., Jeong, M.-J., Bettenhausen, C., Sayer, A. M.,
gen, M., Segal Rozenhaimer, M., Shinozuka, Y., Flynn, C., Plat- Hansell, R., Seftor, C. S., Huang, J., and Tsay S.-C.: En-
nick, S., Meyer, K., Ferrare, R., Burton, S., Hostetler, C., How- hanced Deep Blue aerosol retrieval algorithm: The sec-
ell, S., Freitag, S., Dobracki, A., and Doherty, S.: Above-cloud ond generation, J. Geophys. Res.-Atmos., 118, 9296–9315,
aerosol radiative effects based on ORACLES 2016 and ORA- https://doi.org/10.1002/jgrd.50712, 2013.
CLES 2017 aircraft experiments, Atmos. Meas. Tech., 12, 6505– Hsu, N. C., Lee, J., Sayer, A. M., Kim, W., Bettenhausen,
6528, https://doi.org/10.5194/amt-12-6505-2019, 2019. C., and Tsay, S.-C.: VIIRS Deep Blue aerosol prod-
Colarco, P. R., Nowottnick, E. P., Randles, C. A., Yi, B., ucts over land: Extending the EOS long-term aerosol-
Yang, P., Kim, K.-M., Smith, J. A., and Bardeen, C. G.: data records, J. Geophys. Res.-Atmos., 124, 4026–4053,
Impact of radiatively interactive dust aerosols in the NASA https://doi.org/10.1029/2018JD029688, 2019.
GEOS-5 climate model: sensitivity to dust particle shape Hyer, E. J., Reid, J. S., and Zhang, J.: An over-land aerosol opti-
and refractive index, J. Geophys. Res.-Atmos., 119, 753–786, cal depth data set for data assimilation by filtering, correction,
https://doi.org/10.1002/2013JD020046, 2014. and aggregation of MODIS Collection 5 optical depth retrievals,
Dai, A.: Precipitation characteristics in eighteen coupled climate Atmos. Meas. Tech., 4, 379–408, https://doi.org/10.5194/amt-4-
models, J. Climate, 19, 4605–4630, 2006. 379-2011, 2011.
Eck, T. F., Holben, B. N., Reid, J. S., Mukelabai, M. M., Piketh, S. Joyce, J. R., Janowiak, E. J., Arkin, P. A., and Xie, P.: CMORPH: A
J., Torres, O., Jethva, H. T., Hyer, E. J., Ward, D. E., Dubovik, method that produces global precipitation estimates from passive
O., and Sinyuk, A.: A seasonal trend of single scattering albedo microwave and infrared data at high spatial and temporal resolu-
in southern African biomass-burning particles: Implications for tion, J. Hydrometeor., 5, 487–503, 2004.
satellite products and estimates of emissions for the world’s Kahn, R. A., Gaitley, B. J., Garay, M. J., Diner, D. J., Eck, T. F.,
largest biomass-burning source, J. Geophys. Res.-Atmos., 118, Smirnov, A., and Holben, B. N.: Multiangle Imaging SpectroRa-
6414–6432, 2013. diometer global aerosol product assessment by comparison with
Giles, D. M., Sinyuk, A., Sorokin, M. G., Schafer, J. S., Smirnov, the Aerosol Robotic Network, J. Geophys. Res., 115, D23209,
A., Slutsker, I., Eck, T. F., Holben, B. N., Lewis, J. R., Campbell, https://doi.org/10.1029/2010JD014601, 2010.
J. R., Welton, E. J., Korkin, S. V., and Lyapustin, A. I.: Advance- Lee, J., Hsu, N. C., Bettenhausen, C., Sayer, A. M., Seftor,
ments in the Aerosol Robotic Network (AERONET) Version 3 C. J., and Jeong, M.-J.: Retrieving the height of smoke
database – automated near-real-time quality control algorithm and dust aerosols by synergistic use of VIIRS, OMPS, and
with improved cloud screening for Sun photometer aerosol op- CALIOP observations, J. Geophys. Res.-Atmos.,120, 8372–
8388, https://doi.org/10.1002/2015JD023567, 2015.
Geosci. Model Dev., 14, 27–42, 2021 https://doi.org/10.5194/gmd-14-27-2021You can also read