What we (don't) know about global plant diversity - bioRxiv
←
→
Page content transcription
If your browser does not render page correctly, please read the page content below
bioRxiv preprint first posted online Aug. 31, 2018; doi: http://dx.doi.org/10.1101/404376. The copyright holder for this preprint
 (which was not peer-reviewed) is the author/funder, who has granted bioRxiv a license to display the preprint in perpetuity.
                                  It is made available under a CC-BY 4.0 International license.

             RESEARCH ARTICLE

             Running head: PLANT KNOWLEDGE GAPS

                    What we (don’t) know about global plant diversity

                 William K. Cornwell1 William D. Pearse2 Rhiannon L. Dalrymple1 Amy Zanne3

             1
                 Evolution & Ecology Research Centre, School of Biological, Earth and Environmental
             Sciences, UNSW Sydney, Australia
             2
                 Department of Biology & Ecology Center, Utah State University, Logan, UT, USA
             3
                 Department of Biological Sciences, George Washington University, Washington, DC,
             USA

             Keywords: see below

                                                                       1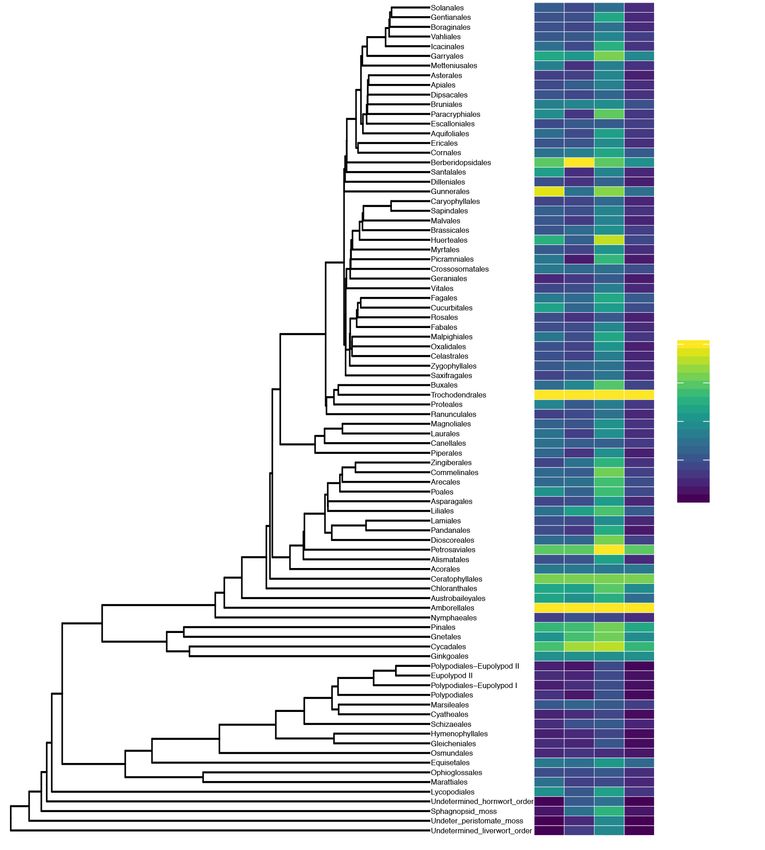
bioRxiv preprint first posted online Aug. 31, 2018; doi: http://dx.doi.org/10.1101/404376. The copyright holder for this preprint
 (which was not peer-reviewed) is the author/funder, who has granted bioRxiv a license to display the preprint in perpetuity.
                                  It is made available under a CC-BY 4.0 International license.

              Summary

              Rationale

              The era of big biodiversity data has led to rapid, exciting advances in theoretical and ap-

              plied biological, ecological and conservation sciences. While large genetic, geographic

          5   and trait databases are available, these are neither complete nor random samples of the

              globe. Biases in species absence in these databases create problems, reducing our infer-

              ential and predictive power.

              Methods

              We performed a comprehensive examination of the taxonomic and spatial sampling in

         10   the most complete current databases for plant genes, locations, and traits.

              Results

              Only 17.7% of the world’s described land plants feature in all three databases, meaning

              that more than 82% of plant biodiversity lacks representation in at least one database.

              Species coverage is highest for location data and lowest for genetic data. Bryophytes and

         15   orchids stand out taxonomically and the equatorial region stands out spatially as poorly

              represented in all databases.

              Conclusion

              We have highlighted a number of clades and regions about which we know little func-

              tionally, spatially and genetically, on which we should set research targets. The scientific

         20   community should recognize and reward the significant value, both for biodiversity sci-

              ence and conservation, of filling in these gaps in our knowledge of the plant tree of life.

                                                                       2
bioRxiv preprint first posted online Aug. 31, 2018; doi: http://dx.doi.org/10.1101/404376. The copyright holder for this preprint
(which was not peer-reviewed) is the author/funder, who has granted bioRxiv a license to display the preprint in perpetuity.
It is made available under a CC-BY 4.0 International license.
keywords
big data, functional trait, genetic, herbaria, knowledge gaps, spatial, bias, species distri-
bution, taxonomic
25 word count total
5481
word counts for sections
Summary: 196 Introduction: 968 Materials and methods: 1225 Results: 1056 Discus-
sion:1992 Acknowledgements: 44 Number of figures: 4 Number of tables: 4 Number of
30 supporting information documents: 1
Introduction
In perhaps the first plant trait database, Theophrastus of Eresus (371–287 BC), a stu-
dent of Plato and Aristotle, assembled and published a list of the woody and herbaceous
plants growing in his garden (Theophrastus, 1916). Since then the nature and scale of
35 plant databases have changed, but the goal of organized, accessible information about
the world’s plants remains the same. For the first time, after more than 2000 years of
research, global versions of Theophrastus’ list are now on the horizon.
Global biological databases have two goals: (1) provide the best global snapshots of
biodiversity available at a given time, and (2) organize their underlying data to facilitate
40 their intersection with other datasets to address research questions. From decades of
hard work and accumulated knowledge, we know more now than we ever have about
biodiversity. The hurdles stopping us from attaining our goal of available, comprehen-
sive global plant databases remain daunting but also increasingly surmountable. In this
effort, we believe it is worthwhile, periodically, to take stock of what information we have
45 and what we still lack. Here we ask how much do we know about global plant diversity,
3bioRxiv preprint first posted online Aug. 31, 2018; doi: http://dx.doi.org/10.1101/404376. The copyright holder for this preprint
(which was not peer-reviewed) is the author/funder, who has granted bioRxiv a license to display the preprint in perpetuity.
It is made available under a CC-BY 4.0 International license.
and what and where are the most conspicuous blank pages in our encyclopedia of plant
life?
There are four primary classes of global biological data: taxonomic, geographic, ge-
netic, and trait. Together they provide the most complete picture currently available of
50 where and how organisms make a living across the globe and how they have evolved
through time. Each of these data types is complex in its own way. Two classes, taxonomic
and trait, require taxon-based specialized knowledge—botanists are required to build
and curate such datasets [e.g., The Angiosperm Phylogeny Website http://www.mobot.
org/MOBOT/research/APweb/, The Plant List (http://www.theplantlist.org/), The
55 State of the World’s Plants Report RBG Kew (2016), and TRY Kattge et al. (2011)]. In con-
trast, data within genetic and geographic databases share similar structure and curation
protocols across all organisms and as such data for plants, animals and microbes can be
usefully kept in one place. General databases for all organisms exist for genes (GenBank;
Benson et al., 2013), phylogenetic relationships based on those genes (The Open Tree of
60 Life; Hinchliff et al., 2015) and spatial observations (GBIF; http://gbif.org/). Here,
using The Plant List as our taxonomic backbone, we explore the data available in Gen-
Bank, GBIF, and TRY, as these are the most complete current databases with fundamental
information about global plants.
These three databases (GenBank, GBIF, and TRY) were assembled from numerous
65 research projects with diverse original goals and data availability; this diversity, while
valid within each effort, creates global-scale biases in terms of which species feature
in a particular database and which do not, which in turn effects the usability of data
(Beck et al., 2014, 2013; Hinchliff & Smith, 2014; Gratton et al., in press). The globally
uneven distribution of research funding may play a role in creating biases in data collec-
70 tion by limiting researchers’ efforts to certain geographical regions or taxa (particularly
to species of commercial or cultural value). Furthermore, biodiversity is not evenly dis-
tributed across the globe. For instance, the high diversity, rarity, and beta-diversity of
many tropical ecosystems means that the sampling effort required to capture some per-
centage of the species present during a sampling trip at low latitudes is much more inten-
4bioRxiv preprint first posted online Aug. 31, 2018; doi: http://dx.doi.org/10.1101/404376. The copyright holder for this preprint
(which was not peer-reviewed) is the author/funder, who has granted bioRxiv a license to display the preprint in perpetuity.
It is made available under a CC-BY 4.0 International license.
75 sive than at high latitudes. Global patterns in biodiversity, combined with patchy sam-
pling effort, has left us with gaps in biodiversity data. Finally, non-random gaps within
a given database can intersect with gaps in other databases in surprising ways, reducing
the number of species about which we have a comprehensive understanding. One of our
main aims is to examine these biases, gaps, and overlaps.
80 Such data paucity matters. Lack of data is a major impediment to conservation: we
cannot save a species if we do not know where it is or what it needs to live. Data are
crucial to identifying conservation crises (Cardoso et al., 2011; Rodrigues et al., 2006;
Keith, 2015). For example, high-resolution remote-sensing deforestation maps (Hansen
et al., 2013), when combined with even small amounts of location data can identify rare
85 species at risk of extinction and worthy of conservation efforts. A great deal of resources
go into conservation actions for some well-studied species that are at risk; in contrast,
poorly-studied species may be going extinct before conservation biologists are able to
interrogate a geographic database to determine where they are found or a trait database
to determine its form or characteristics should they go looking for it. Similar to recent as-
90 sessments of gaps in data for birds (Team eBird, July 2014) and fungi (Nilsson et al., 2016),
it is our hope that an assessment of gaps in plant data across geographic space and the
extant branches of the plant phylogeny will spur the sharing and/or further collection of
data where they are most sorely needed.
By isolating the key spatial and taxonomic knowledge gaps in plant data, we hope to
95 increase our chances of filling in the most important missing pages in the book of plant
life as efficiently as possible. To quantify and understand these gaps we present an anal-
ysis of recent downloads from global plant databases. Here, we (1) quantify the species
coverage in each of three GenBank, TRY, and GBIF databases, and (2) quantify the inter-
section of these databases, reporting the proportion of well-studied species (in all three
100 databases) in contrast to patchily-studied species (in two or fewer databases) and poorly-
studied species (in zero databases). Finally, we (3) identify the phylogenetic clades and
geographical regions for which we have different amounts of trait and genetic data, al-
lowing us to contrast the clades and parts of the world for which we have relatively poor
5bioRxiv preprint first posted online Aug. 31, 2018; doi: http://dx.doi.org/10.1101/404376. The copyright holder for this preprint
(which was not peer-reviewed) is the author/funder, who has granted bioRxiv a license to display the preprint in perpetuity.
It is made available under a CC-BY 4.0 International license.
and rich coverage. While plant scientists may all agree that there are gaps in our knowl-
105 edge of plants, they are unlikely to know where the most gaping holes occur (FitzJohn
et al., 2014). By highlighting the clades and regions in most urgent need of attention, we
hope to turn what appears an insurmountable task into a manageable checklist of gaps
to be filled.
Materials and Methods
110 Working across databases requires a common taxonomy: to combine information about
species from one database with another requires a common definition of what species
exist. We consider The Plant List (TPL; http://www.theplantlist.org/) to be the
most complete and widely-accepted list of plant species (and their taxonomic place-
ment) at the global scale. At the time of writing, TPL (v1.1) records 350,699 names as
115 “accepted” species of land plants. The taxonomic scope of this analysis (and of TPL) is
embryophytes (land plants), including the bryophyte grade (mosses, hornworts, and liv-
erworts), lycophytes, monilophytes (ferns and allies), and spermatophytes (seed plants
including gymnosperms and angiosperms). We emphasize that our use of TPL is conser-
vative, as by making use only of species that are “accepted” we exclude less studied lin-
120 eages in need of additional taxonomic attention. Further, variation in how sub-specific
epithets are handled among databases limits our analysis to species binomials, and so
we do not address cases where databases contain data on different sub-species or vari-
eties of the same species. Continuing to resolve taxonomic controversies in a globally-
accepted, versioned, and updateable list will help interoperability of these databases and
125 benefit biodiversity science.
Databases
We examine the state of three databases: GenBank (genetic; Benson et al., 2013), the
Global Biodiversity Information Facility (GBIF—geographic; http://www.gbif.org/),
and TRY (functional traits; Kattge et al., 2011). These databases were selected as we
6bioRxiv preprint first posted online Aug. 31, 2018; doi: http://dx.doi.org/10.1101/404376. The copyright holder for this preprint
(which was not peer-reviewed) is the author/funder, who has granted bioRxiv a license to display the preprint in perpetuity.
It is made available under a CC-BY 4.0 International license.
130 consider them to be the three most complete databases on plant biodiversity currently
available for the most important characteristics of plants. Below we describe how each of
the databases (genetic, geographic, and functional trait) were downloaded and analyzed.
Each database organization does its own synonymy updating, so we did not attempt to
improve on those steps.
135 Data were downloaded on the 21st of May, 2018. All of our code and analyses are avail-
able online (https://github.com/cornwell-lab-unsw/sTEP_overlap). The online
access of our data and code allows for others to adapt our work for other purposes and
permits future readers to compare how our knowledge of plants continues to change over
time. We note that data quality is an issue with all three of these global databases. The
140 quality of the data within these global collaborations continues to improve but errors re-
main. Improving data quality is an important and ongoing effort (Franklin et al., 2017;
Cicero et al., 2017; Veiga et al., 2017) that will likely never end.
Geographic data. We obtained a complete set of GBIF observations with georefer-
ences (i.e., the observation had a location associated with it) and had no “spatial issues”.
145 Removing any records with “spatial issues” means our records were free from obvious
issues (e.g., latitude/longitude location swaps or mislabelled identifications over water).
In our May 2018 download of GBIF we obtained 174,464,135 observations (tab-delimited
file-size 101 GB). There were many incomplete identifications (e.g., Carex sp.) in the
database, which are removed in our processing. Once these data are synchronized to the
150 TPL species list, we are left with a total of 150,270,519 observations for 257,266 species.
Trait data. We use the species-based summary of TRY (Kattge et al., 2011) data avail-
able online (https://www.try-db.org/dnld/TryAccSpecies.txt) to obtain a list of
all species for which any trait data are available in TRY. After synchronizing the species
names to TPL, the database contains 124,414 species for which we have data on at least
155 one trait.
Genetic data. We compiled a list of all taxa listed within NCBI’s taxonomy (which
is used in all GenBank searches) as green plants (Plantae). To do this, we downloaded
NCBI’s complete taxonomy network, then extracted all named terminal nodes (i.e., taxa)
7bioRxiv preprint first posted online Aug. 31, 2018; doi: http://dx.doi.org/10.1101/404376. The copyright holder for this preprint
(which was not peer-reviewed) is the author/funder, who has granted bioRxiv a license to display the preprint in perpetuity.
It is made available under a CC-BY 4.0 International license.
subtending from the ‘green plants’ node (number 33090 at that time). After synchroniz-
160 ing the species names to TPL, the database contains 108,616 species.
Analysis
Our first and second aims are to quantify the coverage and intersection of the three
databases (TRY, GenBank, GBIF). We examine the presence and absence of records for
each species in TPL for each database, allowing us to take stock of the species cover-
165 age and overlap of available data. We thus identify how many species are well-studied
(i.e. have more than zero data in all three databases), patchily-studied (i.e. have more
than zero data in two or fewer databases) and poorly-studied (i.e. have zero data in all
three databases). While this approach determines that species that are present in each
database with at least a single record are well-studied, it does not mean that these species
170 are particularly well represented in any given database. There is no single metric by
which we could determine whether a species is ‘sufficiently’ covered in these databases,
since different purposes have different data requirements; we instead focus on describ-
ing the presence or absence of any data at all.
Our third aim is to examine the taxonomic and geographic distribution patterns in
175 sampling in all three databases. To do this, we identify the phylogenetic clades and geo-
graphical regions for which we have some trait and genetic data, allowing us to contrast
the clades and parts of the world for which we have relatively poor coverage. At its core,
our approach quantifies the extent of deviation from completely unbiased sampling. As
with all analysis at this scale, significance testing would be of little use: all patterns de-
180 scribed would be highly significant. Instead we seek to quantify the extent to which sam-
pling is uneven across taxonomy and geography.
For taxonomy, we analyze all families for the degree to which sampling (species cover-
age) is non-randomly higher or lower than the overall rate across the entire database. To
do this we apply the KSI method described in Cornwell et al. (2014), modified to use the
185 G-statistic (Sokal & Rohlf, 1981) as our analysis focuses on presence/absence of data (a
binary variable), unlike the continuous data in Cornwell et al. (2014) (code for this analy-
8bioRxiv preprint first posted online Aug. 31, 2018; doi: http://dx.doi.org/10.1101/404376. The copyright holder for this preprint
(which was not peer-reviewed) is the author/funder, who has granted bioRxiv a license to display the preprint in perpetuity.
It is made available under a CC-BY 4.0 International license.
sis is available at www.github.com/traitecoevo/ksi). The key feature of this approach
is that it statistically balances the size of the clade with its deviation from the mean sam-
pling rate (i.e., presence of records for species in that clade in a given database) across
190 all land plants. Thus our results are not driven by (true) variation in the diversity of the
families.
For geography, we take two approaches to determine spatial data gaps in trait and ge-
netic databases: one considers all GBIF observations, while the other first calculates the
median latitude for each species. The observation (N=150,270,519) or species (N=257,266)
195 is then classified as either with or without trait data, with or without genetic data, and
with or without both trait and genetic data. We fit six generalized additive models for
very large datasets (function "BAM" within Wood, 2017) with the only predictor being lat-
itude. The model estimates the probability of an observation or species having trait data,
genetic data, or both, at a given latitude. Because fitting generalized additive models is
200 memory intensive, even with 128 GB of RAM, random sub-sampling of the observation
database down to 10,000,000 points was necessary. This sub-sampling did not affect the
result, however, with repeated samples producing identical fits.
To discover proportionally under-sampled families by biogeographic region, we split
the raw GBIF observations by continent (Environmental Research Systems Institute ,
205 ESRI). We isolate species that are only found in one biogeographic region, that is, species
endemic to that particular region. Considering each region separately, we use the KSI ap-
proach to quantify the most disproportionately under-sampled families within each re-
gion. This approach was designed to identify region-specific gaps in data. Note that this
analysis excludes both species with distributions on multiple continents and species that
210 are invasive somewhere, but we expect these species to be in the well-studied category.
Results
Of the accepted plant species of the world, 17.7% (61,902 species) are well-studied, mean-
ing we know something about their genetic make-up, something about their functional
9bioRxiv preprint first posted online Aug. 31, 2018; doi: http://dx.doi.org/10.1101/404376. The copyright holder for this preprint
(which was not peer-reviewed) is the author/funder, who has granted bioRxiv a license to display the preprint in perpetuity.
It is made available under a CC-BY 4.0 International license.
traits, and something about their geo-referenced location (Table 1). These species make
215 up the "well-studied" section of the Venn diagram (Figure 1), where genetic data, trait
data and geographic data overlap.
More than half of all plant species - 55.6% - are patchily-studied across the datasets,
meaning they are present in two or fewer datasets (Table 1; Figure 1). Building on cen-
turies of collections and a global network of museums and herbaria, GBIF has by far the
220 most complete species coverage, with occurrence data for 257,266 species (73.3% of ac-
cepted diversity). In TRY, trait data are available for 124,414 species (35.5% of accepted
diversity). The database with the least coverage is GenBank, where genetic data are avail-
able for 108,616 species (31.0% of accepted diversity).
For 26.7% of plant species, we know nothing of them but their names. These species
225 are poorly-studied and we have no genetic, location or functional trait data in the databases
considered (Figure 1).
Where we know a lot
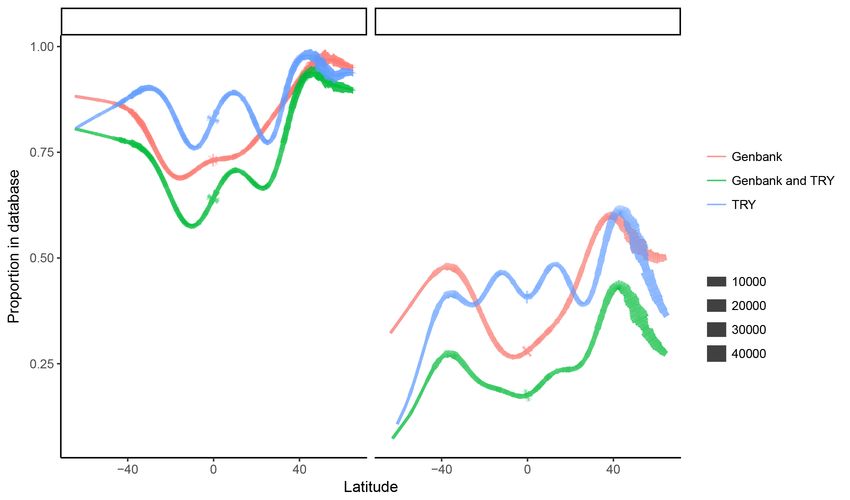
All large data sources have areas of strength and weakness across the plant phylogeny.
There are several hotspots in our knowledge, and the families that are well-studied (that
230 is, having higher than average proportion of member species occupying the "well-studied"
section of Figure 1) tend to be widespread and of economic importance either as food or
resource crops, or as cultivars (Table 3; Figure 3). These include the Poaceae (grasses,
bamboos), Pinaceae (cedars, pines, spruces), Solanaceae (nightshades, with tomatoes,
potatoes, peppers and eggplants), Moraceae (mulberries, breadfruit, jackfruit, figs), Eur-
235 phorbiaceae (rubber, spurge cultivars), Proteaceae (Macadamia, silky oak, cultivars), Iri-
daceae (irises, saffron) and Polemonaceae (Phlox). There are well-studied families which
do not have obvious commercial value but may simply have been of interest for research
and exploration by particular research groups: two that came out in the top 10 are the
Zamiaceae (cycads) and Orobanchaceae (broomrapes, mostly parasitic). Other areas of
240 the phylogeny with good sampling across all datasets are the gymnosperms and early
diverging angiosperms (Figure 3), perhaps because they were identified by Darwin as in-
formative with respect to the "abominable mystery" of the origin of angiosperms. Some
10bioRxiv preprint first posted online Aug. 31, 2018; doi: http://dx.doi.org/10.1101/404376. The copyright holder for this preprint
(which was not peer-reviewed) is the author/funder, who has granted bioRxiv a license to display the preprint in perpetuity.
It is made available under a CC-BY 4.0 International license.
of the orders with high coverage (Figure 3) are that way because of their unusually small
clade size. For instance, Trochodendrales and Acorales have full coverage — both or-
245 ders are comprised of only two accepted species, while Ginkgoales consists of a single
accepted species.
The spatial patterns in genetic and trait data availability (Figure 2) are evidence of the
non-random distribution of research sites and unequal sampling efforts across latitudes.
There are more data available in GenBank and TRY for the northern hemisphere than the
250 southern hemisphere and both temperate regions are better sampled than the equatorial
region (Figure 2). The availability of both trait and genetic data is best around 45 ◦ N. If
you were to take a random GBIF observation from that latitude you would have a greater
than 95% chance of accessing trait data for that species, a 90% chance of there being
genetic data, and almost 90% chance of there being both genetic and trait data available.
255 If you were to select a species at random at this latitude, there would be a 65% chance of
there being trait data, a 60% chance of there being genetic records for this species, but
only 45% chance of both data types being available (Figure 2).
For many accepted species, there are 10 or fewer geographical observance records
and no genetic or trait data (Figure 4). The species for which there are upwards of 1000
260 spatial records in GBIF include the dominant trees and shrubs of North America, Europe,
and South East Australia. As these species are prevalent in regions where many scientists
live and work, they are well documented in numerous way and make up much of the
"well-studied" section of the Figure 1.
Where we don’t know a lot
265 While the databases all lack a certain number of species contributing to the known
extant diversity, there are plant families for which we have little data across all databases
(Table 4, Figure 3). Most of the poorly-studied families, those families that are made up
of species that are undersampled geographically, genetically, and functionally, are moss
or liverwort families, but Orchidaceae, Asteraceae and Begoniaceae also earn this title.
270 When we consider the taxonomic weaknesses of databases individually, we find that they
shar similarities in the distribution of data gaps (Table 4). GBIF is extremely poorly sam-
11bioRxiv preprint first posted online Aug. 31, 2018; doi: http://dx.doi.org/10.1101/404376. The copyright holder for this preprint
(which was not peer-reviewed) is the author/funder, who has granted bioRxiv a license to display the preprint in perpetuity.
It is made available under a CC-BY 4.0 International license.
pled for mosses and liverworts—all of the top ten most geographically undersampled
families come from these two clades. Moss and liverwort families are also undersampled
for both traits and genes, nine and seven of the top ten most undersampled families in
275 these data sets come from these clades, respectively. The traits of Orchidaceae remain ex-
tremely undersampled despite its widespread cultivation and intense horticultural use.
For genetic data, the other families that make the top ten most undersampled list are all
fairly diverse and widespread tropical understory families: Begoniaceae, Acanthaceae,
and Piperaceae.
280 We identify the three family groups for which we have the greatest gaps in data for
endemic species of each of the different continents (Table 2). As well as seeing similar
overall patterns in data gaps to those outlined above, there are some families which made
multiple appearances. More data are needed for Rubiaceae endemics of Asia, Australia,
NZ and Oceania, and South America; for Asteraceae endemics of Europe, Asia and Africa;
285 for Lamiaceae endemics of Europe and Australia; and for Araceae endemics of Australia
and South America.
The low latitudes are hotspots for plant diversity, home to some of the most diverse
ecosystems on the planet, and yet we find ourselves with a paucity of plant data for these
tropical regions. It is in the equatorial region where we find the least species coverage of
290 genetic and trait data. For instance, if one were to select a single species at random at a
latitude of 0◦ , there would only be a 40% chance of data for that species being available
in TRY, a mere 27% chance of there being data for that species in GenBank (dotted lines;
Figure 2), and less than a 20% chance of both trait and genetic data being available.
Discussion
295 Shortfalls in our knowledge of global plant diversity
Our knowledge of plants is incomplete in a number of well-defined ways (see Hortal
et al., 2015), four of which are pertinent to the database resources we have analyzed here.
First, given the rate at which species are being discovered, we are quite confident that we
12bioRxiv preprint first posted online Aug. 31, 2018; doi: http://dx.doi.org/10.1101/404376. The copyright holder for this preprint
(which was not peer-reviewed) is the author/funder, who has granted bioRxiv a license to display the preprint in perpetuity.
It is made available under a CC-BY 4.0 International license.
have not sampled and described all plant life on Earth—this is the Linnean shortfall in
300 our knowledge of biodiversity (Lomolino, 2004). Second, we lack basic taxonomic or phy-
logenetic information on the placement of many plants in the tree of life—this is the Dar-
winian shortfall (Diniz-Filho et al., 2013). Third, we do not know the distribution (range)
of many plants on Earth—this is the Wallacean shortfall (Lomolino, 2004). Fourth, we
do not know about the functional traits of many plants—this is the Raunkiæran shortfall
305 (Hortal et al., 2015). A major result from our study is that the Wallacean shortfall (26.7%)
is currently far less severe than the Darwinian (69%) or Raunkiæran (64.5%) shortfalls.
Methods within some lines of scientific inquiry lend themselves well to systematic
sampling. Remote sensing, for example, surveys every pixel of the planet for an exten-
sive range of abiotic and biotic features. Similarly, despite the uneven distribution of
310 biodiversity and the challenge in getting to remote areas, taxonomy has an inherent goal
to describe every species on earth. That the Wallacean shortfall is less severe than oth-
ers is due mainly to its strong link to taxonomy related resources — GBIF has had great
success in encouraging herbaria and museum collections to participate in systematic
centralization of data from collections; at the time of writing, a 57th country had joined
315 the initiative. Nonetheless, there is more to do: the gap in our geographic records of the
plant kingdom currently stands at 26.7%, meaning that there are 93,433 accepted species
for which we do not know even a single location in the world they grow or have grown.
This is literally lost diversity data—for the species to have been described taxonomically,
it was collected, but the geographic information (the location where that specimen was
320 collected) been lost.
As we lack important information about where they live, we also then lack informa-
tion about their ecology and evolution. Most worryingly, without even basic geographic
information, any true assessment of the conservation status of these species is impos-
sible. However, as more of the world’s herbarium collections become digitized and up-
325 loaded directly to GBIF, or through intermediary initiatives, we do expect that this short-
fall will decline relatively rapidly. Indeed, comparison of the current coverage of Gen-
Bank, GBIF and TRY to that from a preliminary analysis for this paper in 2015 indicated
13bioRxiv preprint first posted online Aug. 31, 2018; doi: http://dx.doi.org/10.1101/404376. The copyright holder for this preprint
(which was not peer-reviewed) is the author/funder, who has granted bioRxiv a license to display the preprint in perpetuity.
It is made available under a CC-BY 4.0 International license.
that the Wallacean shortfall is decreasing the fastest (see Appendix 1).
Relative to the Wallacean shortfall, the Raunkiæran and Darwininan shortfalls are
330 more severe. The explicit goal of complete sampling of plant diversity for either trait
or genetic data has never been clearly stated perhaps because it was so distant, and the
result is patchy species coverage. The Darwinian shortfall is the most severe of the three:
we have a complete lack of genetic information for 69% of known plant species. Worry-
ingly, this dataset has shown the slowest pace of growth in species coverage over the last
335 3 years (see Appendix 1), likely because it is much more laborious and expensive to pro-
duce a single record of genetic information than for either of the other databases. The
Raunkiæran shortfall stands at 64.5% of accepted diversity, which is a considerable gap
in our plant knowledge given the current focus on trait-based analyses in the scientific
exploration of ecological and evolutionary processes. There are other taxonomic groups,
340 including birds and mammals, for which complete sampling has been an explicit aim,
and as such relevant trait datasets have high-to-complete species coverage (e.g. Wilman
et al., 2014; Jones et al., 2009). Despite the daunting diversity of land plants, we are now
at the point where complete sampling through targeted campaigns is a feasible goal.
Perhaps the most worrying of these shortfalls is the Linnean as it is hard to know any-
345 thing about what we do not know; these are the species for which we know literally noth-
ing and they do not even have a name. Estimations are that the number of un-named
plant species may be 10-20% of the number of known plant species (Joppa et al., 2011)
and that the majority may inhabit diverse, tropical regions (Wheeler et al., 2004). These
may have never been collected (collection of new species in the field may be the greatest
350 rate-limiting step towards mapping the whole tree of plant life (May, 2004)), or they may
have been collected but mis-identified or are yet to be described. If they have been col-
lected, there may be associated genetic, functional and spatial data but without a name
as a link, this information is lost to us. It can be difficult for taxonomists to keep up with
the influx of new specimens needing description (and the revisions that new specimens
355 can warrant), and there may not be the expertise or financial support available to do so
- often resulting in significant lag time between collection and publication of descrip-
14bioRxiv preprint first posted online Aug. 31, 2018; doi: http://dx.doi.org/10.1101/404376. The copyright holder for this preprint
(which was not peer-reviewed) is the author/funder, who has granted bioRxiv a license to display the preprint in perpetuity.
It is made available under a CC-BY 4.0 International license.
tions with accepted scientific names (Bebber et al., 2010; Wheeler et al., 2004). With new
information and taxonomic effort the number of accepted species will no doubt rise in
the coming years (see Mora et al., 2011); however, the training of taxonomists and the
360 financial support of their research in both new and existing collections is crucial to the
reduction of the Linnean shortfall.
Each of these four gaps in our knowledge of plant diversity combines to create what
we suggest is a fifth shortfall in our knowledge of global plant diversity: we do not know
anything about the geography, anything about the genes, nor anything about the traits
365 for the vast majority of known plant species. We term this the Venn shortfall, since it
relates to a lack of intersection among databases. The Venn shortfall is a critical issue
that affects both biodiversity science and conservation. How can we assess conserva-
tion risk of a species if all the information we have about them is a name? The narrow
overlap among the different dimensions of our knowledge of plant diversity means that
370 much research and policy-decision making is limited to data on a relatively small (17.7%
of accepted diversity) and non-random subset of plants species, and we know that when
data are biased or extremely sparse we are at risk of missing or misidentifying patterns
or processes(Hortal et al., 2015). If we acknowledge the Venn shortfall as a serious prob-
lem facing conservation biodiversity science, then we can treat this as an important goal
375 worthy of attention and funding.
Closing the gaps
While there can never be a complete substitute for real data, temporary solutions have
been proposed to leverage existing data to circumvent the shortfalls we describe above.
These include phyndr, an algorithm that maximizes the overlap between phylogenetic
380 and species’ data (i.e., trait and spatial Pennell et al., 2016), Phylomatic which uses tax-
onomic data to fill-in missing phylogenetic data, and approaches which use taxonomic
information to “gap-fill” our knowledge of plant functional diversity (Schrodt et al., 2015;
FitzJohn et al., 2014; Taugourdeau et al., 2014). As human pressure on plant diversity
increases through time, such techniques may be our best hope of estimating policy-
15bioRxiv preprint first posted online Aug. 31, 2018; doi: http://dx.doi.org/10.1101/404376. The copyright holder for this preprint
(which was not peer-reviewed) is the author/funder, who has granted bioRxiv a license to display the preprint in perpetuity.
It is made available under a CC-BY 4.0 International license.
385 relevant information immediately but they also introduce uncertainty, and dealing with
this uncertainty in downstream analyses may be non-trivial. Leaving aside the difficul-
ties involved in imputing data and then going out and collecting it, most simple models
of trait evolution for plants are far from adequate (Pennell et al., 2015) and heterogene-
ity in evolutionary processes among the branches of the tree is common (Eastman et al.,
390 2011)). Such evolutionary methods can be powerful for filling in small gaps where infor-
mation on a species can be estimated based on its close relatives, but are thus of limited
use in large clades with poor data coverage. Most worryingly, because gap-filling in most
cases uses taxonomic or phylogenetic information to infer species values, there is the
danger of circularity in many contexts, such as evolutionary and biogeographic studies.
395 For goals that are specific to the unsampled species—such as, what is the species’ ecology
and its conservation risk—imputation will simply not be informative given the current
patchy data. Such approaches cannot supersede the collection of novel data, but they do
help us make the most of what data we do have.
Unlike the Linnean shortfall, targeted programs may reduce the magnitude of the
400 Venn, Darwinian, Wallacean and Raunkiæran shortfalls. Held within the world’s > 3000
herbaria are almost 390 million specimens(Thiers, 2017) and considerable efforts are un-
derway to increase availability of data from these collections through large digitization
and sharing initiatives (Pyke & Ehrlich, 2010; James et al., 2018). The number of species
for which we have names but no other data is large (13.2%), however, these species must
405 have had museum/herbarium records at some time. If they still exist and are findable,
these specimens contain sufficient data to address multiple shortfalls at once: there are
collection location data (albeit for older specimens this tends to be at a course scale (Pyke
& Ehrlich, 2010)), and the vouchers themselves can be sources of genetic and trait data
(Younis et al., 2018; Corney et al., 2012; Li et al., 2015). To some extent this is happening,
410 but current progress is haphazard, and to be maximally efficient with our sampling ef-
forts, it is worth (1) prioritizing herbaria that are known to have collections of undersam-
pled taxa, especially those that are missing from all three of the databases, and (2) gath-
ering data from specimens in locations known to be effected by habitat loss as quickly as
16bioRxiv preprint first posted online Aug. 31, 2018; doi: http://dx.doi.org/10.1101/404376. The copyright holder for this preprint
(which was not peer-reviewed) is the author/funder, who has granted bioRxiv a license to display the preprint in perpetuity.
It is made available under a CC-BY 4.0 International license.
possible (as these specimens might be the only collections that we ever obtain).
415 Our survey of global plant diversity leads us to make four observations that can in-
form a more optimal strategy for filling in knowledge gaps. First, grant programs can have
direct impacts on the future of the shortfalls we have demonstrated by incentivizing work
which creates overlapping species data, and such opportunities should be expanded. We
suggest that funding programs should support researchers collecting and sharing data
420 on undersampled regions or clades of the world. Second, publication of results from ge-
netic data has long required centralized deposition of raw sequences with meta-data; A
similar approach within collectors of locations and trait data would broaden the base
of contributors and rapidly increase availability of both spatial and trait data. Third, one
clear bias is that many well-studied families are those with some commercial value. How-
425 ever, species do not need to have direct commodity or cultural usefulnesses to be impor-
tant (Ehrlich & Wilson, 1991). There is immense basic and applied value in novel data on
undersampled families (orchids, Begoniaceae, Asteraceae, and most bryophyte families
see Table 4) in addressing biases in our datasets to future biodiversity and conservation
science. Last, we need to intensify genetic and trait sampling efforts in undersampled
430 regions: spatial biases are evident in the availability of both genetic and functional trait
data.
Conclusions
Despite shortfalls (Linnaen, Darwinian, Wallacean, Raunkiæran, Venn) within and across
data sources, there are more reasons than ever to be optimistic about the future of our
435 knowledge of global plant diversity. Biodiversity sciences are progressing in leaps and
bounds, empowered by the sharing of large amounts of data. However, the intersec-
tion of data among our plant databases is particularly patchy and non-random, and as
we move towards a more complete picture of global functional diversity, more data are
clearly needed. By taking a targeted approach to expanding and improving the status of
440 our data foundations for such work we can progress towards an ever more complete pic-
ture of the many facets of plant biodiversity, and greater inferential and predictive power
17bioRxiv preprint first posted online Aug. 31, 2018; doi: http://dx.doi.org/10.1101/404376. The copyright holder for this preprint
(which was not peer-reviewed) is the author/funder, who has granted bioRxiv a license to display the preprint in perpetuity.
It is made available under a CC-BY 4.0 International license.
from our global plant data.
Gap-filling is also a goal among those who study other taxa: interestingly eBird — an
ornithologic citizen science effort — performed a gap analysis similar to ours in 2014 and
445 were able to generate gap-filling enthusiasm, which led to the sharing of data on 227 out
of the 421 missing bird species (see https://ebird.org/news/ebirds-missing-species/
and https://ebird.org/news/ebirds-missing-species-v2/). The shear number
of missing species is much larger for plants, but publicizing target lists is a good first
step, and with enough of a reward, progress could be rapid. Let us begin!
450 Acknowledgment
This research includes computations using the Linux computational cluster Katana sup-
ported by the Faculty of Science, UNSW Sydney. This research was initiated as part of
the sTEP working group funded by sDIV, the Synthesis Centre of the German Centre for
Integrative Biodiversity Research Halle-Jena-Leipzig.
455 Author contributions
WKC and AEZ conceived of the initial ideas and questions. WKC and WP designed and
performed the analyses. All authors wrote and revised the manuscript.
18bioRxiv preprint first posted online Aug. 31, 2018; doi: http://dx.doi.org/10.1101/404376. The copyright holder for this preprint
(which was not peer-reviewed) is the author/funder, who has granted bioRxiv a license to display the preprint in perpetuity.
It is made available under a CC-BY 4.0 International license.
Tables
Table 1: Count of accepted plant species in each of the database and overlap of species
among two- and three-way combinations of databases.
Genbank GBIF TRY All three
Genbank 108616 100507 63783
GBIF 100507 257266 114067
TRY 63783 114067 124414
All three 61902
19bioRxiv preprint first posted online Aug. 31, 2018; doi: http://dx.doi.org/10.1101/404376. The copyright holder for this preprint
(which was not peer-reviewed) is the author/funder, who has granted bioRxiv a license to display the preprint in perpetuity.
It is made available under a CC-BY 4.0 International license.
Figures
1881
8466 6228
Trait data Genetic data
Well-studied
61,902
52,165 38,605 Total diversity
(unknown)
Accepted
taxonomic
names
Geographic data
(total: 350,699)
104,594
Figure 1: Shortfalls in our knowledge of the plant kingdom. (1)The Linnean shortfall
(diversity for which we have no names) is the area outside of the "accepted taxonomic
names" footprint. (2)The Darwinian shortfall (diversity for which we have zero genetic
information in GenBank) is the area outside of the "Genetic data" footprint. (3)The Wal-
lacean shortfall (diversity for which we have zero location information in GBIF) is the
area outside of the "Geographic data" footprint.(4)The Warming shortfall (diversity for
which we have zero records of functional trait data in TRY) is the area outside of our
"Trait data" coverage. (5)The Venn shortfall, a culmination of these first four shortfalls, is
the area outside of where these four kinds of knowledge intersect - the area over overlap
where species are considered "well-studied".
20bioRxiv preprint first posted online Aug. 31, 2018; doi: http://dx.doi.org/10.1101/404376. The copyright holder for this preprint
(which was not peer-reviewed) is the author/funder, who has granted bioRxiv a license to display the preprint in perpetuity.
It is made available under a CC-BY 4.0 International license.
byGBI
Fobser
vat
ion byspeci
es
Dat
aset
Sampl
esi
ze
Figure 2: Generalized additive models for the relationship between latitude and avail-
ability of plant data. The left panel models individual GBIF observations (N=150, 270,
519); the right panel models species median values for latitude (N=257, 266). Line thick-
ness is indicative of sample size. Note that tropical areas (esp. just south of the equator)
have the poorest data coverage, and just north of 40◦ N is where we find the best coverage
of both functional trait and genetic plant data.
21bioRxiv preprint first posted online Aug. 31, 2018; doi: http://dx.doi.org/10.1101/404376. The copyright holder for this preprint
(which was not peer-reviewed) is the author/funder, who has granted bioRxiv a license to display the preprint in perpetuity.
It is made available under a CC-BY 4.0 International license.
Table 2: The three most undersampled families for species endemic to each continent.
Note that endemicity in this analysis is based on gbif observations, and may be a under-
estimate due to species that are invasive elsewhere.
Proportion Estimated Distinct-
Continent Database Family of species continental iveness
sampled endemics index
Africa TRY Acanthaceae 0.097 963 227.263
TRY Asteraceae 0.195 2513 137.427
TRY Aizoaceae 0.149 955 113.331
Genbank Acanthaceae 0.173 963 87.737
Genbank Begoniaceae 0.009 111 70.565
Genbank Lauraceae 0.061 163 59.395
Asia TRY Orchidaceae 0.050 3085 1094.982
TRY Gesneriaceae 0.028 617 269.321
TRY Asteraceae 0.150 2486 216.418
Genbank Orchidaceae 0.284 3085 149.851
Genbank Begoniaceae 0.051 234 144.026
Genbank Rubiaceae 0.247 1352 118.264
Australia TRY Orchidaceae 0.079 557 295.071
TRY Lamiaceae 0.149 261 72.413
TRY Araceae 0.024 42 32.383
Genbank Orchidaceae 0.217 557 56.275
Genbank Frankeniaceae 0.000 32 28.407
Genbank Rubiaceae 0.144 111 25.815
Europe TRY Asteraceae 0.262 1382 92.533
TRY Orchidaceae 0.103 213 79.508
TRY Lamiaceae 0.192 193 28.876
Genbank Asteraceae 0.158 1382 258.282
Genbank Rosaceae 0.197 615 54.249
Genbank Onagraceae 0.000 24 18.678
North America TRY Crassulaceae 0.181 215 119.096
TRY Pottiaceae 0.000 47 73.190
TRY Bryaceae 0.000 46 71.631
Genbank Myrtaceae 0.064 297 154.550
Genbank Begoniaceae 0.009 109 90.513
Genbank Primulaceae 0.093 215 87.264
NZ and Oceania TRY Orchidaceae 0.077 195 84.651
TRY Rubiaceae 0.153 235 48.578
TRY Pandanaceae 0.051 59 30.951
Genbank Phyllanthaceae 0.098 82 29.027
Genbank Euphorbiaceae 0.059 51 25.326
Genbank Orchidaceae 0.200 195 22.924
South America TRY Orthotrichaceae 0.000 128 182.369
TRY Pottiaceae 0.000 127 180.941
TRY Dicranaceae 0.000 109 155.250
Genbank Rubiaceae 0.148 1923 174.428
Genbank Begoniaceae22 0.018 219 107.190
Genbank Araceae 0.129 848 103.845bioRxiv preprint first posted online Aug. 31, 2018; doi: http://dx.doi.org/10.1101/404376. The copyright holder for this preprint
(which was not peer-reviewed) is the author/funder, who has granted bioRxiv a license to display the preprint in perpetuity.
It is made available under a CC-BY 4.0 International license.
Table 3: The most well-sampled families for each database, as well as those which are
well-sampled across all three databases, i.e., having a disproportionately high proportion
of species in the "overlap" section of Figure 1.
Proportion Estimated Distinctiveness
Database Family
sampled diversity index
TRY Poaceae 0.77 11470 8648.92
Begoniaceae 0.96 1601 2754.26
Euphorbiaceae 0.67 6547 2670.13
Orobanchaceae 0.91 1614 2218.14
Santalaceae 0.90 992 1302.79
Moraceae 0.85 1217 1263.58
Loranthaceae 0.91 887 1185.14
Urticaceae 0.74 1465 895.42
Proteaceae 0.76 1253 854.95
Iridaceae 0.61 2315 644.84
Genbank Brassicaceae 0.53 4065 895.56
Restionaceae 0.84 529 635.86
Apiaceae 0.52 3270 631.14
Liliaceae 0.65 745 365.97
Pinaceae 0.87 255 349.81
Poaceae 0.39 11470 339.32
Zamiaceae 0.88 216 312.67
Polemoniaceae 0.71 455 302.12
Plantaginaceae 0.51 1614 296.57
Ericaceae 0.44 3553 282.12
GBIF Proteaceae 0.96 1253 458.72
Solanaceae 0.88 2677 337.89
Myrtaceae 0.83 5970 335.46
Ericaceae 0.85 3553 258.46
Passifloraceae 0.93 932 247.73
Malvaceae 0.83 4506 232.37
Chrysobalanaceae 0.97 535 230.45
Melastomataceae 0.83 4078 226.11
Iridaceae 0.86 2315 222.26
Piperaceae 0.85 2658 217.26
All three Poaceae 0.31 11470 1319.29
Pinaceae 0.84 255 529.78
Euphorbiaceae 0.27 6547 385.33
Orobanchaceae 0.38 1614 382.65
Solanaceae 0.33 2677 373.78
Moraceae 0.41 1217 365.32
Polemoniaceae 0.56 455 333.91
Zamiaceae 0.71 216 296.21
Iridaceae 0.32 2315 287.26
Proteaceae 0.37 1253 274.77
23bioRxiv preprint first posted online Aug. 31, 2018; doi: http://dx.doi.org/10.1101/404376. The copyright holder for this preprint
(which was not peer-reviewed) is the author/funder, who has granted bioRxiv a license to display the preprint in perpetuity.
It is made available under a CC-BY 4.0 International license.
Table 4: The most disproportionately undersampled families within each database.
Those families which are undersampled across the board are the "least-scienced", hav-
ing the lowest proportion of Representatives in the "overlap" section the Venn diagram.
Proportion Estimated Distinctiveness
Database Family
sampled diversity index
try Orchidaceae 0.19 27782 4131.81
Pottiaceae 0.0003 3169 2775.82
Hypnaceae 0.0004 2519 2200.85
Lejeuneaceae 0.0004 2269 1980.10
Bryaceae 0 2103 1849.77
Dicranaceae 0.003 2116 1775.56
Sematophyllaceae 0.001 1629 1403.18
Orthotrichaceae 0.002 1272 1078.43
Brachytheciaceae 0.005 1102 909.56
Hookeriaceae 0.002 831 703.53
genbank Orchidaceae 0.22 27782 1179.95
Hypnaceae 0.05 2519 1048.10
Pottiaceae 0.09 3169 902.62
Begoniaceae 0.02 1601 899.25
Bryaceae 0.07 2103 753.64
Sematophyllaceae 0.09 1629 457.60
Dicranaceae 0.12 2116 423.91
Orthotrichaceae 0.10 1272 316.40
Fissidentaceae 0.07 817 289.72
Acanthaceae 0.19 3948 277.58
gbif Orchidaceae 0.57 27782 3833.24
Hypnaceae 0.40 2519 1249.90
Pottiaceae 0.46 3169 1058.46
Sematophyllaceae 0.42 1629 703.30
Bryaceae 0.46 2103 695.73
Dicranaceae 0.52 2116 455.56
Lejeuneaceae 0.54 2269 394.40
Brachytheciaceae 0.49 1102 288.83
Neckeraceae 0.46 816 273.87
Fissidentaceae 0.49 817 217.23
All three Orchidaceae 0.09 27782 1848.76
Pottiaceae 0.0003 3169 1214.53
Hypnaceae 0.0004 2519 961.78
Lejeuneaceae 0.0004 2269 864.75
Bryaceae 0 2103 814.59
Dicranaceae 0.002 2116 764.57
Sematophyllaceae 0.0006 1629 616.81
Orthotrichaceae 0.0008 1272 478.85
Begoniaceae 0.02 1601 423.88
Asteraceae 0.14 32920 405.18
24bioRxiv preprint first posted online Aug. 31, 2018; doi: http://dx.doi.org/10.1101/404376. The copyright holder for this preprint
(which was not peer-reviewed) is the author/funder, who has granted bioRxiv a license to display the preprint in perpetuity.
It is made available under a CC-BY 4.0 International license.
Pr
opor
ti
onspeci
es
sampl
ed
1.
00
0.
75
0.
50
0.
25
TRY Genbank GBI
F Al
lthr
ee
Figure 3: The proportion of species in each order of the tree of life for which we have
functional trait, genetic and location data, and the proportion which are well-sampled,
having all three types of data available.
25bioRxiv preprint first posted online Aug. 31, 2018; doi: http://dx.doi.org/10.1101/404376. The copyright holder for this preprint
(which was not peer-reviewed) is the author/funder, who has granted bioRxiv a license to display the preprint in perpetuity.
It is made available under a CC-BY 4.0 International license.
es
Dat
abasest
atus
peci
Bot
hTRYandGenbank
Countofs
TRYonl
y
Genbankonl
y
Nei
therTRYnorGenbank
10 1000 100000
NumberofGBI
Fobser
vat
ions
Figure 4: Ranking of the number of occurrences in GBIF for plant species; colors indicate
the presence of trait and genetic data. Species with many spatial records also tend to
have genetic and trait data available. Species with few GBIF records are less likely to be
in TRY or GenBank. Note the log-scaled x-axis.
26bioRxiv preprint first posted online Aug. 31, 2018; doi: http://dx.doi.org/10.1101/404376. The copyright holder for this preprint
(which was not peer-reviewed) is the author/funder, who has granted bioRxiv a license to display the preprint in perpetuity.
It is made available under a CC-BY 4.0 International license.
460 References
Bebber DP, Carine MA, Wood JRI, Wortley AH, Harris DJ, Prance GT, Davidse G, Paige
J, Pennington TD, Robson NKB et al. 2010. Herbaria are a major frontier for species
discovery. Proceedings of the National Academy of Sciences, 107: 22169–22171.
Beck J, Ballesteros-Mejia L, Nagel P , Kitching IJ. 2013. Online solutions and the ‘wal-
465 lacean shortfall’: what does gbif contribute to our knowledge of species’ ranges? Di-
versity and Distributions, 19: 1043–1050.
Beck J, Böller M, Erhardt A , Schwanghart W. 2014. Spatial bias in the gbif database
and its effect on modeling species’ geographic distributions. Ecological Informatics,
19: 10–15.
470 Benson DA, Cavanaugh M, Clark K, Karsch-Mizrachi I, Lipman DJ, Ostell J , Sayers EW.
2013. Genbank. Nucleic Acids Research, 41: D36–D42.
Cardoso P, Erwin TL, Borges PA , New TR. 2011. The seven impediments in invertebrate
conservation and how to overcome them. Biological Conservation, 144: 2647 – 2655.
Cicero C, Spencer CL, Bloom DA, Guralnick RP, Koo MS, Otegui J, Russell LA , Wiec-
475 zorek JR. 2017. Biodiversity informatics and data quality on a global scale1. The Ex-
tended Specimen: Emerging Frontiers in Collections-Based Ornithological Research.
Corney DP, Clark JY, Tang HL , Wilkin P. 2012. Automatic extraction of leaf characters
from herbarium specimens. Taxon, 61: 231–244.
Cornwell WK, Westoby M, Falster DS, FitzJohn RG, O’Meara BC, Pennell MW, McGlinn
480 DJ, Eastman JM, Moles AT, Reich PB et al. 2014. Functional distinctiveness of major
plant lineages. Journal of Ecology, 102: 345–356.
Diniz-Filho JAF, Loyola RD, Raia P, Mooers AO , Bini LM. 2013. Darwinian shortfalls in
biodiversity conservation. Trends in Ecology & Evolution, 28: 689–695.
27bioRxiv preprint first posted online Aug. 31, 2018; doi: http://dx.doi.org/10.1101/404376. The copyright holder for this preprint
(which was not peer-reviewed) is the author/funder, who has granted bioRxiv a license to display the preprint in perpetuity.
It is made available under a CC-BY 4.0 International license.
Eastman JM, Alfaro ME, Joyce P, Hipp AL , Harmon LJ. 2011. A novel comparative
485 method for identifying shifts in the rate of character evolution on trees. Evolution,
65: 3578–3589.
Ehrlich PR , Wilson EO. 1991. Biodiversity studies: Science and policy. Science, 253:
758–762.
Environmental Research Systems Institute (ESRI) . 2010. World Continents from ESRI
490 data and maps CD. Redlands, CA.
FitzJohn RG, Pennell MW, Zanne AE, Stevens PF, Tank DC , Cornwell WK. 2014. How
much of the world is woody? Journal of Ecology, 102: 1266–1272.
Franklin J, Serra-Diaz JM, Syphard AD , Regan HM. 2017. Big data for forecasting the
impacts of global change on plant communities. Global Ecology and Biogeography, 26:
495 6–17.
Gratton P, Marta S, Bocksberger G, Winter M, Trucchi E , Kühl H. in press. A world of
sequences: can we use georeferenced nucleotide databases for a robust automated
phylogeography? Journal of Biogeography.
Hansen MC, Potapov PV, Moore R, Hancher M, Turubanova S, Tyukavina A, Thau D,
500 Stehman S, Goetz S, Loveland T et al. 2013. High-resolution global maps of 21st-
century forest cover change. Science, 342: 850–853.
Hinchliff CE , Smith SA. 2014. Some limitations of public sequence data for phylogenetic
inference (in plants). PLoS One, 9: e98986.
Hinchliff CE, Smith SA, Allman JF, Burleigh JG, Chaudhary R, Coghill LM, Crandall KA,
505 Deng J, Drew BT, Gazis R et al. 2015. Synthesis of phylogeny and taxonomy into a com-
prehensive tree of life. Proceedings of the National Academy of Sciences, 112: 12764–
12769.
28You can also read