Applying the System of Environmental Economic Accounting-Ecosystem Accounting (SEEA-EA) framework at catchment scale to develop ecosystem extent ...
←
→
Page content transcription
If your browser does not render page correctly, please read the page content below
One Ecosystem 6: e65582
           doi: 10.3897/oneeco.6.e65582

                                                        Case Study

Applying the System of Environmental Economic
Accounting-Ecosystem Accounting (SEEA-EA)
framework at catchment scale to develop
ecosystem extent and condition accounts
Catherine Anne Farrell‡, Lisa Coleman§, Mary Kelly-Quinn§, Carl G Obst|, Mark Eigenraam|,
Daniel Norton¶, Cathal O'Donoghue#, Stephen Kinsella¶, Orlaith Delargy¤, Jane C Stout‡
    ‡ Trinity College Dublin, Dublin, Ireland
    § University College Dublin, Dublin, Ireland
    | IDEEA Group, Melbourne, Australia
    ¶ University of Limerick Kemmy Business School, Limerick, Ireland
    # National University Ireland, Galway, Galway, Ireland
    ¤ Natural Capital Ireland, Dublin, Ireland

   Corresponding author: Catherine Anne Farrell (doctorcatherinefarrell@gmail.com)

   Academic editor: Joachim Maes

   Received: 05 Mar 2021 | Accepted: 22 Apr 2021 | Published: 28 Apr 2021

   Citation: Farrell CA, Coleman L, Kelly-Quinn M, Obst CG, Eigenraam M, Norton D, O'Donoghue C, Kinsella S,
   Delargy O, Stout JC (2021) Applying the System of Environmental Economic Accounting-Ecosystem Accounting
   (SEEA-EA) framework at catchment scale to develop ecosystem extent and condition accounts. One Ecosystem
   6: e65582. https://doi.org/10.3897/oneeco.6.e65582

Abstract
Ecosystem accounting is a tool to integrate nature into decision-making in a more
structured way. Applying the use of nationally available datasets at catchment scale and
following the System of Environmental Economic Accounting-Ecosystem Accounting
(SEEA-EA) framework, we present results from a catchment case study in Ireland,
highlighting findings specifically in relation to the development of ecosystem extent and
condition accounts. In the absence of a national ecosystem map, CORINE landcover
mapping formed the basic data for extent and type of ecosystems, distinguishing
woodlands and forest, peatland and heathland, grasslands and cropland and urban areas,
with limited coverage of linear freshwater rivers, hedgerows and coastal ecosystems.
Additional remote sensing data provided higher resolution at catchment scale, while limited

© Farrell C et al. This is an open access article distributed under the terms of the Creative Commons Attribution License (CC BY
4.0), which permits unrestricted use, distribution, and reproduction in any medium, provided the original author and source are
credited.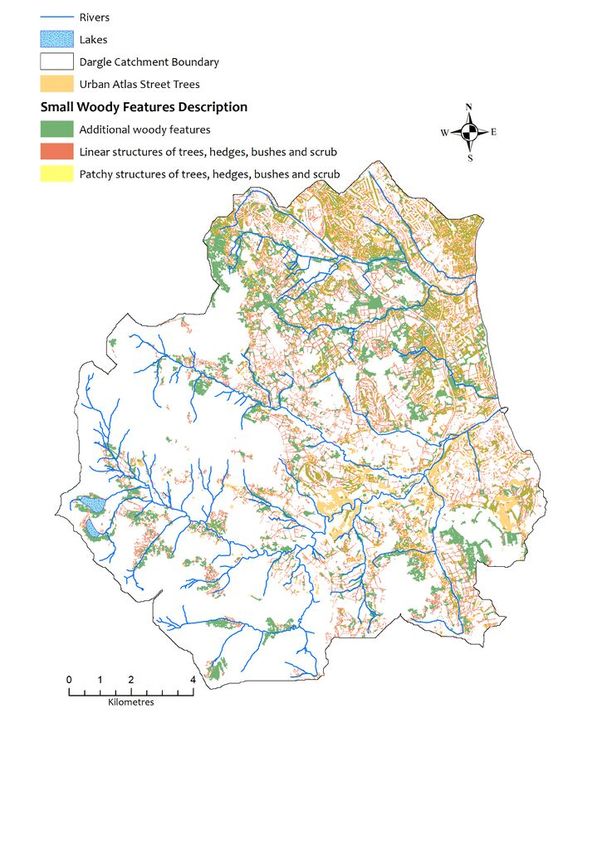
2                                       Farrell C et al

site-level survey data were available. Condition data gathered for reporting under the EU
Water Framework Directive were available at sub-basin level for surface waterbodies. Data
were available at national level for habitats reported for the EU under the Habitats Directive
(59 habitats reported), covering ~ 25% of the study area. Data for ecosystem types outside
of these reporting frameworks were in the form of ancillary data only, providing information
on pressures, threats and intensity of use. Our findings in Ireland reflect work across the
European region, highlighting the role of data gathering and stakeholder engagement. We
outline some of the data gaps to provide information for future research and alignment of
data for the purpose of NCA, both at catchment and national scale.

Keywords
SEEA-EA, catchment scale, ecosystem stocks, ecosystem extent, ecosystem condition,
ecosystem accounts

Introduction
Repeated calls for the value of nature’s contributions to people to be taken into
consideration requires us to bring nature into decision-making at a variety of scales
(Costanza 2017, Guerry 2015, Lange 2018). Ultimately, this is seen as a means to reduce
and reverse trends in global degradation of the environment, including climate change and
loss of biodiversity (Braat and de Groot 2012, Dasgupta 2021, Díaz 2019, Steffen 2015).
Ecosystem Accounting, often referred to as Natural Capital Accounting (NCA), is one of the
ways whereby nature’s stocks and flows are recorded and tracked over time, as a means
of accounting for nature’s contributions to human well-being (Hein 2020b, Obst 2015).
Ecosystem accounts can be used on their own or incorporated into other analyses, such as
cost-benefit analysis, economic impact analysis and other causal modelling techniques
providing the greater level of context necessary for integrated decision-making (Bateman
and Mace 2020).

Natural systems (such as ecosystems) are complex and therefore require an appropriate
accounting model (Barbier 2019); one that can be standardised to allow for comparative,
repetitive measurement and reporting while recognising the complexity and characteristics
of natural systems (Mace 2012, Obst 2015, Bateman and Mace 2020). Methods and
approaches to ecosystem accounting, in development since the 1990s, have culminated in
the launch of the System of Environmental Economic Accounting-Ecosystem Accounting
(SEEA-EA) as a statistical standard in 2021 (UNSD 2021). The SEEA-EA specifically
involves gathering data about ecosystem stocks (extent and condition) and flows (services
and benefits) and aligning the accounts with the System of National Accounts (SNA) to
create a platform to facilitate and address the need for more integrated decisions for nature
and the economy (Eigenraam and Obst 2018, Obst 2015). While the SEEA is nascent
relative to the SNA, refinement is ongoing to improve and ensure their alignment with a
view to providing information for more comprehensive metrics of well-being and support
initiatives, such as Inclusive Wealth (Obst 2015, UNSD 2021) and Gross Ecosystem
Applying the System of Environmental Economic Accounting-Ecosystem Accounting ...     3

Product (Ouyang 2020). Capturing the complexity of nested systems (economics, social
and environmental) is integral towards developing better indicators of sustainable
development (Obst 2015).

With the publication of the European Green Deal in 2019 (EC 2019) and the EU
Biodiversity Strategy for 2030 (EC 2020), the call for ecosystem accounting and NCA has
been firmly embedded across EU policies. Trialled at different scales (EU region, Member
State and provincial scales) and in response to different drivers and policy questions within
the European region (Bordt and Saner 2018, Hein 2020a, Mace 2015), initiatives, such as
MAES, INCA and MAIA, continue to provide information about how to apply the SEEA-EA
and integrate NCA to improve policy integration and decision-making (Burkhard 2018, La
Notte and Marques 2019, Hein 2020a). Apart from studies in the UK and Ireland, however,
(Holt 2017, Norton 2020), few studies have applied the SEEA-EA at catchment scale.

Progress relating to ecosystem accounting in Ireland has been limited, despite being
highlighted as a key action in the National Biodiversity Action Plan (DAHG 2017) and calls
by the Environmental Protection Agency (EPA) to integrate NCA into measures of
prosperity (Wall 2016). An array of research projects applying ecosystem assessment
frameworks have focused on one-off assessments, single ecosystems or focused sectors
(Bullock 2016, Kelly-Quinn 2020, Murphy and Stout 2019, Norton 2020, Parker 2016), but
they lack cohesion. Applying the SEEA-EA approach to integrate the findings of these
studies will establish and streamline the approach in a national context (addressing a key
action in the National Biodiversity Action Plan), identify data gaps to focus further research,
as well as highlight policy applications, in line with other work (Hein 2020b).

We present findings from a case study piloting the SEEA-EA at catchment scale in Ireland,
with a view to providing information for the implementation of the SEEA-EA at varying
scales, nationally and internationally. The catchment represents a distinct biophysical
landscape unit with well-defined boundaries, forming the basis at which reporting is carried
out under the EU Water Framework Directive (WFD). Furthermore, the Integrated
Catchment Management approach to preparing River Basin Management Plans
throughout the EU, as part of the implementation of the WFD, has many parallels in
approach and philosophy with the systems approach of the SEEA-EA (DHPLG 2018). In
this study, we combine datasets, such as those gathered for reporting under the EU WFD
and the EU Habitats Directive to develop the SEEA-EA accounts. This demonstrates how
to make effective use of existing, comprehensive datasets by aligning them to develop their
further use towards more integrated environmental management.

In this paper, we focus primarily on the ecosystem stocks accounts (extent and condition).
The extent account is often the first step in developing a set of ecosystem accounts and
presents an entry point to the discussion of ecosystems for a wide range of stakeholders
(UNSD 2021). Following from this, an understanding of the status (extent combined with
condition) of ecosystem stocks is integral to ensuring the sustainable use of ecosystem
4                                        Farrell C et al

services over time (Bateman and Mace 2020). With this in mind, we present our findings in
relation to a study catchment in eastern Ireland as follows:

1.        We outline the approach to developing ecosystem extent and condition accounts at
          catchment scale, detailing required and available inputs.
2.        Framing our results in the context of the study catchment, we use the accounts to
          build a narrative around the changes in composition and condition of ecosystem
          stocks over time, highlighting key messages emerging and ecosystem services
          (flows) of focus for the next steps in the accounting framework (services and
          benefits).
3.        We discuss the limitations of, and the relevant data gaps uncovered, offering some
          conclusions to facilitate and streamline implementation and applications of the
          SEEA-EA at catchment and other scales.

The SEEA-EA accounting framework
The SEEA-EA is a geospatial approach whereby existing data on ecosystem stocks and
flows, at a range of scales, are collated. Organising biophysical data in an integrated
statistical framework, the SEEA-EA is distinct, but complementary to that of the SEEA-
Central Framework (CF), which incorporates the measurement of physical accounts, flows
of environmental assets (such as timber, water and minerals) and environmental
expenditure (UN 2014). The focus of the SEEA-EA is on ecosystems and the methods
have been developed to include both biotic and abiotic flows. Four core accounts within the
SEEA-EA framework, form the basis of the approach Fig. 1.

    Figure 1.
    The SEEA-Ecosystem Accounting Framework. Source: IDEEA Group.

Asset extent: this relates to the type, range and extent of ecosystems assets within an
accounting area. Ecosystem assets are the ecological entities for which information is
sought and about which statistics are ultimately compiled. The use of national ecosystem
typologies, such as the Heritage Council Classification system in Ireland (Fossitt 2000),
that can be aligned with the IUCN Global Ecosystem Typology (Keith 2020) is
recommended as a common system to allow for comparative analysis across study areas
(UNSD 2021). The output of this stage is a geo-referenced map (the scale depending on
the spatial unit selected, such as national or catchment level) and an asset register or
account (in the form of a table/balance sheet).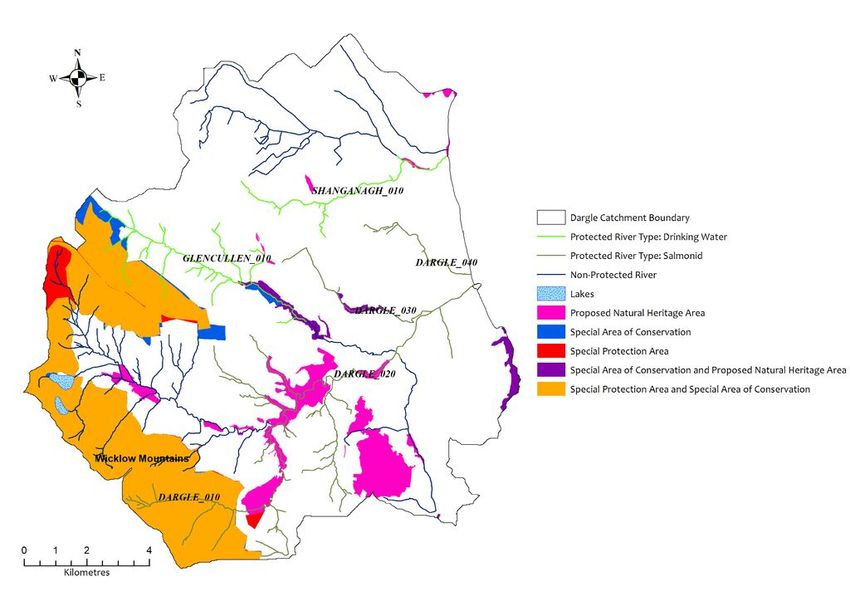
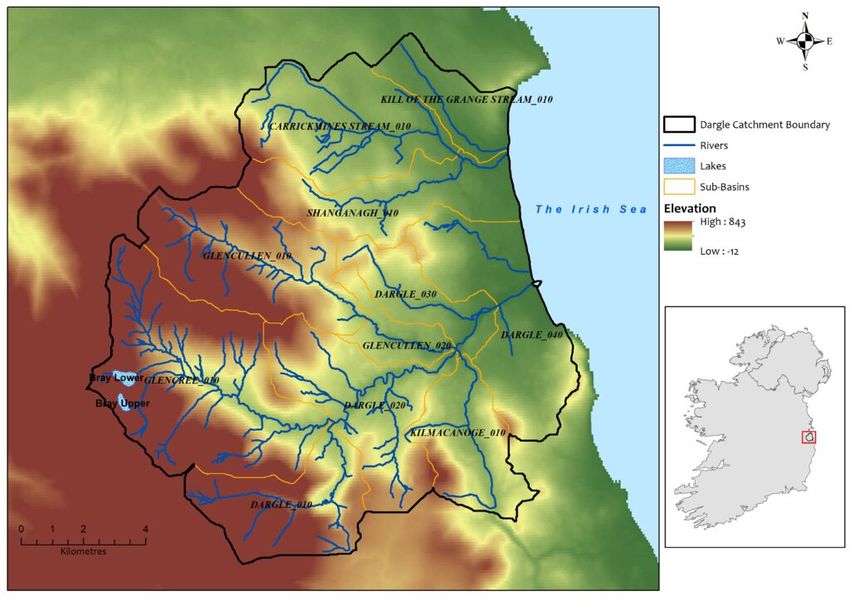
Applying the System of Environmental Economic Accounting-Ecosystem Accounting ...   5

Asset condition: this relates to the quality of the assets outlined in the extent account.
The SEEA-EA is specific about the definition of ecosystem condition as “the quality of an
ecosystem measured in terms of its abiotic and biotic characteristics”. Quality is assessed
with respect to ecosystem structure, function and composition, which combine to underpin
the ecological integrity of the ecosystem and, thereby, its capacity to supply ecosystem
services (UNSD 2021). The SEEA-EA outlines a three-stage approach to developing
condition accounts, recommending the use of traceable, dynamic ecosystem condition
variables, as well as setting reference levels which allow for development of, and
aggregation of, condition indicators within and across ecosystem types (UNSD 2021). At
this stage of the accounting, maps and tables outlining asset condition are developed,
often integrating disparate ancillary datasets relating to policy-relevant pressures. These
can infer the use of ecosystems and associated service provision (such as locations of
and/or intensity of use) for the next stages of accounting (services and benefits).

Services: this requires the identification of the flows of ecosystem services, whether within
the system or as a product of the system. Services may rely on a combination and the
interaction of multiple ecosystem assets. Mapping services can also integrate data relating
to pressures and condition mapping in previous steps, as well as using other relevant
geospatial data. While data relating to services can be biophysical, there may also be links
to economic datasets.

Benefits: this relates to what the benefits and who the beneficiaries are. For some
services, there is a spatial correlation between potential beneficiaries and service
availability, while for others, the spatial link may be more difficult to ascertain.

Each step of the accounting requires the gathering, assessment and integration of relevant
datasets. As a consequence, data review and analysis, combined with iterative
engagement with data providers, as well as potential end-users, comprises a major part of
the process of developing ecosystem accounts. Following from this iterative, interactive
learning process, the accounts provide an integrated data platform that can be used to
provide information for decisions, each application depending on the perspective of the
end-user(s) (Eigenraam and Obst 2018, Obst 2015).

Methodology
Ecosystem accounting area

We built ecosystem extent and condition accounts for a test catchment (the Dargle
catchment, located in the Leinster Province of Ireland). The Dargle catchment unit (referred
to as the Dargle), is located in the southern suburbs of Dublin City and north County
Wicklow in Ireland (Fig. 2). The boundary of the accounting area corresponds to the area
of the catchment as reported under the Water Framework Directive (WFD). This includes
the terrestrial component, extending to coastal features along the eastern fringes to the
high-water mark; thus marine waters are excluded.
6                                           Farrell C et al

    Figure 2.
    The Dargle is located on the east coast south of Dublin City. Rivers rise in the uplands
    draining eastwards into the Irish Sea.

The Dargle was selected as it is a diverse catchment, comprising eleven river sub-basins
and two lake waterbodies. Forming the northern part of the larger Avoca-Varty river system,
the Dargle is reported under the EPA WFD code: 10_5 and covers a total area of 17,866
hectares (178 km2). Watercourses in the Dargle drain urban areas to the north; those to
the east rise largely in rural uplands characterised by mountain blanket bog and
heathlands; and river valley slopes are dominated by coniferous plantations and pockets of
remnant native woodland along the riparian nodes. The main stem of the Dargle River
drains through the urban centre of Bray into the Irish Sea. The area has a high coverage of
habitats listed under Annex I (those habitats whose conservation requires the designation
of special areas of conservation) of the EU Habitats Directive (ca. 25% of the catchment
area), with a similarly high coverage of Natura 2000 (the network of nature protection areas
in the EU) and nationally designated conservation sites.

Ecosystem typology

The national ecosystem typology comprises a comprehensive synthesis of the most
frequently encountered ecosystem types in Ireland. The typology is focused on habitats
and an overview is presented in Suppl. material 1. We aligned the Level 1 and Level 2
categories of the national typology to the relevant CLC Level 3 classes recorded in the
Dargle, based on expert opinion. Alignment to Level 3 was not possible given the
resolution of the CORINE data. Following from this, we aggregated those aligned Level 1
and 2 categories to high level ecosystem types for the Dargle as outlined below and further
detailed in Suppl. material 1. We also aligned the Dargle ecosystem types with the IUCN
Global Ecosystem Typology (Keith 2020). This process facilitated the application of the
CORINE datasets to develop ecosystem extent accounts for the Dargle. The main
ecosystem types were identified as follows: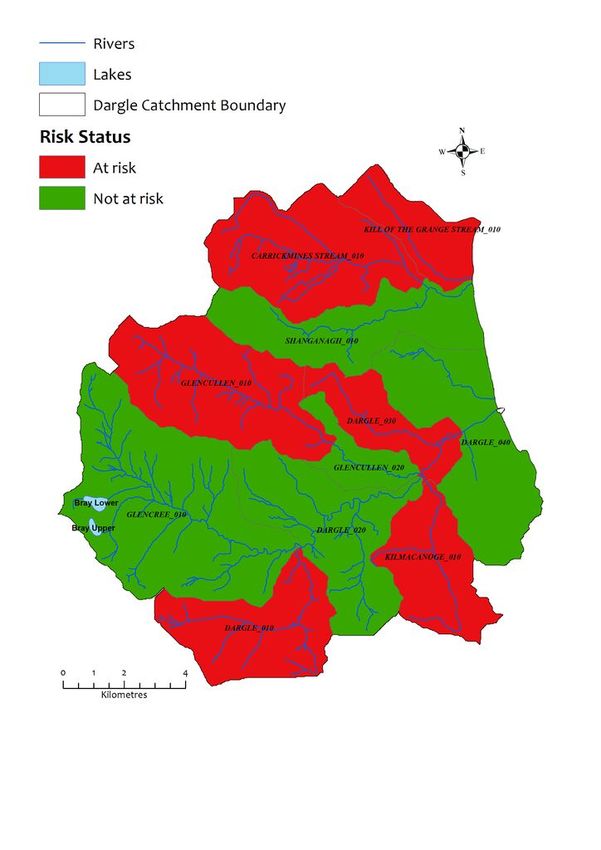
Applying the System of Environmental Economic Accounting-Ecosystem Accounting ...   7

Freshwater: this includes surface water bodies such as rivers, lakes, as well as inland
wetlands and swamps.

Woodlands: this category relates to all semi-natural woodland types, including native
woodlands, hedgerows, tree-lines and scattered parklands. We distinguished woodlands
from commercial plantations (Forest), on the basis of structure and use.

Forest: wooded areas planted and managed for the primary purpose of commercial
production.

Peatlands: collectively comprising raised bog, mountain and lowland blanket bog, cutover,
fen and degraded peatland types.

Heathlands: wet and dry heathland types (including bracken dominated areas), which
often occur in a mosaic with peatlands on peat soils; alpine heathlands occur at high
altitudes.

Grasslands: this includes all improved, semi-improved and semi-natural grassland types.

Croplands: areas developed for the purpose of crop production, including cereals,
biomass crops, fruit and vegetables.

Coastal: dune complexes, saltmarshes, tidal areas, sea cliffs and beaches are included
here; often occurring as linear features.

Urban: this is largely aligned with the national Level 1 ecosystem type Cultivated and built
land (Fossitt 2000); the main focus of interest being urban green and blue spaces.

Aligning with and taking into account the structure and resolution of the CORINE datasets,
we combined the following ecosystem types (these areas often overlap in CORINE), within
our ecosystem accounts and discussions: Woodlands and Forest, Peatlands and
Heathlands and Grasslands and Croplands.

Data inventory

Throughout the accounting process, we followed the steps outlined in the SEEA-EA
framework as a guide to gather and assess relevant data (UNSD 2021). An initial NCA-
focused workshop held in November 2019, with agencies and organisations co-ordinating,
gathering and analysing environmental data in Ireland, highlighted relevant data sources,
while also serving to raise awareness as to the SEEA-EA accounting framework approach
(Farrell and Stout 2020).

A desktop review of available national and catchment level datasets (with particular focus
on the Dargle) was then combined with one-to-one engagement through further focus
groups and catchment workshops. Direct engagement across a wide array of agencies,
both with data providers and potential end-users of the accounts, identified available
relevant inputs and highlighted potential policy applications. The output of this data review
8                                       Farrell C et al

and engagement was a data inventory, developed to provide information for both national
level and catchment relevant datasets.

Following from the data inventory and development of the ecosystem accounts (see next
section), we used these outputs to engage further with national and local stakeholders in
the Dargle in autumn 2020. As well as highlighting obvious data gaps and uncovering
further supporting ancillary datasets, this iterative engagement provided opportunities to
raise awareness as to the approach and gain further input and support from potential end-
users.

Building ecosystem accounts

Applying relevant available datasets identified during the data inventory, we followed the
process steps as outlined in the SEEA-EA (UNSD 2021), to develop extent and condition
accounts for the Dargle.

CORINE datasets were analysed using GIS tools (ArcGIS) to develop core extent accounts
(maps and tables) for four time series (2000, 2006, 2012 and 2018). While CORINE served
as the base layer for the core extent accounts, supplementary datasets (where available
and relevant) provided more detail to support and refine detail on the extent of specific
ecosystem types. Change in extent accounts were developed for CLC status layers using
the EnSym tool.

Condition accounts were developed using available time series data available for the
Dargle. This consisted primarily of collating relevant datasets gathered for reporting under
the EU WFD. Sample survey data (comprising an assessment of structure and function of
sampled habitats) for Annex I habitats in the catchment available under the EU Habitats
Directive Article 17 reports were also reviewed, along with survey data for focal areas and
ecosystem types within the catchment commissioned as part of other, unrelated studies.
These data were supported by available ancillary datasets where relevant. While the
SEEA-EA outlines in detail a three-stage approach to develop condition accounts (UNSD
2021), we present condition accounts, based on what is available and feasible at this time.

Results
Data inventory

Following an iterative process of collating and reviewing data, a data inventory detailing
relevant national and catchment related datasets was developed, serving as a technical
support document for applying the SEEA-EA in Ireland that can be added to over time. The
inventory comprises an extensive array of datasets from national and EU agencies, state
departments, local authorities, commercial enterprise, research and ecological consultants.
Ancillary datasets, reviewed for the Dargle, include data relating to accessibility (roads and
trackways), commercial use (forest plantation data), elevation, planning documents, food
Applying the System of Environmental Economic Accounting-Ecosystem Accounting ... 9
production (agricultural payments data), protection status (such as conservation
designations) and soils.
The key datasets used for developing extent and condition accounts for the Dargle, as well
as most relevant ancillary datasets, are outlined in Table 1. A more complete overview of
datasets reviewed is outlined in Suppl. material 2.
Table 1.
Key datasets used for developing extent and condition accounts in the Dargle (note: MMU:
minimum mapping unit).
Dataset Description
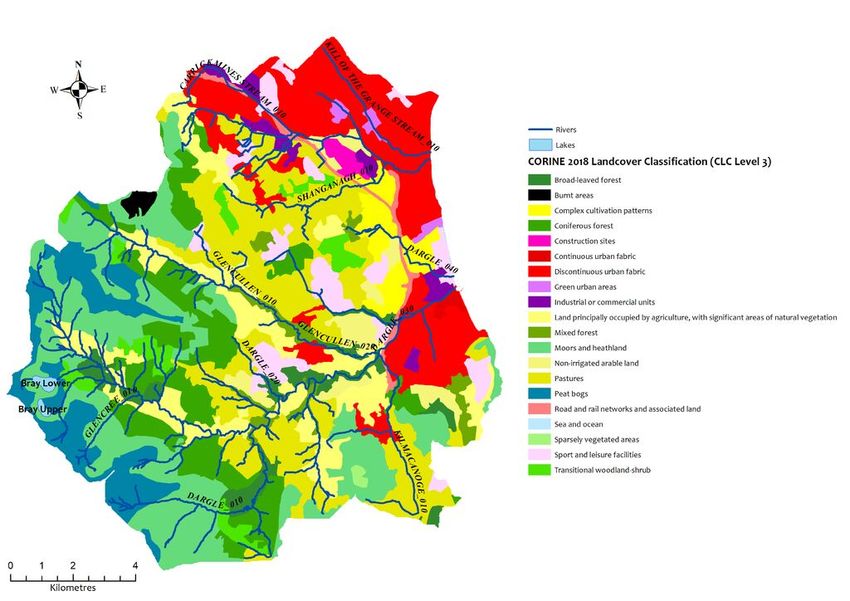
CORINE landcover Available time series: 2000, 2006, 2012 and 2018.
Fig. 3 Coverage: National, European
Resolution: MMU 25 ha; min. width 100 m for linear features.
Relevance: Formed the basis of the core extent accounts.
Copernicus Land Available time series: Variable intervals from 2006, time series not aligned with CORINE.
Monitoring Service Coverage: National, European.
Data High Resolution: MMU variable, ranging from 2-20 m.
Resolution Layers Relevance: Information on specific land cover characteristics; used to complement,
(HRLs) supplement and refine core extent accounts; application described under each ecosystem
Figs 4, 5 type. In particular, the Small Woody Features (SWF) HRL and the Urban Atlas and
supporting Urban Atlas Street Trees Layer (STL) HRL supplemented data on woodlands
and urban green space, respectively.
EU Habitats Available time series: 2009, 2013 and 2019.
Directive Article 17 Coverage: National.
reporting (Annex 1 Resolution: Grid square, polygon, polyline and point data available depending on habitat.
Habitats) Extent: Of the 59 EU Habitats Directive habitats reported for Ireland, 24 of these occur in
Fig. 6 the Dargle, covering ca. 25% of the catchment; habitats comprise mainly Annex I peatland
and heathland habitats on uplands, with patches of Annex I woodlands along river valleys
and Annex I coastal habitats.
Condition: Data on structure and function of Annex I habitats gathered for survey points
across a national sampling grid, are aggregated with knowledge on pressures, threats and
range, to develop national level Conservation Status and Trends for each habitat. National
Conservation Status for the 24 Annex I listed habitats recorded in the Dargle are presented
for 2019 (Suppl. material 4).
Natura 2000 and Available time series: Variable.
national designated Coverage: Natura 2000 network data relates to SAC and SPAs; for each site a Standard
nature network Data Form provides information relating to Annex I habitats and Annex IV species.
(ancillary data) Boundary data are available for Irish national designations (Natural Heritage Areas, nature
Fig. 7 reserves and wildfowl reserves) with variable supporting data relating to site information/
habitat mapping.
Relevance: Up to ca. 24% of the Dargle is covered by designations, overlapping strongly
with the area of Article 17 reporting. A desktop habitat mapping study available for one of
the larger SAC sites, the Wicklow Mountains SAC, covers ca. 16% of the catchment area.
Apart from site code and name (often inferring the dominant habitat type), there are no
supplementary data available for national designated sites in the Dargle.
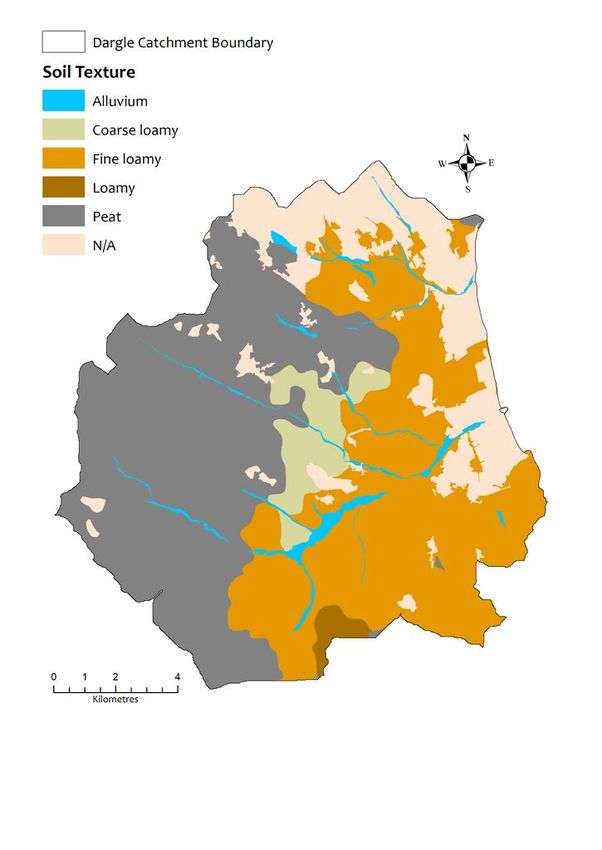
Soils (Soils Coverage: National.
Information System) Relevance: The soils database delineates the general soil association in an area, as well
(ancillary data) Fig. as providing data on soil texture (peat versus non-peat), soil drainage and soil carbon
8 (indicative ranges). Combined with the Derived Irish Peatland Map (DIPMV.2), developed in
2011 (Connolly and Holden 2009), these data are of particular relevance for peat soils.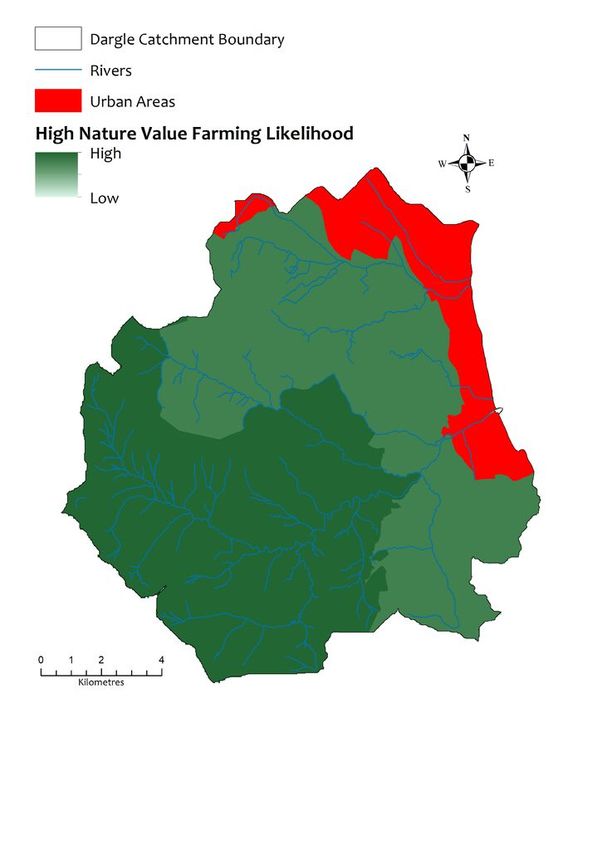
10 Farrell C et al
Dataset Description
High Nature Value Available time series: One-off (2016).
farming (HNVf) Coverage: National.
(ancillary data) Relevance: Developed using five indicators (semi-natural habitat cover, stocking density,
Fig. 9 hedgerow density, river and stream density and soil diversity). In the absence of condition
data relating to agricultural/enclosed farm areas, this dataset provides a high-level
aggregate to identify potential HNVf areas.
EU Water Available time series: four time series between 2007 and 2018, relating broadly to the
Framework WFD cycles.
Directive reporting Coverage: National; data are gathered for all waterbodies, including rivers or tributaries,
Fig. 10 lakes, coastal/transitional waters and groundwater.
Resolution: Available to sub-basin level for rivers.
Relevance: The main condition indicator for rivers and lakes is ecological status, a pre-
aggregated index, based on biotic and abiotic qualitative and quantitative data (supporting
physico-chemical and hydromorphological quality elements).
Ancillary data: Ecological status is supported by data relating to pressures and threats, as
well as characterisation which identifies waterbodies At Risk of achieving or maintaining
high or good ecological status. Data are also available on protection status (such as
drinking water or salmonid river protected status as in the Dargle shown Fig. 7) with
additional information gathered by the EPA relating to hydromorphology (Morphological
Quality Index or MQI) and water flow (hydrometrics)
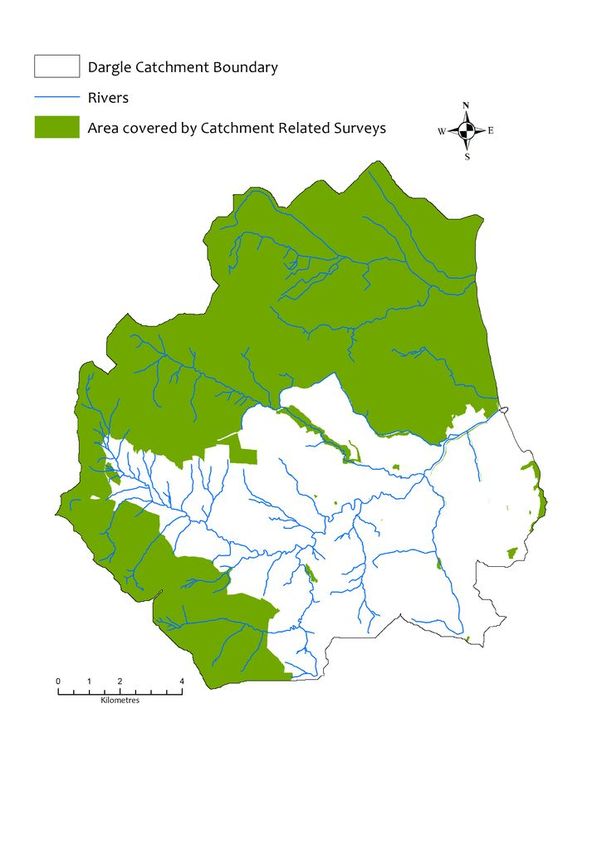
Catchment related Available time series: variable intervals from 2006.
surveys Fig. 11 Details: Local surveys available comprise:
• A farm level commonage survey (heathland primarily).
• A partial wetlands survey commissioned by Wicklow County Council (WCC).
• A habitats survey commissioned by a local authority in the southern Dublin
Region.
• Site-specific Article 17 reporting: Annex I habitats are surveyed and assessed
under four parameters to develop an aggregate of conservation status. These
include Range, Area, Structure and functions and Future prospects. Guidance on
assessment is provided by the EU (DG Environment 2017). Data for survey
sample points were available for ca. 0.2% (40 ha) of the Dargle.
• A desktop survey of Wicklow Mountains SAC (Natura 2000 data, see below).
• A national survey of native woodlands and a survey of ancient and long-
established woodlands (ALEW) supplemented data on woodlands.
These surveys present ecosystem extent data in the national classification scheme.
Combined with Article 17 and Natura 2000 datasets, detailed habitat survey data are
available for ca. 58% of the Dargle).
Ecosystem extent accounts
CORINE extent data
Extent accounts, developed using CORINE data (Table 2), show that the Dargle comprises
24 CLC Level 3 classes. Aggregating the CORINE data shows the full extent of each high-
level ecosystem type (Freshwater etc.) and highlights the main trends over the period
2000-2018.Applying the System of Environmental Economic Accounting-Ecosystem Accounting ... 11
Table 2.
Ecosystem extent account for the Dargle (based on CLC classes for 2000, 2006, 2012 and 2018
datasets). Area of each CLC Level 3 class is outlined in hectares. We highlight the overall change
between 2000 and 2018 in the final column. The total is aggregated to Ecosystem Type level. We
note that CLC status layers have been used to assess changes in this Table. We refer to the
change account in Table 4. for more detailed analyses.
Ecosystem Type CLC 3 CLC Level 3 2000 2006 2012 2018 Total
(ET) Code change
2000
to-2018
Freshwater 512 Water bodies 45 45 26 26 -19
Total 45 45 26 26 -19
Woodlands & 311 Broad-leaved forest 166 296 580 580 +414
Forest
312 Coniferous forest 1,421 1,886 1,788 1,830 +409
313 Mixed forest 550 477 372 372 -178
324 Transitional woodland-shrub 1,444 850 625 486 -958
Total 3,580 3,508 3,366 3,268 -313
Peatlands & 322 Moors and heathland 0 2,214 3,125 3,157 +3157
Heathlands
333 Sparsely vegetated areas 0 73 28 28 +28
334 Burnt areas 0 0 0 65 +65
412 Peat bogs 4,062 1,897 1,201 1,201 -2,861
Total 4,062 4,184 4,354 4,451 +389
Grasslands & 211 Non-irrigated arable land 706 442 444 476 -230
Croplands
231 Pastures 3,575 3,095 3,132 3,056 -519
242 Complex cultivation patterns 934 587 527 487 -447
243 Land principally occupied by agriculture, 1,259 1,607 1,732 1,756 +497
with significant areas of natural vegetation
321 Natural grassland 140 0 0 0 -140
Total 6,614 5,731 5,834 5,775 -839
Coastal 523 Sea and ocean 9 9 10 10 +1
Total 9 9 10 10 +1
Urban 111 Continuous urban fabric 0 37 46 46 +46
112 Discontinuous urban fabric 2,441 2,645 2,629 2,636 +195
121 Industrial or commercial units 78 119 257 276 +198
122 Road and rail networks and associated 85 199 198 198 +113
land
131 Mineral extraction sites 0 0 26 0 012 Farrell C et al
Ecosystem Type CLC 3 CLC Level 3 2000 2006 2012 2018 Total
(ET) Code change
2000
to-2018
132 Dump sites 30 81 0 0 -30
133 Construction sites 66 158 31 90 +24
141 Green urban areas 191 151 93 93 -98
142 Sport and leisure facilities 485 818 817 819 +334
Total 3,375 4,208 4,097 4,157 +782
Table 3.
Ecosystem extent expressed as % cover of the total Dargle area for 2000, 2006, 2012 and 2018
(total area of the Dargle is 17,866 ha).
Ecosystem Type (ET) 2000 2006 2012 2018
Freshwater 0.3 0.3 0.1 0.1
Woodlands and Forest 20.2 19.8 19.0 18.5
Peatlands and Heathlands 23.0 23.7 24.6 25.2
Grasslands and Croplands 37.4 32.4 33.0 32.7
Coastal 0.1 0.1 0.1 0.1
Urban 19.1 23.8 23.2 23.5
In terms of general trends, the data show that, between 2000 and 2018, there were overall
declines in cover of freshwater, woodlands and forest, grasslands and croplands, while
peatlands and heathlands and urban areas in the Dargle have increased (Table 3). Another
way of visualising these data are via accounting tables: the EnSym change account for
ecosystem extent in the Dargle, developed using the earliest (2000) and most recent
(2018) CLC status layers data, highlights further the changes in CLC Level 3 classes
(Table 4), aggregated to ecosystem type in Table 5. The change account highlights the
expansion of Urban class by ca. 4% (781 ha) between 2000 and 2018 and a reduction in
the total area of Grasslands and Croplands class by ca. 5% (839 ha) (we note slight
differences in area relating to calculating the areas of CORINE using ArcGIS and the
EnSym tool, in the order of 0-10 ha). More detail is shown in Suppl. material 3, which
outlines the ecosystem change matrix and highlights what ecosystem changes to other
types.Table 4.
Dargle catchment change in extent (hectares) account (2000 to 2018) for CLC Landcover Level 3 classes, developed using the EnSym tool (CLC status changes).
Note that two CLC3 classes occur in 2000 datasets, but not in 2018 datasets (CLC Dump sites and CLC Natural grassland). Summary changes (hectares) are
highlighted in Table 5.
Urban Grassland and Cropland Woodlands and Forest Peatlands and Heathlands Freshwater Coastal
CLC Continuous Discontinuous Industrial Road and Dump Construction Green Sport Non- Complex Pastures Natural Land Coniferous Mixed Broad- Transitional Burnt Moors Peat Sparsely Water Sea
Level 3 urban urban fabric or rail sites sites urban and irrigated cultivation grassland principally forest forest leaved woodland- areas and bogs vegetated bodies and
fabric commercial networks areas leisure arable patterns occupied forest shrub heathland areas ocean
units and facilities land by
associated agriculture,
land with
significant
areas of
natural
vegetation
Opening 2,446 79 84 29 66 192 482 706 934 3,577 141 1,260 1,421 551 166 1,441 4,058 46 9
Stock
Total 46 373 196 112 91 1 368 204 168 804 1,024 961 165 523 375 64 3,155 14 27 1
additions
to stock
Total (178) (1) (1) (29) (66) (100) (32) (432) (615) (1,323) (141) (528) (555) (344) (106) (1,330) (2,869) (20) (0)
reductions
in stock
Net 46 195 196 111 (29) 25 (99) 336 (229) (446) (520) (141) 497 406 (180) 417 (955) 64 3,155 (2,856) 27 (20) 1
change in
stock
Closing 46 2,642 275 194 - 91 94 818 477 488 3,058 - 1,756 1,827 371 583 485 64 3,155 1,202 27 25 9
stock
Additions 0.0% 15.2% 247.3% 133.5% 0.0% 138.4% 0.5% 76.5% 28.8% 18.0% 22.5% 0.0% 81.3% 67.6% 29.9% 315.5% 26.0% 0.0% 0.0% 0.3% 0.0% 0.0% 8.8%
to stock
(%)
Reductions 0.0% (7.3%) (0.6%) (0.9%) (100.0%) (100.0%) (51.9%) (6.7%) (61.3%) (65.8%) (37.0%) (100.0%) (41.9%) (39.1%) (62.5%) (64.1%) (92.3%) 0.0% 0.0% (70.7%) 0.0% -44.5% -2.9%
in stock
(%)
Net 0.0% (8.0%) (246.7%) (132.6%) 100.0% -38.4% 51.4% (69.8%) 32.4% 47.8% 14.5% 100.0% (39.4%) (28.6%) 32.6% (251.4%) 66.3% 0.0% 0.0% 70.4% 0.0% 44.5% -5.9%
change in
stock (%)
Applying the System of Environmental Economic Accounting-Ecosystem Accounting ...
1314 Farrell C et al
Table 5.
Aggregated change in extent account (hectares) and % of catchment area for CLC Level 3 classes
aggregated to Urban (Ur), Grassland and Cropland (G/C), Woodlands and Forest (W/F), Peatlands
and Heathlands (P/H). Freshwater (FW) and Coastal (C). Numbers reported in brackets indicate a
reduction.
CLC Level 2 Ur G/C W/F P/H FW C Total
Ha
Total ha Change 2000-2018 781 (839) (312) 391 (20) 1 0
Total % Change 2000-2018 4 (5) (2) 2 (0) 0 0
Total landcover category 4,158 5,778 3,266 4,448 25 9 17,684
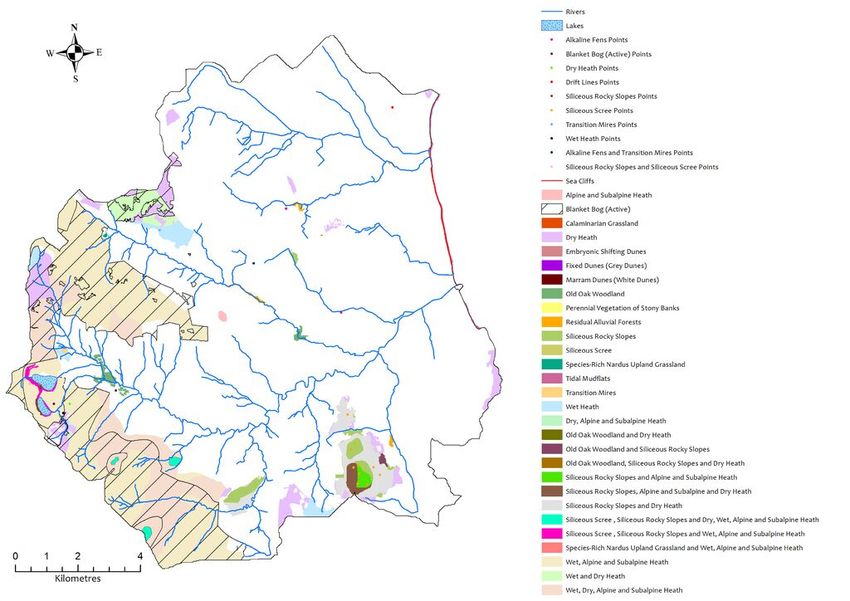
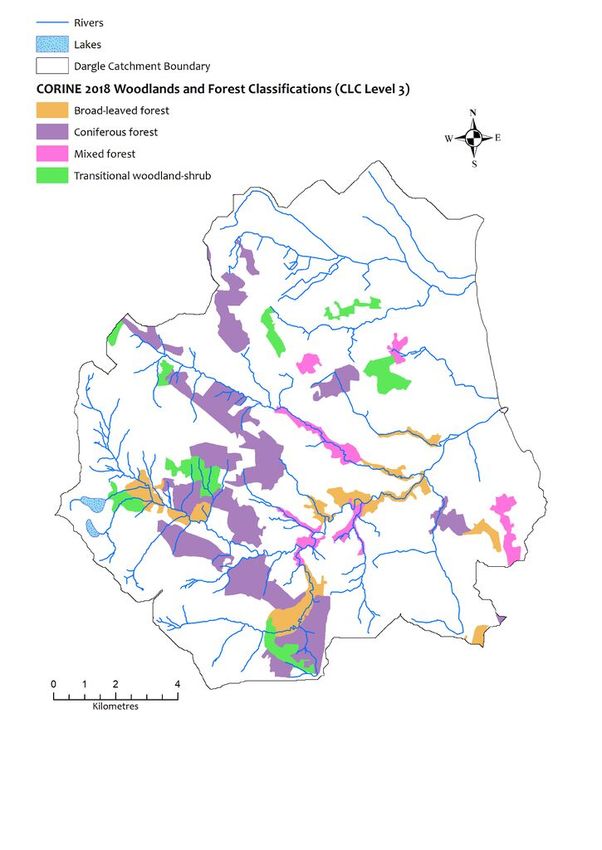
Percentage of catchment 24 33 18 25Applying the System of Environmental Economic Accounting-Ecosystem Accounting ... 15 rivers, lakes and/or freshwater wetlands smaller than the minimum mapping unit (MMU); these features were supplemented to the CORINE layer using the EPA rivers dataset (Fig. 3). Woodlands and Forest: As highlighted above, we distingush between Woodlands (all semi-natural types) and Forest (areas planted and managed for the purpose of commercial production) and we describe both types seperately. We note that the CLC classes coincide with commercially planted Forest in the main. Forest: This high-level ecosystem type covers ca. 20% of the Dargle in 2000, showing a relative decline in 2018 to ca. 18.5%. The change may be attributed to refinement of CORINE, given that the changes correspond to a relative increase in the area of peat bogs (Suppl. material 3). There is an increase in Coniferous forest in the same period. CLC Level 3 classes outline the extent of Broad-leaved forest, Coniferous forest, Mixed forest and Transition woodland-shrub, which correspond to commercial forests in the catchment (verified with ancillary commercial datasets). Coniferous forest dominates, comprising more than half of the total cover in 2018. Transitional woodland scrub shows a decline in cover and corresponds to the maturation of conifer stands between 2000 and 2018. Commercial forest datasets highlight that afforestation on state lands within the catchment largely occurred between the 1950s and the 1990s, with planting in private plots mainly in the period 1980 to 2000. Woodlands: There are no woodlands (hedgerows or patches of semi-natural native woodland types) detected by CORINE, despite an extensive network of hedgerows, parkland and riparian woodland areas obvious from aerial imagery. Overlaying the CORINE dataset with commercial forest datasets, the SWF and STL HRLs and catchment survey data, increased the total extent of woodlands and forest cover (taking overlaps into consideration) from ca. 18.5% to 40%. In particular, the SWF and STL HRLs highlighted the network of hedgerows and additional woody features undetected by CORINE (Figs 4, 5). Further overlaying combined woodlands and forest ecosystem extent with soil texture data highlighted that much of the commercial forest areas have been planted on peat soils. This may be a contributing factor in forestry being identified as a pressure on freshwater river ecological status in the Glencullen Valley (described under the Condition accounts). Peatlands and Heathlands: In 2000, only Peat Bogs were detected by CORINE, while the data distinguished four CLC Level 3 classes in 2018, namely Peat Bogs, Moors and Heathlands, Sparsely vegetated areas (screes on mountain slopes) and Burnt areas. This is attributed to an improvement in the distinction between these closely-related systems by CORINE after 2000. In total, these ecosystems accounted for 23% of the catchment in 2000, with a marginal increase to 25% in 2018. Overlaying Article 17 habitat mapping (Fig. 6), showed that the extent of peatlands and heathlands, detected by CORINE, is aligned with Article 17 datasets, serving to refine the extent data to distinguish more specific ecosystem types, including active blanket bog, wet heath, dry heath and alpine heathland types, as well as patches of fen less than the CORINE MMU. In addition, these ecosystems lie largely within Natura 2000 designations (Fig. 7). Combining both CORINE and Article 17 data for peatlands and heathlands with the national soil datasets, showed
16                                       Farrell C et al

that peat texture covers ca. 41% of the catchment, indicating that, prior to 2000, these
ecosystems were more extensive (Fig. 8). This additional 16% area of peat soil is overlain
predominantly by CLC Level 3 classes Coniferous Forest and Pastures.

 Figure 4.
 Dargle Woodlands and Forest cover using CORINE Land Cover Level 3 classes (2018) only.

 Figure 5.
 Cover of linear wooded areas in the Dargle, additional woody features and patchy wooded
 areas, as shown in SWF and STL HRLs.
Applying the System of Environmental Economic Accounting-Ecosystem Accounting ...     17

 Figure 6.
 The extent of datasets for the 24 habitats listed in Annex I of the EU Habitats Directive
 reported under Article 17 (2019 data) for the Dargle accounting area.

 Figure 7.
 Designated nature areas (Natura 2000 and national designated areas) and rivers with
 protected status in the Dargle catchment.

Grasslands and Cropland: Grasslands and Cropland cover ca. 33% of the catchment in
2018, showing an overall 5% decline in cover from 2000. The CLC Level 3 class Pastures
is most extensive for all accounting periods, declining by ca. 500 ha between 2000 and
2018. CLC class Complex cultivation patterns shows a similar decline. For both of these
classes, the area was converted to a range of CLC classes, including other grassland
types, urban fabric, as well as golf courses (verified by aerial imagery). The area of the
CLC Level 3 class Lands principally occupied by agriculture with significant areas of
18                                          Farrell C et al

natural vegetation, showed an overall increasing trend for the same time period. Croplands
(CLC Non-irrigated arable land) cover a relatively low area (< 3%) of the catchment, also
showing a decline. Applying the HNVf layer shows that outside of urban areas, the Dargle
lies in the High potential HNVf category (Fig. 9), reflecting the high density of semi-natural
habitats, as well as conservation designations, inferring that agriculture in the catchment
tends more towards extensive, rather than intensive, use. This was verified by overlaying
the Department of Agriculture, Forest and Marine Land Parcel Identification System (or
LPIS) dataset, (annual datasets gathered by the Department of Agriculture, Forest and
Marine for the purposes of farm payment schemes under the Common Agricultural Policy),
which showed a high area of low input permanent pasture for the area.

 Figure 8.
 Soil texture data for the Dargle show that peat texture is predominant and aligns with peatland
 and heathland habitats in uplands and forests along river valleys (see Fig. 3).

Coastal: Accounting for less than 1% of the Dargle, the CLC classes, detected in this
category (Sea and Ocean), align with coastal margins. These data were supplemented
with Article 17 datasets for Annex I coastal habitats and show that this area includes a
relatively small sand dune complex, a fringe of tidal mudflats along the eastern boundary
and a section of sea cliffs south of Bray.

Urban: Urban fabric in the Dargle is extensive in 2018 (ca. 23.5% of the catchment)
increasing by ca. 4.5% between 2000 and 2018 across the urban CLC classes. The
greatest increase was between 2000 and 2006, corresponding to a period of intense
economic growth and expansion of infrastructural developments in Ireland. Focusing on
green spaces, between 2000 and 2018, Green Urban areas showed a gradual decline to
93 ha (reduced by over half), while Sports and leisure facilities double in extent to over 800
ha (comprising golf courses mainly). Supplementing these data with the Urban Atlas HRL
increased the extent of Urban green space from a few scattered patches (< 0.5% using
Applying the System of Environmental Economic Accounting-Ecosystem Accounting ...          19

CORINE) to ca. 3% of the catchment. Applying the Urban Atlas STL HRL also highlighted
that urban areas in the catchment have a significant network of wooded areas, not
detected by CORINE.

 Figure 9.
 Potential of High Nature Value farmland in the Dargle.

Ecosystem condition accounts

Freshwater: Condition account data, available for rivers and lakes in the Dargle to sub-
basin level, are shown in Table 6. We note that, while the reporting periods (2007 to 2018
available) do not align with those of the CORINE extent accounts, we use the time series
data available to compare general trends in condition of rivers and lakes with the key
messages emerging from the ecosystem extent accounts.

 Table 6.
 Ecological status of freshwater rivers and lakes and WFD reporting in the Dargle (WFD Cycle 2
 Sub-catchment Dargle_SC_010) (Note: SP refers to Significant pressures).

Waterbody Name Type 2007-09         2010-12     First Full   Assessment   WFD Risk      Protected SP
                    Baseline        Mid-term    Cycle        to 2018:     Status        area
                                    review      reporting    2013-18      2010-2015
                                                period
                                                2010-15

Bray lower        Lake Good         Moderate    Good         Good         Not at risk

Bray upper        Lake Unassigned Unassigned Unassigned      Unassigned   Not at risk

Carrickmines      River Moderate    Moderate    Moderate     Moderate     At risk                Y
Stream_010
20 Farrell C et al
Waterbody Name Type 2007-09 2010-12 First Full Assessment WFD Risk Protected SP
Baseline Mid-term Cycle to 2018: Status area
review reporting 2013-18 2010-2015
period
2010-15
Kill of the Grange River Poor Poor Poor Poor At risk Y
Stream_010
Shanganagh_010 River Moderate Good Good Moderate Not at risk Drinking Y
Water
Glencullen_010 River Good High Good High At risk Drinking Y
Water
Glencullen_020 River Good Good Good Good Not at risk
Dargle_010 River High Good Good Good At risk Salmonid Y
Dargle_020 River Good Good Good Good Not at risk Salmonid
Dargle_030 River Moderate Good Poor Moderate At risk Salmonid Y
Dargle_040 River Unassigned Unassigned Good Good Not at risk Salmonid
Glencree_010 River Moderate Good Good Good Not at risk
Kilmacanoge_010 River Moderate Moderate Moderate Moderate At risk Y
Figure 10.
Characterisation of At Risk sub-basins in the Dargle.
Ecological status in 2018 ranged from poor, for the urban dominated sub-basin of the Kill of
the Grange Stream, to high for the largely rural, forest dominated Glencullen_010 sub-
basin. While forest cover is not increasing in the catchment (based on the extent
accounts), other management practices, such as clear-fell and replanting, are ongoing.
Between 2012 and 2015, ca. 50 ha of mature conifer forest was clearfelled and
subsequently replanted (based on commercial data and analyses of aerial imagery.Applying the System of Environmental Economic Accounting-Ecosystem Accounting ... 21 Despite the notable difference in ecological status, both watercourses are considered At Risk (2010-2015 assessment period) of maintaining or achieving high ecological status due the significant pressures (urban and forestry, respectively), identified in each sub-basin (Fig. 10). The Kill of the Grange Stream show consistently poor ecological status. Four other watercourses show moderate ecological status; these sub-basins are also characterised by urban dominated land cover. These include the Carrickmines Stream, Shanganagh and Kilmacanogue Rivers and the Dargle_030, each of which are below good ecological status. The Dargle River is a salmonid river and, despite being in good ecological status in the main (apart from the Dargle_030), two of four sections are considered At Risk (hydromorphological pressures in the upper reaches and urban pressures in the lower sub- basins). Overall, significant pressures in the Dargle relate largely to urban wastewater and diffuse urban water run-off; forestry is a significant pressure in the Glencullen_010 and hydromorphological changes is a pressure in the Dargle_030. Neither of the lakes in the uplands is considered At Risk. Figure 11. Coverage of habitat surveys (58%) available for the Dargle accounting area. EU Habitats Directive datasets: Survey data available for Article 17 sampling points within the Dargle show that locally, fragments of Annex I listed woodlands, such as Residual Alluvial Forests, are in Favourable Conservation status, though at national level, they are reported as Bad. These differences relate to the sample point data and highlight that catchment level status assessments do not reflect the national assessment. Survey points in the catchment for Old Oak Woodlands, Sand Dune complexes, Sea cliffs and one farm level survey sites with Annex I heathlands show these Annex I habitats as being of Unfavourable Conservation status. Again, at national level, these habitats are assessed as being Bad. These survey data comprise one sample plot for each habitat type, surveyed at
22                                      Farrell C et al

variable intervals. While there are survey data for a limited number of sample plots within
the catchment area (Fig. 11), there are no catchment level condition data for other Article
17 habitats listed or any other habitats outside of these areas in the catchment. We present
the national assessment data to provide context for discussion around these issues Suppl.
material 4.

Discussion
Catchment scale: key messages and next steps

The ecosystem extent accounts developed in this study show that there have been subtle
changes in the cover of ecosystem types in the Dargle over the accounting period (2000 to
2018). The main changes detected are the conversion of agricultural land cover classes to
urban fabric, during a period of intense economic growth around Dublin, reflecting a similar
trend across the EU Region (EEA 2016). Combining the core extent accounts developed
using CORINE, with supplementary habitat surveys, remote sensing HRLs and ancillary
data on land use (commercial forestry, agricultural payments, as well as conservation
designations), provided greater detail and information as to the extent of ecosystems
during the accounting period. The data analyses also highlighted changes prior to 2000
and, in particular, using maps relating to soil texture, the conversion of former peatland and
heathland ecosystems to commercial forest plantations and agricultural grasslands.
Establishment of the Natura 2000 network in the 1990s along with other national
designations, reinforces the present-day nature conservation value of those remaining
peatland and heathland areas, as well as the fragmented native woodland network, in the
catchment.

Relatively small changes in ecosystem composition, however, can result in wider effects
across ecosystem stocks and flows. While freshwater river ecosystems comprise a
relatively low cover of the study catchment, their condition serves as an effective indicator
of wider land use and land use change and the general environmental quality in a given
catchment or sub-basin, as shown in the Dargle. Data gathered under the WFD allows for
reliable, time-series condition reporting, while also taking into consideration pressures and
trends to provide information for targeted measures to improve water quality and reduce
pressures according to Integrated Catchment Management principles. Applying the SEEA-
EA at catchment (or sub-basin) scale brings added value to and makes effective use of
these WFD data, which provide an indicator of the condition (ecological status) of
freshwater rivers and, in the absence of relevant data gathered for other ecosystems, also
serves as an indicator of the condition or environmental quality of the catchment or sub-
basin as a whole. In our work applying the SEEA-EA, we conclude that, despite data gaps
and limitations (described in the next section), the development of ecosystem extent and
condition accounts at catchment scale is both feasible and effective in building a narrative
around the changing composition of ecosystem types over time, particularly from the
perspective of management of water resources. This is also being explored across the EU
region (EEA 2016).
Applying the System of Environmental Economic Accounting-Ecosystem Accounting ...    23

Building future datasets to match data needs

Each step of ecosystem accounting requires the integration of relevant datasets and
consequently the detail provided by each account is reliant on the available data inputs.
We discuss the limitations of and relevant data gaps uncovered, offering some conclusions
to facilitate and streamline the use of the SEEA-EA at catchment and other scales.

Extent accounts: data available and data gaps

In the absence of a detailed ecosystem map and/or other higher resolution data, CORINE
datasets provided the necessary contiguous, time-series data to support the development
of indicative ecosystem extent accounts at catchment scale. This reflects the use of
CORINE for high-level ecosystem and landcover reporting across the EU Region at Tier I
(EU Region, using CLC Level 2 classes) and Tier II levels (national regions, using CLC
Level 3 classes) (Burkhard 2018, EEA 2016, La Notte 2017). While we note the accuracy
of CORINE has improved between 2000 and 2018, reflected particularly in the distinction
of peatland and heathland areas, the ongoing limitations of the CORINE data for
catchment scale (Tier III level) accounting relate to the resolution of the data, outlined
specifically as follows:

Distinction of ecosystem types: In this study, we broadly aligned CLC Level 3 classes to
Level 1 of the national ecosystem typology (Fossitt 2000). Recognising that Level 3 of the
national typology (Suppl. material 1) provides greater insight and detail as to ecosystem
sub-types and variants (for example, distinguishing improved grassland from semi-natural
grassland types), the data available limited our discussions and findings to high level
ecosystem types and high level trends only. This will limit further discussions relating to the
flows of services, which vary considerably between more detailed ecosystem types. For
example, biomass provision from improved grassland is likely to be higher compared to
that from wet, semi-natural grassland types which are likely to provide a greater level of
water and sediment retention services than improved grassland types.

Detection of linear features: rivers, hedgerows and landscape features less than the MMU
or minimum mapping width of CORINE (such as locally-important wetlands and
woodlands) were not included in the CORINE, based core extent accounts for the Dargle.
Supplementary datasets are effective in refining and providing detail but, in general, these
are gathered at varying intervals and scales and are generally not consistent either with
each other or the available CORINE time series.

These limitations extend across all scales of reporting, however, presenting recurring
challenges in building ecosystem accounts at any level, as shown across the EU Region
(EEA 2016, Grêt-Regamey 2017, Grunewald 2020, Hein 2020a, La Notte 2017). A national
landcover map (in development for Ireland) (Wall 2020) due to have a resolution of 10 m, is
likely to provide finer detail on ecosystem extent and will be aligned with the national
ecosystem typology. In the absence of a national ecosystem map and/or contiguous
catchment scale ecosystem mapping, this will support both catchment and national levels
of reporting in Ireland, streamlining further the ecosystem extent accounting process. In the
24                                      Farrell C et al

meantime, work in the Dargle reflects approaches to developing ecosystem accounts in
other studies, requiring the alignment of disparate datasets, such as habitat survey, remote
sensing and land use data to present the best available information relating to ecosystem
extent (Burkhard 2018, EEA 2016, Grunewald 2020, Parker 2016, Hein 2020a, Perennes
2020). We note that applying ancillary datasets proved useful to contextualise findings
within the accounting area relative to changes occurring outside of the accounting period.

Further alignment with the IUCN Global Ecosystem Typology (Keith 2020) highlighted that
ecosystem types, recorded in the Dargle, are largely grouped in the Intensive Land-use
category, T7. This comprises artificially-managed areas, such as sown pastures, urban
areas and plantations. Only scattered framents of semi-natural ecosystem types are
present, reflecting the steady and increasing conversion of natural lands, such as
temperate woodlands, heathlands and wetlands (peatlands and fens), to intensive
agricultural use in former centuries, as well as the more recent expansion of urban areas in
the late 19th and early 20 th centuries (Mitchell 1997). Agriculture is the dominant land-use
in Ireland and, while there are subtle changes in recent years towards intensification, this
has largely occurred outside the Dargle which shows an opposing trend towards
extensification in agricultural areas. Aligining the SEEA-EA accounting approach with the
IUCN Global Ecosystem Typology will facilitate effective comparison across the EU Region
and globally (UNSD 2021) in terms of the extent of intensively used ecosystems and
natural lands, providing information to plan targeted restoration to rebuild natural networks
and re-connect isolated areas protected for nature, a key action identified in the EU
Biodiversity Strategy for 2030 (EC 2020).

Condition accounts: data available and data gaps

Condition accounts are the least developed within the European Region and at national
levels, though efforts are becoming more focused (Czúcz 2020, Keith 2020, Maes 2020).
The lack of condition data across the full range of ecosystem types indicates that only
bespoke condition accounts can be developed at catchment and/or national scale in
Ireland at this time.

In relation to our case study, WFD data provides a comprehensive resource to develop
ecosystem condition accounts for waterbodies in general and, by extension, as highlighted
already, this can be extended to the related sub-basins in the absence of condition data for
other ecosystem types. Ecological status is a pre-aggregated index which may be used as
a sub-index as part of Stage 3 of condition accounting and has been used in ecosystem
accounting in European case studies (Rendon 2019, Maes 2020, Hein 2020a, EEA 2016).
Other condition datasets available for habitats listed under Annex I of the EU Habitats
Directive, as well as for sites within the Natura 2000 network, are available, though site-
specific data relating to catchment level are very limited. Use of these and other datasets
(such as National Forest Inventory data gathered at national scale) data are appropriate for
condition accounts developed at national scale rather than catchment scale, as used in
other studies (Maes 2020, Rendon 2019).
Applying the System of Environmental Economic Accounting-Ecosystem Accounting ...    25

Aligning ancillary datasets with the core extent accounts data in the Dargle illustrated the
effective use of soils data to infer the historical extent of peatlands and heathlands. This is
an important consideration for the use of cultivated peat soils and the resultant contribution
to climate regulation. In this way, ancillary data and proxies can be used to effect, serving
as placeholders to highlight data gaps until more appropriate data are gathered (Burkhard
2018, Geijzendorffer 2015, Maes 2020, Vačkářů and Grammatikopoulou 2019, Grunewald
2020). The use of these data will provide information for further analyses in relation to
changes in peat soils that occur when converted to plantation or cultivation, such as
changes in carbon stocks and flows over time and trade-offs in terms of ecosystem service
(for example, biomass provisioning versus climate regulation services) (UNSD 2021).

The challenges identified in this case study reflect those identified in other studies and
include the lack of data to build condition accounts, the absence of targeted and reliable
time-series data on structure and function, as well as the need for agreed reference levels
(Maes 2020). Despite clear guidance provided in the SEEA-EA, a number of questions
remain to be addressed and require multi-disciplinary efforts, particularly from ecologists
with specialist knowledge from across the range of ecosystem types of relevance, to guide
and develop the links between condition, capacity to deliver services and sustainable use
(Czúcz 2020, Keith 2020, Rendon 2019, Maes 2020).

In relation to peatlands, data relating to drainage and vegetation cover, is often reflected in
the name of the peatland ecosystem type (Level 3 of the national ecosystem typology).
Within the Dargle, a desktop survey of the Wicklow Mountains SAC highlights areas of
active blanket bog (considered to be good condition), as well as cutover bog and eroding
bog (considered to be drained and eroding, therefore inferring poor condition) within the
SAC area. Linking these data with remote sensing approaches detecting peatland drainage
(Connolly and Holden 2013), would provide information about potential peatland
ecosystem condition indicators. A similar approach, working with ecosystem experts, would
make information available for selection of relevant ecosystem condition variables and
condition indicators for other ecosystem types (woodlands, grasslands, freshwater etc.),
particularly in the local and regional context. Efforts to combine advances in remote
sensing at the EU level to develop Essential Biodiversity Variables as well as national
efforts, will facilitate alignment with local ecosystem types and contribute to filling data
gaps, ultimately facilitating effective ways of tracking and accounting for changes in a
standardised comparable way.

While challenges remain, following the examples of other studies (Maes 2020, Rendon
2019) and proposed condition variables set out in the SEEA-EA guidance (UNSD 2021),
more focused work at the individual ecosystem type level to incorporate and provide
information for other datasets, such as survey data commissioned for development and
planning projects and/or species data collated by NGOs and citizen science programmes,
will facilitate gathering of relevant condition data and, thereby, development of more robust
condition accounts.
You can also read