ADMINISTRATIVE RECORD MODELING IN THE 2020 CENSUS - Mary H Mulry Tom Mule Andrew Keller Scott Konicki April 27, 2021 - Census.gov
←
→
Page content transcription
If your browser does not render page correctly, please read the page content below
ADMINISTRATIVE RECORD
MODELING IN THE 2020 CENSUS

 Mary H Mulry
 Tom Mule
 Andrew Keller
 Scott Konicki

 April 27, 2021
Table of Contents
 1. Introduction .......................................................................................................................................... 3
 2. Background ........................................................................................................................................... 4
 2.1 History of ARs and the U.S. Census ..................................................................................................... 4
 2.2. Recent uses of ARs ............................................................................................................................. 5
 2.3 AR data quality and protection ........................................................................................................... 6
 2.3.1 AR data quality for AR enumeration ................................................................................................ 6
 2.3.2 Data protection ................................................................................................................................ 6
 3. Research and development, 2012-2018 ............................................................................................... 7
 3.1 Investigate feasibility 2012-2014 ........................................................................................................ 7
 3.2 Identify strategy 2015 - 2016 .............................................................................................................. 8
 3.2.1 Assessing quality of ARs ................................................................................................................... 9
 3.2.2 2015 Census Test ............................................................................................................................. 9
 3.2.3 2016 Census Test ........................................................................................................................... 10
 3.2.4. Retrospective study of interplay between distance function and NRFU Contact Strategy .......... 10
 3.3 Develop implementation methodology 2017 - 2018 ........................................................................ 11
 3.3.1 Requirement for corroboration of AR household roster ............................................................... 11
 3.3.2 Increasing coverage of children in AR rosters................................................................................ 11
 3.3.3 Methodology to compensate for missing household size and person characteristics .................. 12
 3.4 Refinements to NRFU Contact Strategy 2017 ................................................................................... 12
 3.4.1. Revision of NRFU Contact Strategy for 2018 End-to-End Census Test ......................................... 12
 3.4.2 Final revisions to 2020 NRFU contact strategy .............................................................................. 12
 3.5 Lessons learned ................................................................................................................................. 13
 4. Models used in 2020 Census AR enumeration Process ...................................................................... 14
 4.1 AR Vacant and AR Nonresidential identifications ............................................................................. 14
 4.1.1 AR Vacant-Nonresidential model ................................................................................................... 14
 4. 1.2 Distance measure for AR Vacant and AR Nonresidential Identifications ..................................... 15
 4.2 AR Occupied Identification ............................................................................................................... 15
 4.2.1 Person-place model ....................................................................................................................... 15
 4.2.2 Household composition model ...................................................................................................... 16
 4.2.3 Distance measure for AR Occupied status ..................................................................................... 16
 5. Original AR processing plan ................................................................................................................ 17
 5.1 Early May (Phase 1) ........................................................................................................................... 17

 1
5.2 Early June (Phase 2) .......................................................................................................................... 17
5.3 Early August (Phase 3)....................................................................................................................... 17
6. Unexpected delay and changes ......................................................................................................... 18
6.1 Adjustments to data collection schedule.......................................................................................... 18
6.2 Adjustments to IRS Processing Schedule .......................................................................................... 19
7. Modified plans ................................................................................................................................... 19
7.1. Late May AR processing ................................................................................................................... 19
7.2 Middle June AR processing ............................................................................................................... 20
7.3 Early July AR processing .................................................................................................................... 20
7.4 Early August AR processing ............................................................................................................... 21
7.5 Early September AR processing ........................................................................................................ 21
7.6 Late September AR processing ......................................................................................................... 22
7.6.1. Household Size Only enumerations from Sole Source in the Closeout Operation ....................... 22
7.6.2 American Indian Reservations (AIRs) ........................................................................................... 22
7.7 Middle October processing for counties affected by hurricanes ..................................................... 22
7.8 June through October off-campus college students ....................................................................... 23
8. Summary ............................................................................................................................................. 24
References .............................................................................................................................................. 25
Appendix ................................................................................................................................................. 30

 2
1. Introduction

The 2020 Census is the first U.S. census to use administrative records (ARs) to enumerate some
households. The innovation used ARs to classify some addresses as Occupied, Vacant, or Nonresidential
and to create a roster of the residents with their characteristics for some of the addresses classified as
Occupied. The more recent U.S. censuses also have used ARs in some aspects of census-taking, but not
for the enumeration of households. Other statistical programs at the U.S. Census Bureau have used and
continue to use ARs to support their data collection operations. In this document, the term “administrative
records” refers to data collected by governmental or nongovernmental agencies while administering a
program or service.

Advances in computer technology and software have enabled the expanded use of ARs. In addition, the
Office of Management and Budget (OMB) has encouraged federal agencies to leverage the ARs collected
by operations and services in their statistical programs (U.S. Office of Management and Budget 2014).
The advances and support of OMB also have led to the development of agreements between the Census
Bureau and other government agencies that permit the use of their ARs for enumeration of households
under specified conditions. In the nongovernmental sector, new technology and software have enabled the
construction of commercially available databases that contain information that may or may not overlap
with data available to the Census Bureau in ARs housed in government agencies.

The Census Bureau began a research program in 2012 to pursue its goal of identifying a methodology for
using administrative records to reduce the cost of the 2020 Census Nonresponse Followup (NRFU)
operation while preserving data quality. NRFU is the census field operation where enumerators visit
addresses that did not submit a self-response and attempt to obtain an interview. Not surprisingly, NRFU
was one of the most expensive operations in the 2010 Census. Improving the efficiency of the NRFU
operation was viewed as critical to the goal of a cost-effective census in 2020 (U.S. Census Bureau
(2019a, 2019b).

This document discusses the use of ARs in the enumeration of households at some addresses in NRFU. A
brief overview of AR enumeration may be found in the blog post by Mule (2021). In contrast, this
document provides a high-level discussion that includes more details regarding the evolution of the
methodology for AR enumeration and its implementation in the 2020 Census. Not covered is the use of
records maintained by group quarters administrators who use their records to enumerate the people
residing in their facilities. For information about the enumeration of group quarters facilities, see
Stempowski and Christy (2021), U.S. Census Bureau (2017).

In particular, the discussion in this document focuses on the research that led to the methodology for
using ARs to enumerate the households at some addresses in NRFU and the implementation in the 2020
Census. These topics include the following:
 • Section 1 is the introduction to the document.
 • Section 2 has a brief overview of administrative records at the Census Bureau that includes
 historical and recent uses, data quality, and data protection.
 • Section 3 contains a description of the research and development that occurred from 2012 through
 2018 to prepare for using administrative records in census enumeration and includes the
 investigation of the feasibility, identification of a strategy, census tests, and lessons learned.
 • Section 4 has a description of the models used in the administrative records enumeration process.
 • Section 5 contains the original plan for using administrative records in 2020 Census enumeration.

 3
• Section 6 discusses the unexpected delay in the 2020 Census data collection and processing
 because of the COVID-19 pandemic and the adjustments to the schedule.
 • Section 7 focuses on the modifications and adaptations required to cope with the unforeseen
 disruptions in the implementation of the 2020 Census because of the COVID-19 pandemic.
 • Section 8 contains a summary.
 • An Appendix contains two tables, one with the planned timeframe for the administrative records
 processing and another with the revised timeframe.

Throughout this document, the descriptions of the research and development include the rationale behind
the resulting decisions. By focusing on data quality during each phase of the research, development, and
implementation, the chosen methodology was able to employ ARs to improve the quality of the census
enumeration. This investment proved fortuitous when the pandemic and a series of natural disasters
disrupted traditional NRFU operations. Without the strategic use of administrative records, the imputation
rate for the 2020 Census would have been higher.

2. Background

2.1 History of ARs and the U.S. Census

The Census Bureau has a long history with ARs. The first study of consequence occurred during the early
1940s and used the demographic method of comparing aggregated totals. The study focused on a
comparison of the number of males of military age in the 1940 Census to the number found in draft
registration records using a clerical operation. The findings dispelled the prevailing assumption that the
census had better coverage than records systems. The study estimated there were 14.9 percent more Black
males of 21 to 35 years of age registered for the draft than were counted in the census and 2.8 percent
more non-Black males in the same age category (Price 1947).

This result led to the development of census coverage evaluation methodologies. The first such evaluation
method was Demographic Analysis. The estimates produced by Demographic Analysis are a sum of totals
for subpopulations based on aggregating ARs from different record sources, such as birth and death
records, to form an estimate of the total population that can be compared to the total from a census. The
1950 Census was the first census to have its coverage evaluated using Demographic Analysis (Coale
1955).

Demographic Analysis has been used to evaluate the coverage of every U.S. census at the national level
since 1950 and is still used today although the methodology and data sources have improved over the
years. The results of the Demographic Analysis estimates developed for evaluating the coverage of the
2020 Census may be found in Jensen et al. (2020). The need for estimates of census coverage for
geographic and demographic subgroups led to the development of two other methods, the Reverse
Records Check used by Canada (Statistics Canada 2007) and the Post-Enumeration Survey used by the
U.S. and several other countries (Mulry 2014).

Over the years, the Census Bureau has conducted matches between different administrative lists and
censuses to evaluate coverage and data quality. A few of the earlier studies are listed below:

 4
• An administrative records match (ARM) evaluated the coverage of the 1960 Census for Social
 Security recipients (Marks & Waksberg 1996). The estimate of the number of Social Security
 recipients missed was 5.1 to 5.7 percent of those enumerated.
 • Another ARM conducted in conjunction with the 1980 Census assessed the feasibility of using
 the 1979 Internal Revenue Service (IRS) file as a sampling frame for evaluating census coverage
 (Childers & Hogan, 1983). A sample from the IRS file was matched to the 1980 Census at their
 address in the IRS file. When a person was not found at the IRS address, the study attempted to
 trace them through the mail. However, 22 percent of the sample could not be traced, and the study
 did not make estimates of census undercount.
 • An ARM conducted in conjunction with the 1996 Community Census Test focused on
 determining whether there were people in administrative records who were not listed in a census
 or a post-enumeration survey. The percentage of people from administrative records who were
 residents but not enumerated and not on the rosters in the post-enumeration interview ranged
 from 2.0 to 2.5 across the three sites in the test.

The reader needs to keep in mind that the U.S. has not had a single source of administrative records with
high coverage of the entire population. After the 2000 Census, there was an attempt to create a census-
like file by merging and unduplicating five federal sources of administrative records, called the Statistical
Administrative Records System (StARS) (Leggieri, Pistiner, and Farber 2002). A comparison between the
StARS and Census 2000 found that StARS covered 95 percent of the population in Census 2000 (Judson
2000).

The 2010 Census presented an opportunity for further research by creating a census-like administrative
records file that merged both federal and commercial data sources and then comparing the unduplicated
administrative records file to census records. The results of the 2010 Census Match Study showed that
88.6 percent of the 308.7 million 2010 Census enumerations could be matched to an administrative
record. The main reason for the low match rate appeared to be not being able to assign unique
identification numbers to 9.6 percent of the census person records. The census-like administrative records
file had 312.2 million records for unique people, but the study was not able to link 10.7 million to an
address on the census file (Rastogi and O’Hara 2012).

2.2. Recent uses of ARs

The 2010 Census used ARs in different operations. In one, the Census Bureau’s Geography Division
updated its Master Address File (MAF), which is the list of addresses with living quarters, using a
database maintained by the U.S. Postal Service called the Delivery Sequence File (DSF) and five
commercially available databases (U.S. Census Bureau 2016). The DSF is the list of residential addresses
where the U.S. Postal Service delivers mail and was the primary source used in the update. A second
2010 operation that used ARs was Coverage Followup, which called households whose census
questionnaire had ambiguities to clarify the information (Govern, Coombs and Glorioso 2012). Although
the census questionnaires requested a telephone number, some households did not provide a number, and
for others, the responses were not valid numbers. The Telephone Lookup operation used two
commercially available databases, InfoUSA and QAS (formerly QuickAddress), to find telephone
numbers for the households.

Other Census Bureau programs have expanded their use of ARs as computer technology and data
processing improved to accommodate storing and manipulating larger data files. Some examples of

 5
current programs that use ARs are the Business Register (DeSalvo, Limehouse, Klimek 2016), Intercensal
Population Estimates (U.S. Census Bureau 2012), Local Employment Dynamics (Coyle, E. 2019), Small
Area Income and Poverty Estimates (U.S. Census Bureau 2019c), and Small Area Health Insurance
Estimates (U.S. Census Bureau 2019d).

2.3 AR data quality and protection

2.3.1 AR data quality for AR enumeration

For the 2020 Census, the AR information was used for enumeration only if the quality was high and if a
self-response was not received for the address or its status was not resolved during one visit of fieldwork
enumeration. For the people whose enumerations are based on administrative records, the demographic
characteristics of age, sex, race, Hispanic origin, and relationship were obtained from AR sources such as
past census responses, the Social Security Numerical Identification (Numident) file, or datafiles from
other Census Bureau programs such as the American Community Survey (ACS). For any of the
characteristics that could not be assigned directly based on administrative record information, imputation
procedures were used (U.S. Census Bureau Administrative Records Modeling Team 2017).

The Census Bureau’s policies and procedures emphasize coverage of the population being studied and the
accuracy of the data it collects (U.S. Census Bureau 2021a). The entire 2020 Census program is geared
toward assuring that the census numbers provide coverage of the U.S. population as a whole and within
each state. The AR enumeration is designed in a manner that requires it to assure that the designation of
addresses as Occupied, Vacant, or Nonresidential has a high probability of being accurate, and in doing
so, AR enumeration contributes to the accuracy of coverage of the population. In addition, when a
household is enumerated using ARs, the operation is required to assure that there is a high probability that
the AR records reflect the number of household members and their characteristics.

In this document, the use of the term “high quality” ARs is used to mean that there is a high probability
that the AR status assigned to an address is accurate. The assignment of the Occupied status means that
there is a high probability that the address is occupied, and the household size and composition and
characteristics are accurate. The assignment of the Vacant status means that there is a high probability
that the address has living quarters, but no one resides there, while the Nonresidential status means that
there is a high probability that address does not have living quarters.

2.3.2 Data protection

The Census Bureau is required by law to protect the personally identifiable information for a person or
business that it acquires for use in the census and other statistical purposes. The Census Bureau is
authorized to acquire or purchase records from states and third-party entities under Title 13, United States
Code (U.S.C.). Other laws that apply to the protect personal data are the Privacy Act of 1974 and the
Confidential Information Protection and Statistical Efficiency Act (CIPSEA). In addition, other federal
confidentially statutes permit agencies to share data with the U.S Census Bureau under strict, secure
conditions (U.S. Census Bureau 2020a). When an agency agrees to share its data with the Census Bureau,
the two parties enter into a binding agreement that specifies the data being shared and how the data may
be used by the Census Bureau.

The Census Bureau grants access to personally identifiable information to employees when required for
their work and for no other purposes. Every person who works with confidential information collected or
acquired by the U.S, Census Bureau is sworn for life to uphold the law and not to illegally disclose any

 6
personally identifiable information. Violating these laws is a federal crime with serious penalties,
including a federal prison sentence of up to five years, a fine of up to $250,000, or both (U.S Census
Bureau 2020a).

Merging AR data from several sources requires linking records across datafiles to avoid having two or
more records for the same person in the final file. A concern for this process is that a datafile may have
records that are invalid or out of date that need to be removed. The Census Bureau developed the Personal
Validation System (PVS) that processes incoming AR datafiles from other government agencies and
commercial sources. The PVS has the dual purpose of attempting to validate the name and address
combination on each record in incoming datafiles and to replace each person’s address and name with
unique anonymized numbers (Wagner and Layne 2014).

When the PVS can identify the geographic location of the address on the internal Master Address File
(MAF), the address receives the corresponding MAF identification number (MAFID), which is a unique
anonymized address number. When the AR file includes Social Security Numbers (SSNs), the PVS
checks the Census Bureau’s version of the Social Security Administration Numident to assure that each
SSN is valid. When records in an AR file do not include SSNs, the PVS processing attempts to link the
name to other sources and find an SSN. When an SSN can be assigned to the name, the PVS assigns a
Protected Identification Key (PIK), which may be viewed as anonymized SSN (Wagner and Layne 2014).

After the PVS processing, the records in the datafiles produced for statistical analyses contain the
corresponding MAFID and PIK but not the person’s name. The correspondence between the address and
MAFID and the correspondence between person’s name and PIK are retained in a separate file that is
stored in a restricted area that is available only to the staff that assigns the MAFIDs and PIKs. In
particular, the information is not available to employees assigned to perform the data analyses. However,
if a project has a specific need for addresses or names or both, staff must submit a request with a
justification to receive approval for use that is restricted to only the specified project and staff.

3. Research and development, 2012-2018

The Census Bureau conducted research throughout the decade to learn more about the ARs that were
available and the best way to use the ARs in the 2020 Census enumeration to meet the goal of reducing
the cost of NRFU while maintaining the quality of the enumerations. The program involved research and
testing in addition to publishing research results in peer-reviewed journals and consulting with outside
experts who provided advice and comments as results became available. There were three phases during
the research program that ran from 2012 to 2018: (1) investigate feasibility of using the ARs for census
enumeration, (2) identify the strategy, and (3) develop the implementation methodology.

3.1 Investigate feasibility 2012-2014

In preparation for the 2013 Census Test, the initial investigation examined the feasibility of using ARs to
determine housing unit occupancy status and enumerate occupied households. The focus was on
evaluating whether occupancy status and the household roster of the occupied units could be determined
using ARs. The study selected a survey sample of 2,077 addresses in metropolitan Philadelphia and
conducted interviews at the addresses that included collecting household rosters in a manner similar
to census interviews. A comparison between the household rosters collected in the survey and the AR
rosters was used to examine the feasibility of using ARs to determine whether an address was vacant or
occupied and if occupied, enumerate the household using the AR roster. Records from Medicare, IRS
1040 forms, and the third-party Targus Federal Consumer File were used to create the AR household

 7
rosters. The comparison between the occupancy status of the addresses from the survey and the ARs
found that the ARs predicted occupancy status correctly for 83 percent of the addresses. For the occupied
units, the AR roster size was within one person for 66 percent of the addresses. Since the ARs were
collected some time prior to the survey interviews, these results were viewed as a positive indication of
the potential for using ARs for enumeration, but the methodology for predicting occupancy status and
household size using ARs needed more work (Walejko and Miller 2015).

The 2014 Census Test provided the opportunity for additional investigation of the feasibility of using ARs
in census enumeration (U.S. Census Bureau Decennial Census Management Division 2016). A sample of
46,247 housing units was selected from parts of Montgomery County, MD, and the District of Columbia
and partitioned into four treatment panels. The 2014 Census Test had a Census Day of July 1, 2014, and
was the first to examine using ARs to reduce the number of contacts necessary to follow up at units that
did not respond to the initial mailings. The ARs included the two federal sources used in the 2014 Census
Test, IRS, and Medicare, with the addition of records from the Social Security Administration Numident
file and the United States Postal Service Undeliverable-As-Addressed information. The strategy was to
compare administrative record occupied addresses to the results based on the field interviews. For
administrative record occupied addresses, the results showed agreement on occupancy status over
90 percent of the time in two panels, one a control and the other that would remove AR occupied
addresses for AR enumeration. However, the household size agreement was only 54 percent in the
Control Panel, which raised concerns about the quality of ARs for enumeration. Further analysis showed
that the population count agreement was higher for single adults with no children, two adults with
children, and two adults without children household compositions. This finding suggested giving priority
to these household compositions when determining the criteria for the use of administrative records for
enumeration. The study demonstrated the feasibility of the using ARs for determining occupancy status
and constructing household rosters. However, the agreement rate between the AR rosters and the rosters
collected by interviewers was not as high as desired, and agreement did not guarantee both rosters were
correct instead of both being wrong. The recommendation was to continue investigating the use of ARs,
but to explore using predictive models to improve the identification of the addresses with ARs of high
quality for removal from the NRFU workload (U.S Census Bureau Decennial Census Management
Division 2016).

The findings from the 2013 and 2014 census tests and subsequent research were made available to the
public through updates during the 2020 Census Program Management Reviews (PMRs) that were
presented every quarter, many of which included a presentation about the AR research. The PMRs
presented from 2012 through 2019 are available online (U.S. Census Bureau 2019e). In addition, the
progress was reviewed by the National Academy of Sciences Working Group formed in early 2013 to
advise the Census Bureau on the use of administrative records during the preparations for the 2020
Census. The topics considered by the Working Group included privacy, confidentiality, and consent
issues. In addition, the Working Group also reviewed research, made suggestions about methodology to
test, and identified topics for further research (National Academy of Sciences Working Group 2014).

3.2 Identify strategy 2015 - 2016

The next phase of the research had a two-pronged approach aimed at understanding why the agreement
rate between the AR rosters and enumerator-collected rosters was as low as it was and figuring out how to
use predictive models to identify the addresses with high quality ARs that could be used in AR
enumeration. One line of research focused on assessing the quality 2010 NRFU rosters and AR rosters
formed using IRS 1040 forms filed in all months of 2010 and Medicare records for all months of 2010 for
addresses in the sample selected for the 2010 Census Coverage Measurement Program (CCM).

 8
Other research explored the development of statistical models that could be used to assess the quality of
ARs using data collected for addresses in the 2015 and 2016 census tests.

3.2.1 Assessing quality of ARs

Initially, the Census Bureau planned to conduct NRFU and then use ARs to enumerate addresses for
which enumerators did not obtain response. However, Mulry and Keller (2017) were able to assess the
quality of the 2010 Census NRFU roster and the AR roster for a housing unit by comparing both to the
roster collected by the 2010 Census Coverage Measurement (CCM). The data for the 2010 CCM included
2010 Census data as well as data collected in an independent listing of addresses in the CCM sample
blocks and subsequent interviews conducted at all the addresses on the listing. The 2010 CCM used the
collected data in processing that determined whether each person on the 2010 Census rosters and the
CCM sample rosters were enumerated correctly, incorrectly, missed in the other survey, or had an
unresolved status. The CCM results were used to create a “gold standard” roster, justified by its extensive
fieldwork, processing, and clerical matching. Linking the “gold standard” roster for an address to its
corresponding 2010 NRFU and AR rosters provided a determination of whether each of the rosters had
the correct household members.

Using weighted data, the analysis of 2010 NRFU addresses in the CCM sample found that 51 percent of
the addresses with proxy respondents and 61.3 percent of the addresses with household member
respondents could be found in ARs. For people, 56.6 percent of the proxy NRFU enumerations and
88.0 percent of the household member NRFU enumerations were at the correct residence. For the people
on the AR rosters, 49.1 percent of the AR enumerations at addresses enumerated by proxy respondents
and 72.5 percent of enumerations by household member respondents were at the correct address (Mulry
and Keller 2017). The low percentage of correct enumerations on the AR rosters at the addresses
enumerated by proxy respondents led to narrowing the focus of future research. The attention turned to
the identification of the NRFU addresses with high quality ARs that could be used for enumeration when
one contact attempt by a NRFU enumerator did not result in an interview.

3.2.2 2015 Census Test

The 2015 Census Test in Maricopa County, AZ, provided the next opportunity to collect data for
exploring an approach to AR enumeration that incorporated statistical modeling. After the 2014 Census
Test, the AR modeling team primarily focused its research on statistical models for identifying the status
of addresses as Occupied, Vacant, or Nonresidential and Occupied addresses with high quality ARs.
Statistical models have the advantage of being flexible in the number and form of the independent
variables that they can accommodate rather than predefined business rules applied to a smaller number of
independent variables, as was done in 2013 and 2014. The strategy for the research was to explore the
development of statistical models for classifying addresses as Occupied, Vacant, or Nonresidential and
separate statistical models for assessing the quality the AR rosters. In addition, linear programming was
chosen as the method to test as a tool for assessing whether the AR rosters were of high quality. The
method involves an optimization to find the best outcome, which in this case was identifying addresses
with high quality AR rosters. The sources for creating the AR rosters included two used in the previous
tests, IRS 1040s and Medicare, with the addition of two other sources with the goal of improving
coverage. The new sources were IRS Informational Returns, which include 1099 interest and dividend
income reports and W-2 wage statements, and the Indian Health Service Patient Database (IHS). The AR
roster was the unduplicated union of all four of the AR sources. The Census Bureau had started receiving
monthly deliveries of Informational Returns (IRS 1099s and IRS W-2s) for tax year 2014 filings, which
was information being filed in 2015. The modeling used variables that reflected the characteristics of the
rosters that could be determined from the sources themselves, such as the number of people, and added

 9
some variables derived using data from third-party sources for the addresses. In the end, there was a
concern that a weakness of the linear programming approach was that it might produce results that were
globally optimal, but locally suboptimal. Both the global and local quality of the results are important for
the census. Since the linear programming approach used in the 2015 Census Test could not guarantee
both global and local data quality, subsequent tests examined a different modeling approach, which is
discussed in Section 3.2.3.

3.2.3 2016 Census Test

The 2016 Census Test sites were in Los Angeles County, CA, and Harris County, TX. The search for a
new modeling approach began with preliminary studies prior to the 2016 Census Test that examined
using multinomial models where the dependent variable had three levels that represented the address
statuses Occupied, Vacant, and Nonresidential. The multinomial models produced a probability for each
of the three address statuses for each address. Several types of multinomial models were evaluated,
including multinomial logistic regression and random forest. The studies found that none of the
multinomial models were reliably able to distinguish among the three address categories of Occupied,
Vacant, and Nonresidential when compared to field results. That is, assigning the status of the highest
predicted probability without consideration of the other outcomes did not provide a high enough level of
accuracy. Subsequently, the focus of the research on AR enumeration shifted to examining the application
of model-based Euclidean distance programming to aid in identifying addresses with high quality ARs.
The approach focused on using a Euclidean distance function and identifying threshold values that the
highest of the three estimated probabilities had to exceed for the assignment of an Occupied, Vacant, or
Nonresidential status to an address (U.S. Census Bureau Administrative Records Modeling Team 2017).

Comparisons of classifications of addresses based on the AR modeling were compared with field
classifications since the test did not include a control panel. Other analyses investigated whether using
Undeliverable-As-Addressed (UAA) categories, which U.S. Postal Service mail carriers assign to
addresses when their mail cannot be delivered were helpful as independent variables in models for
determining the AR Vacant and AR Nonresidential statuses. The results of the investigations of Euclidean
distance programming and the UAAs were presented to the Census Bureau Scientific Advisory
Committee at their meeting in March of 2017 (U.S. Census Bureau Administrative Records Modeling
Team 2017). The committee agreed that the methods tested in the 2016 Census Test showed promise
(Census Scientific Advisory Committee 2017).

3.2.4. Retrospective study of interplay between distance function and NRFU Contact
Strategy

To further explore the effectiveness of using the Euclidean distance function approach in AR
enumeration, a retrospective evaluation with 2010 Census data explored the data quality the approach was
able to achieve. The strategy was to fit the models on a subsample of the 2010 NRFU universe and apply
the results to the entire NRFU universe. The study used the same models and AR enumeration rules
applied in the 2016 Census Test. The results showed a high rate of AR Vacant assignment in the block
groups where the non-Hispanic Black population was estimated to be 50 percent or more of the
population total (U.S. Census Bureau Administrative Records Modeling Team 2017, Tables 15 and 16).
This result, along with results from the other tests, created a concern about undercoverage of the non-
Hispanic Black population in the census because of occupied addresses being misclassified as vacant. To
reduce the potential for undercoverage of this group and others, the NRFU contact strategy was updated
to include an additional mailing to the AR Vacant units and require that this mailing be marked as UAA
by the U.S. Postal Service before assigning a status of AR Vacant.

 10
3.3 Develop implementation methodology 2017 - 2018

The final stage of research on AR enumeration focused on refining the AR modeling process and
finishing additional research. The intent was for the methodology for AR enumeration used in the final
field test, the 2018 End-to-End Census Test, to be the methodology used in the census since it
incorporated all that had been learned through the decade. The 2018 End-to-End Census Test was
conducted in parts of Providence County, RI (U.S. Census Bureau 2018). The refinements based on the
2016 Census Test results were presented to the Census Scientific Advisory Committee at its September
2020 meeting (Census Scientific Advisory Committee 2020). These refinements are discussed in Sections
3.3.1 through 3.3.5.

3.3.1 Requirement for corroboration of AR household roster

In each of the mid-decade census tests, addresses that were determined to be Occupied via AR were
enumerated with a roster of people from a set of AR sources. Some of these rosters were “sole-sourced,”
meaning that all the people came from a single AR source. A concern about the quality of data found in
only one AR source, even if it was a high-quality source, led to a new requirement. After 2016, an
additional requirement had to be met before an address could receive an AR Occupied status. The new
condition required that at least one person on the AR roster must be corroborated by two or more AR
sources for the address to be assigned an AR Occupied status. A person-address (or person-place)
combination was considered corroborated if that person-address combination could be found in multiple
AR sources. For this purpose, an agency or data supplier was considered a single source. For example,
IRS 1040s and IRS 1099s were treated as a single source since the two files come from the same agency.
Furthermore, there are two sets of AR sources used in the AR enumeration processing. One set of high-
quality sources was used to form the AR rosters, and these sources could provide corroboration of each
other. A second set of sources only could provide corroboration of the AR records selected for AR rosters
from the first set of sources. Uncertainty about the recency of some of the addresses in the second set of
sources led to categorizing them as good quality for corroboration but not of high enough quality for AR
enumeration. The additional sources used for corroboration included third-party sources, previous census
and survey records, and other federal sources such as the Selective Service System (U.S. Census Bureau
Administrative Records Modeling Team 2017, Table 1).

3.3.2 Increasing coverage of children in AR rosters

IRS 1099 information returns that include records such as bank account interest statements and W-2 wage
statements are more likely to apply to adults only. The risk is an AR roster created using only IRS
information returns will miss other people, especially children. The Census Bureau has had its staff use
Social Security Number applications to create and maintain a child-to-parent linking dataset known as the
Household Composition Key File (Deaver 2020, p. 4). First, Protected Identification Keys (PIKs) derived
from Social Security Numbers, are assigned to the children and parents. The record for a child on the
Household Composition Key File includes the names of the mother and father. Errors in the parent PIK
assignment are possible. The Household Composition Key File does not contain address information, but
that can be obtained by linking to other files when needed. The strategy adopted for AR enumeration was
to add the child to the AR roster (if not already present) for each of the housing units in which either the
mother or the father appeared (Konicki 2017). While this approach meant that more children could be
included in the census through AR enumeration, it also meant that parents and children could be found on
AR rosters at multiple addresses. However, the AR roster for the address under consideration would be

 11
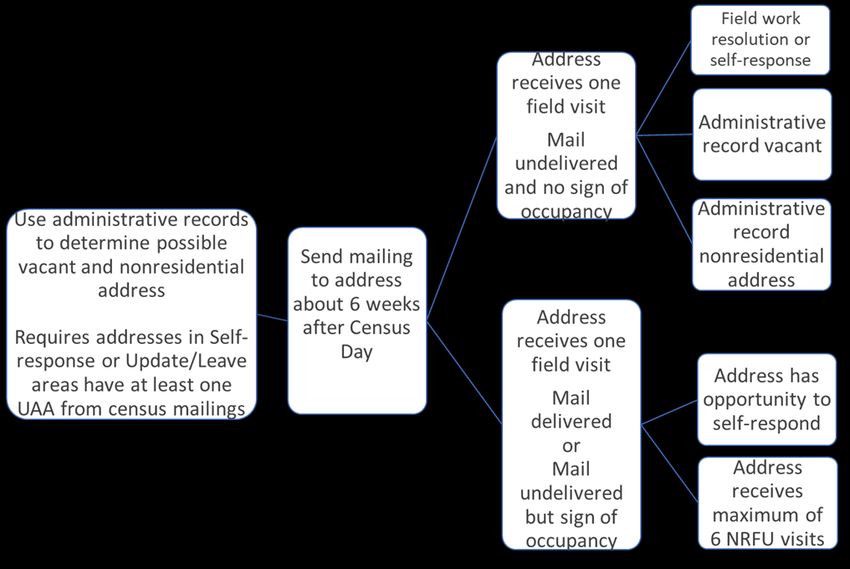
less likely to be used for enumeration because the modeling would assign lower probabilities of accuracy
when children were also a part of another roster.

3.3.3 Methodology to compensate for missing household size and person characteristics

One study examined whether imputation or inserting data obtained by linking to the Census Bureau
internal AR files described in Section 2.3.1 was better for filling in a household size and person
characteristics when either or both were missing on a census enumeration. For any of the characteristics
that could not be assigned directly based on administrative record information, imputation procedures
were used (U.S. Census Bureau Administrative Records Modeling Team 2017). In past censuses, when
enumerations had missing characteristics or household size, imputation was the only option. The results
of the analyses showed that direct assignment of missing characteristics using ARs could be used to
improve the process of accounting for missing data as well as reduce the reliance on imputation. In
practice, when available, ARs first could be used for direct assignment of characteristics. Then,
imputation methods used in the 2010 Census could be applied for remaining missing items to complete
the process of inserting values for missing characteristics (Rothhaas, Lestina, and Hill 2012).

The use of AR data for direct assignment was expected to reduce the reliance on imputation and its
complexity, when needed, even if not all missing values can be found in ARs. For example, when
relationship, age, and sex are missing, initially assigning age and sex from AR could better define the
possible donors for subsequent imputation of relationship. For people for which Hispanic origin is
missing, initially assigning a yes or no status from ARs could better define the possible donors for
detailed Hispanic origin categories. Further research is needed to show whether or how other AR data can
be used to impute for relationship to householder, tenure (where applicable), and detailed vacancy status
(where applicable).

3.4 Refinements to NRFU Contact Strategy 2017

3.4.1. Revision of NRFU Contact Strategy for 2018 End-to-End Census Test

The contact strategy was revised for the 2018 End-to-End Census Test because there was a concern that
the strategy used in the previous tests could result in occupied housing units being misclassified as vacant
or nonresidential and not sent for NRFU fieldwork in error. In 2018, addresses that had been assigned an
initial AR status were sent an additional mailing, and addresses for which there was no initial AR status
were sent for NRFU fieldwork. For addresses with an initial status of AR Occupied, AR Vacant, or AR
Nonresidential, the USPS UAA information from the additional mailing provided information to make a
final determination. For AR Vacant and AR Nonresidential addresses, only those addresses for which the
additional mailing was returned as UAA received their AR status. If the postal carrier could deliver the
additional mailing, then the address was added to the NRFU field workload and received the full contact
strategy of enumerator visits.

3.4.2 Final revisions to 2020 NRFU contact strategy

The analysis of the 2018 End-to-End Census Test led to two revisions for the 2020 NRFU contact
strategy. The 2020 NRFU contact strategy with the changes incorporated is shown in Figure 1.

 12
Figure 1. 2020 NRFU contact strategy for Vacant and Nonresidential Addresses

The 2018 End-to-End Census Test did not include a visit to addresses receiving a status of AR Vacant or
AR Nonresidential prior to NRFU. Analyses of an evaluation sample selected from the 2018 End-to-End
Census Test data showed that 18 percent of the AR Vacant and 30 percent of the AR Nonresidential
addresses were determined to be occupied during fieldwork (U.S. Census Bureau 2019f). These results
raised a concern about the potential for undercoverage and led to a change in the 2020 NRFU contact
strategy. This change was the addition of the requirement to conduct one NRFU field visit for all
addresses determined to be AR Vacant or AR Nonresidential even if the U.S. Postal Service returned a
UAA status for an initial mailing to the address. Figure 1 shows the 2020 NRFU contact strategy and how
the results of the additional mailing and the first field visit led to the determination of whether the address
received additional contacts during the 2020 NRFU operation.

The second change to the 2020 NRFU contract strategy after the 2018 End-to-End Census Test was to
add an additional phase to the data collection in the NRFU operation. Although the NRFU in the 2018
End-to-End Census Test had two phases, a third and final Closeout Phase was added to the 2020 NRFU.
This third phase focused on resolving the status of all unresolved addresses by the end of the NRFU
operation (Keller 2019). Also included was the resolution of the status of addresses that were previously
classified as closed but did not have an assigned status of Occupied, Vacant, or Nonresidential, and if
Occupied, did not have a household size. For more information, see the NRFU Operational Plan (U.S.
Census Bureau 2019b).

3.5 Lessons learned

The research during the decade provided a wealth of lessons learned that provided the basis for
constructing the AR enumeration strategy. These lessons are listed below:

 13
• The approach to NRFU that was most likely to save money and maintain quality identified the
 NRFU addresses with high quality ARs that could be used for enumeration when one contact
 attempt by a NRFU enumerator did not result in an interview.
 • Requiring one NRFU field visit for all addresses assigned an AR Vacant or AR Nonresidential
 status avoided misclassifying occupied addresses as vacant or nonresidential, even when the U.S.
 Postal Service returned a UAA status for an initial mailing.
 • The Euclidean distance measure that combined the estimated probabilities from the person-place
 model and the household composition model to create a single score reflecting the quality of the
 AR roster for an address was effective in identifying addresses with high quality AR rosters
 (described in detail in Section 4).
 • Research identified a set of high-quality AR sources suitable for forming high-quality AR rosters
 for AR enumeration and providing corroboration of each other. A second set of sources only
 could provide corroboration of the AR records selected for AR rosters from the first set of
 sources. Uncertainty about the recency of the information for some of the addresses in the second
 set of sources led to categorizing them as good quality for corroboration but not of high enough
 quality for AR enumeration.
 • To avoid undercoverage of children when building AR rosters, the Census Bureau needed to have
 its staff use Social Security Number applications to create and maintain a child-to-parent linking
 dataset known as the Household Composition Key File. Then children could be added to rosters
 containing a parent’s name.
 • Using direct assignment of missing household size and person characteristics found in Census
 Bureau internal AR files enabled maintaining data quality and reducing the reliance on
 imputation and its complexity, even if not all missing values could be found in ARs and required
 imputation.
 • NRFU needed a third and final Closeout Phase that focused on resolving the status of all
 unresolved addresses by the end of the NRFU operation to assure data quality. Also included was
 the resolution of the status of addresses that were previously classified as closed but did not have
 an assigned status of Occupied, Vacant, or Nonresidential, and if Occupied, did not have a
 household size. The addition of the final Closeout Phase allowed some addresses to receive more
 than six visits.

4. Models used in 2020 Census AR enumeration Process

The identification of addresses that ARs indicated were occupied and had high-quality ARs to build
rosters suitable for AR enumeration was a multistep process that relied on statistical models. This section
contains a brief overview of the modeling process and how two of the models were used together in a
distance measure to produce a score that indicated the quality of the AR roster for an address. Similar
distance measures were used in the assignment of the Vacant and Nonresidential statuses. More details
may be found in (Keller, Mule, Morris, and Konicki 2018).

4.1 AR Vacant and AR Nonresidential identifications

4.1.1 AR Vacant-Nonresidential model

The first step was to fit a multinomial logistic regression model using data from 2010 Census (i.e.,
training data) to aid in identifying addresses that were AR Vacant and AR Nonresidential. The model

 14
produced estimates of the probabilities of an address having each of the three statuses of Occupied,
Vacant, or Nonresidential on Census Day. The probability of Occupied was used in the two distance
measures, one supported the identification of addresses that qualified for the AR Vacant status and the
other supports the identification of addresses that qualified quality for the AR Nonresidential status.
Section 4.1.2 contains a discussion of these two distance measures.

This model, called the Vacant-Nonresidential model, relied heavily on Undeliverable-As-Addressed
(UAA) codes assigned by mail carriers for the U.S. Postal Service when they cannot deliver mail to an
address. Additional independent variables included characteristics of the address and its neighborhood
from other data sources. The model was applied by using the characteristics of the 2020 addresses. The
addresses where the application of the model did not result in the assignment of an AR Vacant or AR
Nonresidential status received the designation “No Determination.” Identifying the addresses with an AR
Vacant or AR Nonresidential status was the first step in the AR modeling process and avoided the
inefficiency of attempting to construct AR rosters that were not going to be used for census enumeration.

4.1.2 Distance measure for AR Vacant and AR Nonresidential Identifications

The assignment of AR Vacant to an address relied on a distance measure that used the Vacant probability,
 ̂ ℎ, , and Occupied probability, ̂ ℎ, , estimated via the Vacant-Nonresidential model discussed in
Section 4.1.1. These predicted probabilities can be thought of as a two-dimensional plane with each
probability on one dimension with values between 0 and 1. Based on the two probabilities, each address
would have a point in this two-dimensional space. The most likely vacant addresses would be those that
have shortest distance to the point where the Occupied probability equals 0 and the Vacant probability
equals 1 (i.e., the (0,1) point). As a result, the definition of the Euclidean Vacant distance,
 ℎ, , for each unit h, is

 2 2
 ℎ, = √(1 − ̂ ℎ, ) + ( ̂ ℎ, )

With regard to the Nonresidential determination, the Vacancy probability is replaced by the
Nonresidential probability from the model in section 4.1. The Euclidean Nonresidential distance
 ℎ, , for each unit h, as

 2 2
 ℎ, = √(1 − ̂ ℎ, ) + ( ̂ ℎ, )

4.2 AR Occupied Identification

4.2.1 Person-place model

The person-place model provided an estimate of the probability that a person i at the hth address was

correctly enumerated at the correct location ̂ℎ where i = 1,…nh is an index for the people on the AR
roster of size nh, and h = 1,… N, is an index of the addresses where N equals the number of addresses
under consideration. The person-place probability ̂ℎ assigned to address h is the minimum value of

the estimated probabilities ̂ℎ over all the nh people on the AR roster for the address. Using the
minimum estimated person-place probability for an address in subsequent calculations aided in assuring
the use of only AR rosters where each person had a high probability of residing at the address on Census
Day.

 15
4.2.2 Household composition model

The household composition model was used to estimate the probability that the address had the same
household composition (number of adults and children) as would have been determined by NRFU
fieldwork. A multinomial logistic model was fit using the housing unit-level data from the 2010 Census
(i.e., the training data) where the dependent variable was defined as follows:

where the occ2 superscript denotes the household composition model for determining occupied units, and
the h subscript indexes the housing unit (Keller, Mule, Morris, Konicki 2018, p. 605)

The multinomial model produced a probability for each household composition type in the variable ℎ 2
for each address as follows:
 p_0 = probability of vacant HH composition
 p_1 = probability of 1 adult, 0 child HH composition
 p_2 = probability of 1 adult,1+ child HH composition
 p_3 = probability of 2 adult, 0 child HH composition
 p_4 = probability of 2 adult,1+ child HH composition
 p_5 = probability of 3 adult, 0 child HH composition
 p_6 = probability of 3 adult,1+ child HH composition
 p_10 = probability of other HH composition.
Each address was assigned the estimated household composition probability ̂ ℎ that corresponded to its
AR household composition. Note that the construction of the dependent variable in the multinomial
model assumed that age was available for all household members in all housing units. This assumption
was satisfied because the modeling used an edited file that includes imputed age for any nonresponse.

4.2.3 Distance measure for AR Occupied status

This distance measure used in assigning an AR Occupied status combined the estimated probabilities
from the person-place model and the household composition model to create a single score that indicated
the quality of the AR roster for an address. The score was a combination of the estimated household
person-place probability ̂
 ℎ
 defined in Section 4.2.1 and the estimated household composition
probability ̂ ℎ defined in Section 4.2.2. These predicted probabilities combined into a single score,
using a distance function. The score for address h was defined using the distance function selected for this
application as follows:

 2 2
 ℎ, = √(1 − ̂
 ℎ
 ) + (1 − ̂
 ℎ
 ) .

 16
The addresses assigned a score ℎ, less than a specified threshold were considered to have a high-
quality AR roster suitable census enumeration. Note that lower scores of ℎ indicated higher values of the
estimated probabilities ̂ℎ and ̂ ℎ and thereby, higher quality of the AR roster. Analyses with the
2010 Census data determined the threshold values.

5. Original AR processing plan

The components of the original processing plan for the 2020 Census AR enumeration are discussed in this
section. The focus of the description is on the original plans for assigning a status of AR Occupied, AR
Vacant, or AR Nonresidential to addresses and to identify addresses with high quality AR rosters suitable
for census enumeration. A summary of the original plan for AR processing may be found in Table A1 in
the Appendix. The models planned for the original AR processing are very similar to the models
implemented in the final 2020 AR processing plan described in Section 7.

5.1 Early May (Phase 1)

The original plan for AR modeling in May (Phase 1) called for incorporating the application of initial
quality thresholds and a three-level multinomial model for a decision to identify a unit as AR Occupied,
AR Vacant, or AR Nonresidential before the start of NRFU fieldwork (U.S. Census Bureau 2018, p. 138).
The model produced estimated probabilities of the three address statuses for each address using AR data
for the address level from deliveries of IRS data from March, April and May and other data sources that
included the UAA information from the USPS from a census mailing. Each month’s IRS delivery would
include relevant information from IRS 1040s and IRS 1099s that had been received in previous months.
In normal years, the large majority of submitted IRS tax forms would have been submitted by April 15
and therefore, delivered to the Census Bureau by May. In the original plan, each address eligible for
NRFU received an AR status in the May (Phase 1) processing. Addresses that could not be assigned an
AR status by the Phase 1 processing received the designation ‘No Determination.’

5.2 Early June (Phase 2)

During NRFU production, the original plans included AR modeling in June (Phase 2) that processed
additional AR data received after Phase 1 after combining it with the data used in Phase 1. Using the same
distance thresholds as in Phase 1, Phase 2 focused on identifying additional AR Occupied addresses. June
AR modeling also identified a new set of AR closeout statuses—AR Closeout Occupied, AR Closeout
Vacant, and AR Closeout Nonresidential—by lowering the initial quality thresholds used in Phase 1.
Research with 2010 Census data indicated that the lower quality thresholds were acceptable for assigning
an AR status when six visits by NRFU did not obtain an interview. The addresses assigned an AR
closeout status would continue to be visited a maximum of six times during NRFU. However, when the
NRFU operation entered its Closeout Phase, these addresses would be assigned their AR Closeout status
and would not be reopened for additional contact attempts.

5.3 Early August (Phase 3)

For the 2020 Census, the plan was to not identify any more AR Occupied, AR Vacant, or AR
Nonresidential addresses in the Post-Data Collection (Phase 3) processing through lowering the threshold
values. That is, the final AR status assignments (AR Occupied, AR Vacant, AR Nonresidential, AR
Closeout Occupied, AR Closeout Vacant, or AR Closeout Nonresidential) in Phase 3 used the same

 17
You can also read