Recognition and Repetition Counting for LME exercises in Exercise-based CVD Rehabilitation: A Comparative Study using Artificial Intelligence ...
←
→
Page content transcription
If your browser does not render page correctly, please read the page content below
Preprints (www.preprints.org) | NOT PEER-REVIEWED | Posted: 26 July 2020                   doi:10.20944/preprints202007.0634.v1

                           Peer-reviewed version available at Sensors 2020, 20, 4791; doi:10.3390/s20174791

              Article
              Recognition and Repetition Counting for LME
              exercises in Exercise-based CVD Rehabilitation: A
              Comparative Study using Artificial Intelligence
              Models
              Ghanashyama Prabhu ∗,1,2,4       , Noel E. O’Connor 1,2    , and Kieran Moran 1,3
                1   Insight Centre for Data Analytics, Dublin City University, Dublin, Ireland;
                    ghanashyama.prabhu2@mail.dcu.ie (G.P.); noel.oconnor@dcu.ie (N.C.); kieran.moran@dcu.ie (K.M.)
                2   School of Electronic Engineering, Dublin City University, Dublin, Ireland
                3   School of Health and Human Performance, Dublin City University, Dublin, Ireland
                4   Manipal Academy of Higher Education, Manipal, India; gs.prabhu@manipal.edu
               *    Correspondence: ghanashyama.prabhu2@mail.dcu.ie

               Abstract: Exercise-based cardiac rehabilitation requires patients to perform a set of certain prescribed
               exercises a specific number of times. Local muscular endurance (LME) exercises are an important part
               of the rehabilitation program. Automatic exercise recognition and repetition counting, from wearable
               sensor data is an important technology to enable patients to perform exercises independently in
               remote settings, e.g. their own home. In this paper we first report on a comparison of traditional
               approaches to exercise recognition and repetition counting, corresponding to supervised machine
               learning and peak detection from inertial sensing signals respectively, with more recent machine
               learning approaches, specifically Convolutional Neural Networks (CNNs). We investigated two
               different types of CNN: one using the AlexNet architecture, the other using time-series array. We
               found that the performance of CNN based approaches were better than the traditional approaches.
               For exercise recognition task, we found that the AlexNet based single CNN model outperformed
               other methods with an overall 97.18% F1-score measure. For exercise repetition counting , again the
               AlexNet architecture based single CNN model outperformed other methods by correctly counting
               repetitions in 90% of the performed exercise sets within an error of ±1. To the best of our knowledge,
               our approach of using a single CNN method for both recognition and repetition counting is novel. In
               addition to reporting our findings, we also make the dataset we created, the INSIGHT-LME dataset,
               publicly available to encourage further research.

                Keywords: CVD rehabilitation; Local muscular endurance exercises; Exercise-based rehabilitation;
                Deep Learning; AlexNet; CNN, SVM, kNN, RF, MLP, PCA, multi-class classification, INSIGHT-LME
                dataset

              1. Introduction
                   Cardiovascular disease (CVD) is the leading cause of premature death and disability in Europe
              and worldwide [1]. Exercise-based cardiac rehabilitation is a secondary prevention program which
              has been shown to be effective in lowering the recurrence rate of CVD and reducing the need for
              medicines [2,3]. Cardiac rehabilitation is organised in three phases, with the third phase targeting
              long-term exercise maintenance by attending community-based rehabilitation programs or through
              home-based exercise self-monitoring programs. However, a significant challenge is that the uptake
              and adherence of community-based cardiac rehabilitation is very low, whereby only 14% to 43%

            © 2020 by the author(s). Distributed under a Creative Commons CC BY license.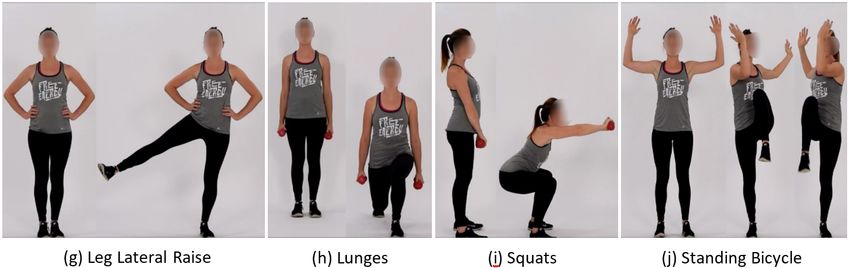
Preprints (www.preprints.org) | NOT PEER-REVIEWED | Posted: 26 July 2020                  doi:10.20944/preprints202007.0634.v1

                           Peer-reviewed version available at Sensors 2020, 20, 4791; doi:10.3390/s20174791

                                                                                                                   2 of 33

              of cardiac patients participate in rehabilitation programs [4,5]. Key reasons for this include lack
              of disease-specific rehabilitation programmes, long travel time to such programmes, scheduling
              issues, and low self-efficacy associated with a perception of the poor ‘body image’ or poor exercise
              technique [6]. Part of the solution is delivering an alternative, such as a technological platform that can
              motivate the user to engage with exercise-based cardiac rehabilitation and enable them to do so in
              any environment. In an ideal scenario,people would undertake a variety of exercise programs, either
              specifically prescribed or based on personal preference, that suits their goals and that allows them
              avoid exercise associated with comorbidities, for example arthritis of the shoulder. In this scenario
              of “exercising anywhere”, where people may be exercising in their own homes on their own, it is
              extremely important that they receive feedback on the exercises in order to help them track their
              progress and stay motivated. A technological approach may facilitate this by integrating a single
              wearable sensor for assessing exercise movement into an appropriate smartphone application (i.e.
              eHealth and eRehabilitation). However, two key challenges are presented with this approach. Firstly,
              it is important to be able to automatically recognize which exercises are being completed and secondly,
              once recognised to provide the number of repetitions as quantitative feedback on the amount of
              exercises performed to build the user’s confidence. This would also allow people to complete elements
              of their own training program disbursed over the day in any environment. For example, someone
              could complete different exercises in home or in the workplace [7,8].
                     In recent years, wearable sensors have been used in the assessment of human movement in
              many domains including health [9], wellness [10], musculoskeletal injury and sport [11]. Research on
              CVD patients found that most (67% ~ 68%) patients showed interest in mobile phone-based CR [5].
              Accelerometer and Gyroscopes along with magnetometer in wearables are accurate in measuring
              translatory and rotary movements are frequently found in wearable sensor units. Multiple wearable
              sensors have been deployed on the body to recognize the day-to-day activities like walking, jogging,
              climbing stairs, sitting, standing [12–15], exercise feedback [16] and in qualitative evaluation of
              human movements [17], gym activities [18], and rehabilitation [19]. However, keeping in mind the
              likelihood of technology adoption combined with the aesthetics of wearing multiple sensors, it is more
              likely that individuals would be willing to wear a single sensor with the wrist being the ideal worn
              location.Single wearable sensor usage studies, either phone-based or using inertial measure units,
              have been conducted in recent years. Applications include recognising day-to-day activities [20–25],
              recognition of multiple complex exercises [26] or single exercises like lunges [16], squats [27] as well as
              repetition counting [8,26,28]. Detailed related work is discussed in the next section 2: Related Work.
                     In this work, we focus on exercise recognition and repetition counting using a single wrist-worn
              inertial sensor for 10 local muscular endurance (LME) exercises that are specifically prescribed in
              exercise-based CVD rehabilitation. We present a comparative analysis between different traditional
              supervised machine learning algorithms and the current state of the art methods in deep learning
              architectures. As the novelty of this work, we claim following novel contributions. Firstly, we propose
              the use of a single CNN model for the repetition counting task of different exercises. Secondly, the
              dataset we created, the INSIGHT-LME dataset, is made publicly available to encourage further research
              on this topic (https://drive.google.com/open?id=124ugOPzzoXFTmSJv9K37NC18Lz1FnFPO).

              2. Related Work
                    Machine learning and deep learning are artificial intelligence methods that employ statistical
              techniques to learn underlying hidden distributions from observed data. Technology advances in
              sensor manufacturing and micro-miniaturization has resulted in low-cost micro-sensor devices like
              wearables, that are capable of effective lossless streaming and/or storing translatory and rotary
              movement information for further processing. The application of machine learning methods to study
              data from human movements and activities with a view to detecting and understanding these activities
              is referred to as human activity recognition (HAR).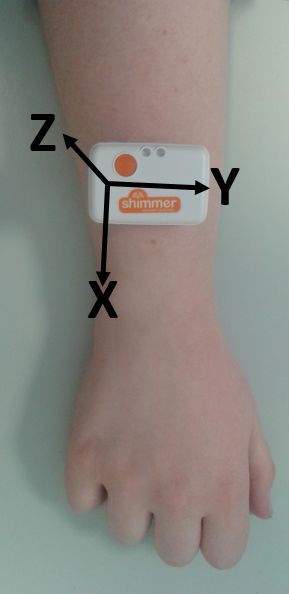
Preprints (www.preprints.org) | NOT PEER-REVIEWED | Posted: 26 July 2020                  doi:10.20944/preprints202007.0634.v1

                            Peer-reviewed version available at Sensors 2020, 20, 4791; doi:10.3390/s20174791

                                                                                                                 3 of 33

                   Within the HAR literature, many machine learning and deep learning-based models have been
              used to study day-to-day routine activities like walking, jogging, running, sitting, drinking, watching
              TV, etc., [9,13,14,29–32] and to assess sporting movements [11] and indoor based exercises for strength
              training [33]. Machine learning methods have been predominantly used for exercise recognition
              using multiple wearable sensors [17,18,34,35], and specifically in the areas of free weight exercise
              monitoring [36], the performance of lunge evaluation [16], limb movement rehabilitation [19], and
              intensity recognition in strength training [37]. However, the use of multiple sensors is non-ideal in
              practice because of cost, negative aesthetics and potential user uptake [31]. Therefore, in our research,
              we would like to use only a single wrist-worn inertial sensor for exercise recognition and repetition
              counting.
                   Several studies [13,14,20,21,28,31] use a single wrist-worn wearable or phone-based sensor for
              recognition of various day-to-day activities with machine learning models. However, very few studies
              have been completed in recognizing exercises, and even then only with a limited number of exercises:
              lunges evaluation [16], correct squat measurement [8,16,38]; single best axis for exercise repetition
              counting [28]. A very recent article on recognition and repetition counting for complex exercises
              uses deep learning [26] which recognizes a set of CrossFit exercises using a single CNN for exercise
              recognition, but multiple CNN models for individual the repetition counting. However, no other
              studies appear to have studied a wide number of exercises, and none specifically for CVD rehabilitation
              through LME exercises.
                   To date, the vast majority of HAR studies detailed above have used traditional machine learning
              approaches such as decision trees, Naive Bayes, random forest, perceptron neural networks, k-nearest
              neighborhood, and support vector machines. There is, however, a growing interest in the potential
              use of deep learning methods in the field of activity recognition mainly using CNN [26,39–42], and
              recurrent models [40,43]. A small number of studies [39,40,42,44] have shown the significant advantage
              of using deep learning models in the general area of human activity recognition. However, very few
              studies appear to have used deep learning models in exercise recognition and repetition counting.
              In addition, to date no studies have done a comparative study of using traditional machine learning
              methods and state of the art CNN methods to identify the best possible method for exercise recognition
              and repetition counting. Furthermore, to the best of our knowledge, there are no works reported
              using single deep a CNN model for exercise recognition and repetition counting following recognition.
              The use of a single model for repetition counting is attractive as it eliminates the need for an exercise
              specific repetition counter and reduces the dependency on the total number of resources required in
              repetition computation.

              3. Data Set
                   Currently, there exists no publicly available data sets with a single wrist-worn sensor for
              endurance-based exercises that are commonly prescribed in cardiovascular disease rehabilitation
              (CVD) programs. Therefore, we collected a new data set of local muscular endurance exercises for
              this purposes Table 1. In the data collection process, consenting participants performed the ten LME
              exercises in two sets (constrained set and unconstrained set) and some common movements which
              were observed by any exerciser in between two exercises.The constrained set of exercises involves
              participants performing the exercises while observing demonstrative videos and following the limb
              movement actions relatively synchronous with the demonstrator in the video. The unconstrained
              set of exercises involved participants performing the set of LME exercises without the assistance of
              demonstrative videos. Inclusion of the non-exercise movements were essential that the built models
              can distinguish the actions corresponding to the exercises movements from that of non-exercise
              movements. The data set was then used for training, validating and testing different machine learning
              and deep neural network models.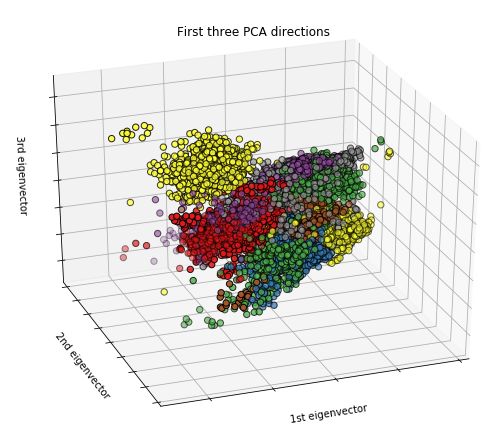
Preprints (www.preprints.org) | NOT PEER-REVIEWED | Posted: 26 July 2020 doi:10.20944/preprints202007.0634.v1
Peer-reviewed version available at Sensors 2020, 20, 4791; doi:10.3390/s20174791
4 of 33
Table 1. List of LME exercises with the acronym
Exercise Type Exercise Acronym Dumbbell Use
Bicep Curls BC A pair
Frontal Raise (arms up) FR A pair
Upper-Body Lateral Raise (arms up) LR A pair
LME exercises Triceps Extension (right arm) TER Single
Pec Dec PD Single
Trunk Twist TT Single
Standing Bicycle Crunches SBC — No —
Lower-Body Squats SQ Single
LME exercises Leg Lateral Raise (right leg) LLR — No —
Lunges (alternate sides) L A pair
3.1. Sensor Calibration
Sensor calibration is a method of improving the sensor unit’s performance to get a very precise and
accurate measurement. The Shimmer3 (Figure 1(a)) inertial measurement unit (IMU) is a light-weight
wearable sensor unit from Shimmer-Sensing1 . Each IMU comprises of a 3 MHz MSP430 CPU, two 3D
accelerometers, a 3D magnetometer and a 3D gyroscope. A calibrated Shimmer3 IMU, when firmly
attached on the limb, is capable of collecting precise and accurate data. Each Shimmer3 has a microSD
to store the data locally or can stream the data over Bluetooth.
Shimmer3 inertial measurement units were used in the exercise data collection process and they
were calibrated using Shimmer’s 9DoF calibration application2 . The IMUs were used with a sampling
frequency of 512 Hz along with a calibration range of ±16g for the 3D low noise accelerometer and
a ±2000dps for the 3D gyroscope. An elastic wristband was used to firmly place the Shimmer3
IMU on the right-wrist of each participant during the data collection process. The sensor orientation
and pictorial representation of the unit attachment on the right-wrist are shown in Figure 1(a) and
Figure 1(b) respectively.
(a) Shimmer3 IMU (b)Sensor placement on the Wrist and its Orientation
Figure 1. Illustration of (a) Shimmer3 IMU, (b) Sensor placement and sensor orientation on the
right-wrist.
3.2. LME Exercise set and Experimental Protocol
Ten local muscular endurance (LME) exercises, as listed in Table 1, prescribed in cardiovascular
disease rehabilitation were selected for data collection. The ten exercises comprise of six upper-body
exercises: bicep curls (BC), frontal raise (FR), lateral raise (LR), triceps extension-right arm (TER), pec
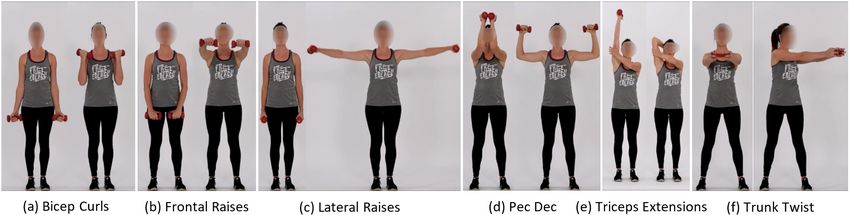
dec (PD), and trunk twist (TT); along with four lower-body exercises: squats (SQ), lunges - alternating
sides (L), leg lateral raise (LLR), and standing bicycle crunches (SBC). The representative postures for
1 http://www.shimmersensing.com/products/shimmer3
2 https://www.shimmersensing.com/products/shimmer-9dof-calibration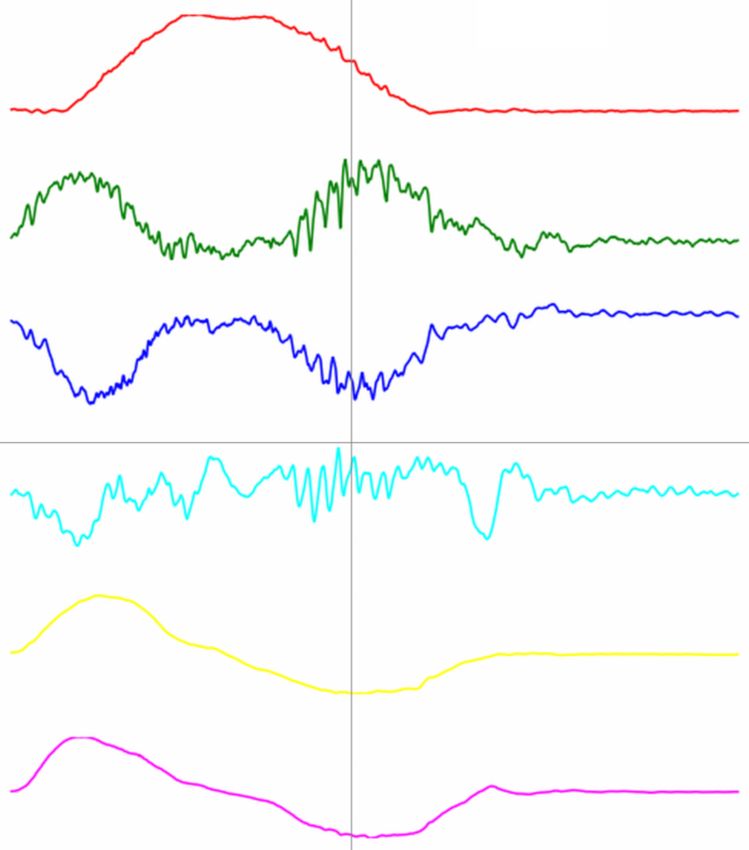
Preprints (www.preprints.org) | NOT PEER-REVIEWED | Posted: 26 July 2020                  doi:10.20944/preprints202007.0634.v1

                           Peer-reviewed version available at Sensors 2020, 20, 4791; doi:10.3390/s20174791

                                                                                                                  5 of 33

              the execution of six upper-body LME exercises are shown in Figure 2 and that of four lower-body LME
              exercises are shown in Figure 3.

                                                 Figure 2. Upper-body LME exercises

                                                 Figure 3. Lower-body LME exercises

                    A pair of 1 kg dumbbells were used by each participant while performing BC, FR, LR, and PD
              exercises. A single dumbbell of 1kg were used during TER, TT, L, and SQ. Exercises LLR and SBC
              were performed without dumbbells. The data from these exercises correspond to ten different classes
              of exercise. The ten exercises that were used in CVD rehabilitation were either employed a single
              joint movement effect (BC, FR, LR, PD, TER, and LLR) or employed multiple joint movements (TT,
              L, SQ, and SBC). Some of these exercises have significantly similar arm movements and hence it was
              considered of interest to investigate how the models were able to distinguish between these exercises.
              It was also of interest to see how robust the models were in terms of their capacity to distinguish
              between the exercise actions in comparison to limb movements that were commonly observed between
              the exercises. The common limb movements selected for inclusion were side bending, sit-to-stand and
              sand-to-sit, lean down to lift water bottle or dumbbell kept on the floor, arm-stretching front-straight,
              lifting folded arm up-word, and body stretching up-word with calf raising for relaxation. These
              observed common actions have significant similarity in terms of limb movement with that of the
              exercises. The data corresponding to these common actions together describe an eleventh class of
              movement.

              3.3. Participants
                   A total of seventy-six volunteers (47 males, 29 females, age group range: 20 - 54 yrs, median age: 27
              years) participated in the data collection process. No participants had any musculoskeletal injury in the
              recent past which would affect the exercise performance and all were healthy. Having prior knowledge
              of exercise was not a criterion in volunteer recruitment. The study protocols used in data collection
              were approved by the university research ethics committee [REC Reference: DCUREC/2018/101].

              3.4. Data Capture Process
                   The exercise protocol was explained to the participants on their arrival to the laboratory. Each
              participant underwent a few minutes of warm-up with arm-stretching, leg-stretching and basic
              body-bending exercises. We developed an exclusive MATLAB-GUI module [Figure 4a] to collect the
              data from the participants wearing IMUs via Bluetooth streaming. The “Exercise Data Capture Assist
              Module” was designed to select a particular exercise, to play demo videos to illustrate how to perform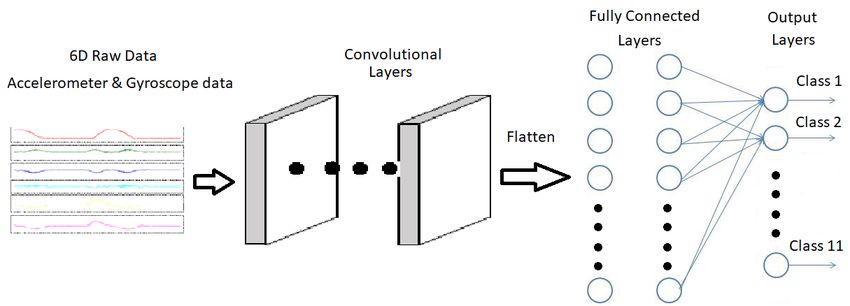
Preprints (www.preprints.org) | NOT PEER-REVIEWED | Posted: 26 July 2020                 doi:10.20944/preprints202007.0634.v1

                          Peer-reviewed version available at Sensors 2020, 20, 4791; doi:10.3390/s20174791

                                                                                                                  6 of 33

              the exercise, to initialize and disconnect Shimmer IMUs remotely, to start recording exercise data, to
              stop recording exercise data and a storage path location to store the streamed data. The streamed
              data were stored automatically with participant_ID and the exercise type in the filename, completely
              anonymizing the details of the participants. The Shimmer-MATLAB Instrument driver interface was
              used to connect and collect data from multiple shimmer units, therefore the designed module was
              capable of recording from multiple participants at any given time.

                                                                                        (b)

                                       (a)                                               (c)

                   Figure 4. MATLAB GUI for exercise data capture process. (a) Interactive MATH Lab GUI (b) Bicep
                   Curls Data Streaming (c) Pec-Dec Data Streaming

                   All consenting participants performed the ten exercises in two sets and the common movements
              as described in section 3.2. During the constrained set of exercising, the participants performed the
              LME exercises while observing demonstrative videos on the screen and following the limb movement
              actions relatively synchronous with the demonstrator in the video. Participants were told to pay
              particular attention to the following: the initial limb resting position, how to grip the dumbbells (in
              case the exercise requires the use of dumbbells), the limb movement plane and the speed of limb
              movement during demo video. The constrained setup facilitated minimal variations in the collected
              data in terms of planar variations and speed and thus ensuring participants perform exercises at a
              similar tempo of movement. The participants were asked to perform each exercise for 30 seconds which
              resulted in approximately 7 to 8 repetitions. After each exercise, participants were given sufficient time
              to rest before moving on to the next exercise.
                   During the unconstrained set of exercising, a timer was used and displayed on the screen.
              Participants performed the exercises by recalling what they had learned during the constrained
              performance and were free to execute them for 30 seconds. The data collected during the unconstrained
              set corresponds to a variable range of variations from that of exercise data collected from the
              constrained set of execution. The variations observed were in terms of the plane of limb movement,
              speed, and the rest position of the limb; these variations were used to mimic macro variations that
              would typically during home-based exercising.
                   In addition to the constrained set and the unconstrained set of data collection, participants were
              instructed to perform the common movements as stated in section 3.2. Inclusion of these non-exercise
              movements were essential that the built models can distinguish the actions corresponding to the
              exercises movements from that of non-exercise movements. Participants were asked to perform each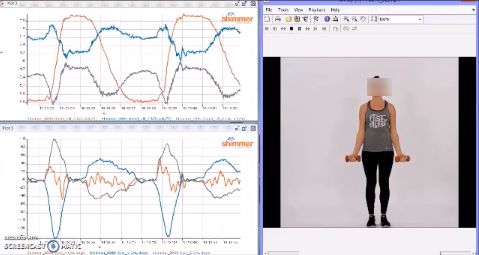
Preprints (www.preprints.org) | NOT PEER-REVIEWED | Posted: 26 July 2020                   doi:10.20944/preprints202007.0634.v1

                           Peer-reviewed version available at Sensors 2020, 20, 4791; doi:10.3390/s20174791

                                                                                                                   7 of 33

              of these actions repeatedly for about 30 seconds. The 5 second instances from each of these actions
              represents almost one full action and collectively constitutes the eleventh class.
                   All IMUs used in the process of data capture were calibrated as stated in section 3.1. The IMU was
              securely placed on the right-wrist, as shown in Figure 1(b), with the help of an elastic band and demo
              videos of all the exercises were shown to each participant. Data collected from both the constrained set
              and the unconstrained set were class labelled and stored in ten different exercise folders. An eleventh
              class labelled as “others” was created to store the data from all of the common movements.
                   Among 76 participants, 75 people participated both in the constrained set and unconstrained
              set of data collection. However, one participant performed only the constrained set. Only a few
              participants had not performed all the exercises. However, overall the collected data set was well
              balanced and Table 2 indicates the participation summary for each exercise under the constrained set
              and the unconstrained set of data capture. The data set was then segregated and stored into three
              different sets: the training set, the validation set and the test set, and were used in all model building.
              The data from 46 participants were used in the training set and the data from 15 participants were used
              in both the validation set and the test set. The entire data set is termed the INSIGHT-LME dataset.

                                       Table 2. Data capture participation summary, exercise-wise
                                                    Exercise          Number of Participants
                                   Exercise Type
                                                    Acronym
                                                                Constrained Set   Unconstrained Set
                                                       BC              76                 75
                                                       FR              76                 75
                                    Upper-Body         LR              76                 74
                                   LME exercises      TER              76                 75
                                                       PD              75                 74
                                                       TT              76                 75
                                                      SBC              75                 74
                                    Lower-Body         SQ              73                 73
                                   LME exercises      LLR              75                 74
                                                        L              73                 75
                                      Others          OTH              76                 75

              4. Methodology: Overall Framework
                   Figure 5 represents an overall framework with three major processing blocks. The comparative
              study aims to find the best possible method from the different AI models for each task in automatic
              exercise recognition and repetition counting. The first block represents the INSIGHT-LME data set
              processing and data preparation in terms of filtering, segmentation, 6D vector generations and/or
              2D image creation. Data preparation requirements were different for each specific method used in
              both comparative studies and hence data processing specifics pertaining to individual method are
              discussed along with each model below.
                   The second block represents the comparative study for the exercise recognition task. The exercise
              recognition task was treated as a multi-class classification task. We compared traditional approaches
              in the exercise recognition, which were supervised machine learning approaches, with two recent deep
              CNN based approaches. The first deep CNN model used the AlexNet architecture and the second
              deep CNN model was developed from scratch to use the time-series array information. In supervised
              machine learning (ML) models, different models were constructed using the four supervised algorithms
              such as SVM, RF, kNN and MLP. The eight models from these four ML algorithms were studied with
              and without the dimensionality reduction measures using principal component analysis (PCA). The
              best model from the supervised ML set was then compared with two deep CNN models to find the
              best possible method for the exercise recognition task.
                   The third block represents the comparative study for the repetition counting task. The repetition
              counting task was treated as a binary classification task followed by a counter to count the repetitions.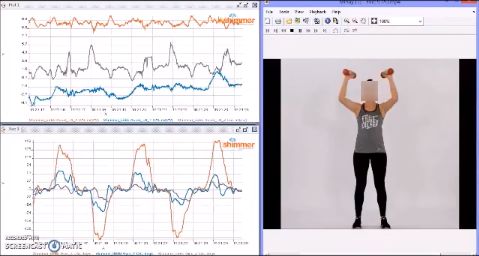
Preprints (www.preprints.org) | NOT PEER-REVIEWED | Posted: 26 July 2020                 doi:10.20944/preprints202007.0634.v1

                          Peer-reviewed version available at Sensors 2020, 20, 4791; doi:10.3390/s20174791

                                                                                                                8 of 33

                   Figure 5. Framework for the comparative study of models. Task 1: Exercise recognition, Task 2:
                   Repetition counting

              Again three different methods were used in repetition counting and the performances were compared to
              find the single best method for repetition counting. We compared traditional signal processing models
              based on peak detection with two deep CNN approaches. Deep CNN models were similar to the
              exercise recognition task, the first deep CNN model used the same AlexNet architecture as previously,
              whilst the second deep CNN model was developed from scratch to work with the time-series array
              information.

              4.1. Exercise Recognition with Supervised Machine Learning Models
                   Figure 6 illustrates the end-to-end pipeline framework adopted for supervised machine learning
              model-based (ML) exercise recognition. As discussed in section 4, a total of eight supervised machine
              learning models were studied using this framework to classify the eleven activity classes, in which,
              ten classes were corresponding to the ten LME exercises and the eleventh class “others” for the
              common movements observed during exercising. The eight supervised machine learning models
              were constructed using four algorithms, support vector machine (SVM), random forest (RF), k-nearest
              neighbors (kNN), and multi-layer perceptron (MLP), either with or without dimensionality reduction
              using principal component analysis (PCA).

                               Figure 6. End-to-end pipeline framework for the machine learning models

              4.1.1. Data Segmentation
                   Raw data from the INSIGHT-LME dataset (section 3.4), corresponding to ten LME exercises
              prescribed for CVD rehabilitation and the common movements, were subjected to data segmentation.
              25 seconds of 3D accelerometer and 3D gyroscope data of each exercise, excluding an initial few seconds
              of recording, were segmented from each participant retaining class-label information. The process of
              segmentation was carried out on all the three sets: training set, validation set and test set from the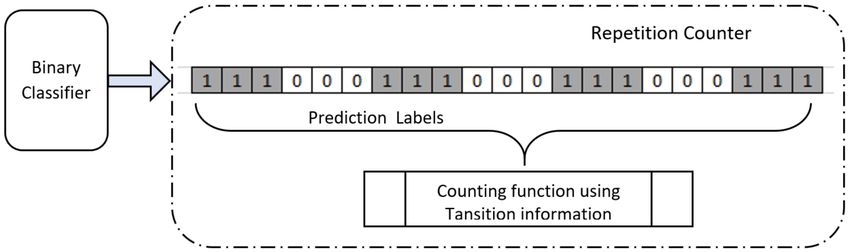
Preprints (www.preprints.org) | NOT PEER-REVIEWED | Posted: 26 July 2020                  doi:10.20944/preprints202007.0634.v1

                          Peer-reviewed version available at Sensors 2020, 20, 4791; doi:10.3390/s20174791

                                                                                                                   9 of 33

              INSIGHT-LME dataset. The segmented 3D accelerometer and 3D gyroscope signal corresponding to
              the bicep curl exercise are shown in Figure 7. 3D sensor plots for all ten LME exercises are given in
              Appendix.A. The 25seconds of 6D segmented data consists of approximately five or six repetitions of
              an exercise with each repetition duration lasting approximately 4 seconds. The segmented data with
              retained class-label information was used in feature extraction in the next stage.

                                          (a)                                               (b)

                   Figure 7. 25 seconds segmented plots of Bicep Curls exercise (a) 3D Accelerometer signals, (b) 3D
                   Gyroscope signals

              4.1.2. Feature Extraction
                    Time and frequency features were extracted from the 6D segmented data using an overlapping
              sliding window method. Three sliding window-lengths of 1 second, 2 seconds, and 4 seconds were
              used along with an overlap of 50% in all cases to find an optimum window length selection in the
              classifier design. The maximum window-length selection was restricted to 4 seconds because the
              length of one complete repetition of an exercise was approx. 4 seconds.
                    From each sliding window, statistical time-domain features, such as, mean, standard deviation,
              root mean square value, minimum and maximum values were computed from each axis of 3D
              accelerometer and 3D gyroscope data. Auto-correlation values were computed from the pairs of XY,
              XZ and YZ axes of both accelerometer and gyroscope sensor data. Frequency-domain features, such
              as, Fourier coefficients and energy were computed from each axis of the 3D accelerometer and 3D
              gyroscope data.
                    A vector of 48 features, 24 time-frequency features were thus computed for each sliding window
              and repeated for every slide. Class label information was retained for the feature vectors corresponding
              to each exercise class and the “others” class. A combined feature set, referred to as “training feature
              set”, was formed by combining feature vectors from all the exercise classes and the “others” class from
              the training set. The training feature set is computed for each sliding windows of the 1 sec, 2 sec, and 4
              sec window-length on the training set of the INSIGHT-LME data set. Similarly, the “validation feature
              set” and the “test feature set”, are computed on each of the sliding windows of 1 sec, 2 sec, and 4 sec
              input data from the validation set and the test set of the INSIGHT-LME data set, respectively.
                    Feature sets computed over each sliding window length were then used for training, validation
              and testing of the four supervised machine learning models using ML algorithms (SVM, RF, kNN, and
              MLP) forming a total of 12 classifiers.

              4.1.3. Feature Reduction using PCA
                   To study the effect of dimensionality reduction, principal component analysis (PCA) was used
              on the feature sets computed from section 4.1.2 to reduce the overall feature dimensionality of the
              input vectors to the ML models. Significant principal components, which were having an accumulated
              variance greater than 99%, were retained. New feature sets corresponding to the training feature set,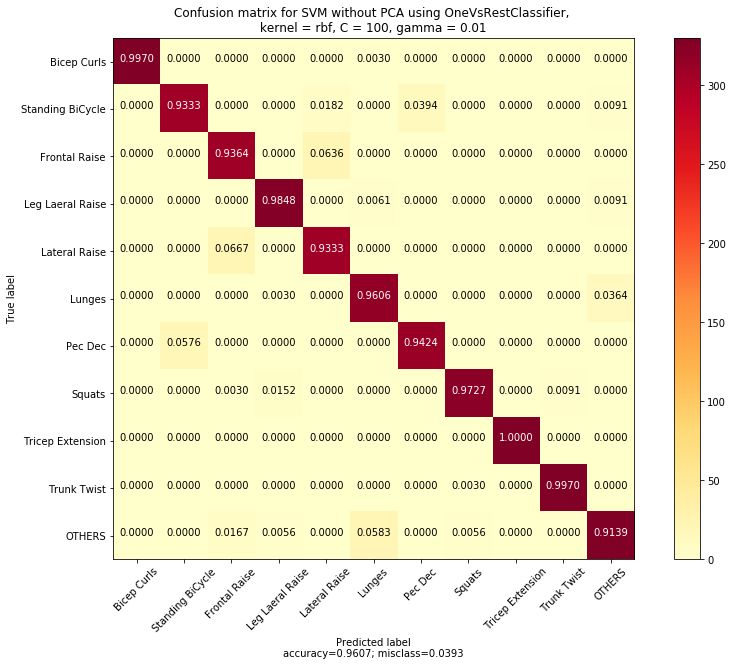
Preprints (www.preprints.org) | NOT PEER-REVIEWED | Posted: 26 July 2020                      doi:10.20944/preprints202007.0634.v1

                           Peer-reviewed version available at Sensors 2020, 20, 4791; doi:10.3390/s20174791

                                                                                                                       10 of 33

              validation feature set and test feature set were computed using PCA for each of the 1sec, 2sec, and 4sec
              window-length cases. New feature sets with dimensionality reduction using PCA were then used in
              the training, validation and testing of additional machine learning models using ML algorithms (SVM,
              RF, kNN, and MLP) for each window-length case, forming an additional 12 classifiers.

                  (a) First three significant components plot                  (b) Accumulated variances plot

                   Figure 8. PCA plots for the training feature set for a 4second sliding window (a) 3D plot of the first
                   three significant components, (b) Accumulated variances plot

              4.1.4. Classifiers for Exercise Recognition
                    Exercise recognition from the single wrist-worn inertial sensor data for a set of exercises prescribed
              for cardio-vascular disease rehabilitation is a classic classification task using machine learning or deep
              learning methods. A total of twenty-four classifiers were constructed from the feature vectors as
              explained in section 4.1.2 and 4.1.3 and were analysed for exercise recognition. Each classifier
              model was constructed using the training set feature vectors, with 10 fold cross-validation using the
              grid-search method to ensure the models to have optimum hyper-parameters (for SVM models, kernel
              options between rbf and linear, and model parameters C and gamma values; for kNN models to find
              the best k-value or number of nearest neighbors; for RF models the number n_estimator or the number
              of trees to be used in the forest; for MLP the step value α).
                    All models were first evaluated using the validation set feature vectors to evaluate the following:
              firstly, the optimum sliding window-length among all possible selected windowing methods was
              determined based on the validation accuracy measure. Secondly, to see the effect of dimensionality
              reduction on ML model performance. Finally, to select the single best-supervised ML model to
              recognize the exercises.

              4.1.5. Experimental Results of Exercise Recognition with Supervised Machine Learning Models
                    A total of twenty-four classifiers were constructed using three sliding windowing methods with
              four supervised machine learning algorithms with and without dimensionality reduction using PCA.
              Among these models, SVM models were constructed using One-Vs-Rest multi-class classifier, and were
              designed have optimum hyper-parameters using a grid search method with 10-fold cross-validation.
              The values, C = 100, gamma = 0.01 and rbf kernel were found to be the optimum hyper-parameters for
              all the 6-SVM classifiers. For all the 6 kNN models, k = 1 found to be the optimum value and for all the
              6 RF models, n_estimator = 10 found to be the optimum value. Similarly, for all the 6 MLP classifiers
              the step value, α = 1, was optimum over a range of 1.0E-5 to 1E+3 on a logarithmic scale.
                    Selection of suitable sliding window-length was done based on the validation results using the
              validation feature set. While the training score indicates the self classifying ability of the model, the
              validation score helps in accessing the suitability of any model deployment on the unseen data. The
Preprints (www.preprints.org) | NOT PEER-REVIEWED | Posted: 26 July 2020 doi:10.20944/preprints202007.0634.v1
Peer-reviewed version available at Sensors 2020, 20, 4791; doi:10.3390/s20174791
11 of 33
training and validation scores for all the twenty-four classifiers segregated with the corresponding
window-length are shown in Table 3 and a pictorial comparison of the validation score measure is
shown in Figure 9. The training and validation score values from Table 3 indicate that the models
with the window-length of 2sec or 4sec were better self-trained and has better validation measures in
comparison to the models that were built using 1sec window-length.
Table 3. Classifier performance comparison over varied window-lengths
Window without PCA with PCA
Classifiers
length Training Score Validation Score Training Score Validation Score
SVM 0.9735 0.8559 0.9674 0.8525
MLP 0.9232 0.8190 0.9041 0.8041
1 Sec
kNN 0.9390 0.8248 0.9307 0.8227
RF 0.9925 0.8165 0.9898 0.8179
SVM 0.9907 0.8906 0.9875 0.8816
MLP 0.9690 0.8615 0.9568 0.8475
2 Sec
kNN 0.9715 0.8571 0.9613 0.8520
RF 0.9956 0.8607 0.9850 0.8439
SVM 0.9974 0.9171 0.9965 0.9089
MLP 0.9961 0.8709 0.9939 0.8709
4 Sec
kNN 0.9944 0.8848 0.9845 0.8828
RF 0.9995 0.8905 0.9994 0.8670
A few more observations can be drawn from the validation score results from Table 3 and Figure 9.
Dimensionality reduction from 48-D time-frequency vector to 30-D transformed vector by having an
accumulated variance greater than 99% using PCA had no significant effect on the performance of the
models. Performance in terms of validation score for ML models with PCA were almost comparable
but not improved in comparison to ML models without PCA. Also, the performance of the supervised
ML models built using 4sec window-length were better when compared with the models built with
a window-length of 2sec in terms of validation score. Therefore, the eight supervised ML models
constructed using 4sec sliding window-length were retained for further comparison using the test set
feature data to find the possibility of having a single best classifier for exercise recognition.
Figure 9. Comparison of validation score
Figure 10. Test score comparison of all the eight 4 second window-length based classifier models
Figure 10 shows the test score comparison among all eight supervised ML classifiers with 4sec
window-length. All the models were tested with the same test set data. The SVM model without PCAPreprints (www.preprints.org) | NOT PEER-REVIEWED | Posted: 26 July 2020 doi:10.20944/preprints202007.0634.v1
Peer-reviewed version available at Sensors 2020, 20, 4791; doi:10.3390/s20174791
12 of 33
was found to be the single best performing model with a test score of 96.07%. The SVM model with
PCA was found to be the second-best model with a test score of 95.96%.
The best ML model, SVM without PCA, was further evaluated to find the performance of
individual exercises and the statistical parameters such as precision, recall and F1-score measures for
each exercise were tabulated in Table 4. The precision with which each exercise recognized varied
from a low of 91.42% (FR) to as high as 100% (BC and TER). Recall rate was found to be 93.33% (LR
and SBC) to 100% (TER) and measured F1-score measures was from 92.52% (FR) to 100% (TER).
Table 4. Performance evaluation measures of SVM Classifier on individual exercises
Exercise Type Acronym Precision Recall F1-score
Bicep Curls BC 1.0000 0.9970 0.9985
Frontal Raise FR 0.9142 0.9364 0.9252
Upper-Body Lateral Raise LR 0.9194 0.9333 0.9263
LME exercises Triceps Extension TER 1.0000 1.0000 1.0000
Pec Dec PD 0.9599 0.9424 0.9511
Trunk Twist TT 0.9910 0.9970 0.9940
Standing Bicycle Crunches SBC 0.9419 0.9333 0.9376
Lower-Body Squats SQ 0.9907 0.9727 0.9817
LME Exercises Leg Lateral Raise LLR 0.9760 0.9849 0.9804
Lunges L 0.9296 0.9606 0.9449
Common
Others OTH 0.9481 0.9139 0.9307
Movements
Figure 11. Normalized confusion matrix for the SVM model
These results are significant in that they indicate that with a single wrist-worn inertial sensor it is
possible to recognize the LME exercises used in CVD rehabilitation process with a very good overall
score of 96.07%. The significance of this finding is very important as the set of LME exercises used
in this study are not only single joint upper-body exercises but also has exercises with multi-joint
lower-body exercises. Lower-body exercises like standing bicycle crunches (SBC), squats (SQ), leg
lateral raise (LLR), and lunges (L) were also accurately detected with a single wrist-worn device withPreprints (www.preprints.org) | NOT PEER-REVIEWED | Posted: 26 July 2020 doi:10.20944/preprints202007.0634.v1
Peer-reviewed version available at Sensors 2020, 20, 4791; doi:10.3390/s20174791
13 of 33
very high F1-scores: 93.76%, 98.17%, 98.04%, and 94.49% respectively. Additional studies into exercise
recognition using CNN based deep learning models studied are discussed in the subsequent sections.
The model’s normalized confusion matrix plot representing the confusions among the exercises are
plotted and shown in the Figure 11. Confusions among the exercises having similar wrist-movement
actions were evident from the confusion matrix plot and are discussed here. The first observed
confusion was between two upper-body LMEs, the Frontal raises (FR) and the Lateral raises (LR),
and a 6.36% of the FR exercises were confused with that of the LR while a 6.67% of the LR exercises
were confused with that of FR. In both FR and LR exercises, raising the hands straight was commonly
observed with significant movements on the plane of the accelerometer x-axis direction. However,
the wrist-movement actions were different for FR from that of LR only during the movement from
the initial resting position. The second observed confusion was between the exercises Pec Dec (PD)
and the Standing bicycle crunches (SBC). A 3.94% confusion were observed in SBC from PD, whereas
a 5.76% of PD were getting confused with SBC. The wrist rotary movements in the plane of the
gyroscope y-axis direction were similar for these SBC and PD exercises. The third observation was for
the lower-body LME exercise Lunges were getting confused with the common movements (others)
and a 3.64% confusion was observed. However, the common movements (others) were confused with
Lunges with a 5.8% confusion.
Figure 12. Receiver operating characteristic of the SVM model
Performance measurement or the capability of the classifier models were represented using the
area under the curve plot or also known as the receiver operating characteristic (AUC-ROC) curve
plots. The AUC-ROC curves are plotted with the true positive rate (TPR) on the y-axis against the false
positive rate (FPR) the x-axis. Figure 12 represents the AUC-ROC plot for the SVM classifier without
PCA and a minimum AUC value of 99.67% for FR to a maximum of 100% for BC, TT and TER .Preprints (www.preprints.org) | NOT PEER-REVIEWED | Posted: 26 July 2020 doi:10.20944/preprints202007.0634.v1
Peer-reviewed version available at Sensors 2020, 20, 4791; doi:10.3390/s20174791
14 of 33
4.2. Exercise Recognition with CNN_Model1 using AlexNet Architecture
The second method used in the comparative study of the exercise recognition task (Figure 5) was
a deep convolutional neural network (CNN) model using the AlexNet architecture (Figure 13) [45].
The AlexNet model is an eight layer model with five convolutional layers, three fully-connected
maximum pooling layers and a rectified linear unit (ReLU) as activation function in each layer. Batch
normalization is used before passing the ReLU output to the next layer. A 0.4 dropout is applied in the
fully connected layers to prevent overfitting of the data. This eight layered architecture generates a
trainable feature map which is capable of classifying a maximum of 1000 different classes.
Figure 14 represents an end-to-end pipeline structure of an optimized CNN model, using the
AlexNet architecture, for the LME exercise recognition task. The LME exercise recognition task was an
11-class classification task and hence we used a final output layer, a fully connected dense layer, with
a softmax activation function for the classification of 11 classes. An optimum CNN model with best
learning rate, optimizer function and loss function was trained using the training data and was further
validated using the validation data before testing the model with the test data from the INSIGHT-LME
dataset (Section 3.4).
Figure 13. Illustration of AlexNet architecture. Image credits to Krizhevsky et al., the original authors
of the AlexNet paper.
Figure 14. End-to-end pipeline for Figure 15. A sample 2D (576 x 576) image of
exercise recognition with AlexNet accelerometer and gyroscope signal plot for Bicep Curls
4.2.1. Data Segmentation and Processing
The CNN model with the AlexNet architecture (CNN_Model1) requires an input data in the form
of 2D images of size 227×227. Data segmentation and processing methods were used to convert the
6D time-series data from the input INSIGHT-LME dataset to 2D images. To compare the results of
CNN_Model1 with the ML models discussed in Section 4.1.5, a 4-second windowing method with an
overlap of 1-second was used to segment the 6D (3D accelerometer and 3D gyroscope) time-series dataPreprints (www.preprints.org) | NOT PEER-REVIEWED | Posted: 26 July 2020 doi:10.20944/preprints202007.0634.v1
Peer-reviewed version available at Sensors 2020, 20, 4791; doi:10.3390/s20174791
15 of 33
and an image of size 576 x 576 with plots of all 6 axes were plotted. A 4-second, 6D time-series data
segment of Bicep Curls was 2D plotted into a 576 x 576 image and is shown in Figure 15. Top three
plots: red, green and blue, represents the plots corresponding to the 3D accelerometer x-axis, y-axis
and z-axis; and the bottom three plots: cyan, yellow and magenta, corresponding to the plots of 3D
gyroscope x-axis, y-axis and Z-axis.
An image dataset was generated, by data segmentation and processing method, from the entire
time-series raw data of the INSIGHT-LME dataset using the 4-second windowing method with a
1-second overlap. The image dataset comprises of 11-classes of image data, among which, ten classes
were from the ten LME exercises and the eleventh class from the common movements observed during
the exercises. The training set was formed with a total of 43306 images from eleven class of data from
46 participants. Similarly, the validation set was formed with 13827 images from 15 participants and
the test set was formed with 14340 images from 15 participants. Downsampling of images to 227 x
227 image was further achieved by data augmentation method in the input layer during the model
implementation.
4.2.2. CNN_Model1 for the Exercise Recognition Task
An optimum model, termed CNN_Model1 here, was developed using python sequential
modelling along with the Keras API, a high-end API for TensorFlow. The model constructed here was
an optimum model with the best possible optimizer function, good learning rate to achieve better
accuracy and with a very good loss function. The model was constructed with the choice of optimizer
function among stochastic gradient descent (SGD), Adam, and RMSprop and the model was trained
with varied learning rates ranging from 1e-03 to 1e-6 values. Also, the model was trained with loss
functions such as categorical cross-entropy (CCE) and Kullback-Leibler divergence (KLD). The best
model parameters were selected with an iterative evaluation using a varied number of epochs.
Data augmentations, like resizing of input dataset images and shuffling of input images
were achieved using flow_from_directory method in ImageDataGenerator class from Keras image
processing. Since the input images correspond to time-series data, augmentation operations such
as shearing, flipping, and rotation tasks were not performed. CNN models were constructed using
the training image dataset and validated using the validation image dataset while monitoring the
validation loss. A model with a minimum validation loss was saved for each combination of network
parameters. The model parameters such as training accuracy, validation accuracy, training loss and
validation loss against the number of iterations were obtained and were plotted. A best model having
the highest validation accuracy was selected and tested with the test image dataset and the resulting
evaluation parameters such as test accuracy and loss measures were recorded. The best model,
CNN_Model1, was then compared with the best model selected from supervised machine learning
model. A complete list of the architecture parameters can be found in Table A1 in Appendix A.
4.2.3. Experimental Results of CNN_Model1
The CNN_Model1 having Adam optimizer, a learning rate 1e-4 with KLD loss function was the
best model with a training score of 99.96% and a validation score of 94.01%. The model was further
evaluated using the test set image dataset and an overall F1-score of 96.895% was recorded and was
almost 1% better in comparison with the SVM model, the best performing supervised ML model
(Section 4.1.5). The performance of CNN_Model1 for the individual exercises were evaluated and the
statistical parameters measures like precision, recall and F1-score for each exercise were tabulated
in Table 5. These test score measures of the individual exercise recognition of the CNN model with
AlexNet architecture were comparably better with that of the SVM model (Table 4).
Figure 16 represents the normalized confusion matrix for the CNN_Model1. The values on the
main diagonal representing recall or sensitivity of the model to the individual exercises were showing
significant improvement for all the exercises, in comparison with the SVM model, except for the case of
Lateral Raise (LR) exercise. An overall performance comparison of the SVM model and CNN_Model1Preprints (www.preprints.org) | NOT PEER-REVIEWED | Posted: 26 July 2020 doi:10.20944/preprints202007.0634.v1
Peer-reviewed version available at Sensors 2020, 20, 4791; doi:10.3390/s20174791
16 of 33
Table 5. Performance evaluation measures of CNN_Model1
Exercise Type Acronym Precision Recall F1-score
Bicep Curls BC 1.0000 1.0000 1.0000
Frontal Raise FR 0.9052 0.9552 0.9296
Upper-Body Lateral Raise LR 0.9273 0.9105 0.9188
LME exercises Triceps Extension TER 0.9962 1.0000 0.9981
Pec Dec PD 0.9850 0.9990 0.9920
Trunk Twist TT 0.9962 0.9990 0.9976
Standing Bicycle Crunches SBC 0.9921 0.9600 0.9758
Lower-Body Squats SQ 0.9814 0.9552 0.9681
LME Exercises Leg Lateral Raise LLR 0.9209 0.9867 0.9526
Lunges L 0.9748 0.9952 0.9849
Common
Others OTH 0.9868 0.8991 0.9409
Movements
Figure 16. Normalized confusion matrix for CNN model with AlexNet architecture
for upper-body and lower-body exercises is shown in Figure 17. The CNN_Model1 outperformed the
SVM model in both the upper-body LME exercises and the lower-body LME exercises.
4.3. Exercise Recognition with CNN_Model2 using Time-Series Arrays
The third method, termed CNN_Model2, used in the comparative study of the exercise recognition
task (Figure 5) was the model that we designed and built from scratch using the deep CNN concept.
The motivation to build CNN_Model2 was to process the raw time-series data from the wearable
sensor through deep network without converting to images. Though the results observed from
CNN_Model1 were very good for the exercise recognition task, it was interesting to to test a time-series
data classification model for exercise recognition. Figure 18 represents the pipeline used in the
development of a CNN model from scratch which uses wearable sensor data in the form of six 1-D
time-series vector arrays. The CNN_Model2 was constructed using the time-series array data from the
INSIGHT_LME data set (Section 3.4). Data segmentation and processing, model construction and the
obtained results are discussed in the following sections.Preprints (www.preprints.org) | NOT PEER-REVIEWED | Posted: 26 July 2020 doi:10.20944/preprints202007.0634.v1
Peer-reviewed version available at Sensors 2020, 20, 4791; doi:10.3390/s20174791
17 of 33
Figure 17. Statistical parameter comparison for CNN_Model1 and SVM models
Figure 18. End-to-End
pipeline for exercise
recognition using
CNN_Model2 Figure 19. CNN_Model2 Architecture for exercise recognition
4.3.1. Data Segmentation and Prepossessing
Data segmentation was achieved using the sliding window method with a window length of
4seconds having an overlap of 0.5second. A 6D time-series data array of size (2048 x 1 x 6) was
formed from every segmented frame. A 6D time-series array comprises six 1D time-series arrays
corresponding to data from each axis of 3D accelerometer and 3D gyroscope. 6D time-series data set
for the training, validation and testing were prepared from the training set, validation set and test set
of the INSIGHT_LME data set and the class label information were retained in each data set. The data
set was then used by CNN_Model2 for the exercise recognition task.
4.3.2. CNN_Model2 Architecture for Exercise Recognition
Figure 19 illustrates the base architecture of the CNN_Model2 classifier for the recognition
task. The deep network consists of seven 2D convolutional layers in addition to an input layer, two
fully connected layers and a dropout layer. In each convolution layer, the convolution operation
was followed by batch normalization, activation and max-pooling operations. The output of the
seventh convolution layer was flattened and applied to fully connected layers with a ReLU activation
function. A dropout of 0.25 was used, to prevent overfitting, before connecting to an output layer.
A fully-connected output layer with a softmax activation function was used which was capable of
classifying output into 11 classes. The number of filters used in seven convolution layers were 16, 16,
32, 32, 64, 64 and 96 respectively. The selection of the number of convolutional layers and the number
of filters in each layer of the CNN_Model2 architecture were arrived after the initial few trials with
different configurations. Table A2 of Appendix A lists the complete architecture parameters for the
CNN_Model2.Preprints (www.preprints.org) | NOT PEER-REVIEWED | Posted: 26 July 2020 doi:10.20944/preprints202007.0634.v1
Peer-reviewed version available at Sensors 2020, 20, 4791; doi:10.3390/s20174791
18 of 33
The CNN_Model2 was constructed using Keras API with the TensorFlow back end with the
choice of optimizer function among SGD, Adam and RMSprop. Similarly, a best learning rate was
selected by training the model over a range of 1e-03 to 1e-10 with a decay of 1e-01. The models
were optimized using the loss functions categorical cross-entropy and Kullback-Leibler divergence
to have lower losses. Early stopping while the model building by monitoring validation loss and
learning rate scheduler using the ReduceOnPlateau function from Keras was effectively used. Data
augmentations like shearing, resizing, flipping, rotation were not performed on the time-series data.
Models were trained and validated using 6D array data set from training dataset and validation data
set (Section 4.3.1). A model with a minimum validation loss and with the best validation accuracy was
selected as CNN_Model2 and this model was further tested using the test dataset.
4.3.3. Experimental Results of CNN_Model2
CNN_Model2 having Adam optimizer with a learning rate 1e-7 with KLD loss function was
found to be the best model recorded with an overall training score of 96.89% and a validation score of
88.97%. The model recorded an overall test accuracy of 95.61% with an overall F1-score measure of
96% for the test dataset. The CNN_Model2 performance was very much comparable with both SVM
model from supervised ML model(Section 4.1) and CNN_Model1(Section 4.2).
Table 6. Performance evaluation measures of CNN_Model2
Exercise Type Acronym Precision Recall F1-score
Bicep Curls BC 0.9952 0.9713 0.9831
Frontal Raise FR 0.8917 0.9574 0.9234
Upper-Body Lateral Raise LR 0.9389 0.9178 0.9283
LME exercises Triceps Extension TER 0.9985 1.0000 0.9992
Pec Dec PD 0.9953 0.9837 0.9895
Trunk Twist TT 0.9721 0.9977 0.9847
Standing Bicycle SBC 0.9834 0.9651 0.9742
Lower-Body Squats SQ 0.9874 0.9698 0.9785
LME Exercises Leg Lateral Raise LLR 0.9771 0.9907 0.9838
Lunges L 0.8917 0.9574 0.9234
Common
Others OTH 0.8975 0.8389 0.8672
Movements
The performance of CNN_Model2, in terms of statistical parameter measurements such as
precision, recall and F1-score, for individual exercise were measured and tabulated in Table 6. A
comparative representation of all three models with relative statistical measures for the upper-body
and lower-body LME exercises were shown in Figure 20. These statistical evaluation measures obtained
from the CNN_Model2 were compared with the results obtained from the SVM model (the best
performed supervised ML model) and CNN_Model1. The overall performance of the CNN_Model2
was found to be better than the SVM model performance. However, the overall performance of
CNN_Model1 was found to be better compared to CNN_Model2.
4.4. Summary of Comparative Study of Models for Exercise Recognition
The following conclusions can be drawn from the model comparison. Among the supervised ML
models, models that were constructed with the dimensionality reduction using PCA were observed
with inferior performance compared to the models without PCA. Among the four ML models without
PCA, the SVM model performed the best. The deep CNN model, the CNN_Model1, using the AlexNet
architecture found to be the single best model when compared with the SVM and CNN_Model2,
and outperformed both SVM and CNN_Model2 in terms of overall test accuracy, precision, recall
and F1-score values. The second deep CNN model, the CNN_Model2, was found to be the second
best and outperformed the SVM model in terms of overall performance over test accuracy, precision,
recall land F1-score measures. The models were compared for their performances on the upper-bodyPreprints (www.preprints.org) | NOT PEER-REVIEWED | Posted: 26 July 2020 doi:10.20944/preprints202007.0634.v1
Peer-reviewed version available at Sensors 2020, 20, 4791; doi:10.3390/s20174791
19 of 33
Figure 20. F1-score comparison of SVM, CNN_Model1 and CNN_Model1 for Upper-Body and
Lower-Body LME exercises
LME exercise recognition and lower-body LME exercise recognition and observed that CNN_Model1
outperforms the other two models
4.5. Exercise Repetition Counting with Peak Detection Method
The first method, among three, investigated for exercise repetition counting was a signal
processing method based on peak detection. The concept of the peak detection method lies in the
identification of the peaks corresponding to maximum or minimum signal strength of any periodic
time-series data. Figure 21 represents the end-to-end pipeline used for peak detection and counting
repetitions using peak information. Raw data from the INSIGHT-LME data set corresponds to 3D
accelerometer and 3D gyroscope recordings for limb movement having for each of the exercises. Each
exercise type exhibits different signal patterns on the different sensor axes and the signal strengths on
any given axes is proportional to the plane of limb movement. The periodicity of the signal observed
on any significant axis of the sensor was used in the peak detection after completion of the exercise
recognition task. Hence, 10 peak detectors were used, one for each exercise. The raw data from all the
participants from the INSIGHT-LME dataset was used here to count the number of repetitions for each
of the exercises. Data processing, filtering, peak detection and counting are discussed in the following
section.
Figure 21. Pipeline for repetition counting using a peak detector
4.5.1. Data Processing and Filtering
6D time-series data from INSIGHT-LME dataset were the information obtained from each
participant while exercising . The signal pattern variations in all the three axes of the accelerometer
and the gyroscope represents the significant translatory motion and rotary motion respectively. While
exercising, repetitions are reflected in the periodicity in the signal patterns on these axes of the sensors.
The signal amplitude on each axis represents the significance of limb movement in any particularYou can also read