The global lake area, climate, and population dataset - Nature
←
→
Page content transcription
If your browser does not render page correctly, please read the page content below
www.nature.com/scientificdata

               OPEN            The global lake area, climate, and
Data Descriptor                population dataset
                                                       1,4 ✉
                               Michael F. Meyer             , Stephanie G. Labou2,3,4, Alli N. Cramer1, Matthew R. Brousil2 &
                               Bradley T. Luff1

                               An increasing population in conjunction with a changing climate necessitates a detailed understanding
                               of water abundance at multiple spatial and temporal scales. Remote sensing has provided massive
                               data volumes to track fluctuations in water quantity, yet contextualizing water abundance with other
                               local, regional, and global trends remains challenging by often requiring large computational resources
                               to combine multiple data sources into analytically-friendly formats. To bridge this gap and facilitate
                               future freshwater research opportunities, we harmonized existing global datasets to create the Global
                               Lake area, Climate, and Population (GLCP) dataset. The GLCP is a compilation of lake surface area for
                               1.42 + million lakes and reservoirs of at least 10 ha in size from 1995 to 2015 with co-located basin-level
                               temperature, precipitation, and population data. The GLCP was created with FAIR (findable, accessible,
                               interoperable, reusable) data principles in mind and retains unique identifiers from parent datasets
                               to expedite interoperability. The GLCP offers critical data for basic and applied investigations of lake
                               surface area and water quantity at local, regional, and global scales.

                               Background & Summary
                               Local, regional, and global patterns in freshwater availability are increasingly important in times of a changing
                               climate and growing human population. At the global scale, tracking changes in water abundance is more feasible
                               than ever before as a result of advances in remote sensing techniques. Lehner & Döll1 were among the first to
                               compile a global water quantity dataset (i.e., Global Lake Water Dataset GLWD), which included lakes greater
                               than 10 ha in size. Since then, several studies have incorporated diverse remote sensing, topographic, and in situ
                               data to catalog inland water quantity. For instance, Verpooter et al.2 created the Global Water Bodies database
                               (GLOWABO) of ~117 million lakes from satellite data; Richey et al.3 employed GRACE data to assess change in
                               recharge for 37 of the world’s largest aquifers; and Pekel et al.4 used LANDSAT data to identify and quantify global
                               surface water from 1984 to 2015. Remote sensing’s relatively high frequency and extensive temporal record has
                               enabled comparisons of water quantity change within years and across decades5–7. Similarly, local-scale investiga-
                               tions of water abundance have incorporated remote sensing data to explain hydrological and biological phenom-
                               ena. For example, Anderson et al.8 paired remote sensing data with stable isotope and climate data to create water
                               budgets for high-latitude boreal lakes. At both local and global scales these analyses conclude that trends in water
                               abundance are highly heterogeneous over space and time, with regional patterns being explained by differences
                               in human demand, climate, the physical landscape, or interactions between these drivers.
                                   Despite extensive data availability to address questions of water quantity at various scales, the pace of research
                               is often limited by the amount of time and computational resources required to aggregate and harmonize dis-
                               parate data sources. Likewise, managing and working with highly voluminous environmental data can hinder
                               users without advanced computational skills and resources, such as knowledge of a coding language or access to
                               high performance computers for “big” data analyses9,10. While recent efforts to capture global scale changes have
                               created opportunities to address water quantity questions as they relate to human demand and climate variability,
                               many researchers, especially those focused at local scales, may be limited by the computing infrastructure and
                               researcher skill set required to integrate existing environmental datasets.
                                   To help bridge the distance between available global water-related data sources and potential users with a
                               range of computational capacities and experiences of managing large, disparate data sources, we integrated exist-
                               ing long-term datasets for lake locations and characteristics, water surface area, climate, and human population to

                               1
                                 School of the Environment, Washington State University, Pullman, Washington, 99164, USA. 2Center for
                               Environmental Research, Education, and Outreach, Washington State University, Pullman, Washington, 99164, USA.
                               3
                                 Present address: University of California San Diego, La Jolla, California, 92093, USA. 4These authors contributed
                               equally: Michael F. Meyer, Stephanie G. Labou. ✉e-mail: michael.f.meyer@wsu.edu

  Scientific Data |   (2020) 7:174 | https://doi.org/10.1038/s41597-020-0517-4                                                                     1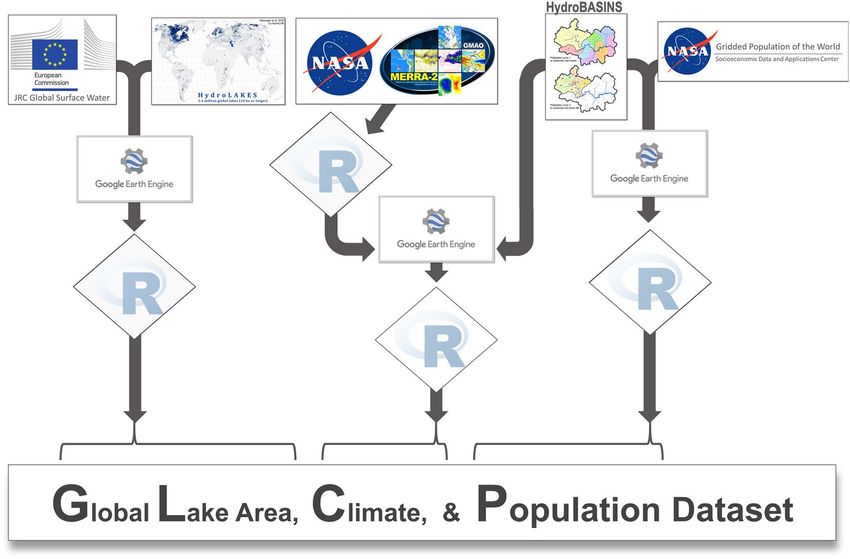
www.nature.com/scientificdata/                                                                         www.nature.com/scientificdata

                             HydroBASIN          Number of    Percent of    Median basin
                             Pfafstetter level   lakes        valid lakes   size (km2)
                             2                   2595         0.18%         2198593
                             3                   6650         0.46%         548263
                             4                   8912         0.62%         225882
                             5                   15948        1.12%         58705
                             6                   23262        1.63%         16967
                             7                   41001        2.88%         5042
                             8                   55107        3.87%         1632
                             9                   55061        3.87%         518
                             10                  9747         0.69%         353
                             11                  196          0.01%         333
                             12                  1204020      84.64%        156

                             Table 1. Number of HydroLAKES polygons matched with HydroBASINS polygons by Pfafstetter level.

                             create the unified Global Lake area, Climate, and Population (GLCP) dataset. The GLCP contains over 1.4 million
                             lakes of at least 10 ha in surface area, with annual surface area (identified as permanent or seasonal water) from
                             1995 to 2015, paired with annual basin-level temperature, precipitation, and population values. With a focus on
                             lake systems, the GLCP can be used to investigate water abundance of the larger hydrologic landscape, as lakes
                             temporally integrate surface and subsurface flows11,12. As a result of its interoperability, reproducibility, and exten-
                             sive coverage, the GLCP is a highly flexible dataset capable of addressing a suite of research questions pertaining
                             to intensive study both within and across specific systems. Additionally, the inclusion of co-located climate and
                             human data as potential drivers of water surface area change makes the GLCP well suited to extensive, multi-scale
                             analysis of heterogeneous environments globally and over decades.

                             Methods
                             Data sources.         Lake locations and boundaries. For the locations of lakes, we used the HydroLAKES data-
                             base version 1.013 (https://www.hydrosheds.org/page/hydrolakes), which incorporates multiple lake datasets (e.g.,
                             Shuttle Radar Topology Mission, Water Body Data, Global Lakes and Wetlands Database) and includes 1,427,688
                             lakes of at least 10 hectares in surface area. The majority of HydroLAKES lakes are defined as uncontrolled lakes
                             (99.5%), with the remainder identified as reservoirs (0.47%) and controlled lakes (0.03%). HydroLAKES, which
                             is available in the form of shapefiles, includes an extensive number of attributes for lake polygons including: lake
                             surface area (polygon area), elevation, shoreline development, total volume, average depth, residence time, lati-
                             tude and longitude of pour point, lake type, and others. The HydroLAKES v1.0 identifier (“Hylak_id”) is retained
                             in the GLCP to facilitate future work making use of other attributes in the HydroLAKES data, which are not
                             included in the GLCP. Additionally, the GLCP also contains the latitude (“centr_lat”) and longitude (“centr_lon”)
                             of each lake’s centroid, which was calculated within ArcGIS version 3.114.
                                 Hereafter, HydroLAKES lake polygons are referred to as “lakes.”

                             Basins. Because lakes are products of the landscapes in which they reside, we calculated climate and population
                             values relative to each lake’s basin. To identify basin boundaries, we used the HydroBASINS dataset, a basin-level
                             analog to the HydroLAKES dataset. The HydroBASINS version 1.c format 1 database15 includes 3,786,218 unique
                             basins and is derived from the HydroSHEDS database16, which uses 15 arc-second resolution data to identify river
                             basins, watersheds, and sub-basins globally. In HydroBASINS, basins are identified using the Pfafstetter coding
                             system, with Level 1 as the highest level (i.e., continent level) and Level 12 as the smallest available sub-basin.
                             Table 1 details the number and median size of basins within each Pfafstetter level for basins used within the GLCP.
                             We retain the original HydroBASINS version 1.c identifier (“HYBAS_ID”) for each basin in the GLCP, for ease of
                             future integration with existing HydroBASINS attributes, such as distance from basin outlet to next downstream
                             sink and indicators of endorheic basins.
                                Hereafter, HydroBASINS polygons are referred to as “basins.”

                             Surface water extent. For changes in lake surface water area over time, we used the Joint Research Centre (JRC)
                             Global Surface Water Dataset described in Pekel et al.4, which used LANDSAT imagery (30 meter resolution)
                             from March 1984 through October 2015 to identify changes in surface water area for lakes, rivers, streams,
                             and wetlands. The data are hosted by the European Commission JRC and are formally referred to as the Global
                             Surface Water Dataset. Hereafter, we use the abbreviation “JRC” to refer to this dataset.
                                 The JRC data subsetted for Yearly Water Classification History v1.0 (1984–2015) are publicly available through
                             Google Earth Engine (GEE) as annually aggregated raster images. Each image contains a “waterClass” band with
                             the following values: 0 = no observations, 1 = not water, 2 = seasonal water (defined as water that is present for
                             at least one month but not an entire year), 3 = permanent water (defined as water that is present for all twelve
                             months). For more detailed information on the complete LANDSAT processing workflow used to create the JRC,
                             Pekel et al.4 provides a methodology of how waterClasses were assigned based on raw LANDSAT data.
                                 While the JRC dataset is the most extensive global surface water dataset available to date, it is limited by
                             the LANDSAT data from which it is derived. Even though LANDSAT coverage began in 1984, portions of

Scientific Data |   (2020) 7:174 | https://doi.org/10.1038/s41597-020-0517-4                                                                       2
www.nature.com/scientificdata/ www.nature.com/scientificdata
northeastern Siberia (Kolyma region and Central Siberian plateau) as well as central Greenland were not included
in totality until 1999.
Additionally, the JRC is limited by the water identification algorithm used by Pekel et al.4, which divided pixels
into water, land, or non-valid observations, where non-valid observations may include snow and ice. This system
therefore does not classify permanently frozen lakes as water. Seasonally frozen lakes, however, would be coded
as entirely seasonal water.
Climate data. We used the Modern-Era Retrospective analysis for Research and Applications, Version 2
(MERRA-2)17 as the source for climate data. Both precipitation and temperature datasets18 were hourly aggre-
gates with original spatial resolution of 0.5 × 0.625 decimal degrees. From these broader datasets, we extracted
the variables PRECTOTCORRLAND (total precipitation land; bias corrected; in kg m−2 s−1, or volumetrically,
mm s−1) for precipitation and T2MMEAN (2-meter air temperature in K) for temperature. These subsets were
exported from NASA Goddard Earth Sciences (GES) and Data Information Services Center (DISC) in a netCDF
format for local analysis.
Population estimates. We used the Gridded Population of the World (GPW) version 319 for 1995 and GPW
version 420 un-adjusted population count data for 2000, 2005, 2010, and 2015 population estimates. Resolution
for the GPW version 3 is 2.5 arc-minutes and is available for download from NASA’s Socioeconomic Data and
Applications Center (SEDAC). Resolution for GPW version 4 is 30 arc-seconds and is currently hosted on Google
Earth Engine. Detailed methodology for the development of these datasets is available in Doxsey-Whitfield et
al.21.
Data harmonization process. As this project involved harmonizing multiple global datasets at different
resolutions, our workflow required multiple steps, each of which resulted in a cleaned data subset. Here we detail
the steps taken to integrate the HydroLAKES, HydroBASINS, JRC, climate, and human population datasets
described above.
Step #1: Calculate lake surface area. Lake surface area for each lake from 1995 to 2015 was calculated using
Google Earth Engine22. Lake polygons were uploaded and imported into Earth Engine as shapefiles. These lake
polygons, which represent typical shape and area for individual lakes, were buffered by a specified distance to
allow water area calculations to account for increases in lake area beyond the HydroLAKES polygon borders
as specified in HydroLAKES. Buffered lake polygons were then used as boundaries within which to summarize
pixels from annual JRC data for each waterClass category (i.e., no data, not water, seasonal water, or permanent
water). We calculated “total water” as the sum of seasonal and permanent water pixels. Resulting area values
were exported in a .csv format to Google Drive, then downloaded for local analysis using the R statistical envi-
ronment23. Commented Google Earth Engine code for lake area calculations (“jrc_water_class_sum.txt”), the R
script for formatting Google Earth Engine output (“01_import_format_JRC.R”)24–26, and associated input data
are available in the Environmental Data Initiative (EDI) GLCP repository27 within the entities “glcp.tar.gz” as well
as “glcp_scripts.tar.gz".
To evaluate how lake waterClass areas fluctuated with various buffer sizes, we calculated lake waterClass areas
for 1995, 2000, 2005, 2010, and 2015 with 30 m, 60 m, 90 m, and 120 m buffers. Preliminary tests indicated smaller
buffers were insufficient to capture large area increases, while larger buffers increased risk of overlapping neigh-
boring lakes (especially in dense lake areas), smaller ponds, or input/output rivers and erroneously increasing lake
area totals. Our analysis of waterClass areas between buffer sizes and years indicated 90 m as the most appropriate
distance. Additional details are provided in the “Technical Validation” section.
We identified a minority of lakes that were unable to be included in the final data product. One lake in North
America was identified as having a broken geometry (Hylak_id = 109424), making it incompatible with Earth
Engine-based analyses. Rather than attempt to repair the lake shapefile boundaries and potentially change the
size and shape, we chose not to include this lake. Additionally, a small number of lakes were identified to be out-
side the range of reliable LANDSAT data. The available JRC data has a maximum extent of 80°N and Pekel et al.4
note that LANDSAT images above 78°N are sparse, partially due to the short LANDSAT observation season in
high northern latitudes. As such, we limited further processing to lakes whose entire extent is below 78°N, which
excluded 3,220 lakes (0.23% of original 1.4 million lakes).
Given the potential for lakes in this area to have inaccurate area measurements prior to 1999, we calcu-
lated ratios of “no data” pixel areas to “not water”, “seasonal water”, “permanent water”, and “total water” pixel
areas. These ratios will enable future users to set desired thresholds of “no data” coverage that are specific to
their research questions. These ratios are provided within a secondary .csv file (“JRC_all_no_data_propor-
tions_yearly_95thru15.csv”) and can be merged efficiently with the full GLCP using the provided R script
(“combine_data_availability_metrics_with_glcp.R”).
Step #2: Match lakes with basins. Because HydroBASINS is derived from river networks, rather than lake pour
points, the HydroLAKES and HydroBASINS data do not come with a pre-existing 1:1 matching scheme for lake
and basin. To match lakes with their equivalent basins, we performed spatial joins for the lake shapefiles and basin
shapefiles to identify the smallest basin that enclosed a lake in its entirety. With this basin matching scheme, there
is potential for some lakes to be assigned to basins which are larger than their actual basin. As a result, future
users are encouraged to compare GLCP-associated basin area to a lake’s known basin area, if those data exist.
Comparing HydroBASINS river basins to known lake basins would enable researchers to determine if differences
in basin assignment are meaningful of their specific research question. All lakes that fell within a Pfafstetter Level
12 basin (85% of lakes, Table 1) were tagged with the Level 12 basin identifier, because no smaller sub-basins were
Scientific Data | (2020) 7:174 | https://doi.org/10.1038/s41597-020-0517-4 3www.nature.com/scientificdata/ www.nature.com/scientificdata
available. The highest level Pfafstetter basin used was Level 2 (Level 1 being near continent-level), which was suffi-
cient to capture the watersheds of very large lakes, such as the Laurentian Great Lakes and the Caspian Sea. Of the
original 3,786,218 HydroBASINS basins, 232,827 were paired with lakes (6.15%). This basin matching procedure
was performed within Google Earth Engine (“hylak_hybasin_matching.txt”) and outputs were formatted locally
using R (“07_lake_basin_matching.R”)24,25.
Using this lake/basin matching procedure, 1,949 lakes (0.14% of the original 1.4 million HydroLAKES lakes)
were unable to be properly associated with a basin. Manual investigation indicated that these lakes were either
located on islands (645 lakes, 0.05% of the original HydroLAKES) or would be associated with only a Level 1 basin
(1,304 lakes, 0.09% of the original HydroLAKES). Lakes located on islands are excluded from the GLCP because
their natural basins are not included in the continental basin schema that HydroBASINs employs. Similarly, the
1,304 lakes associated with Level 1 basins were consistently located on the boundary between neighboring basins
and therefore never completely enclosed in a single basin. This peculiarity is largely because HydroBASINS is
constructed for river networks, as opposed to lakes. Because it is unrealistic for these 1,304 lakes (average total
area: 2.39 km2) to be influenced by near continental-scale climate and human population forcings, we excluded
these lakes from further processing.
Step #3: Calculate basin-level precipitation and temperature estimates. Once basins were associated with lakes,
basin-level climate values were calculated. Within the R environment, precipitation values from MERRA-2 were
converted to annually accumulated precipitation by aggregating hourly data for each gridcell for each year28,29.
We also derived the average monthly volume of precipitation for each gridcell for each year (1995–2015) by
taking the mean of each year’s total monthly precipitation volumes (“summing_hourly_data_precip_mm.R”)30–
33
. Temperature values were similarly used to derive an average annual temperature for each year (“summing_
hourly_data_temp_K.R”)30–34. The resulting yearly data were saved as rasters. Yearly total precipitation, average
monthly total precipitation, and temperature rasters (1995–2015) were then resampled at 1/10th cell size through
a bilinear interpolation resampling. The original rectangular grids were converted to squares, with spatial reso-
lution of 0.05 × 0.05 decimal degrees. Because MERRA-2 gridcells were originally sized at 0.5 × 0.625 decimal
degree resolution, the initial conversion from a netCDF to a raster format induced extra space (e.g., 90.25°N
in raster). As such, resampled rasters were clipped to 90°N/S and 180°W/E and converted to geotiff format for
upload to Google Earth Engine (“manipulate_climate_rasters.R”)30–33.
For each basin associated with a lake, basin-level average and total precipitation, as well as average tempera-
ture, were calculated for each year of interest in Earth Engine. The process was similar to the one described for
lake polygons and JRC data, whereby the basins were used as boundaries from which to extract and aggregate
pixels. Results were exported as .csv files to Google Drive, then downloaded for local analysis using R. R scripts
for data aggregation of climate variables (“04_post_gee_processing_temp.R”, “05_post_gee_processing_precip_
sum.R”, “06_post_gee_processing_precip_average.R”)24,25,35 are available on the EDI GLCP repository27 within
the entity “glcp.tar.gz”.
This process resulted in 10 matched basins (of the original 232,837 matched basins; 0.004%), which were
associated with 19 lakes, with missing values for climate variables. These 10 basins ranged in size from 1.1 to
181.7 km2 with a median area of 76.5 km2. These basins and lakes were removed from the dataset. Manual assess-
ment showed that these basins were located at higher northern latitudes in the United States and the Russian
Federation. We note that other temperature and precipitation datasets are available; subsequent analyses can
incorporate alternative climate data sources to match with these basins through the scripts and workflow pro-
vided in the EDI entity “glcp.tar.gz”.
Future users should also note that while HydroBASINS provided a boundary to calculate climate variables for
each lake, these calculations may be overestimates, as many lakes’ actual basins may be smaller than their associ-
ated river basin. However, as with the addition of new climate variables, subsequent analyses can also incorporate
different basin schemes as lake basin shapefiles become available.
Step #4: Calculate basin-level population estimates. While other data sources in this project are annual, the global
population data we used, which was the current best available at the global scale, was for 5-year increments (1995,
2000, 2005, 2010, 2015). Rather than interpolate the intervening years’ values, we chose to leave these blank so
that future researchers can personalize statistical methodology to best address these data gaps in context of a
specific question. Aside from blank values, numerous basins have population estimates as decimal values. Rather
than truncate these values which were produced through the aggregation process within Google Earth Engine,
we retain these so that future users may decide how they wish to round or otherwise interpret these values in the
context of their particular research question.
For each 5-year increment, human population calculations were performed with a technique similar to the
climate data aggregations. GPWv3 (1995 data) was converted to a geotiff and imported into Earth Engine. GPWv4
(2000, 2005, 2010, and 2015) rasters were available through the Earth Engine interface. Basin-level population
totals were calculated from GPWv3 and GPWv4 data with basin polygons as spatial boundaries. Results were
exported as .csv files to Google Drive and then downloaded for local analysis within the R environment. R scripts
for data aggregation of population counts (“02_load_shp_GPWv3.R”, “03_load_shp_GPWv4.R”)24,25,35 are avail-
able on the EDI GLCP repository27 within the entity “glcp.tar.gz”.
Like climate variables, population calculations have the potential to be overestimated, as many lakes’ actual
basins may be smaller than their associated river basin. Additionally, future users should be cognizant of het-
erogeneous human populations within the basin, which could skew analyses of relationships between human
population and lake area. As is currently calculated, population estimates are at the basin scale, whereas cer-
tain research questions may be more focused at population estimates within a particular distance from the lake
Scientific Data | (2020) 7:174 | https://doi.org/10.1038/s41597-020-0517-4 4www.nature.com/scientificdata/ www.nature.com/scientificdata
Fig. 1 Conceptual diagram of data harmonization process. JRC Water area was calculated in Google Earth
Engine (GEE), and then aggregated locally within the R environment. Similarly, basin population was calculated
on GEE, and then aggregated locally within the R environment. Climate data from MERRA-2, however, was first
aggregated from hourly to monthly and annual values, then resampled for 1/10th of their original resolutions
with a subsequent and raster clipping was performed within the R environment. We then imported the geotiff
outputs to GEE to calculate basin climate variables. GEE output was then downloaded locally and aggregated
within the R environment.
(e.g., 500 m). However, subsequent analyses can also incorporate different basin schemes as lake basin shapefiles
become available.
Step #5: Merge lake- and basin-level data. Lake- and basin-level output were merged within the R environment.
The R script for GLCP production (“08_cleaning_glcp_production.R“)24–26 is available in the EDI GLCP reposi-
tory within the entity “glcp.tar.gz”.
Synopsis of lake exclusions during data harmonization:
1. One lake in North America contained broken geometry (Hylak_id = 109424) and was incompatible with
Earth Engine-based analyses (99.99% of original lakes were retained)
2. 3,220 lakes extended beyond 78°N, maximum reliable extent of JRC data (99.77% of original lakes were
retained)
3. 1,949 lakes were unable to be associated with a level 02–12 basins (99.64% of original lakes were retained)
4. 19 lakes (from 10 unique basins) were spatially outside range of temperature or precipitation MERRA-2
data (99.64% of original lakes were retained)
A conceptual diagram of the harmonization process is provided in Fig. 1.
The final GLCP dataset contains 1,422,499 lakes. These lakes were used to generate all dataset summary sta-
tistics reported below.
Data Records
Final data are provided in the form of one .csv file (“glcp.csv”). The GLCP can be found in the Environmental
Data Initiative repository27. The repository also contains calculated values for quality control for a given lake and
year that can also be downloaded in a separate .csv file (“JRC_all_no_data_proportions_yearly_95thru15.csv”).
Future users may wish to combine these data quality metrics with the GLCP, and then set thresholds for their own
analyses. While numerous potential thresholds exist, the authors encourage reporting any data metric thresholds
used in GLCP applications, so as to maintain future reproducibility of GLCP analyses.
The GLCP (“glcp.csv”) has a tabular set-up as described below:
year
Year, spans 1995–2015. Note that for the purposes of these data 2015 ends on October 31, consistent with the
JRC data.
Hylak_id
Scientific Data | (2020) 7:174 | https://doi.org/10.1038/s41597-020-0517-4 5www.nature.com/scientificdata/ www.nature.com/scientificdata
HydroLAKES unique identifier of lake. Preserved from HydroLAKES input data to enable future merge with
HydroLAKES attributes.
centr_lat
Lake centroid latitude.
centr_lon
Lake centroid longitude.
continent
Continent on which lake is located (from HydroLAKES dataset).
country
Country in which lake is located (from HydroLAKES dataset).
bsn_lvl
Pfafstetter level of basin associated with lake.
HYBAS_ID
HydroBASINS unique identifier of basin associated with lake. Preserved from HydroBASINS input data to
enable future merging with HydroBASINS attributes.
mean_monthly_precip_mm
Mean monthly basin-level precipitation, in mm.
total_precip_mm
Total annually accumulated basin-level precipitation, in mm.
mean_annual_temp_k
Mean annual basin-level temperature, in Kelvin.
pop_sum
Total basin-level human population. Note that this column only has valid values for 1995, 2000, 2005, 2010,
and 2015. NA values are listed for all other years.
seasonal_km2
Water area, in square kilometers, of “seasonal” water, as defined by Pekel et al.4.
permanent_km2
Water area, in square kilometers, of “permanent” water, as defined by Pekel et al.4.
total_km2
Calculated “total” water, in square kilometers, as the sum of seasonal and permanent water.
Quality control variables. Additional waterClasses and calculated ratios between waterClasses for each lake
and year are contained in a separate .csv file (“JRC_all_no_data_proportions_yearly_95thru15.csv”). Data avail-
ability metrics can be joined with the GLCP using the R script “combine_data_availability_metrics_with_glcp.R”.
no_data_km2
Area of 90 m buffered lake, in square kilometers, of no data, as defined by Pekel et al.4.
not_water_km2
Area of 90 m buffered lake, in square kilometers, of not water, as defined by Pekel et al.4.
no_data_to_not_water
Calculated ratio of no_data_km2 derived area to not_water_km2 derived area.
no_data_to_seasonal
Calculated ratio of no_data_km2 derived area to seasonal_km2 derived area.
no_data_to_permanent
Calculated ratio of no_data_km2 derived area to permanent_km2 derived area.
no_data_to_total
Calculated ratio of no_data_km2 derived area to total_km2 calculated area.
Technical Validation
Lake buffer size comparison. As mentioned above, we tested multiple lake buffer sizes, to capture fluctu-
ations in water area that extend beyond the static border of the original HydroLAKES shapefiles. We calculated
waterClass areas for lakes with 30 m, 60 m, 90 m, and 120 m buffers at five-year intervals between 1995 and 2015.
We chose to evaluate buffer sizes using a subsample of years in order to balance extensive temporal coverage with
reduced computing time. The five-year increments captured a range of LANDSAT coverage completeness, where
1995 and 2000 represented years with more spotty coverage and 2005, 2010, and 2015 represented years with
more consistent coverage. Ideally, water area values would increase, then plateau with increasing buffer distance,
indicating that the buffer had captured all available water area changes of the lake. A continual increase in water
area with buffer distance could indicate either very large increases in water area beyond typical lake boundaries
or capture of non-target lake water, such as nearby ponds, rivers, or neighboring lakes.
We approached the issue of appropriate buffer distance in two ways: (1) comparing observed total water area
to HydroLAKES expected lake area and (2) assessing proportional water increases with increasing buffer sizes
across lakes. The first approach also served as validation that our methods were returning values on the same scale
as expected.
To validate GLCP-calculated lake areas, we compared the observed total water area of all 1,422,499 valid lakes
and reservoirs to their expected areas as provided in the HydroLAKES dataset, with 30 m, 60 m, 90 m, and 120 m
buffers (Table 2). Across all buffers and years included, the ratio of observed to expected values had an approx-
imate mean of 0.9 (Table 2). The median and mean for 1995 were smaller than 0.9, for all buffers, which was
expected because of the higher number of zero values in 1995 due to the gaps in LANDSAT coverage.
In selecting the optimal buffer size, we wanted to minimize the proportion of lake area increases due to
increased buffer distance capturing nearby waterbodies, as opposed to true increase in lake size. We focused our
Scientific Data | (2020) 7:174 | https://doi.org/10.1038/s41597-020-0517-4 6www.nature.com/scientificdata/ www.nature.com/scientificdata
Buffer 1st 3rd
(m) Year Min. Qu. Median Mean Qu. Max.
1995 0.000 0.414 0.874 0.690 0.968 2.106
2000 0.000 0.795 0.906 0.863 0.991 2.205
30 2005 0.000 0.813 0.919 0.870 0.997 2.181
2010 0.000 0.803 0.915 0.864 0.997 2.301
2015 0.000 0.818 0.921 0.871 0.997 2.515
1995 0.000 0.424 0.879 0.703 0.975 3.185
2000 0.000 0.805 0.917 0.891 1.011 3.481
60 2005 0.000 0.824 0.930 0.898 1.017 3.367
2010 0.000 0.814 0.925 0.892 1.017 3.769
2015 0.000 0.829 0.931 0.900 1.017 4.095
1995 0.000 0.432 0.883 0.714 0.981 4.208
2000 0.000 0.812 0.924 0.913 1.025 4.769
90 2005 0.000 0.831 0.937 0.921 1.032 4.579
2010 0.000 0.821 0.932 0.915 1.031 5.287
2015 0.000 0.835 0.938 0.924 1.032 5.667
1995 0.000 0.440 0.889 0.726 0.989 5.349
2000 0.000 0.818 0.931 0.935 1.041 6.240
120 2005 0.000 0.839 0.945 0.944 1.048 5.793
2010 0.000 0.829 0.940 0.938 1.047 6.891
2015 0.000 0.843 0.946 0.948 1.049 7.213
Table 2. Ratios of JRC-derived total water area to water area as reported in HydroLAKES for five year intervals
(N = 1,422,499 lakes). Values greater than one indicate observed values greater than expected, and values
smaller than one indicate smaller than expected values.
Buffer:Buffer Size Change 1995 2000 2005 2010 2015
1% increase 15.64% 20.16% 20.81% 20.18% 20.22%
>5% increase 4.49% 8.62% 8.78% 8.58% 8.49%
60 m:30 m
>10% increase 3.65% 9.86% 10.14% 10.23% 10.44%
Decrease 0.01% 0.01% 0.01% 0.01% 0.01%
Zero water area 21.21% 1.74% 1.93% 2.02% 1.91%
1% increase 14.64% 19.65% 20.10% 19.53% 19.49%
>5% increase 3.72% 7.66% 7.85% 7.83% 7.83%
90 m:60 m
>10% increase 2.44% 6.29% 6.52% 6.61% 6.95%
Decrease 0.03% 0.03% 0.03% 0.03% 0.03%
Zero water area 21.16% 1.70% 1.88% 1.96% 1.84%
1% increase 18.11% 23.72% 24.37% 23.86% 23.92%
>5% increase 4.91% 8.53% 8.78% 8.72% 8.91%
120 m:90 m
>10% increase 2.61% 4.88% 5.10% 5.18% 5.46%
Decrease 0.02% 0.02% 0.02% 0.02% 0.02%
Zero water area 21.12% 1.65% 1.83% 1.91% 1.79%
Table 3. Buffer comparisons for five year intervals with percent of lakes (N = 1,422,499) 10% increase in total water surface area.
analysis on the proportion of lakes that increase >1% in total water area as buffer distance increased. This per-
centage was lowest between 60 m and 90 m (Table 3). As the buffer was extended to 120 m, the proportion of lakes
displaying >1% increase also increased. While this proportional increase may be valid in some cases, we broadly
interpret this change to represent capture of nearby waterbodies as the buffer increases from 90 m to 120 m. Lakes
increasing greater than 1%, 5%, and 10% for all calculated years and buffer sizes accounted for 13.2%, 5.6%, and
1.9% of all GLCP lakes, respectively. These results suggest that if a GLCP lake was influenced by neighboring
waterbodies, it would at most account for a > 1% increase in 13.2% of GLCP lakes, >5% increase for 5.6% of
GLCP lakes, and a > 10% increase for 1.9% of GLCP lakes. Summary statistics for lakes increasing at least 1% are
documented in Table S1.
Scientific Data | (2020) 7:174 | https://doi.org/10.1038/s41597-020-0517-4 7www.nature.com/scientificdata/ www.nature.com/scientificdata
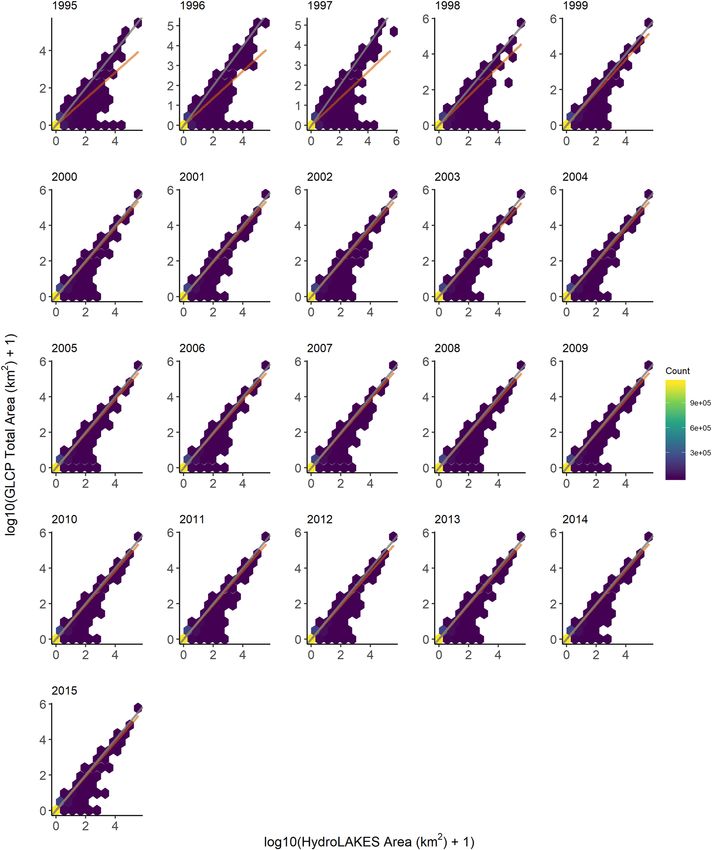
As a result of proportional increases from 90 m to 120 m, we determined that a 90 m buffer was the best option
for minimizing under- and over-estimation of total water area. Interannual comparisons of HydroLAKES areas
to GLCP-calculated total areas also demonstrated relatively consistent values for all lakes across all years (Fig. 2;
Table S2). Likewise, the same pattern was observed when comparing interannual GLCP-calculated water areas
(Table S3). While 1995–1998 interannual comparisons deviated more markedly from the 1:1 line (Fig. 2), this is
largely an artifact of LANDSAT coverage missing from 1996–19984.
Lakes with zero total area values for all years. Pekel et al.4 report validation results for the JRC dataset,
including errors by sensor type and seasonality class. Commission accuracy ranges from ~98–99% while omis-
sion accuracy varies more widely, from ~74–99%, with lowest accuracy for seasonal water pixels. Of the 1,422,499
lakes in the GLCP, only 12,534 lakes had a zero total water area value for all time points (i.e., water never identified
within lake borders). Therefore, we have approximately 99% accuracy in terms of detecting water within a lake for
the global lakes considered in the GLCP.
Assuming 99% accuracy in water detection, lakes with zero values for total water area represent a suite of possi-
bilities. First, zeroes could represent real instances of zero water surface area (i.e., lake has dried up). Second, zeros
could represent real missing (NA) values from incomplete LANDSAT coverage for certain locations and years.
Third, zero area values could represent a mis-identified HydroLAKES polygon (i.e., not an actual lake in that loca-
tion)36. Fourth, zero values could be due to permanently frozen lakes, which the JRC algorithm does not identify
as “water”. Temporal location of zero area lakes can guide interpretation of zero values. For instance, a zero value
for 2005, but non-zero values for all other time points of interest, potentially indicates a “true” zero (i.e., a lake
drying and refilling or a lake being frozen one year and thawing the next). Likewise, a lake with non-zero values for
1995–2005, with zero values subsequently, suggests a scenario of a lake drying and remaining dry. Conversely, zeros
for 1995 only or 2015 only are more challenging to interpret: as end points of our temporal range, it is difficult to
determine whether these zero values are true zeros or NA values. Temporal location of zero values is of less assistance
in cases where lakes may be permanently frozen and therefore pixels were categorized as not water.
Climate comparison. While the JRC and GPW datasets represent the best available global datasets to date
for water extent and population for our time range, there are multiple sources possible for global, long-term cli-
mate data. We selected MERRA-2 for GLCP climate data because MERRA2 had the finest spatial and temporal
resolutions in comparison to similar global climate datasets. Additionally, along with including various tempera-
ture and precipitation variables, MERRA-2 includes a wide variety of other climate variables should future users
wish to expand this workflow to investigate other possible correlates. To test that our workflow maintained the
integrity the MERRA-2 data, as well as check for general scale of differences in results compared to alternative
climate data sources, we compared MERRA2-derived climate data to equivalent basin-scale results derived from
the University of Delaware Air Temperature and Precipitation V5.01 (UDATP) dataset37. The UDATP is a global
gridded climate dataset with 0.05 × 0.05 decimal degree resolution of monthly average air temperature and accu-
mulated precipitation.
Both MERRA-2 and UDATP mean annual temperature and mean monthly precipitation were broadly con-
sistent throughout the 21 years. For temperature, greater incongruences between UDATP and MERRA2 were
observed at colder temperatures, whereas warmer temperatures tended to be more consistent between data
sources (Fig. S1). For precipitation, we observed greater deviations from the 1:1 line, although trend lines were
similar to a 1:1 trend (Fig. S1). The discrepancies between MERRA-2 and UDATP are consistent with previous
observations that these discrepancies are likely due to how UDATP and MERRA-2 incorporate observation-based
corrections38.
Given the potential changes in interpretation of lake area change in the context of temperature and precipi-
tation variables based on which climate dataset is used, we recommend future users interested in understanding
how climate may correlate with or predict lake area should compare various climate datasets.
Manual quality control. To ensure integrity of data through each level of data harmonization, we sampled 250
2
lakes and manually evaluated their year-to-year percent differences (e.g., total _ km1995
2
− total _ km 1996 ) in area and
total _ km1995 + total _ km1996 ∗ 100
2 2
2
climate variables through visual inspection of individual lake values (Table 4). A stratified random sample of 250 lakes
was collected via the following process: We used continent-level shapefiles to spatially subset a dataset of HydroLAKES
centroids into separate datasets for each continent. A random sample of HydroLAKES Hylak_ids was then taken from
each continent’s dataset based on the proportion of lakes in the full HydroLAKES dataset originating from that conti-
nent. In some cases we sampled an additional lake to ensure that a full sample of 250 Hylak_ids was achieved when
rounding would otherwise have led to a sample size smaller than 250. Variables were a priori hypothesized to have an
overall low degree of interannual variation by assuming that most lakes do not undergo large interannual changes in
area and climate. In instances of high variation, this process would identify specific outliers that could be explained by
local anomalies (e.g., extensive drought, ENSO). Of the 250 lakes and basins sampled, interannual percent differences
for climate variables (i.e., temperature, total annual precipitation, and mean monthly precipitation) were smallest
(Table 4). Water area interannual percent differences were smallest for permanent and total water, whereas seasonal
water area had a comparably larger range of interannual percent differences (Table 4). Population interannual percent
differences were highest among all variables (Table 4), which is likely due to the coarser temporal resolution of the
population data. Percent difference values ranging from −200% to +200% indicates that variables went from a value of
zero to a non-zero value. Because values consistently remained within a fairly constant range of year-to-year values, this
comparison suggests that data integrity did not substantially degrade during the harmonization process.
Scientific Data | (2020) 7:174 | https://doi.org/10.1038/s41597-020-0517-4 8www.nature.com/scientificdata/ www.nature.com/scientificdata
Fig. 2 Comparison of 90 m buffer total water areas from JRC to reported lake areas in HydroLAKES. The grey
diagonal line is the 1:1 line, where a value on the 1:1 grey line implies no difference between data sources. Color
of hexbin indicates the number of lakes contained within a bin. The orange line is a linear regression for all
points. The orange regression line tends to deviate more markedly for comparisons among the mid- to late-
1990s. This is likely due to sparse LANDSAT coverage during the mid-to-late 1990s. Starting in 1999, though,
the orange and grey lines are nearly identical, which would be expected as LANDSAT coverage in 1999 and
2000 incorporated more complete global coverage, particularly in Siberia and Greenland. Scales have been log-
transformed in order to show a more even spread of data points, as most lakes are less than 10 km2.
To ensure integrity of the data across countries, we randomly sampled 60 countries from those represented
within the GLCP (33.8%), and compared ranges of values for each variable with reported values from various
online resources (e.g., World Bank, United Nations). This process confirmed that observed values and ranges for
Scientific Data | (2020) 7:174 | https://doi.org/10.1038/s41597-020-0517-4 9www.nature.com/scientificdata/ www.nature.com/scientificdata
Variable Min. 1st Qu. Median Mean 3rd Qu. Max.
total_precip_mm −98.64 −13.38 −0.62 −0.41 11.85 95.77
mean_monthly_precip_mm −98.64 −12.86 −0.24 0.02 12.16 95.77
mean_annual_temp_k −1.74 −0.34 0.02 0.02 0.36 1.78
pop_sum −200.00 −42.27 11.88 −42.08 2.17 198.98
seasonal_km2 −200.00 −31.89 0.88 3.34 37.63 200.00
permanent_km2 −200.00 −2.58 0.00 1.58 2.65 200.00
total_km2 −200.00 −2.54 0.00 2.14 2.83 200.00
Table 4. Summary table (minimum, 1st quartile, median, mean, 3rd quartile, and maximum) of interannual
percent difference for 250 spatially stratified lakes used for manual QA/QC. The range of percent differences was
bounded between −200 and +200 percent, implying a year-to-year change in value from zero to non-zero.
each calculated lake area, climate, and human demographic variables were largely consistent with independently
reported values.
Quantifying effects of processor heterogeneity. When recreating the GLCP from its original inputs,
we noted slight (e.g., 1e-12) differences between script runs. Because production of the GLCP required a hetero-
geneous computational architecture (in our case, Google Earth Engine), floating-point values may vary depend-
ing on the make and model of processor used if users create the GLCP de novo39. While particular processors in
the Google Earth Engine API were likely heterogeneous and not specified, post-GEE processing was completed
with a homogeneous Intel Xeon Processor E5-2680 v2 (ivybridge) consisting of 20 cores (2 sockets and 10 cores
per socket) and 256 GB memory. To quantify differences in GLCP-derived values as a result of processor hetero-
geneity, we recreated the GLCP three times and calculated percent difference for each computed value within the
R environment (Table S4). Percent differences were very low for each variable (Table S4) and are likely not signif-
icant for most future applications. Care, however, should be taken if users recreate the GLCP from its raw inputs,
as potential differences in floating decimals may lead to slightly different calculated values. The extent to which
these values would influence results or conclusions of future studies will depend on the level of precision required.
Usage Notes
The GLCP can be applied to a suite of research situations pertaining to lake water quantity, including using
water area as a proxy for volume when such data are not available. We highlight two main areas for immediate
application.
First, the GLCP can be joined with other global hydrologic and climate datasets to synthesize global changes
in water quantity and quality. For example, the GLCP could be merged with measurements of change in subsur-
face water quantity from GRACE data3 to assess how changes in lake water quantity may co-vary with changes
in groundwater quantity. Similarly, the GLCP could be merged with lake water quality data from organizations
such as the Global Lake Ecological Observatory Network (GLEON)40 to address questions of how changes in lake
water quantity may co-vary with changes in lake water quality. Beyond incorporating existing lake-related data
sources, other climate variables (e.g., wind speed, humidity) could be calculated and incorporated by using the
HydroBASINS shapefiles and Google Earth Engine in a similar process to that described above. Aside from add-
ing new variables, the framework used to produce the GLCP is flexible enough to incorporate new lake and basin
shapefiles (e.g., GLOWABO2). While the GLCP focuses on lakes of at least 10 ha in size, lakes smaller than 10 ha
may be necessary for addressing ecological and biogeochemical questions and in evaluating continental- and
global-scale carbon cycling41,42 as well as spatio-temporal variation in lake ecosystem properties43.
Second, the GLCP can be used to create a common georeference for multi-source data to increase research
efficiency by allowing users to quickly assimilate disparate data for location-specific studies. Similar to the man-
ner in which the U.S. Environmental Protection Agency’s National Lake Assessment (NLA) has been used to
compare individual lake’s water quality to that of the region44, the GLCP can be used to: (1) compare how a given
lake’s surface area may compare to any other lake’s during any given year and (2) create a time series of lake sur-
face area as well as basin climate and population. In doing so, the GLCP could be used by local natural resource
managers by providing long-term lake characteristics as a potential explanation for biological phenomena.
Given its potential for future applications, the GLCP dataset serves not only as a streamlined resource for
exploring changes in lake-specific surface area over the past two decades, but also provides future data users a
powerful tool to contextualize lake area changes with co-located climate and population data.
Code availability
All Google Earth Engine and R scripts are available from the Environmental Data Initiative GLCP repository27
within the entity “glcp.tar.gz”. The entity “glcp.tar.gz” also includes a standardized directory architecture that
can be downloaded and run locally if users wish to reproduce the GLCP. If future users would like to access only
scripts used to create the GLCP, the EDI GLCP repository also contains the entity “glcp_scripts.tar.gz”, which
contains Google Earth Engine and R scripts.
Received: 25 November 2019; Accepted: 11 May 2020;
Published: xx xx xxxx
Scientific Data | (2020) 7:174 | https://doi.org/10.1038/s41597-020-0517-4 10www.nature.com/scientificdata/ www.nature.com/scientificdata
References
1. Lehner, B. & Döll, P. Development and validation of a global database of lakes, reservoirs and wetlands. J. Hydrol. 296, 1–22 (2004).
2. Verpoorter, C., Kutser, T., Seekell, D. A. & Tranvik, L. J. A global inventory of lakes based on high-resolution satellite imagery.
Geophys. Res. Lett. 41, 6396–6402 (2014).
3. Richey, A. S. et al. Quantifying renewable groundwater stress with GRACE. Water Resour. Res. 51, 5217–5238 (2015).
4. Pekel, J.-F., Cottam, A., Gorelick, N. & Belward, A. S. High-resolution mapping of global surface water and its long-term changes.
Nature 540, 418–422 (2016).
5. Feng, M., Sexton, J. O., Channan, S. & Townshend, J. R. A global, high-resolution (30-m) inland water body dataset for 2000: first
results of a topographic–spectral classification algorithm. Int. J. Digit. Earth 9, 113–133 (2016).
6. Sheng, Y. et al. Representative lake water extent mapping at continental scales using multi-temporal Landsat-8 imagery. Remote Sens.
Environ. 185, 129–141 (2016).
7. Yao, F., Wang, J., Wang, C. & Crétaux, J.-F. Constructing long-term high-frequency time series of global lake and reservoir areas
using Landsat imagery. Remote Sens. Environ. 232, 111210 (2019).
8. Anderson, L., Birks, J., Rover, J. & Guldager, N. Controls on recent Alaskan lake changes identified from water isotopes and remote
sensing. Geophys. Res. Lett. 40, 3413–3418 (2013).
9. LaDeau, S. L., Han, B. A., Rosi-Marshall, E. J. & Weathers, K. C. The next decade of big data in ecosystem science. Ecosystems 20,
274–283 (2017).
10. Hampton, S. E. et al. The Tao of open science for ecology. Ecosphere 6, art120 (2015).
11. Martin, S. L. & Soranno, P. A. Lake landscape position: relationships to hydrologic connectivity and landscape features. Limnol.
Oceanogr. 51, 801–814 (2006).
12. Soranno, P. A. et al. Spatial variation among lakes within landscapes: ecological organization along lake chains. Ecosystems 2,
395–410 (1999).
13. Messager, M. L., Lehner, B., Grill, G., Nedeva, I. & Schmitt, O. Estimating the volume and age of water stored in global lakes using a
geo-statistical approach. Nat. Commun. 7, 13603 (2016).
14. ArcGIS Desktop: Release 10.3.1. Environmental Systems Research Institute (2015).
15. Lehner, B. & Grill, G. Global river hydrography and network routing: baseline data and new approaches to study the world’s large
river systems. Hydrol. Process. 27, 2171–2186 (2013).
16. Lehner, B., Verdin, K. & Jarvis, A. New Global Hydrography Derived From Spaceborne Elevation Data. Eos Trans. Am. Geophys.
Union 89, 93–94 (2008).
17. Gelaro, R. et al. The Modern-Era Retrospective Analysis for Research and Applications, Version 2 (MERRA-2). J. Clim. 30,
5419–5454 (2017).
18. MERRA-2 tavg1_2d_flx_Nx: 2d,1-Hourly,Time-Averaged,Single-Level,Assimilation,Surface Flux Diagnostics V5.12.4, https://doi.
org/10.5067/7MCPBJ41Y0K6 (2015).
19. Center for International Earth Science Information Network Gridded Population of the World Version 3 (GPWv3): Population Count
Grid, https://doi.org/10.7927/H4639MPP (2005).
20. Center for International Earth Science Information Network Gridded Population of the World Version 4 (GPWv4): Population Count,
Revision 11, https://doi.org/10.7927/H4JW8BX5 (2018).
21. Doxsey-Whitfield, E. et al. Taking advantage of the improved availability of census data: a first look at the gridded population of the
world, version 4. Pap. Appl. Geogr. 1, 226–234 (2015).
22. Gorelick, N. et al. Google Earth Engine: Planetary-scale geospatial analysis for everyone. Remote Sens. Environ. 202, 18–27 (2017).
23. R Core Team. R: A Language and Environment for Statistical Computing, version 3.4.2, https://www.r-project.org (2017).
24. Dowle, M. & Srinivasan, A. Data.table: Extension of ‘data.frame’ (2019).
25. Wickham, H., Francois, R., Henry, L. & Muller, K. dplyr: A Grammar of Data Manipulation (2018).
26. Wickham, H. & Henry, L. tidyr: Easily Tidy Data with ‘spread()’ and ‘gather()’ Functions (2018).
27. Labou, S. G., Meyer, M. F., Brousil, M. R., Cramer, A. N. & Luff, B. T. Global Lake area, Climate, and Population (GLCP) dataset.
Environmental Data Initiative, https://doi.org/10.6073/pasta/834e2d4e8ee7eb2fa9a5a5b32d759683 (2020).
28. Reichle, R. H. et al. Land surface precipitation in MERRA-2. J. Clim. 30, 1643–1664 (2017).
29. Reichle, R. H. et al. Assessment of MERRA-2 Land Surface Hydrology Estimates. J. Clim. 30, 2937–2960 (2017).
30. Pierce, D. ncdf4: Interface to Unidata netCDF (Version 4 or Earlier) Format Data Files (2019).
31. Hijmans, R. J. raster: Geographic Data Analysis and Modeling (2019).
32. Bivand, R., Keitt, T. & Rowlingson, B. rgdal: Bindings for the ‘Geospatial’ Data Abstraction Library (2019).
33. Revolution Analytics & Weston, S. doParallel: Foreach Parallel Adaptor for the ‘parallel’ Package (2019).
34. Tierney, L., Rossini, A. J., Li, N. & Sevcikova, H. snow: Simple Network of Workstations (2018).
35. Wickham, H. stringr: Simple, Consistent Wrappers for Common String Operations (2019).
36. Soranno, P. A. et al. Building a multi-scaled geospatial temporal ecology database from disparate data sources: fostering open science
and data reuse. GigaScience 4, 28 (2015).
37. Willmott, C. J. & Matsuura, K. Terrestrial Air Temperature and Precipitation: Monthly and Annual Time Series (1950–1999), http://
climate.geog.udel.edu/~climate/html_pages/README.ghcn_ts2.html (2001).
38. Bosilovich, M. G. et al. Technical report series on global modeling and data assimilation, volume 43. MERRA-2; initial evaluation of the
climate (2015).
39. Blackford, L. S. et al. Practical experience in the numerical dangers of heterogeneous computing. ACM Trans. Math. Softw. TOMS
23, 133–147 (1997).
40. Weathers, K. C. et al. The Global Lake Ecological Observatory Network (GLEON): the evolution of grassroots network science.
Limnol. Oceanogr. Bull. 22, 71–73 (2013).
41. Wetzel, R. G. Land-water interfaces: Metabolic and limnological regulators. SIL Proc. 1922-2010 24, 6–24 (1990).
42. Cole, J. J. et al. Plumbing the Global Carbon Cycle: Integrating Inland Waters into the Terrestrial Carbon Budget. Ecosystems 10,
172–185 (2007).
43. Soranno, P. A. et al. Spatial and temporal variation of ecosystem properties at macroscales. Ecol. Lett. 22, 1587–1598 (2019).
44. Pollard, A. I., Hampton, S. E. & Leech, D. M. The Promise and Potential of Continental-Scale Limnology Using the US
Environmental Protection Agency’s National Lakes. Assessment. Limnol. Oceanogr. Bull. 27, 36–41 (2018).
Acknowledgements
We would like to thank the following individuals for diverse technical and creative support: Pekel et al.4 for
their herculean work and openness in making these data publicly available. Sasha Richey and Julie Padowski
for valuable feedback in developing this project. The Washington State University Center for Institutional
Research Computing, Peter Mills, Rohit Dhariwal, Nicholas B. Engdahl, Kirti Rajagopalan, and Anantharaman
Kalyanaraman for computing advice and expertise. Stephanie E. Hampton, Stephen L. Katz, Jason J. Williams,
Christian D. Guzman, Stephen M. Powers, and Von P. Walden for reviewing an earlier version of this manuscript.
Brian P. Lanouette, John R. Loffredo, John Jorgensen, Stephen M. Powers, and Kim Castelin for reviewing this
Scientific Data | (2020) 7:174 | https://doi.org/10.1038/s41597-020-0517-4 11www.nature.com/scientificdata/ www.nature.com/scientificdata
work prior to its presentation at the American Geophysical Union 2018 conference. Gennadii Dochyts and Luca
De Felice for reviewing Google Earth Engine scripts. Kara. H. Woo and Stephen L. Katz for reviewing R scripts.
Kara H. Woo, Stephen L. Katz, Julian J. Reyes, and Jianning Ren for reviewing the dataset for integrity and ease
of use. Dr. Gavin Simpson and two anonymous reviewers for improving the clarity and thoroughness of this
manuscript. This work was funded in part by an NSF GRF to MFM (DGE-1347973). The GLCP data product
incorporates data from the HydroSHEDS database which is © World Wildlife Fund, Inc. (2006–2013) and has
been used herein under license. WWF has not evaluated the data as altered and incorporated within GLCP,
and therefore gives no warranty regarding its accuracy, completeness, currency or suitability for any particular
purpose. Portions of the HydroSHEDS database incorporate data which are the intellectual property rights of ©
USGS (2006–2008), NASA (2000–2005), ESRI (1992–1998), CIAT (2004–2006), UNEP-WCMC (1993), WWF
(2004), Commonwealth of Australia (2007), and Her Royal Majesty and the British Crown and are used under
license. The HydroSHEDS database and more information are available at http://www.hydrosheds.org.
Author contributions
Conceptualized the project: M.F.M., S.G.L., A.N.C. Created and contributed to the workflow for the project:
S.G.L., M.F.M., M.R.B., A.N.C. Contributed to writing Google Earth Engine Scripts: B.T.L., M.F.M., S.G.L.,
A.N.C. Contributed to writing R Scripts: M.F.M., S.G.L., M.R.B., A.N.C. QA/QC process: M.R.B., M.F.M. Data
management: M.F.M., M.R.B. Contributed to the writing and editing of the manuscript: all authors. Approved
final version of the manuscript: all authors.
Competing interests
The authors declare no competing interests.
Additional information
Supplementary information is available for this paper at https://doi.org/10.1038/s41597-020-0517-4.
Correspondence and requests for materials should be addressed to M.F.M.
Reprints and permissions information is available at www.nature.com/reprints.
Publisher’s note Springer Nature remains neutral with regard to jurisdictional claims in published maps and
institutional affiliations.
Open Access This article is licensed under a Creative Commons Attribution 4.0 International
License, which permits use, sharing, adaptation, distribution and reproduction in any medium or
format, as long as you give appropriate credit to the original author(s) and the source, provide a link to the Cre-
ative Commons license, and indicate if changes were made. The images or other third party material in this
article are included in the article’s Creative Commons license, unless indicated otherwise in a credit line to the
material. If material is not included in the article’s Creative Commons license and your intended use is not per-
mitted by statutory regulation or exceeds the permitted use, you will need to obtain permission directly from the
copyright holder. To view a copy of this license, visit http://creativecommons.org/licenses/by/4.0/.
The Creative Commons Public Domain Dedication waiver http://creativecommons.org/publicdomain/zero/1.0/
applies to the metadata files associated with this article.
© The Author(s) 2020
Scientific Data | (2020) 7:174 | https://doi.org/10.1038/s41597-020-0517-4 12You can also read