Data Management System for a Semiautonomous Shuttle Car for Underground Room and Pillar Coal Mines - MDPI
←
→
Page content transcription
If your browser does not render page correctly, please read the page content below
Article
Data Management System for a Semiautonomous Shuttle Car
for Underground Room and Pillar Coal Mines
Vasilis Androulakis * , Steven Schafrik                        , Joseph Sottile and Zach Agioutantis

                                             Mining and Minerals Resources Bldg, University of Kentucky, Lexington, KY 40506, USA;
                                             steven.schafrik@uky.edu (S.S.); joseph.sottile@uky.edu (J.S.); zach.agioutantis@uky.edu (Z.A.)
                                             * Correspondence: vandroulakis@uky.edu

                                             Abstract: In recent years, autonomous solutions in the multidisciplinary field of mining engineering
                                             have been an extremely popular applied research topic. This is a result of the increasing demands of
                                             society on mineral resources along with the accelerating exploitation of the currently economically
                                             viable resources, which lead the mining sector to turn to deeper, more-difficult-to-mine orebodies. An
                                             appropriate data management system comprises a crucial aspect of the designing and the engineering
                                             of a system that involves autonomous or semiautonomous vehicles. The vast volume of data collected
                                             from onboard sensors, as well as from a potential IoT network dispersed around a smart mine,
                                             necessitates the development of a reliable data management strategy. Ideally, this strategy will allow
                                             for fast and asynchronous access to the data for real-time processing and decision-making purposes
                                             as well as for visualization through a corresponding human–machine interface. The proposed system
                                   has been developed for autonomous navigation of a coalmine shuttle car and has been implemented

                                             on a 1/6th scale shuttle car in a mock mine. It comprises three separate nodes, namely, a data
Citation: Androulakis, V.;                   collection node, a data management node, and a data processing and visualization node. This
Schafrik, S.; Sottile, J.; Agioutantis, Z.   approach was dictated by the large amount of collected data and the need to ensure uninterrupted
Data Management System for a
                                             and fast data management and flow. The implementation of an SQL database server allows for
Semiautonomous Shuttle Car for
                                             asynchronous, real-time, and reliable data management, including data storage and retrieval. On the
Underground Room and Pillar Coal
                                             other hand, this approach introduces latencies between the data management node and the other two
Mines. Automation 2021, 2, 153–172.
                                             nodes. In general, these latencies include sensor latencies, network latencies, and processing latencies.
https://doi.org/10.3390/
automation2030010
                                             However, the data processing and visualization module is able to retrieve and process the latest
                                             data and make a decision about the next optimal movement of the shuttle car prototype in less than
Academic Editor: João Miguel da              900 ms. This allows the prototype to navigate efficiently around the pillars without interruptions.
Costa Sousa
                                             Keywords: mining industry; autonomous navigation; shuttle car; room and pillar mining;
Received: 25 May 2021                        data management
Accepted: 11 August 2021
Published: 13 August 2021

Publisher’s Note: MDPI stays neutral         1. Introduction
with regard to jurisdictional claims in
                                                  In recent years, autonomous solutions in the multidisciplinary field of mining engi-
published maps and institutional affil-
                                             neering have been an extremely popular applied research topic. The increasing demands
iations.
                                             of society on mineral resources, along with the accelerating exploitation of the currently
                                             economically viable resources, have led the mining sector to turn to deeper, more-difficult-
                                             to-mine orebodies. To achieve this, the mining industry needs to continue to modernize and
                                             advance mining technology. One of the trends is the integration of autonomous vehicles
Copyright: © 2021 by the authors.
                                             and solutions into the mining cycle [1].
Licensee MDPI, Basel, Switzerland.
                                                  The increasing appeal of integrating autonomous vehicles into the mining cycle lies
This article is an open access article
                                             primarily on two aspects that need to be optimized in every mine: safety and productivity.
distributed under the terms and
                                             A significant improvement of the health and safety of the miners can be achieved by
conditions of the Creative Commons
                                             relocating equipment operators and other miners to a safer and healthier environment.
Attribution (CC BY) license (https://
                                             Equipment operators are inherently exposed to numerous occupational hazards: noise;
creativecommons.org/licenses/by/
4.0/).
                                             dust; vibration; thermal stress; inclement weather; slips, trips, and falls from climbing

Automation 2021, 2, 153–172. https://doi.org/10.3390/automation2030010                                        https://www.mdpi.com/journal/automation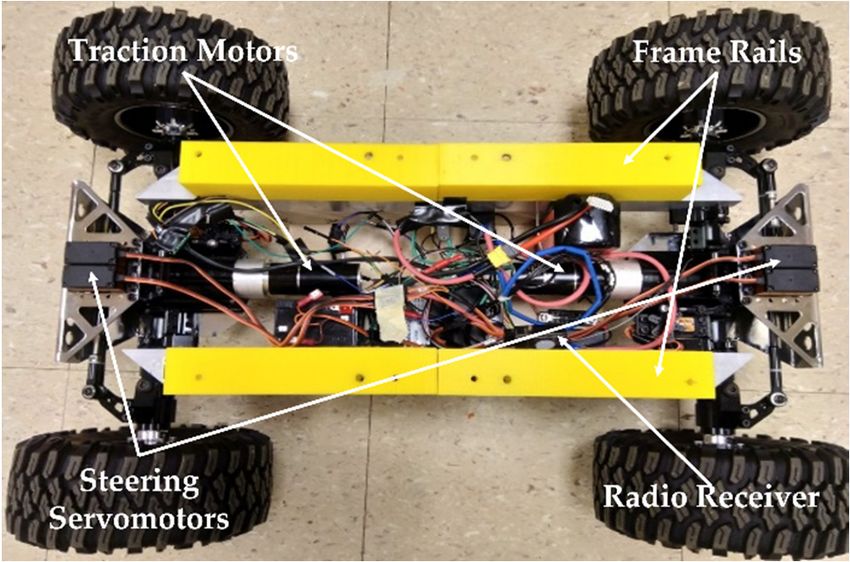
Automation 2021, 2                                                                                             154

                     on and off equipment; crushes by heavy equipment; injuries by roof and rib falls; and
                     fatigue-related accidents. Relocation of the operators from an active mine setting to a safer
                     environment of a control room, even kilometers away, can effectively reduce accidents and
                     exposure to unhealthy and unsafe conditions. At the same time, delegating tasks from
                     humans to machines can potentially increase the productivity of the mining cycle. The
                     inherent accuracy and efficiency of autonomous solutions are the main advantages over
                     the human operator, especially for repetitive tasks. In some cases, advantages in terms of
                     safety and productivity are reported where mining can continue when health risks would
                     normally prohibit personnel from working, such as shortly after a blast before noxious gases
                     have been diluted by the ventilation system. Optimizing energy and fuel consumption,
                     regulating the flow of traffic with efficient fleet management, and reducing damage to
                     equipment are a few other advantages that autonomous solutions can offer, leading to
                     uninterrupted mining operations, as well as reduced production and maintenance costs.
                           The integration of autonomous vehicles into the underground mining cycle requires a
                     multidisciplinary approach that will help resolve the various technical, safety, and human
                     resource challenges that may arise. This is not a trivial task because many aspects affect
                     such an endeavor: automation technology, systems engineering and management processes
                     around automation, human factors engineering in automated and semiautomated systems,
                     and social and political risks of automation in terms of shared value and sustainable
                     development [2–4].
                           An appropriate data management system (DMS) comprises a crucial aspect of the
                     designing and the engineering of an autonomous or semiautonomous system. The vast
                     volume of data collected from onboard sensors or from a potential Internet of Things (IoT)
                     network dispersed around a smart mine necessitates the development of a reliable data
                     management strategy. Ideally, this strategy will allow for fast and asynchronous access to
                     the data with respect to real-time processing and decision-making purposes, as well as for
                     visualization through a corresponding human–machine interface.
                           This paper presents the data management system implemented when integrating an
                     autonomous shuttle car into the room and pillar underground coal mining cycle. More
                     specifically, it discusses an asynchronous data collection and management system that
                     facilitates the development and testing of a 1/6th scale shuttle car prototype. The laboratory
                     setup and the approach followed for the data management and the workflow of the
                     processes that enable the prototype to navigate autonomously around the pillars are
                     described in detail.
                           Section 2 discusses the current trends of commercial implementation of autonomous
                     solutions within mining operations and describes associated data management paradigms.
                     Section 3 presents a brief description of the constructed lab-scale shuttle car and the data
                     collection approach. Section 4 describes the workflow of the developed software stack that
                     helps the lab-scale prototype navigate autonomously. Section 5 discusses the advantages
                     and disadvantages of the proposed data management system. Finally, Section 6 presents a
                     summary and the conclusion of this study.
                           It should also be noted that both the physical simulation environment (described in
                     Section 3) and the developed software (described in Section 4) consider only simplified
                     conditions. Since the main aim of this ongoing research is to determine the feasibility
                     of autonomous navigation around pillars in underground mines and provide a simpli-
                     fied real-scale demonstration, an exhaustive consideration of industrial safety protocols
                     and regulations or complex interactions between the various equipment operating in the
                     working environment was deemed to be beyond the scope of this study. Despite these
                     simplifications, the authors believe that useful insights can be conveyed by this study.

                     2. Autonomous Vehicles for Mining Applications
                         Several mining companies around the world have combined forces with mining
                     equipment manufacturers and autonomous solutions companies towards implementing
                     automated vehicles for the tasks of cutting, drilling, loading, and materials haulage.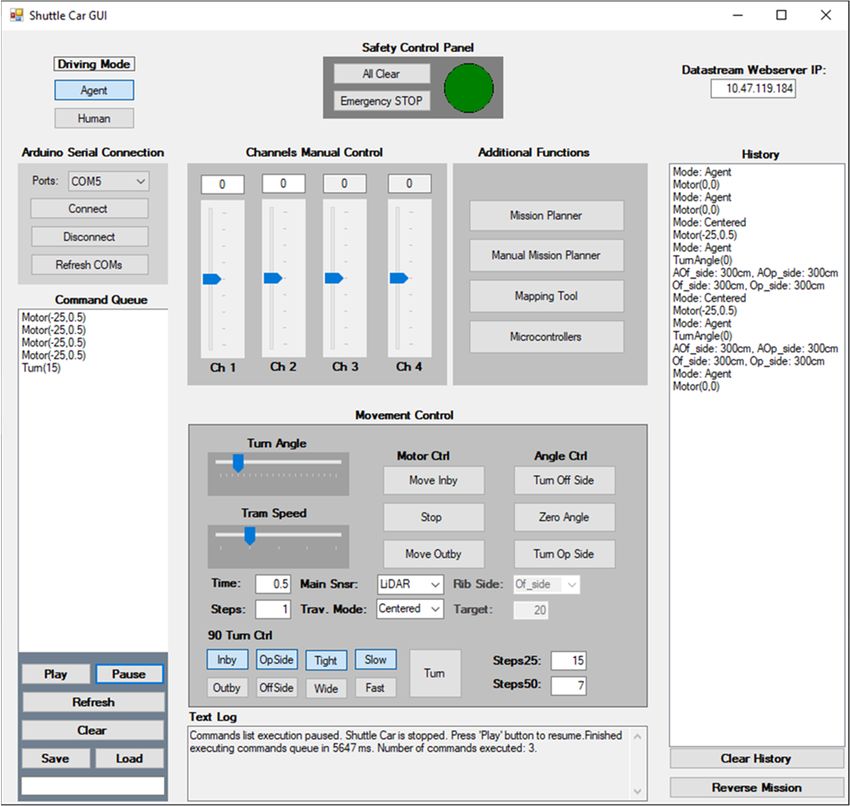
Automation 2021, 2                                                                                            155

                            The common target for implementing autonomous solutions in surface mines is the
                     control of haul trucks and surface dozers. Haul trucks, wheel loaders, and load–haul–
                     dump (LHD) equipment attract great interest for automation projects in underground
                     mines as well. The longwall shearer system is widely used. In addition, drilling and cutting
                     equipment for both surface and underground environments present attractive autonomous
                     solutions for mining companies. Moreover, as the employment of autonomous vehicles
                     and equipment in mining environments leads to the need for collecting and processing vast
                     amounts of data, several companies have started developing data management systems,
                     mining and mineral processing monitoring systems, and big data analytics solutions [5].
                            The longwall shearer for underground coalmines is one of the first pieces of mining
                     equipment to be automated to protect workers from roof caving in relatively soft formations
                     where longwalls are commonly employed. Nowadays, these systems exhibit centimeter
                     precision and are still continuously being advanced [6]. In the last few decades, extensive
                     research and experimentation have been conducted with teleoperated LHD equipment
                     in various mines around the world [2,3,7,8]. Autonomous haulage systems that deploy
                     fleets of wheel trucks and wheel loaders have gained great interest as well among leading
                     companies, such as Komatsu America Corp.; Hitachi Construction Machinery Co., Ltd.;
                     and Caterpillar, Inc., that have commercially implemented such systems [9–11]. Other
                     mining equipment targeted for autonomous operation include drills, roof bolters, and
                     continuous miners [12–15]. Artificial intelligence, data management, network efficiency,
                     and human factors are a few additional aspects that complement autonomous solutions in
                     the mining sector that the research community strives to address [16–18].
                            The level of advancement in the operation and management of autonomous machinery
                     in the abovementioned cases varies with regard to three main aspects: (a) autonomy level
                     (i.e., teleoperated to fully autonomous), (b) vehicle management (i.e., single-machine
                     operation to fleet management), and (c) operation environment (i.e., surface-only operation
                     to hybrid (surface and underground) operation). A common point is the preference of the
                     industry for automating haulage trucks. Considering that the operation of this machinery
                     consists of one of the most time-consuming parts of the mining cycle, as well as the
                     necessity of navigating long distances through a constantly changing environment, both
                     on the surface and underground, this choice becomes clear.
                            On the other hand, the prevalent equipment used for material haulage in underground
                     coal mines, the shuttle car, has not been a popular choice for conversion to autonomous
                     operation. There are several reasons for this, one of which is the small market size. Another
                     is the lack of industrial or academic research published on this topic.
                            However, in all these cases, the operation of autonomous machinery in an under-
                     ground environment imposes significant complexities to the development of reliable sys-
                     tems. Some of these challenges include the continuously changing and confined space of
                     the working environment, the human machine interaction, the lack of the Global Position-
                     ing System (GPS), the limitations in wireless communications, the limitations in movement
                     imposed by the presence of power cables and ventilation controls, and the occlusion in the
                     sensor data caused by suspended dust and ventilation curtains [19].
                            An automation system of this type is inevitably accompanied by an appropriate
                     data management system (DMS). The design of a DMS is imperative because the reliable
                     collection of, and access to, the sensor data is the cornerstone of an autonomous system. The
                     performance of the DMS, in terms of speed and reliability, directly determines the speed
                     and reliability of the update rate of the machine’s situational awareness. Consequently,
                     the validity and reliability of any real-time decision making are defined by the DMS.
                     The publicly available information in the literature about the specific DMS utilized in
                     commercial applications, such as those described above, is expectedly limited. The different
                     cooperative schemes between mining companies and autonomous solutions providers
                     develop custom-built software stacks depending on the nature of the mining operation and
                     the vehicle and sensors employed. Therefore, the DMS that accompanies these systems is
                     highly customized. Moreover, the automation systems, as well as the DMSs, continuously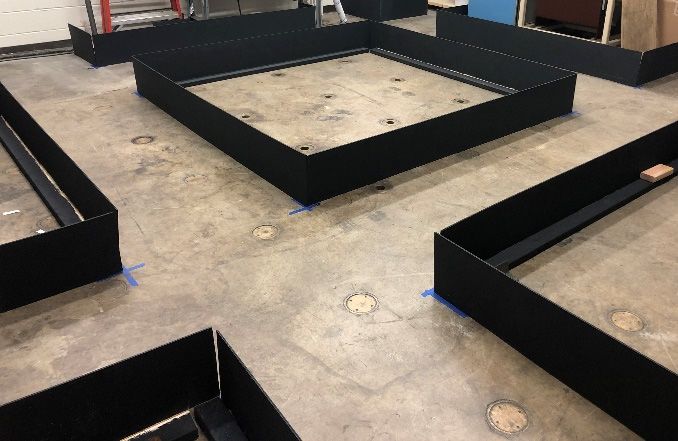
Automation 2021, 2                                                                                            156

                     evolve based on the performance of the systems in the field. Data collected through
                     experimentation and feedback from operators significantly contribute to the advancement
                     of the system and the DMS.
                           Data management systems are used for storing data that are to be analyzed either
                     in real time or retrospectively. In recent years, advancements in network efficiency, data
                     storage, and processing speed enable more and more systems to store and analyze data
                     in real time. Big data management is becoming a critical aspect of the mining industry,
                     where the amount of information that needs to be collected, stored, and analyzed increases
                     daily [20].
                           All of the autonomous haulage systems (AHSs) (e.g., Komatsu’s FrontRunner
                     AHS [21,22], Caterpillar’s Cat® MineStar™ Command [11], Sandvik’s AutoMine® um-
                     brella [23], and Hitachi’s AHS [10]) that are developed by coalitions of mining companies,
                     mining equipment manufacturers, and autonomous solutions companies and are currently
                     used commercially fall into the category of real-time applications. As an example, the
                     OptiMine® Analytics suite, developed by Sandvik AB, comprises a set of tools that collect,
                     analyze, and visualize data from a variety of IoT devices, providing a real-time overview
                     of the mining operations [24]. The suite provides tools and features for (i) scheduling of
                     mine development, production, and maintenance; (ii) task management; (iii) real-time
                     equipment, personnel, and asset tracking in the mine; (iv) drill planning and visualization;
                     and (v) real-time equipment health monitoring and productivity information.
                           Data management systems are also developed for mining applications unrelated to
                     autonomous haulage systems. For example, a real-time, event-driven database is used
                     in surface lignite mines in Northern Greece to support a productivity and maintenance
                     planning software application. The DMS collects and analyzes data through a SCADA (su-
                     pervisory control and data acquisition) system, which interfaces with PLCs (programmable
                     logic controllers) installed on multiple bucket wheel excavators, belt conveyors, spreaders,
                     and stackers in the field [25]. Similar control systems paired with OPC (Open Platform
                     Communications) tools in a SCADA–PLC–OPC interface are commonly used for advanced
                     monitoring of industrial processes [26–30]. Geotechnical monitoring applications are typi-
                     cally heavily supported by DMSs as well. Monitoring the large-scale movement of slopes
                     and assessing slope stability inside and outside of mines can be significantly facilitated
                     by integrating wireless sensor networks, web services, and GIS (geographic information
                     system) tools [31–33].
                           Although literature sources with a detailed discussion on the DMSs implemented for
                     self-driving vehicles are scarce, there are references on the topic of efficient data storage
                     and management in the context of wireless sensor networks (WSNs). In general, the data
                     management systems that are deployed for storage and querying data collected by WSNs
                     in real time can be divided into two main categories: warehousing and distributed. The
                     former category provides a centralized data management system where the datastream
                     is accumulated in a database and the clients can query that database. On the other side,
                     the latter category stores data into both, a central database, and the sensors themselves
                     (local databases), enabling clients to query both. Each approach exhibits advantages and
                     disadvantages, and different management systems have been proposed to optimize their
                     performance [34,35]. The decision-making processes for an autonomous vehicle can further
                     be enhanced with the integration of historical data (e.g., maps of intersections and traffic
                     rules), an approach that is very common in the self-driving car industry [36,37]. Another
                     critical factor for real-time sensing and processing is the problem of managing and updating
                     sensor data, as well as the highly time-varying inquiry requests on sensor data. A variety of
                     approaches have been proposed for efficiently tackling the timely refresh of such real-time
                     systems, with a common solution to be deep reinforcement learning (DRL) in real-time
                     databases [38].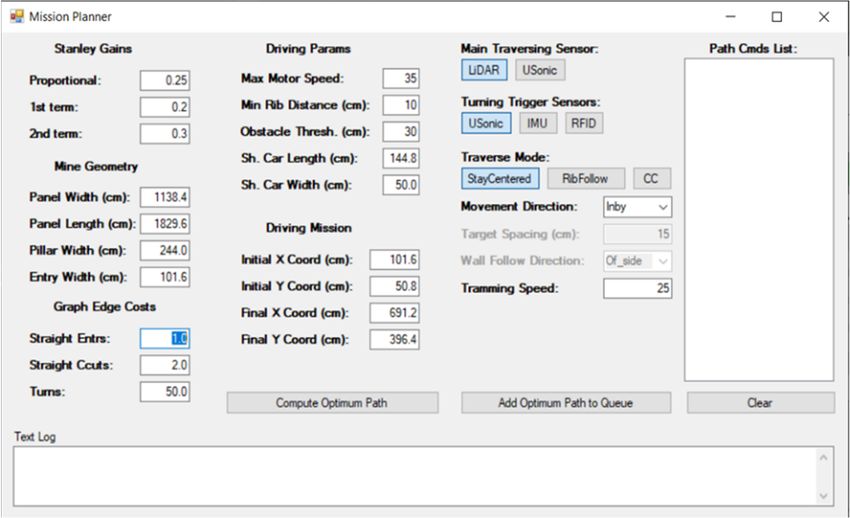
Automation 2021, 2, FOR PEER REVIEW 5
Automation 2021, 2, FOR PEER REVIEW 5
Automation 2021, 2
variety of approaches have been proposed for efficiently tackling the timely refresh of
variety of approaches have been proposed for efficiently tackling the timely refresh157
of
such real-time systems, with a common solution to be deep reinforcement learning (DRL)
such real-time systems, with a common solution to be deep reinforcement learning (DRL)
in real-time databases [38].
in real-time databases [38].
3.3.Laboratory-Scale
Laboratory-ScaleShuttle ShuttleCarCar
3. Laboratory-Scale Shuttle Car
InInorder
ordertotosimulate
simulate thethe operation
operation of aofshuttle
a shuttlecar car
andand evaluate
evaluate the performance
the performance of theof
In order to simulate the operation of a shuttle car and evaluate the performance of
navigation
the navigation software stack,stack,
software a scaled mockmock
a scaled mineminelayout and aand
layout scaled shuttle
a scaled car prototype
shuttle car proto-
the navigation
were software stack, aThescaled mock subsections
mine layoutdescribe
and a scaled shuttle car of
proto-
typedesigned and
were designed constructed.
and constructed. following
The following the basic
subsections describe the aspects the
basic aspects
type
design were designed and constructed. The following subsections describe the basic aspects
of the of the physical
design testing testing
of the physical facility,facility,
the locomotive system system
the locomotive of the shuttle car prototype,
of the shuttle car pro-
of the
the design ofbody,
prototype’s the physical
and thetesting facility, the
specifications locomotive
of the sensors system of
selected to the shuttle carinto
be integrated pro-
totype, the prototype’s body, and the specifications of the sensors selected to be integrated
totype,
the the
prototype. prototype’s body, and the specifications of the sensors selected to be integrated
into the prototype.
into the prototype.
3.1.
3.1.Laboratory-Scale
Laboratory-ScaleTestingTestingFacility
Facility
3.1. Laboratory-Scale
The Testing Facility
The scale ratio of the mockmine
scale ratio of the mock mineand andshuttle
shuttlecarcarareare1/6th
1/6thofofthe
thefull
fullsize.
size.The
Themock
mock
mine The
is scale
built ratio
with of thewooden
painted mock mine panels and andshuttle car are
arranged to 1/6th of athe
simulate roomfullandsize.pillar
The mine
mock
mine is built with painted wooden panels and arranged to simulate a room and pillar
minesquare
with is built withhaving
pillars painteda width
wooden panels and arranged to simulate
a widthaaof room andangle
pillar
mine with square pillars having a of 15.2
width m
of and
15.2 entries having
m and entries having 6 m. of
width The6 m. The
mine with
between thesquare
entries pillars
and having
the a width
crosscuts is 90ofdegrees.
15.2 m and Figureentries
1 having aa view
presents widthofofthe 6 m. The
mock
angle between the entries and the crosscuts is 90 degrees. Figure 1 presents a view of the
anglewhile
mine, between the entries
the plan anddimensions
in scaled the crosscuts is 90 degrees.
is presented Figure
in Figure 1 presents
2. Note that the a view
shuttleofcar
the
mock mine, while the plan in scaled dimensions is presented in Figure 2. Note that the
mock
that mine, while
is modelled the plan
in this projectin is
scaled
actually dimensions
about 9.1ismpresented
long and 3.3in Figure
m wide. 2. The
Notelab-scale
that the
shuttle car that is modelled in this project is actually about 9.1 m long and 3.3 m wide. The
shuttle
shuttlecar caristhat
approximately
is modelled in 1.5this
m long
project andis0.5 m wide.
actually about 9.1 m long and 3.3 m wide. The
lab-scale shuttle car is approximately 1.5 m long and 0.5 m wide.
lab-scale shuttle car is approximately 1.5 m long and 0.5 m wide.
Figure 1. Mock mine.
Figure1.1.Mock
Figure Mockmine.
mine.
Figure 2. Plan of simulated room and pillar layout.
Figure2.2.Plan
Figure Planof
ofsimulated
simulatedroom
roomand
andpillar
pillarlayout.
layout.
The design of the simulated mine emphasizes the geometry of the entries and crosscuts
but ignores the conditions of the mine floor or roof. The current state of the navigation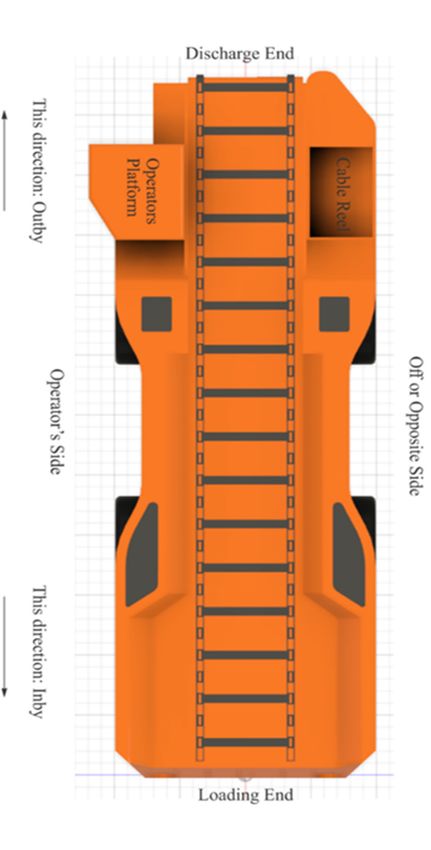
Automation 2021, 2, FOR PEER REVIEW 6
Automation 2021, 2 158
The design of the simulated mine emphasizes the geometry of the entries and cross-
cuts but ignores the conditions of the mine floor or roof. The current state of the navigation
systemdoes
system doesnotnotutilize
utilizeanyany data
data with
with respect
respect to to
thethe roof,
roof, andand thus
thus thethe absence
absence of aof a “roof”
“roof” in
in the
the mock mock
mine mine
doesdoes not affect
not affect the development
the development and testing
and testing of theofalgorithms.
the algorithms. It should
It should also
also
be be noted
noted that the that theof
floor floor of the laboratory
the laboratory spacenot
space does does not simulate
simulate the different
the different conditionscondi-
of
tions
the of in
floor theanfloor in an
actual mine,actual mine,
as in as in mine
an actual an actual mine the
the friction friction conditions
conditions between the between
floor
the the
and floor and
tires ofthe
the tires
vehicleof the vehicle
or the tilt ofor
thethe tilt can
floor of the floor
affect can affect
vehicle vehicle(e.g.,
movement movement
wheel
(e.g., wheel
slippage). Theslippage).
navigationThe navigation
algorithm algorithm
currently does notcurrently
directlydoes not for
account directly account for
such conditions,
such
but conditions,
plans but plans
are in place are in place
to correct to correct
for adverse for conditions.
floor adverse floorDespite
conditions. Despite the
the simplified
assumptions, the performance
simplified assumptions, of the navigation
the performance system is anticipated
of the navigation to provide to
system is anticipated valid
pro-
and
viderelatively
valid and accurate
relativelyinformation for the scopefor
accurate information of this research,
the scope namely,
of this to examine
research, namely, theto
feasibility
examine the of the integration
feasibility of theofintegration
an autonomous shuttle car inshuttle
of an autonomous the underground room and
car in the underground
pillar mining cycle.
room and pillar mining cycle.
3.2.
3.2.Locomotive
LocomotiveSystem
System
The
The chassisofofthe
chassis thelaboratory-scale shuttle
laboratory-scale carcar
shuttle prototypes consists
prototypes of two
consists axles
of two fromfrom
axles an
off-the-shelf remote control (RC) vehicle, which are connected together with
an off-the-shelf remote control (RC) vehicle, which are connected together with aluminum aluminum
frame
framerails.
rails.The
Thelength
lengthofofthe
therails
railswas
wasdetermined
determinedtotoensure
ensurethat
thatthe
thewheelbase-to-width
wheelbase-to-width
ratio
ratio represents that of the full-scale shuttle car. Between the rails,aabin
represents that of the full-scale shuttle car. Between the rails, binisisattached
attachedforfor
mounting the electronic parts, while the rails per se provide a means to mount
mounting the electronic parts, while the rails per se provide a means to mount the shuttlethe shuttle
car body to the chassis. The locomotive system includes four servomotors for steering and
car body to the chassis. The locomotive system includes four servomotors for steering and
two brushless DC (BLDC) planetary gear motors for tramming (Figure 3). The tramming
two brushless DC (BLDC) planetary gear motors for tramming (Figure 3). The tramming
motors are controlled by a RoboteQ SBL2360T Brushless DC Motor Controller [39] that
motors are controlled by a RoboteQ SBL2360T Brushless DC Motor Controller [39] that
uses the pulse-width-modulation (PWM) signals sent from a remote controller to a radio
uses the pulse-width-modulation (PWM) signals sent from a remote controller to a radio
receiver mounted in the shuttle car electronics enclosure to control the motor speed. The
receiver mounted in the shuttle car electronics enclosure to control the motor speed. The
steering servomotors (Savox SC-1256TG) are controlled directly by the PWM signal sent
steering servomotors (Savox SC-1256TG) are controlled directly by the PWM signal sent
wirelessly to the onboard radio receiver.
wirelessly to the onboard radio receiver.
Figure3.3.Locomotive
Figure Locomotivesystem.
system.
3.3.Shuttle
3.3. ShuttleCar
CarPrototype
PrototypeBody
Body
Thedesign
The designofofthe
theprototype
prototypebody bodyisisbased
basedon onaaJoy
Joy10SC32B
10SC32Bmodelmodel(Komatsu
(KomatsuMining
Mining
Corp.,
Corp.,Saminco,
Saminco,Fort
FortMyers,
Myers,FL, FL,USA)
USA)[40],
[40],developed
developedfrom fromaaStandard
Standardfor
forthe
theExchange
Exchange
ofofProduct
Product(STP)
(STP)three-dimension
three-dimensiondata datafile
fileprovided
providedby byKomatsu
KomatsuMining
MiningCorp.
Corp.ThisThiswas
was
used
usedtotocreate
createan
anSTP
STPfile
fileofofaa1/6th
1/6th scale
scale body
body (Figure
(Figure 4).
4). Subsequently,
Subsequently,stereo
stereolithography
lithography
(STL)
(STL)files
fileswere
wereproduced
produced forfor
a 3-D printer
a 3-D to print
printer the the
to print body intointo
body several partsparts
several (because the
(because
available equipment could not print the entire body in one part). A Gigabot ® 3+ 3D printer,
the available equipment could not print the entire body in one part). A Gigabot 3+ 3D ®
produced by re3D Inc.,
printer, produced Houston,
by re3D Inc., TX, USA [41],
Houston, TX, and
USAa[41],
Replicator Z18 3-D printer,
and a Replicator Z18 3-D produced
printer,
by MakerBot, Brooklyn, NY, USA [42], were used for that purpose. Additional
produced by MakerBot, Brooklyn, NY, USA [42], were used for that purpose. Additional details on
the shuttle
details on car
the can be found
shuttle car can inbe
Androulakis et al. [19]. et al. [19].
found in Androulakis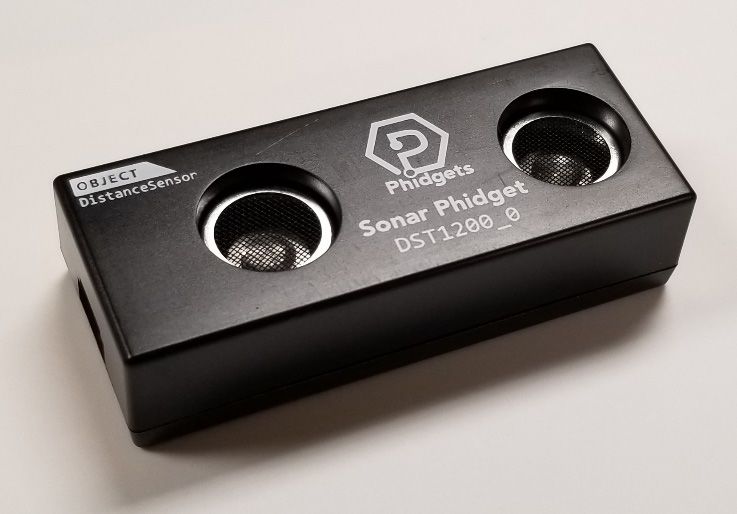
Automation 2021, 2, FOR PEER REVIEW 7
Automation 2021, 2 159
Figure 4. Top view of the shuttle car body (STP file).
Figure 4. Top view of the shuttle car body (STP file).
3.4. Sensors
3.4. Sensors
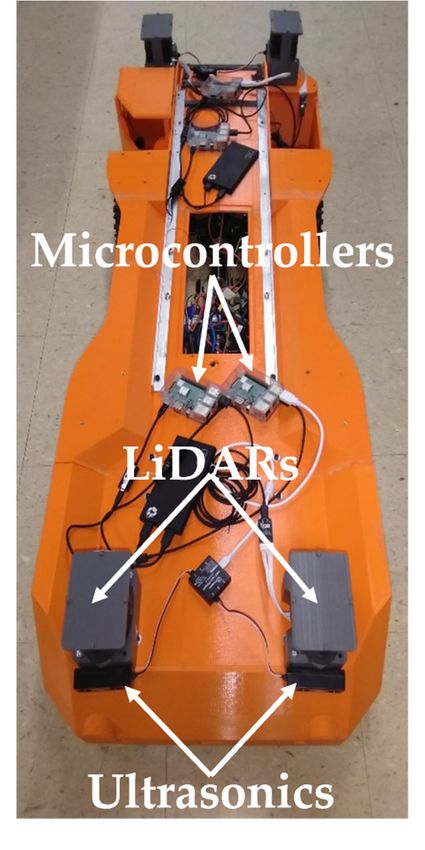
The prototype collects information about its surroundings and its movement through
two different sensor
The prototype modalities
collects (Figure
information 5):its surroundings and its movement through
about
•two different
Four 2Dsensor
LiDARmodalities (Figure 5):
(light detection and ranging) scanners used for mapping, navigation,
•
Automation 2021, 2, FOR PEER REVIEW Four 2D LiDAR (light
and obstacle detection;detection and ranging) scanners used for mapping, navigation,
8
and obstacle detection;
• Four ultrasonic sensors used for proximity safety.
• Four ultrasonic sensors used for proximity safety.
As the integration of IMUs (inertial measurement units) for enhancing the navigation
algorithms’ performance is under development, the discussion below includes only the
implementation of LiDAR scanners and ultrasonic sensors.
Figure 5. Prototype equipped with LiDAR and ultrasonic sensors.
Figure 5. Prototype equipped with LiDAR and ultrasonic sensors.
3.4.1. LiDAR Scanners
The 2D LiDAR scanner used for the lab-scale shuttle car prototype is the RPLiDAR
A1M8 scanner developed by SLAMTEC [43], which is a low-cost 360° laser scanner with
a 12-m range. Table 1 summarizes its performance specifications. The point data collected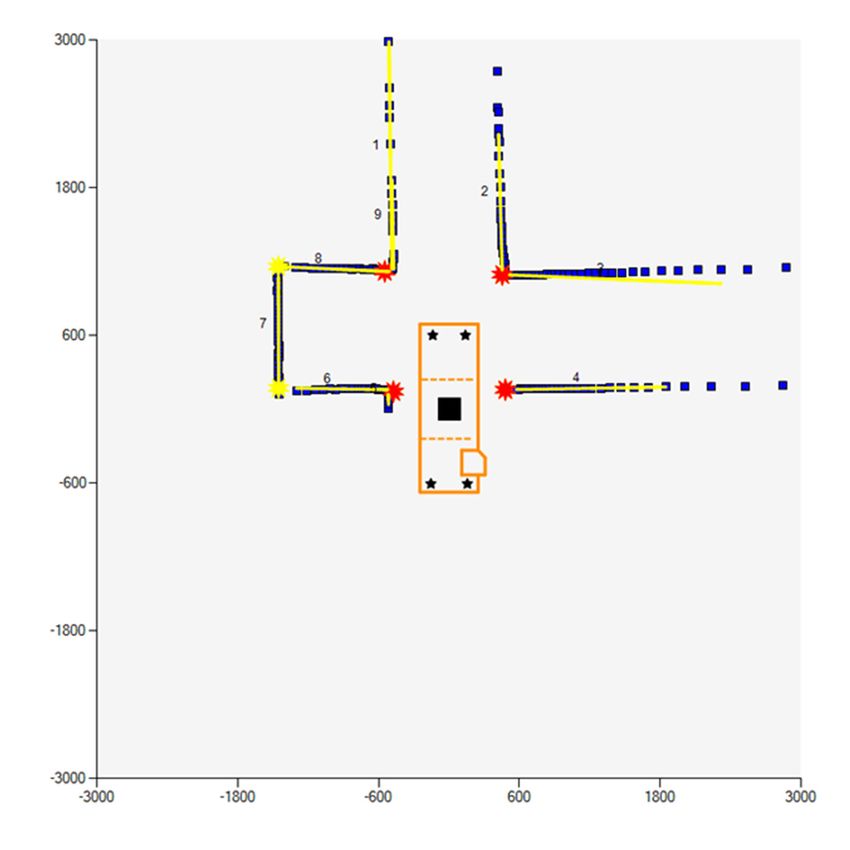
Automation 2021, 2                                                                                                              160

                                      As the integration of IMUs (inertial measurement units) for enhancing the navigation
                                 algorithms’ performance is under development, the discussion below includes only the
                                 implementation of LiDAR scanners and ultrasonic sensors.

                                 3.4.1. LiDAR Scanners
                                     The 2D LiDAR scanner used for the lab-scale shuttle car prototype is the RPLiDAR
                                A1M8 scanner developed by SLAMTEC [43], which is a low-cost 360◦ laser scanner with a
                                12-m range. Table 1 summarizes its performance specifications. The point data collected
                                can produce a map of the surrounding environment. A housing assembly was designed
                                and 3-D-printed to facilitate the mounting of the sensor on the lab-scale shuttle car.

                                 Table 1. RPLiDAR A1M8 performance specifications (based on information from [43]).

                                                    Parameter                                           Value
                                               Measurement range                                      0.15 to 12 m
                                                  Angular range                                     0 to 360 degrees
                                             Measurement resolution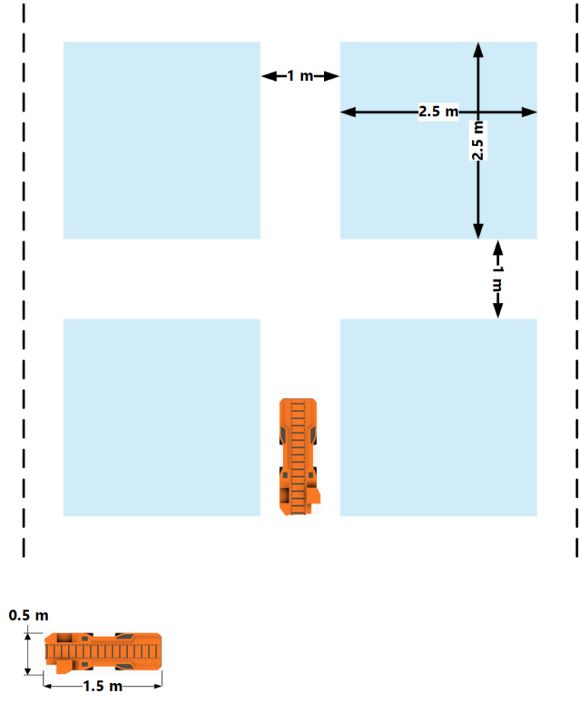
Automation 2021, 2                                                                                                            161

                                Table 2. Sonar Phidget DST1200_0 sensor specifications (based on information from [44]).

                                                   Parameter                                          Value
                                          Dimensions (with enclosure)                   75.3 (L) × 31.8 (W) × 21.7 (H) mm
                                            Operating temperature                                  −40 to 85 ◦ C
                                             Operating frequency                                    1 to 10 Hz
                                               Minimum range                                          40 mm
                                              Maximum range                                             10 m

                                4. Data Management, Decision Making, and Control
                                        The general data workflow, as well as the relevant data management subsystem,
                                  for the laboratory-scale shuttle car prototype is described in Androulakis et al. [19]. The
                                  data management approach selected belongs to the warehousing category [34] due to
  Automation 2021, 2, FOR PEER REVIEW                                                                                           10
                                  the inefficient memory and processing capabilities of the microcontrollers responsible
                                  for collecting the sensor data. Moreover, a centralized data storage system was deemed
                                  most appropriate for the application under investigation since the individual sensor data
                                    •    Data processing and visualization (autonomous logic controller, mapping tool, path
                                  need to be combined to extract useful information about the vehicle’s surroundings. The
                                         planning module, etc.): The data processing and visualization node is implemented
                                  relatively small operational environment, as well as the reduced amount of data collected
                                         as a Windows application that analyzes the datastream and generates the PWM sig-
                                  due to the 2-D approach, and the constricted space of the typical underground coal mines
                                         nals that control the movement of the shuttle car in real time. This part is represented
                                  have enabled the authors to conduct the laboratory-scale simulations without the need
                                         by the lower (blue) box of the schematic and includes the multimodular interface
                                  for integrating historical data or building routines for monitoring the refreshing of the
                                         developed for decision making and for communication to the shuttle car traction mo-
                                  datastream. In summary, the system utilizes simultaneous processes and is divided into
                                         tors and steering servomotors. Human input is also required for setting parameters
                                  three main parts or nodes, as shown in Figure 7.
                                         and assigning missions.

                                 Figure7.7.Schematic
                                Figure      Schematicofofdata
                                                          dataflow
                                                               flowand
                                                                    andmanagement.
                                                                       management.

                                 4.1. Data Collection
                                      The data from the onboard sensors are collected through a number of Raspberry Pi 3
                                 Model B+ microcontrollers [45]. These microcontrollers are equipped with a quad core 64-
                                 bit CPU (central processing unit) with a frequency of 1.2 GHz and 1 GB RAM (random-
                                 access memory), as well as wireless LAN (local area network) connectivity. Each micro-
                                 controller is assigned to one LiDAR scanner and two ultrasonic sensors in parallel pro-
Automation 2021, 2 162
• Data collection (onboard sensors): The data collection node includes the onboard
hardware that is responsible for collecting the sensor data by onboard microcontrollers
and for transmitting the data via Wi-Fi to an SQL database. This part is represented
by the upper-left (orange) solid box of the schematic.
• Data management (servers for data storage): The data management node consists of
an SQL (Structured Query Language) database server and a webserver that facilitate
the storage of the sensor data. This part is represented by the middle (green) solid box
of the schematic.
• Data processing and visualization (autonomous logic controller, mapping tool, path
planning module, etc.): The data processing and visualization node is implemented as
a Windows application that analyzes the datastream and generates the PWM signals
that control the movement of the shuttle car in real time. This part is represented
by the lower (blue) box of the schematic and includes the multimodular interface
developed for decision making and for communication to the shuttle car traction
motors and steering servomotors. Human input is also required for setting parameters
and assigning missions.
4.1. Data Collection
The data from the onboard sensors are collected through a number of Raspberry
Pi 3 Model B+ microcontrollers [45]. These microcontrollers are equipped with a quad
core 64-bit CPU (central processing unit) with a frequency of 1.2 GHz and 1 GB RAM
(random-access memory), as well as wireless LAN (local area network) connectivity. Each
microcontroller is assigned to one LiDAR scanner and two ultrasonic sensors in parallel
processes. The collection of data is accomplished through scripts, written in the Python
programming language. The microcontrollers are programmed to collect new data from
the sensors and post the data into the custom SQL database through a continuous loop.
This data acquisition loop continuously retrieves the newest data from the sensors and
uploads them to the SQL database through properly constructed messages. Before each
iteration, the connectivity to the sensors is checked and restored in case of nonexistent or
corrupted connection.
The sensor maximum update rate is determined by its specifications. In some cases,
the user can select any update rate less than or equal to the maximum rate. In general, more
advanced sensors have higher update rates. The maximum update rate of the ultrasonic
sensors used in this project is 10 Hz or 100 ms per measurement, while the maximum
update range of each of the LiDAR scanners is 10 Hz or 100 ms per one full scan. However,
the measured update rates of the 2D LiDAR scanners are lower than the maximum reported
in the specifications. The operating frequency of the 2D LiDAR scanners is in the range
of 5 to 10 Hz per scan, with the typical frequency reported by Slamtec to be 5.5 Hz
(under the condition that the LiDAR scanner retrieves 360 range measurements per scan).
However, the average update rate measured in the laboratory by units controlled through
the Raspberry Pi 3 B+ microcontrollers is between 7 and 8 Hz per scan. This rate is inherent
to the sensor and cannot be changed manually since the current library released for this
sensor under the Python programming language does not support it. Because of the
higher frequency compared with the typical operating frequency, the number of range
measurements collected during one scan is less than 360. The average observed value is
160–175 measurements per scan. Despite that the decreased number of measurements
reduces the resolution of the maps created, the information provided is sufficient for the
navigation algorithms and the decision-making processes.
Measurements by the LiDAR scanners are formatted into an array of triplets in the
form of [signal quality, angle, distance], while measurements by the ultrasonic sensors
include only a value for distance. Each measurement sequence is paired with the designated
name of each sensor, as will be discussed in the following section. The data packet for
each sensor type varies in length, which does not vary significantly between different
measurement cycles.Automation 2021, 2 163
4.2. Data Management
An SQL database schema has been developed to handle the data collected from the
onboard sensors. The SQL database is populated in real time by data received from the
Raspberry Pi microcontrollers. The database server asynchronously accepts the SQL post
requests that include the collected data. At the same time, the database server responds to
data requests from the data processing and visualization node and the webserver used for
visualization of the collected data (Figure 7).
The time needed to post the collected data to the database includes the time for the
microcontroller to connect to the database over the available network protocol and the
time to post each measurement to the SQL database. Thus, the update rate for the different
datastreams is determined by three main factors: (i) the maximum update rate of the
sensors, (ii) the number of scans performed per data collection cycle, and (iii) the time
needed to post the data to the SQL database.
For example, Table 3 summarizes the effective update rates for the LiDAR sensors as
calculated by the data collection microcontrollers. The average effective update rate from
the four LiDAR scanners is about 135 ms or 7.40 Hz.
Table 3. Effective update rates of onboard sensors (calculated by the data collection microcontrollers).
Sensor Longitudinal Position Transverse Position Update Rate (Hz) Update Rate (RPM) Update Time (ms)
LRLDOP Loading end Operator side 7.19 431.44 139.07
LRLDOF Loading end Opposite/off side 7.82 469.23 127.87
LRDSOP Discharge end Operator side 7.44 446.13 134.49
LRDSOF Discharge end Opposite/off side 7.14 428.11 140.15
Table 4 depicts an example of data stored in the SQL database as collected from the
onboard sensors. Each sensor is designated by a specific name so that the front-end routines
that process and visualize the data can easily retrieve the respective sensor data. Sensor
names are six to eight characters long, and each character pair is used to denote specific
information about the sensor. The first pair denotes the type of sensor, US for ultrasonic
or LR for LiDAR scanner; the second pair denotes the longitudinal position of the sensor
on the prototype, DS for discharge end or LD for loading end; the third pair denotes the
lateral position of the sensor on the prototype, OP for operator side or OF for off side; and
the fourth pair is used for denoting the pointing direction of the point sensors (only the
ultrasonic sensors need this descriptor), OP for operator side, OF for off side, IB for inby
direction, or OB for outby direction (see Figure 4 for a labeled schematic of the shuttle car’s
parts). Moving inby corresponds to movement towards the active face, while moving outby
corresponds to movement away from the face. The data collected from the 2D LiDAR units
are stored as a series of arrays that contain three numbers, namely, [signal quality, angle,
distance]. As shown in rows 1 and 15 of Table 4, each such triplet is registered in the SQL
database using a comma to separate the three values and is enclosed in parentheses.
Table 4. Stored data in SQL database.
ID Timestamp (UNIX) Sensor Value Datetime
(11, 351.23, 8191.25) (12, 26 February 2021
1 1,614,368,508.95632 LRLDOP
352.50, 8666.0) (10, 356 . . . ) 19:41:48.956
26 February 2021
2 1,614,368,509.03309 USLDOPIB 90
19:41:49.033
26 February 2021
3 1,614,368,509.09603 USDSOFOB 4530
19:41:49.096
26 February 2021
4 1,614,368,509.13392 USLDOFIB 120
19:41:49.134Automation 2021, 2 164
Table 4. Cont.
ID Timestamp (UNIX) Sensor Value Datetime
26 February 2021
5 1,614,368,509.14794 USDSOPOB 70
19:41:49.148
26 February 2021
6 1,614,368,509.23482 USLDOPIB 90
19:41:49.235
26 February 2021
7 1,614,368,509.33016 USDSOFOB 4530
19:41:49.330
26 February 2021
8 1,614,368,509.38359 USLDOFIB 120
19:41:49.384
26 February 2021
9 1,614,368,509.41965 USDSOPOB 70
19:41:49.420
26 February 2021
10 1,614,368,509.42756 USLDOPIB 100
19:41:49.428
26 February 2021
11 1,614,368,509.57966 USDSOFOB 4530
19:41:49.580
26 February 2021
12 1,614,368,509.64074 USLDOPIB 100
19:41:49.641
26 February 2021
13 1,614,368,509.63843 USDSOPOB 70
19:41:49.638
26 February 2021
14 1,614,368,509.64557 USLDOFIB 120
19:41:49.646
(12, 350.80 7930.25) (14, 26 February 2021
15 1,614,368,509.82314 LRLDOF
352.05, 8602.0) (12, . . . ) 19:41:49.823
26 February 2021
16 1,614,368,509.83725 USLDOPIB 90
19:41:49.837
26 February 2021
17 1,614,368,509.88475 USLDOFIB 120
19:41:49.885
26 February 2021
18 1,614,368,509.95217 USDSOPOB 70
19:41:49.952
26 February 2021
19 1,614,368,509.95389 USDSOFOB 4530
19:41:49.954
26 February 2021
20 1,614,368,510.03386 USLDOPIB 90
19:41:50.034
Whenever the server receives a record, the time that record is created (current times-
tamp) is also recorded through an event triggered by the record insertion process. These
times can be used to calculate another effective update rate for each sensor. Note that
this update rate is the rate the database receives a new record from a specific sensor, as
opposed to the effective update rate described previously, which corresponds to the rate
the microcontroller sends out a new record to the database. These two effective update
rates are different because of latencies in sending and/or recording data. Table 5 shows a
sample of the calculations for the update rate of a LiDAR scanner, while Table 6 summa-
rizes the update rates for the different sensors as calculated from the SQL database server
timestamps. These rates were very close to the rates calculated through the timestamps
generated by the microcontrollers before sending a record to the database. The average
update rate for the LiDAR scanners is 136.15 ms, which corresponds to an update frequency
of 7.35 Hz, while the average update rate of the ultrasonic sensors is 100.63 ms or 9.94 Hz.Automation 2021, 2 165
Table 5. Sample of calculating the update rate of a LiDAR scanner.
ID Timestamp (UNIX) Time Difference (s)
1 1,614,368,508.99910 0
2 1,614,368,509.86770 0.86860
3 1,614,368,510.72004 0.85234
4 1,614,368,511.55882 0.83878
5 1,614,368,512.42375 0.86493
6 1,614,368,513.27000 0.84625
7 1,614,368,514.11491 0.84491
8 1,614,368,514.96620 0.85129
9 1,614,368,515.83176 0.86556
10 1,614,368,516.68120 0.84944
11 1,614,368,517.52349 0.84229
12 1,614,368,518.39345 0.86996
13 1,614,368,519.24412 0.85067
14 1,614,368,520.08953 0.84541
Table 6. Effective update rates of onboard sensors (calculated on the database server).
Sensor Longitudinal Transverse Pointing Update
Sensor
Type Position Position Direction Time (ms)
LRLDOP LiDAR Loading end Operator side Omnidir. 139.53
LRLDOF LiDAR Loading end Opposite/off side Omnidir. 127.90
LRDSOP LiDAR Discharge end Operator side Omnidir. 136.35
LRDSOF LiDAR Discharge end Opposite/off side Omnidir. 140.80
USLDOPIB Ultrasonic Loading end Operator side Inby 101.45
USLDOFIB Ultrasonic Loading end Opposite/off side Inby 100.86
USDSOPOB Ultrasonic Discharge end Operator side Outby 99.75
USDSOFOB Ultrasonic Discharge end Opposite/off side Outby 100.44
4.3. Data Processing and Visualization
The front-end interface has been designed using a modular architecture, which facili-
tates the development and debugging of the software stack and provides layered processing
of the raw data into a few meaningful parameters that expedite the decision-making process.
The most important modules that compose the interface are the following:
• Main module: The main module provides the means for the shuttle car supervisor
to create a mission for the vehicle (essentially, the path it is to follow) by creating
low-level commands, and controls the starting, pausing, resuming, and termination of
the execution of the command queue. Additionally, it enables the remote monitoring
of the shuttle car’s movement through a number of scrolling switches that handle
the speed and steering angle of the vehicle in real time. A screenshot of the currently
implemented main window is shown in Figure 8.
• Data grabber module: The data grabber module enables the interface to connect to the
SQL database and collect the latest updated sensor data in real time.
• Path planning module: The path planning module provides two alternative ways for
the interface user to create a mission for the shuttle car: a semiautonomous approach
by creating a small number of abstract commands (instead of a relatively biggerAutomation 2021, 2 166
number of low-level commands as in the main module) and a fully autonomous
approach through utilization of graph theory (see Figures 9 and 10).
• Mapping tool: The mapping tool interprets the data collected from the LiDAR scanners
to create a map of the surroundings in real time. Subsequently, the tool extracts salient
features from that map and stores their characteristics into parameters that are used as
input for the decision agent module. The mapping tool form is used to visualize the
data collected from the LiDAR units in real time. This provides a real-time map of the
current surroundings of the vehicle up to a distance of 12 m (the range of the LiDAR
units). The user can specify the refresh rate and the range of the size of the map (the
map is always square). The latter parameter gives the user the ability to zoom in and
out and observe points of interest (see Figure 11).
• Decision agent module: The decision agent module analyzes the latest available infor-
mation about the surroundings and decides whether the current low-level command
is safe to be executed or alternative corrective actions need to be taken.
• Device control module: The device control module converts the decisions of the agent
Automation 2021, 2, FOR PEER REVIEW
into appropriate PWM signals and controls the signal transfer to the RC and the radio15
receiver on board.
Figure 8. Main window of the shuttle car interface.
Figure 8. Main window of the shuttle car interface.Automation 2021, 2 167
Figure 8. Main window of the shuttle car interface.
Automation 2021, 2, FOR PEER REVIEW 16
Figure 9. Mission planner form.
Figure 9. Mission planner form.
Figure10.
Figure 10.Optimum
Optimumpath
pathfinder
findertool.
tool.Automation 2021, 2 168
Figure 10. Optimum path finder tool.
Figure 11. Instance of a created map in the mapping tool. The blue squares denote the collected x–y
Figure 11.from
pairs Instance of aLiDAR
the two createdscanners
map in the
onmapping tool. of
the direction The blue squares
movement denote
(in this theInby).
case, collected
The x–y
yellow
pairs from the two LiDAR scanners on the direction of movement (in this case, Inby). The yellow
linear segments model the ribs of the entries/crosscuts. The red stars denote the four closest detected
linear segments model the ribs of the entries/crosscuts. The red stars denote the four closest detected
corners, while the yellow stars denote the remaining detected corners. The black square denotes
corners, while the yellow stars denote the remaining detected corners. The black square denotes the
theof
center center of the shuttle
the shuttle car. Thecar. The direction
direction of movement
of movement is alwaysis always
towardstowards the increasing
the increasing values
values of the of
the
y-axis. y-axis.
5. Latency Considerations
The multiple functionalities of the lab-scale shuttle car prototype, which are governed
by the tiered software stack, inherently exhibit latencies. These latencies occur not only
between the data management node and the other two nodes, but also within the mul-
timodular data processing and visualization node. The magnitude of these latencies is
critically affected by the integrated hardware as well. Sensors and microcontrollers with
higher speed and processing power would naturally lead to shorter latencies. Alternatively,
the software developed must compensate for the hardware. The most common approach is
to employ parallel processing techniques. Such techniques have been implemented on both
the microcontroller side (collection of data) and the front-end interface side (processing
and visualization of data).
In Table 7, the average durations of the most important processes of the interface are
summarized and compared with the total time that the interface needs to process the latest
data and make a single decision. The process for making a single decision for the next
movement of the shuttle car involves the following steps:
(i) Communicate with the SQL server and collect the latest updated sensors data;
(ii) Create a map of the immediate surroundings;
(iii) Employ the agent to make a decision for the next movement; and
(iv) Send the proper signal to the shuttle car actuators to execute this decision.Automation 2021, 2 169
Table 7. Front-end interface process times.
Process Time (ms) Perc. (%)
DataGrabbing 95.61 10.8
Mapping 223.38 25.2
Agent 52.16 5.9
CmdExecution 514.42 58.1
TotalCmd 855.58 100.0
As shown in Table 7, the fastest processes are the process of acquiring the latest sensor
data from the SQL database and the decision-making process based on the mapping output.
The duration of the former process is longer than the time needed to acquire the data from
the SQL database because it includes some preprocessing for the acquired data as well.
The creation of the immediate surroundings map requires about one-fourth of the total
time. Finally, the execution of the latest decision takes up to 58% of the total time. Note,
however, that the signals sent to the prototype’s actuators are programmed to be sent every
500 ms. However, each decision-making process starts at the same time as the fourth step
of the previous decision. In other words, the interface starts processing the latest data for
the next decision (i.e., data grabbing, mapping, decision making) while the shuttle car
executes the latest decision. Therefore, this 500 ms is part of the average execution time
(514.42 ms) but does not hinder the process due to the concurrent programming techniques
implemented. This compensates for part of the total latencies and subsequently allows for
uninterrupted movement of the prototype. The data processing and visualization module
is able to retrieve and process the latest data and make a decision for the next movement of
the shuttle car prototype in less than 900 ms.
6. Conclusions
Data management systems play a crucial role in the implementation of an autonomous
solution. Smart solutions are based on processing vast amounts of data collected by a
carefully designed sensor network. Therefore, a reliable data management system is
the backbone of the entire implementation, and its efficiency will directly determine the
performance of the solution. The DMS implemented in the current research attempts to
(i) efficiently store the data collected from the onboard sensors and (ii) make the data
accessible to any client request. Both objectives need to be fulfilled in real time and with
minimum latencies.
The necessity of developing three separate nodes, namely, the data collection node,
the data management node, and the data processing and visualization node, was mandated
by the large amount of collected data and the need to ensure uninterrupted and fast
data storage and flow. Utilization of an SQL database server is one solution that allows
for asynchronous, real-time, and reliable data management. Asynchronous access from
multiple sources ensures that the data will not be lost because of conflicts between the
different writing processes, as well as ensures that the data will be recorded in real time or
near real-time speed. A similar concept applies to data requests from multiple clients.
However, one disadvantage of the three-node approach is that it introduces latencies
that are associated with the data management node and the other two nodes. In general,
the transmission latencies are defined by the quality of the Wi-Fi network and the length of
the corresponding POST and GET messages sent to the server. The length of the message is
defined by the type of sensor data. The server update rate for the LiDAR scanners is 7.35 Hz,
while the rate for the ultrasonic sensors is 9.94 Hz. The average update rate for the LiDAR
scanners as reported by the microcontrollers is 7.40 Hz. The difference between these
two update rates is attributed to the handshake and transmission time between the SQL
server and each microcontroller. The small difference indicates that the latency imposed
by the communication network is negligible. The update rates of the ultrasonic sensorsAutomation 2021, 2 170
were not calculated on the microcontroller side because of the low overhead required to
transmit and store a single measurement. This is confirmed by the measured frequency on
the server side (9.94 Hz), which is very close to the maximum operating frequency of the
ultrasonic sensors.
The speed of the different processes undertaken within one single decision cycle
was evaluated. As expected, the most time within one decision cycle is spent in the cre-
ation of the map of the environment around the moving shuttle car (in this case, 25.2%).
The acquisition of the latest sensor data consumes 10.8% of the total cycle time, and the
determination of the optimal decision based on the newest map takes 5.9% of the cycle
time. Finally, the execution of the optimal decision accounts for the remaining 58.1% of
the cycle time. The average total time for one cycle with respect to data processing and
visualization (e.g., retrieve and process the latest data and make a decision about the next
optimal movement of the shuttle car prototype) is less than 900 ms. This includes the
time required for the shuttle car to move for one time step. During the move time, the
autonomous vehicle interface has already started processing the next decision cycle, which
eliminates any interruptions in the movement of the prototype.
Author Contributions: Conceptualization, S.S., J.S. and Z.A.; funding acquisition, S.S., J.S. and Z.A.;
methodology, S.S. and Z.A.; project administration, Z.A.; software, V.A. and S.S.; supervision, Z.A.;
validation, V.A., S.S. and J.S.; visualization, V.A. and Z.A.; writing—original draft, V.A.; writing—
review and editing, J.S. and Z.A. All authors have read and agreed to the published version of
the manuscript.
Funding: This study was funded by the Alpha Foundation for the Improvement of Mine Safety
and Health, Inc., Philadelphia, PA, USA (Alpha Foundation), grant number AFC 417-21. The views,
opinions, and recommendations expressed herein are solely those of the authors and do not imply
any endorsement by the Alpha Foundation or its directors or staff.
Institutional Review Board Statement: Not applicable.
Informed Consent Statement: Not applicable.
Acknowledgments: The authors would like to acknowledge the contributions of the exceptional
and enthusiastic undergraduate students who helped in the construction of the prototypes and the
development and testing of some aspects of the interface: Trevor Rosania, Harrison B. Stranc, Kevin
Oliver, and Hannah D. Heady. In addition, an invaluable role in the endeavors of this research must
be attributed to the industry for the support and feedback. The authors would like to thank Komatsu
Mining Corp., Saminco, Fort Myers, FL, USA, and Auxier Welding, Belva, WV, USA.
Conflicts of Interest: The authors declare no conflict of interest. The funders had no role in the design
of the study; in the collection, analyses, or interpretation of data; in the writing of the manuscript, or
in the decision to publish the results.
References
1. Sahu, R. How harnessing computer vision and machine learning will revolutionize global mining. Min. Eng. 2018, 70, 33–35.
2. Paraszczak, J. Maximization of productivity of autonomous trackless loading and haulage equipment in underground metal
mines—A challenging task. Min. Eng. 2014, 66, 24–41.
3. Paraszczak, J.; Gustafson, A.; Schunnesson, H. Technical and operational aspects of autonomous LHD application in metal mines.
Int. J. Min. Reclam. Environ. 2015, 29, 391–403. [CrossRef]
4. Rogers, W.P.; Kahraman, M.M.; Drews, F.A.; Powell, K.; Haight, J.M.; Wang, Y.; Baxla, K.; Sobalkar, M. Automation in the mining
industry: Review of technology, systems, human factors, and political risk. Min. Metall. Explor. 2019, 36, 607–631. [CrossRef]
5. Sammarco, J.; Wesh, J.; Reyes, M.; Ruff, T.; Sunderman, C. Mine of the Future: Disruptive Technologies that Impact our Future Mine
Worker Health & Safety Research Focus; Internal NIOSH Report (5 February 2018); Unpublished; 2018; pp. 5–11, 57–62.
6. Reid, D.; Ralston, J.; Dunn, M.; Hainsworth, D. Longwall shearer automation: From research to reality. In Machine Vision and
Mechatronics in Practice; Billingsley, J., Brett, P., Eds.; Springer: Berlin/Heidelberg, Germany, 2015. [CrossRef]
7. Mäkelä, H. Overview of LHD navigation without artificial beacons. Robot. Auton. Syst. 2001, 36, 21–35. [CrossRef]
8. Schunnesson, H.; Gustafson, A.; Kumar, U. Performance of automated LHD machines: A review. In Proceedings of the
International Symposium on Mine Planning and Equipment Selection, Banff, AB, Canada, 16–19 November 2009.
9. Gleason, W. Autonomous haulage growing fast; Komatsu continues to innovate in driverless fleet sector. Min. Eng. 2018, 70,
28–31.You can also read