An Integrated Sensor Data Logging, Survey, and Analytics Platform for Field Research and Its Application in HAPIN, a Multi-Center Household Energy ...
←
→
Page content transcription
If your browser does not render page correctly, please read the page content below
Article

An Integrated Sensor Data Logging, Survey, and
Analytics Platform for Field Research and Its
Application in HAPIN, a Multi-Center Household
Energy Intervention Trial
Daniel Lawrence Wilson 1,2,*, Kendra N. Williams 3,4 and Ajay Pillarisetti 5,* and for the HAPIN
Investigators †
 1 Geocene Inc, Vallejo, CA 94590, USA
 2 Lawrence Berkeley National Laboratory, Berkeley, CA 94720, USA
 3 Division of Pulmonary and Critical Care Medicine, School of Medicine, Johns Hopkins University,

   Baltimore, MD 21287, USA; kendra.williams@jhu.edu
 4 Center for Global Non-Communicable Disease Research and Training, Johns Hopkins University,

   Baltimore, MD 21287, USA
 5 Department of Environmental Health, Rollins School of Public Health, Emory University, Atlanta,

   GA 30306, USA
 * Correspondence: danny@geocene.com (D.L.W.); ajay.p@emory.edu (A.P.)
 † HAPIN Investigators: Vigneswari Aravindalochanan, Kalpana Balakrishnan, Dana Boyd Barr, Vanessa
   Burrowes, Devan Campbell, Julia McPeek Campbell, Eduardo Canuz, Adly Castañaza, Howard Chang,
   William Checkley, Yunyun Chen, Marilú Chiang, Maggie L. Clark, Thomas Clasen, Rachel Craik, Mary
   Crocker, Victor Davila-Roman, Lisa de las Fuentes, Oscar De Léon, Anaité Diaz-Artiga, Ephrem
   Dusabimana, Lisa Elon, Juan Gabriel Espinoza, Irma Sayury Pineda Fuentes, Sarada Garg, Dina Goodman,
   Savannah Gupton, Meghan Hardison, Stella Hartinger, Steven A. Harvey, Mayari Hengstermann, Phabiola
   Herrera, Shakir Hossen, Penelope Howards, Lindsay Jaacks, Shirin Jabbarzadeh, Michael A. Johnson,
   Abigail Jones, Katherine Kearns, Miles Kirby, Jacob Kremer, Margaret Laws, Jiawen Liao, Amy Lovvorn,
   Fiona Majorin, Eric McCollum, John McCracken, Rachel Meyers, J. Jaime Miranda, Erick Mollinedo,
   Lawrence Moulton, Krishnendu Mukhopadhyay, Luke Naeher, Abidan Nambajimana, Florien
   Ndagijimana, Azhar Nizam, Jean de Dieu Ntivuguruzwa, Aris Papageorghiou, Jennifer Peel, Ricardo
   Piedrahita, Ajay Pillarisetti, Naveen Puttaswamy, Elisa Puzzolo, Ashlinn Quinn, Sarah Rajkumar, Usha
   Ramakrishnan, Davis Reardon, Ghislaine Rosa, Joshua Rosenthal, P. Barry Ryan, Zoe Sakas, Sankar
   Sambandam, Jeremy Sarnat, Suzanne Simkovich, Sheela S. Sinharoy, Kirk R. Smith, Kyle Steenland,
   Damien Swearing, Gurusamy Thangavel, Lisa M. Thompson, Ashley Toenjes, Lindsay Underhill, Jean
   Damascene Uwizeyimana, Viviane Valdes, Amit Verma, Lance Waller, Megan Warnock, Kendra Williams,
   Wenlu Ye, Bonnie Young

 Received: 5 February 2020; Accepted: 23 February 2020; Published: 28 February 2020

 Abstract: Researchers rely on sensor-derived data to gain insights on numerous human behaviors
 and environmental characteristics. While commercially available data-logging sensors can be
 deployed for a range of measurements, there have been limited resources for integrated hardware,
 software, and analysis platforms targeting field researcher use cases. In this paper, we describe
 Geocene, an integrated sensor data logging, survey, and analytics platform for field research. We
 provide an example of Geocene’s ongoing use in the Household Air Pollution Intervention Network
 (HAPIN). HAPIN is a large, multi-center, randomized controlled trial evaluating the impacts of a
 clean cooking fuel and stove intervention in Guatemala, India, Peru, and Rwanda. The platform
 includes Bluetooth-enabled, data-logging temperature sensors; a mobile application to survey
 participants, provision sensors, download sensor data, and tag sensor missions with metadata; and
 a cloud-based application for data warehousing, visualization, and analysis. Our experience
 deploying the Geocene platform within HAPIN suggests that the platform may have broad
Sustainability 2020, 12, 1805; doi:10.3390/su12051805                     www.mdpi.com/journal/sustainability
Sustainability 2020, 12, 1805 2 of 15
applicability to facilitate sensor-based monitoring and evaluation efforts and projects. This data
platform can unmask heterogeneity in study participant behavior by using sensors that capture both
compliance with and utilization of the intervention. Platforms like this could help researchers
measure adoption of technology, collect more robust intervention and covariate data, and improve
study design and impact assessments.
Keywords: sensors; data loggers; field research; cookstove; household energy; platforms; stove use
monitors
1. Introduction
The collection, storage, and analysis of sensor data is increasingly important for field research.
Where traditional observational or survey data may induce behavior changes (a bias known as the
“Hawthorne Effect”) [1,2] or result in recall or courtesy biases, sensors can provide objective data
[1,2]. In this paper, we discuss a novel, sensor-based data logging, surveying, and analytics platform
called “Geocene,” for deploying data-logging sensors in large fleets. To illustrate the capabilities of
this platform, we focus on one case study: the Household Air Pollution Intervention Network
(HAPIN) trial. HAPIN—a large, multi-center randomized controlled trial evaluating the impact of a
clean fuel intervention on exposure to air pollution and related health impacts among 3200
households—is using the Geocene platform to track cookstove adoption.
Many researchers face technical challenges when seeking to objectively evaluate environmental
performance or behavioral indicators using sensors in field-based studies. Often, the novel research
questions they want to explore cannot be answered with commercially-available sensor solutions.
Most commercial internet-of-things (IoT) devices are vertically integrated platforms to address
common consumer needs in developed markets (e.g., FitBit as a step-counting platform). By contrast,
researchers often want to use sensors to answer difficult questions about novel subjects (for instance,
assessing latrine use in the developing world [3]) for which commercially available, off-the-shelf
solutions do not exist. In these cases, researchers can develop their own hardware [4–7] or find
creative ways to apply available sensors [8–10].
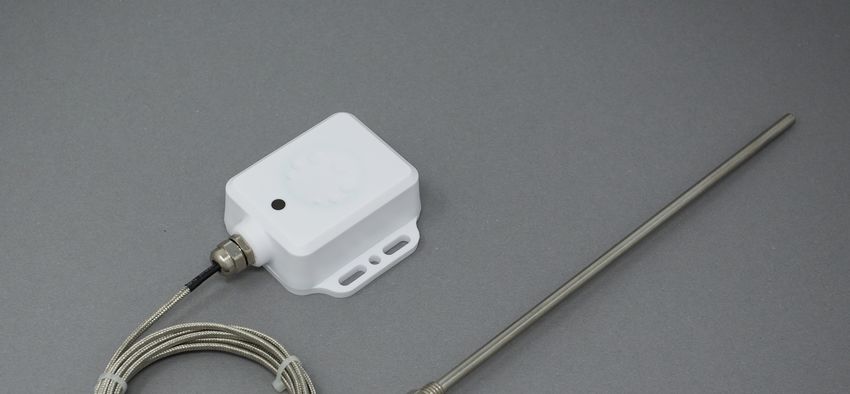
When no pre-existing solution exists, researchers often utilize a common, generic class of devices
called “data loggers” (Figure 1). Data loggers record data about the physical environment and can
often be equipped with many different types of sensors. Unlike IoT devices, which typically tend to
solve a particular use case for sensing (e.g., counting steps), data loggers record raw sensor data about
the world (e.g., recording the raw vibrations caused by stepping)—sometimes for a specific need, but
often simply to observe characteristics of the monitored environment [11].
Data loggers are often constrained in other ways, including in the amount of data they can store
and the ways in which data are retrieved from the loggers. Most data loggers transfer their data using
USB to a computer. The data transferred to the computer is often warehoused as static, comma-
separated values (CSV) or as a proprietary, encoded file. It is common for researchers to encode
metadata in downloaded file names (e.g., “site-a__house-1__treatment-true__phase-post.csv” or,
more cryptically, “a1truepost.csv”). Keys to merge raw sensor data with additional information
gathered from surveys are often encoded in the file name. The management and sharing of these data
files is commonly accomplished with commercial cloud storage platforms such as Dropbox, Box, or
Google Drive. The results of practices like this are large volumes of sometimes poorly organized raw
sensor data that must be analyzed with custom analytics.
Research in international development and public health often involves randomized controlled
trials or observational studies measuring small effects across hundreds to thousands of subjects
[3,5,8,9,12–14]. To measure these effects, data loggers are deployed in similarly large fleets. However,
with hundreds or thousands of data loggers, managing data can be a major barrier to successful
research.
Sustainability 2020, 12, 1805                                                                            3 of 15

      In our prior work [9,15–17], the operational costs of deploying traditional data loggers, including
fieldworker training and compensation, data management and analysis, and interpretation of
findings, outweighed the capital costs of the loggers. Additionally, because of the complexity of
supervising field teams to deploy data loggers, quality checks and analytics are often delayed, which
can result in errors with metadata, sensor placement, or other issues. These issues might have been
managed during deployment if easier review of data was possible.
      In this paper, we discuss the Geocene platform and illustrate its application in the context of the
multi-country HAPIN trial. Geocene attempts to address some of the challenges of deploying sensors
for field research. Geocene consists of (1) a sensing platform that accepts multiple sensors for different
parameters and includes a Bluetooth radio for communication with mobile devices; (2) inbuilt survey
and metadata management; and (3) cloud-based, customizable analysis tools to translate raw sensor
data into meaningful study metrics. In prior work [18], a multidisciplinary team of researchers
envisioned a “proposed integrated data collection, analysis, and sharing platform for impact
evaluation”; the Geocene platform makes significant progress towards realizing many aspects of that
vision.

      Figure 1. Examples of data loggers, as illustrated by page 1 of Google image search results for “data
      logger,” accessed November 11, 2019.

2. Materials and Methods
     We next describe the components of the platform, including hardware and its management
using mobile applications, data transfer (from sensors to mobile devices to the web), and data
translation and analysis.

2.1. Hardware
     Geocene data loggers, called Dots (Figure 2), are designed to operate in harsh environments
without access to power or internet-connected networks. Dots are powered by two AAA alkaline
batteries, which are available globally. Dots have gasketed seals and are water- and dust-resistant.
The onboard non-volatile flash memory in Dots can store 196,000 16-bit samples. At a 5-minute
sampling rate, memory fills in 22 months; at a 1-second rate, memory fills in 2.3 days. Because
memory is non-volatile, if the logger’s battery dies, data is preserved. Depending on the application,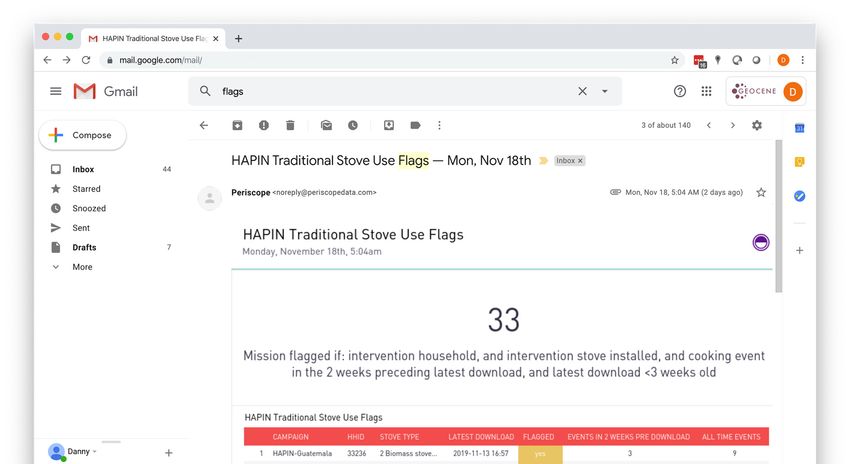
Sustainability 2020, 12, 1805                                                                            4 of 15

Dots can be outfitted with different sensors including temperature, electrical current, electrical
voltage, GPS, light, pressure, humidity, or vibration.

      Figure 2. Geocene Dot. The left panel is a photograph of a temperature-logging Geocene Dot; the right
      panel is a schematic of the Dot. The Dot contains a BLE (Bluetooth Low Energy) radio for
      communication with mobile devices, a button to power on and power off the device, and an LED to
      indicate device status. The Dot requires two AAA batteries and includes power management,
      communication, and data processing and storage capabilities.

2.2. Provisioning, Surveying and Metadata Management
     Loggers in the Geocene platform perform data collection “missions”—a period of data logging
activity performed by a particular data logger and associated with metadata. A narrative description
of a mission’s metadata might read as follows:
          “Temperature data was collected by the logger named ‘ABCD’ at a sampling rate
          of 2 minutes. The logger was installed on a traditional cookstove within home
          12345 in the intervention group.”
     Geocene’s platform manages metadata collection using a surveying tool built into the Geocene
iOS and Android mobile applications (Figure 3). Before a mission can be started (i.e., before the logger
can start recording data), field workers must complete a metadata survey that is associated with the
time series data that will be collected by the data logger (Figure 4). The survey contains fields that
restrict free data entry and enforce data types (e.g., responses that should be numeric are forced to be
numeric). Responses to survey questions are transformed into metadata “tags” that take on a key:value
format.
     For the descriptive example given above, survey questions about cookstove type, intervention
group status, and household identifier would be translated into tags like cookstove_type:traditional,
intervention_group:true, and household_id:12345. Tags can be used to search and filter data or as
covariates for downstream analyses.
     The platform also supports narrative “notes” for unstructured metadata. These kinds of
metadata can be useful for special cases or caveats that are important to remember for later analysis
and data cleaning. Examples of missions, tags, and notes are described in the HAPIN case study
below.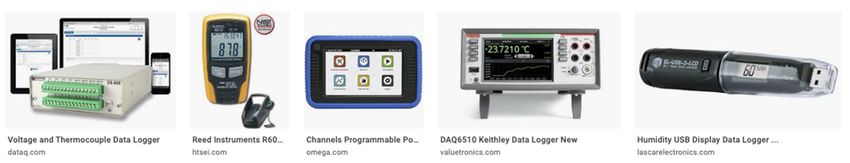
Sustainability 2020, 12, 1805                                                                   5 of 15

                     Figure 3. The Geocene mobile application, shown here running on Android.

      Figure 4. An example of an inbuilt survey in Geocene’s mobile application (from the ongoing
      Household Air Pollution Intervention Network (HAPIN) trial, shown here running on iOS).

2.3. Ongoing In-App Data Collection and Data Management
      When a user connects to a Dot via Bluetooth, the user can download the Dot’s sensor data. These
data transfers take from a few seconds to a few minutes depending on the amount of data in the Dot’s
memory. The application then displays the downloaded data on an interactive chart. This differs from
many traditional data loggers, where data might need to be downloaded to a laptop, then loaded into
an application (such as Microsoft Excel) to generate charts—all before data quality can be evaluated.
The interactive chart on the mobile application can be immediately used for in-field quality control
checks of sensor placement (e.g., for a cooking fire, to ensure that temperature spikes are hot enough
to clearly detect cooking on a stove but not so hot that they damage the sensor), participant behavior
and/or compliance (e.g., confirmation that a participant is using an intervention cookstove), or to
validate and elaborate participants’ survey responses (e.g., a user reported cooking three times
yesterday, but the sensor data shows just one single meal—why might this be?).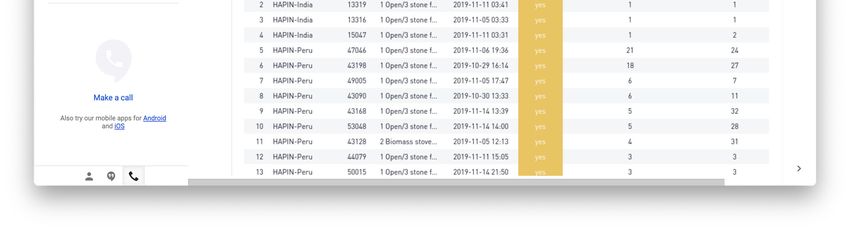
Sustainability 2020, 12, 1805 6 of 15
The mobile application allows the user to edit or add metadata or narrative notes at any time—
for instance, to correct a mistake during previous entry or to make notes about changes in the
environment that arose between visits.
2.4. Networking and Data Transfer to the Cloud
Dots communicate to Android or iOS mobile applications using Bluetooth Low Energy (BLE).
Data is logged continuously and stored locally on the logger. When a phone or tablet running the
Geocene app approaches the Dot, data can be transferred from the Dot to the mobile device over BLE.
The loggers communicate over BLE rather than cellular, Wi-Fi, or other internet-connected networks
to manage cost and power consumption, and, more importantly, because internet-connected
networks are weak or absent in many locations where field work is performed. BLE data has a range
of 3–100 meters, depending on the number of obstacles in the way. However, the 100 meter theoretical
range of BLE is rarely achieved in practice; with Dots, data can typically be downloaded in real-world
contexts from up to 30 meters away with clear line of sight, or about 10 meters away with a wall or
significant obstacle in the way. In practice, field staff can typically download data from just outside
homes or structures in which Dots are placed.
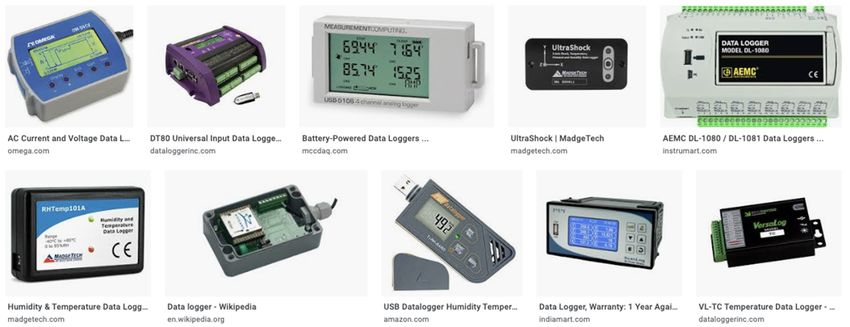
After data moves from the logger to the mobile device, the data must be moved to the internet.
The Geocene networking topology relies on “sneakernet,” a step in the data transfer process where
data must be physically moved (i.e., by walking it from one place to another while wearing sneakers)
to an internet-connected network (Figure 5).
Figure 5. Schematic of Geocene data collection. Fieldworkers either visit households or, in some cases,
walk near households. Dots within range are found by the mobile application and data can be
downloaded and the Dot relaunched. When fieldworkers return to their field HQ, where they have
Wi-Fi and/or cell service, data is transmitted to Geocene’s cloud servers for warehousing and
processing.
2.5. Cloud Ingress for Dots and Third Party Data Loggers
The mobile application syncs data to the cloud-based web application. This web application
communicates with the mobile application and other web services using a REpresentational State
Transfer (REST) application programming interface (API). Specifically, the Geocene web app is built
on the Django Python REST framework.
Raw sensor data that is synced via the mobile app is first written to Amazon S3. Then, a series
of server-based workers import queued raw data into a relational database. Raw logger data from
non-Geocene data loggers can also be imported into the platform from a web dashboard (Figure 6).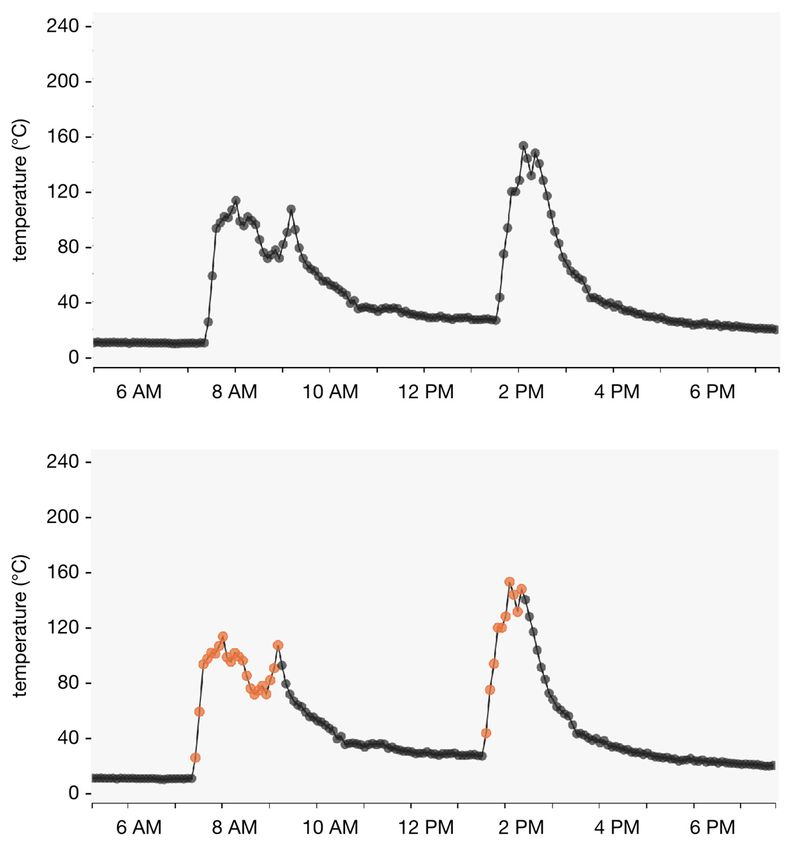
Sustainability 2020, 12, 1805                                                                         7 of 15

      Figure 6. The import module for non-Geocene data loggers. Currently, the module supports data from
      a variety of data-logging temperature sensors, including Maxim iButtons, Wellzion SSN-61
      Thermocouple loggers, and EME kSUMs.

2.6. Data Warehousing and Viewing
     After ingress, all mission metadata and time series data are warehoused in a PostgreSQL
relational database. This database serves the Geocene web dashboard via the aforementioned REST
API. Backups of this database are made daily and stored as flat objects on Amazon S3.
     Geocene’s web application includes a dashboard for viewing and editing data. The default
dashboard can also be augmented with custom dashboards and email alerts to track relevant
program performance indicators and quality control metrics.

2.7. Cloud Analytics: Models and Processors
     Geocene’s cloud platform includes an analytics module that identifies and summarizes events
of interest in time series data (Figure 7). The primary purpose of the cloud analytics engine is to
reduce large volumes of raw time series data into summaries of events of interest.
     The Geocene cloud analytics system performs analysis on data using “models” and
“processors.” A model is a function that can detect events in time series data. The simplest example
of a model would be a “threshold” model that detects periods that are above, below, or equal to a
particular threshold. A model can be customized to meet analytical needs; for example, a threshold
model could detect all temperatures below 0 °C. After a model is customized, it is added to a
processor, which then analyzes a user-selected subset of missions (e.g., missions tagged
“intervention_group:true”).
     The Geocene analytics framework is built upon the open-source SUMSarizer R library
(https://github.com/geocene/sumsarizer/), to which the authors of this paper have contributed
substantially. The event detection models available in SUMSarizer and, thus, Geocene, described
below.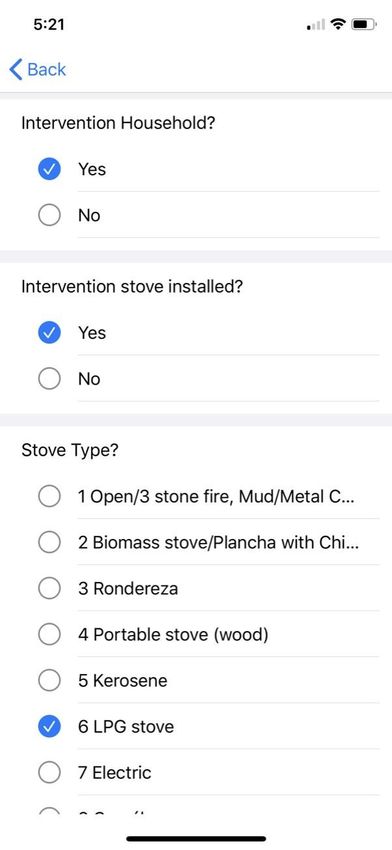
Sustainability 2020, 12, 1805                                                                              8 of 15

      Figure 7. Details of a mission in the Geocene dashboard. Data visualized in the screenshot above
      includes the raw temperature trace (the continuous blue line) and areas identified as a stove use event
      (the highlighted orange bars). The plot on this dashboard is zoomable and scrollable, allowing users
      to focus on areas of interest.

2.7.1. Custom Ensemble Machine Learning
    Researchers are often able to visually identify important features of data. For instance,
temperature peaks from a sensor placed on a stove might represent cooking events and may be easily
visually identifiable. Users with fairly large datasets can upload a subset of their data to a web-based
application known as TRAINSET, which facilitates rapid labeling of features of interest. In
TRAINSET, users click and drag over the portions of the charted data they identify as important
events. This creates a labeled training dataset, which is used to train an ensemble machine learning
model, which can then automatically identify similar features across the entire dataset.

2.7.2. FireFinder
     FireFinder is a deterministic algorithm that is used to detect rises in temperature associated with
heat addition events. Most users of SUMSarizer and Geocene use FireFinder to detect cooking events
in temperature time series data (Figure 8). FireFinder operates in 7 distinct steps to detect events
(using “cooking” events here as an illustrative event example):
1.    Assume no points are cooking.
2.    Assume all points above a user-set primary threshold are cooking—this is a first pass at
      identifying periods of stove usage.
3.    Assume points with long runs of negative slopes are not cooking, because the stove is cooling
      off.
4.    Assume points with very positive slopes are cooking, because the stove is heating up.
5.    Assume points with very negative slopes are not cooking because the stove is quickly cooling
      off.
6.    Ignore points with inter-sample gaps greater than sample interval—these gaps are due to paused
      missions.
7.    Smooth identified events by applying a user-set minimum event length, minimum inter-event
      gap, and minimum event temperature.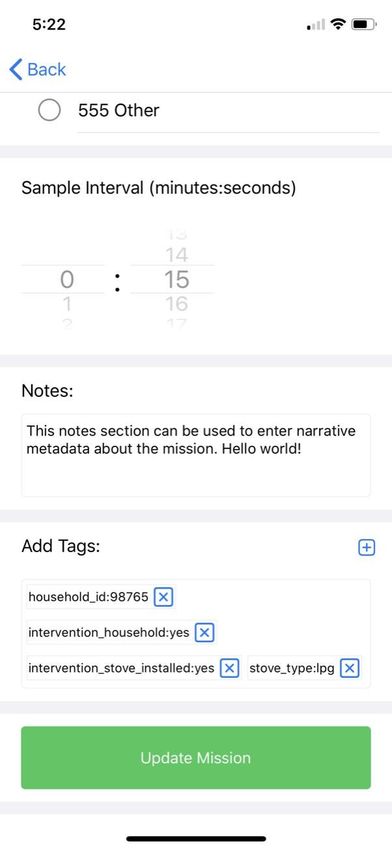
Sustainability 2020, 12, 1805                                                                        9 of 15

      Figure 8. Sample data from a Geocene Dot temperature logger. The top panel includes data prior to
      analysis with FireFinder; the bottom panel shows the periods FireFinder identified as cooking (in
      orange).

2.7.3. Threshold
     The threshold algorithm is simple: it looks for periods above, below, or equal to a specific user-
specified value. These can be particularly useful for detecting sensor errors or out-of-spec
environmental conditions, for example, extremely negative or extremely positive temperatures.

2.7.4. Constant
     The constant detector looks for a user-specified length of unchanging values, typically indicative
of an error.

2.8. Exports
      Users can download all of their analyzed data from Geocene as flat-text comma-separated value
files that can be opened in Microsoft Excel, R, or other programs to analyze and visualize data.
Downloads include a list of missions, mission tags, raw time series metrics, sensor types, and a list of
events detected by all processors applied to uploaded data.

2.9. Platform Usage
    As of February 2020, the Geocene platform has been used to deploy 12,258 data collection
missions with 500 million unique data points. The analytics system has detected about 1.9 million
events within that data.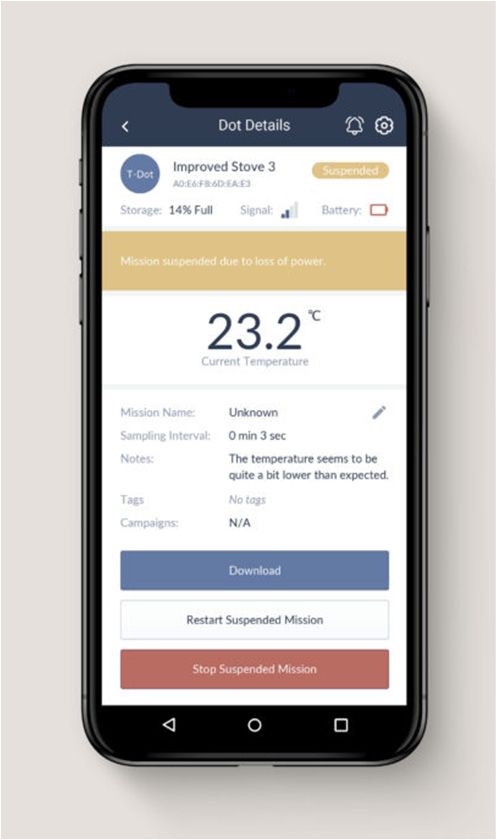
Sustainability 2020, 12, 1805                                                                        10 of 15

3. HAPIN: A Case Study

3.1. Overview
      The Household Air Pollution Intervention Network (HAPIN) trial is an ongoing randomized
controlled trial (RCT) enrolling 3200 households in Guatemala, India, Peru, and Rwanda. HAPIN is
evaluating the impact of cooking with liquefied petroleum gas (LPG) versus traditional biomass-
fueled stoves on birth outcomes in pregnant women, pneumonia and stunting in infants, and blood
pressure in older adult women [19]. Mixed use of traditional and clean cooking fuels is common in
household air pollution intervention studies [8,9,15,20]. Models estimate that even occasional use of
biomass fuel can lead to high average exposures to harmful household air pollution [21]. With the
goal of achieving as much compliance with exclusive LPG use as possible among intervention
households, HAPIN is using the Geocene platform to monitor stove use and reinforce the use of LPG
and abandonment of biomass-fuelled stoves among intervention participants.
      The study protocol has been reviewed and approved by the institutional review boards (IRBs)
or Ethics Committees at Emory University (00089799), Johns Hopkins University (00007403), Sri
Ramachandra Institute of Higher Education and Research (IEC-N1/16/JUL/54/49) and the Indian
Council of Medical Research, Health Ministry Screening Committee (5/8/4-30/(Env)/Indo-US/2016-
NCD-I), Universidad del Valle de Guatemala (146-08-2016/11-2016) and Guatemalan Ministry of
Health National Ethics Committee (11-2016), Asociación Beneficia PRISMA (CE3571.16), the London
School of Hygiene and Tropical Medicine (11664-5), the Rwandan National Ethics Committee
(No.357/RNEC/2018), and Washington University in St. Louis (201611159). The study has been
registered with ClinicalTrials.gov (Identifier NCT02944682).
      Data loggers and related analysis routines used to evaluate cookstove adoption are often
referred to as part of the Stove Use Monitoring System (SUMS). Stove use monitoring in HAPIN
enables field teams to respond to non-compliant intervention households who use their traditional
stoves. It also provides objectively quantified metrics of stove use for incorporation in statistical
models and other analyses.
      About 3800 (30%) of all Geocene missions belong to HAPIN. HAPIN’s globally-distributed field
staff have synced approximately 155 million unique data points from these missions. HAPIN has
deployed Geocene’s cloud analytics to detect 330 thousand events of various kinds ranging from
cooking, excessive probe temperature, and probe errors (Figure 9). Each day, HAPIN syncs about 500
thousand new data points to the platform, and the analytics detect about 1000 new events daily.

               Figure 9. Events detected by Geocene cloud analytics per month for the HAPIN trial.
Sustainability 2020, 12, 1805 11 of 15
3.2. Hardware and Provisioning, Surveying, and Metadata Management.
Previous studies of household air pollution interventions relied primarily on Maxim iButton
temperature data loggers [8,13,15], which have limited memory and temperature sensing ranges, or
low-cost thermocouple data-loggers [16,20]. The Geocene Dots used in HAPIN use k-type
thermocouples. K-type thermocouples have a theoretical range of about −200°C to 1250 °C, but
depending on build quality and environmental considerations, usable temperature ranges can be
much more limited. The high temperature range of thermocouples enables HAPIN field staff to place
Dots’ sensing elements close to the combustion zone of traditional and LPG cookstoves to detect
greater temperature increases when the stove is lit during cooking. Field staff place the probe in a
location where cooking will induce a temperature spike of at least 100 °C, but no more than 400 °C.
Although well-made thermocouples can reach temperatures of >1000 °C, surpassing 400 °C regularly
can significantly degrade their useful lifetime; therefore, the HAPIN team aims for maximum
temperatures of 400 °C to ensure probes will last for the duration of the trial.
When installing Dots, HAPIN field staff answer a common set of questions about each
deployment on handheld tablets using the inbuilt survey (Figure 4). These include data on the specific
stove type on which the Dot is installed, the household ID, the type of household (intervention or
non-intervention), and other metadata that can subsequently be used to filter and subset data. For
example, trial investigators can examine data by country, by intervention status, and/or by stove type.
3.3. Date Warehousing and Viewing
Given the large sample size of the trial (3200 households across 4 countries; 800 per country, 400
each in control and intervention arms), approximately 3140 Geocene temperature loggers will be in
use for periods of approximately 18 months. A team of roughly 50 HAPIN investigators and field
staff have been trained to provision and deploy these data loggers and download data from them
every two weeks. Dot data are synced using the sneakernet networking topology: field workers
collect data in the field using handheld tablets and synchronize the data with the cloud upon return
to their Wifi-equipped offices (Figure 9).
3.4. Analytics
Stove use monitoring in HAPIN serves multiple purposes. During the trial, FireFinder is
parameterized to be very sensitive to temperature increases from Dots on traditional stoves to flag
all potential traditional stove uses. The sensitive parameters applied to FireFinder result in a high
false-positive rate, but this is desirable for the use case of reducing the rate of false negatives to near-
zero levels. In the HAPIN context, a false negative cooking event would mean a participant was using
their cookstove, but HAPIN staff could not detect this use in the data. Field staff use this data to visit
flagged households and provide behavioral change guidance to encourage exclusive LPG use.
Additionally, HAPIN uses several mechanisms to ensure data quality. First, constant and
threshold detectors identify Dots with thermocouple or other errors. Study staff visit flagged
households to either re-position, repair, or replace the Dot probes or entire Dots. Second, a dashboard
and weekly email highlight households with missing metadata, such as household identifiers, stove
type, intervention installation status, and/or county location.
Finally, HAPIN uses a modified version of FireFinder to create summary data by household on
the frequency and duration of traditional stove use. These data will be used in statistical models to
estimate the influence of stove usage on exposure to household air pollutants, among other analyses
[19].
3.5. Administration
To help improve data quality and increase accountability, HAPIN uses custom dashboards and
email alerts through the Geocene platform. Site leaders receive weekly email alerts with screenshots
of dashboards listing households with traditional stove use (Figure 10), Dots with technical problems,
and missions with missing or corrupt metadata.Sustainability 2020, 12, 1805 12 of 15
Figure 10. A weekly email alert about non-compliant households in the HAPIN trial.
In the first three weeks after deploying alerts on missing metadata, the total number of missions
with missing or corrupt metadata dropped from 501 to 200; in other words, 60% of all known data
quality errors were fixed within the first household visit after the system was established. The HAPIN
team was able to use these alerts to address operational errors early, improving the ease and quality
of later analysis.
3.6. Field Benefits and Challenges
The ability to download Dot data over Bluetooth (and without Wi-Fi or cellular network access)
has greatly facilitated fieldwork. Field staff are able to download data from outside a participant’s
house, even when participants are not home, preventing the need for multiple household visits. Also,
the Geocene platform’s ability to program missions and download data without Wi-Fi allows the
HAPIN team to collect data from many participants who live in areas without Wi-Fi or cellular signal.
However, challenges have arisen when updates to the Geocene mobile applications were not fully
downloaded prior to leaving for the field, resulting in incomplete metadata.
Achieving correct placement of the thermocouple probe, that is, to achieve temperatures greater
than 100 °C and less than 400 °C during cooking, is consistently difficult given the heterogeneity in
stove construction and structure. Staff struggle to position probes correctly at installation, but are
able to use the provided dashboard to identify households where probes have excessive
temperatures, and in those homes, move the probes. Additionally, in some contexts, where stoves are
either outdoors or portable, there have been challenges in hanging and protecting the logger body.
HAPIN teams fashioned protection out of sealable plastic containers, dust bins, and PVC pipes to
protect these outdoor Dot installations.Sustainability 2020, 12, 1805 13 of 15
Due to the high sensitivity of the FireFinder algorithm, some households are incorrectly flagged
as cooking with their traditional stoves when the stove was not actually used. Mis-flags are often due
to outdoor probe positions that are heated by strong direct sunlight, or other temperature sources in
kitchens such as hot pots placed on traditional stoves to cool or for storage. Field staff sometimes
make visits to falsely flagged households to reinforce exclusive LPG use when this reinforcement is
not necessary; however, this precaution is necessary to avoid missing households who are using their
traditional stove.
Given that Dots can hold many months of data, field teams initially did not delete data from the
Dot after downloading. However, downloads took up to several minutes when there was a large
accumulation of data on the Dot. Thus, field teams started deleting data after downloading to reduce
time in participant homes. However, after clearing the Dot, the data exist only on the tablet that made
the download, which runs the risk of data loss if there are any problems with the tablet or the
downloaded data. Occasionally, data downloaded from a Dot does not sync properly with the cloud,
but this is largely due to situations where the field worker who originally started the mission never
synced the mobile device that originated the mission. Finally, the Geocene application interface is
currently only available in English, which causes difficulty for field teams in other countries who
often do not speak English. Although staff were able to learn how to program the Dots using the
English prompts, they often have trouble interpreting and responding appropriately to warning and
error messages.
4. Discussion and Conclusions
Experiences deploying Geocene in the HAPIN trial suggest that the platform has overcome
many of the challenges with previously available data loggers for field research. The ability to
download over Bluetooth with mobile applications avoids the need to remove data loggers from their
installation location to connect the device to the computer. The surveys allow more accurate
collection and storage of metadata. Real-time data processing allows for continuous review and
responses by field staff to ensure data quality. The data analysis and summary dashboards also
facilitate the process of calculating desired indicators from raw data, which can be viewed by
globally-dispersed investigators.
However, several challenges remain with the Geocene platform. Achieving correct positioning
of the thermocouple probe and adequate protection of the data logger body requires piloting and
adjustment based on differing local conditions. Also the algorithm used to flag events of interest may
not always correctly capture targeted events. For example, highly sensitive algorithms may falsely
flag non-cooking events, while less sensitive algorithms may fail to flag actual cooking events. Field
teams must also balance the desire to limit download times by deleting data after each download
with the risk of losing data if problems occur with the downloaded file or tablet before
synchronization with the cloud. Issues with language and data synchronization have also proven
challenging. We anticipate that similar initial challenges may exist for others who use the platform,
whether for cookstove adoption monitoring or other sensor-based needs.
Our experiences with deployment suggest several potential improvements. Providing
localization of the mobile application (i.e., translation into other languages) and addressing data
synchronization issues would facilitate the use of the platform in global field settings. Also, capturing
and sharing guidance on probe placement, Dot installation, and algorithm considerations could help
research teams deploying the platform for the first time. Lastly, further expanding the compatibility
of Geocene with other data loggers could enable teams who already have experience using (or have
data from) other types of devices to use the platform for data analysis.
The Geocene platform has the potential to not only ease data collection and improve data quality
in research studies, but could also be applied by programs seeking to monitor use of their product.
For example, government programs promoting adoption of clean fuel stoves could use the Geocene
platform to monitor use of the clean fuel stoves given to households through the program. This would
enable implementers with limited analysis capability to quantify the impact of their program and
make adjustments as necessary. Additionally, it would provide programs with more objective dataSustainability 2020, 12, 1805 14 of 15
than could be derived from surveys alone. Facilitating the ability of researchers and program
implementers to easily monitor behaviors could improve the impact of promoted technologies, which
in turn can improve air quality, health, quality of life, or other outcomes among users.
Author Contributions: Conceptualization, D.L.W., A.P. and K.N.W.; Investigation, A.P.; Methodology, D.L.W.
and A.P.; Software, D.L.W. and A.P.; Writing – original draft, D.L.W. and A.P.; Writing – review & editing,
D.L.W., A.P. and K.N.W. All authors have read and agreed to the published version of the manuscript.
Funding: The HAPIN trial is funded by the U.S. National Institutes of Health (cooperative agreement
1UM1HL134590) in collaboration with the Bill & Melinda Gates Foundation [OPP1131279].
A multidisciplinary, independent Data and Safety Monitoring Board (DSMB) appointed by the National Heart,
Lung, and Blood Institute (NHLBI) monitors the quality of the data and protects the safety of patients enrolled
in the HAPIN trial. NHLBI DSMB: Nancy R. Cook, Sc.D.; Stephen Hecht, Ph.D.; Catherine Karr, M.D., Ph.D.;
Katie H. Kavounis, M.P.H.; Dong-Yun Kim, Ph.D.; Joseph Millum, Ph.D.; Lora A. Reineck, M.D., M.S.; Nalini
Sathiakumar, M.D., Dr.P.H.; Paul K. Whelton, M.D.; Gail G. Weinmann, M.D.
Program Coordination: Gail Rodgers, M.D., Bill & Melinda Gates Foundation; Claudia L. Thompson, Ph.D.,
National Institute of Environmental Health Science (NIEHS); Mark J. Parascandola, Ph.D., M.P.H., National
Cancer Institute (NCI); Danuta M. Krotoski, Ph.D., Eunice Kennedy Shriver National Institute of Child Health
and Human Development (NICHD); Joshua P. Rosenthal, Ph.D., Fogarty International Center (FIC); Conception
R. Nierras, Ph.D., NIH Office of Strategic Coordination Common Fund; Antonello Punturieri, M.D., Ph.D. and
Barry S. Schmetter, B.S., National Heart, Lung, and Blood Institute (NHLBI).
The findings and conclusions in this report are those of the authors and do not necessarily represent the official
position of the U.S. National Institutes of Health or Department of Health and Human Services.
AP was supported by the HERCULES Center P30ES019776.
Acknowledgments: Early-stage research funding for this platform was funded, in part, by the Development
Impact Lab (USAID Cooperative Agreement AID-OAA-A-13-00002), part of the USAID Higher Education
Solutions Network. We are thankful for the support for this work from Development Impact Lab, the Higher
Educational Solutions Network, and the United States Agency for International Development. Additionally,
multiple grants from the Center for Effective Global Action (CEGA) at UC Berkeley helped to develop
preliminary embodiments of the hardware and analytics software described in this work. We are grateful to
CEGA for their steadfast support of our vision. More recently, refinement of this platform and the open-source
analytics packages that power the platform were funded by the NIH Clean Cooking Implementation Science
Network with funding from the NIH Common Fund for Global Health. The development team and cookstove
community are grateful for this support. Finally, we thank the Clean Cooking Alliance, which operates with the
support of the United Nations Foundation, for their ongoing support of tools, research, and capacity-building in
the clean cooking sector at large.
Conflicts of Interest: Coauthor Daniel Wilson is cofounder of Geocene Inc.
References
1. Barnes, B.R. The Hawthorne Effect in community trials in developing countries. Int. J. Soc. Res. Methodol.
2010, 13, 357–370.
2. Zwane, A.P.; Zinman, J.; Van Dusen, E.; Pariente, W.; Null, C.; Miguel, E.; Kremer, M.; Karlan, D.S.;
Hornbeck, R.; Giné, X.; et al. Being surveyed can change later behavior and related parameter estimates.
Proc. Natl. Acad. Sci. USA 2011, 108, 1821–1826.
3. Clasen, T.; Fabini, D.; Boisson, S.; Taneja, J.; Song, J.; Aichinger, E.; Bui, A.; Dadashi, S.; Schmidt, W.-P.; Burt,
Z.; et al. Making sanitation count: Developing and testing a device for assessing latrine use in low-income
settings. Environ. Sci. Technol. 2012, 46, 3295–3303.
4. Wilson, D.L.; Coyle, J.R.; Thomas, E.A. Ensemble machine learning and forecasting can achieve 99% uptime
for rural handpumps. PLoS ONE 2017, 12, e0188808.
5. Pillarisetti, A.; Allen, T.; Ruiz-Mercado, I.; Edwards, R.; Chowdhury, Z.; Garland, C.; Hill, L.D.; Johnson,
M.; Litton, C.D.; Lam, N.L.; et al. Small, Smart, Fast, and Cheap: Microchip-Based Sensors to Estimate Air
Pollution Exposures in Rural Households. Sensors 2017, 17, 1879.
6. Holstius, D.M.; Pillarisetti, A.; Smith, K.R.; Seto, E. Field calibrations of a low-cost aerosol sensor at a
regulatory monitoring site in California. Atmos. Meas. Tech. 2014, 7, 1121–1131.Sustainability 2020, 12, 1805 15 of 15
7. Gao, M.; Cao, J.; Seto, E. A distributed network of low-cost continuous reading sensors to measure
spatiotemporal variations of PM2.5 in Xi’an, China. Environ. Pollut. 2015, 199, 56–65.
8. Ruiz-Mercado, I.; Canuz, E.; Walker, J.L.; Smith, K.R. Quantitative metrics of stove adoption using Stove
Use Monitors (SUMs). Biomass Bioenergy 2013, 57, 136–148.
9. Wilson, D.L.; Coyle, J.; Kirk, A.; Rosa, J.; Abbas, O.; Adam, M.I.; Gadgil, A.J. Measuring and Increasing
Adoption Rates of Cookstoves in a Humanitarian Crisis. Environ. Sci. Technol. 2016, 50, 8393–8399.
10. Weinstein, J.R.; Diaz-Artiga, A.; Benowitz, N.; Thompson, L.M. Reductions in urinary metabolites of
exposure to household air pollution in pregnant, rural Guatemalan women provided liquefied petroleum
gas stoves. J. Expo. Sci. Environ. Epidemiol. 2020, 30, 362-373.
11. Majumder, S.; Mondal, T.; Deen, M. Wearable Sensors for Remote Health Monitoring. Sensors 2017, 17, 130.
12. Kirby, M.A.; Nagel, C.L.; Rosa, G.; Zambrano, L.D.; Musafiri, S.; de Dieu Ngirabega, J.; Thomas, E.A.;
Clasen, T. Effects of a large-scale distribution of water filters and natural draft rocket-style cookstoves on
diarrhea and acute respiratory infection: A cluster-randomized controlled trial in Western Province,
Rwanda. PLOS Med. 2019, 16, e1002812.
13. Lozier, M.J.; Sircar, K.; Christensen, B.; Pillarisetti, A.; Pennise, D.; Bruce, N.; Stanistreet, D.; Naeher, L.;
Pilishvili, T.; Farrar, J.L.; et al. Use of Temperature Sensors to Determine Exclusivity of Improved Stove Use
and Associated Household Air Pollution Reductions in Kenya. Environ. Sci. Technol. 2016, 50, 4564–4571.
14. Liao, J.; McCracken, J.P.; Piedrahita, R.; Thompson, L.; Mollinedo, E.; Canuz, E.; De Léon, O.; Díaz-Artiga,
A.; Johnson, M.; Clark, M.; et al. The use of bluetooth low energy Beacon systems to estimate indirect
personal exposure to household air pollution. J. Expo. Sci. Environ. Epidemiol. 2019.
15. Pillarisetti, A.; Vaswani, M.; Jack, D.; Balakrishnan, K.; Bates, M.N.; Arora, N.K.; Smith, K.R. Patterns of
stove usage after introduction of an advanced cookstove: The long-term application of household sensors.
Environ. Sci. Technol. 2014, 48, 14525–14533.
16. Pillarisetti, A.; Ghorpade, M.; Madhav, S.; Dhongade, A.; Roy, S.; Balakrishnan, K.; Sankar, S.; Patil, R.;
Levine, D.I.; Juvekar, S.; et al. Promoting LPG usage during pregnancy: A pilot study in rural Maharashtra,
India. Environ. Int. 2019, 127, 540–549.
17. Wilson, D.L.; Monga, M.; Saksena, A.; Kumar, A.; Gadgil, A. Effects of USB port access on advanced
cookstove adoption. Dev. Eng. 2018, 3, 209–217.
18. Kipf, A.; Brunette, W.; Kellerstrass, J.; Podolsky, M.; Rosa, J.; Sundt, M.; Wilson, D.; Borriello, G.; Brewer,
E.; Thomas, E. A proposed integrated data collection, analysis and sharing platform for impact evaluation.
Dev. Eng. 2016, 1, 36–44.
19. Clasen, T.; Checkley, W.; Peel, J.L.; Balakrishnan, K.; McCracken J.; Rosa, G.; Thompson, L.; Barr, D.B.; Clark,
M.L.; Johnson, M.; Waller, L.; Jaacks, L.M.; Steenland, K.; Miranda, J.J.; Chang, H.; Kim, D.; McCollum, E.D.;
Davila-Roman, V.G.; Papageorghiou, A.; Rosenthal, J.; et al. Design and Rationale of the HAPIN Study: A
Multicountry Randomized Controlled Trial to Assess the Effect of Liquefied Petroleum Gas Stove and
Continuous Fuel Distribution. Environmental Health Perspectives (in press).
20. Piedrahita, R.; Dickinson, K.L.; Kanyomse, E.; Coffey, E.; Alirigia, R.; Hagar, Y.; Rivera, I.; Oduro, A.; Dukic,
V.; Wiedinmyer, C.; et al. Assessment of cookstove stacking in Northern Ghana using surveys and stove
use monitors. Energy Sustain. Dev. 2016, 34, 67–76.
21. Johnson, M.A.; Chiang, R.A. Quantitative Guidance for Stove Usage and Performance to Achieve Health
and Environmental Targets. Environ. Health Perspect. 2015, 123, 820–826.
© 2020 by the authors. Licensee MDPI, Basel, Switzerland. This article is an open access
article distributed under the terms and conditions of the Creative Commons Attribution
(CC BY) license (http://creativecommons.org/licenses/by/4.0/).You can also read