THE MAP OF ORGANIC CARBON IN TOPSOILS IN EUROPE: VERSION 1.2 - SEPTEMBER 2003
←
→
Page content transcription
If your browser does not render page correctly, please read the page content below

THE MAP OF ORGANIC CARBON
          IN TOPSOILS IN EUROPE:
         VERSION 1.2 - SEPTEMBER 2003
                     Explanation of:
           Special Publication Ispra 2004 No.72
                        S.P.I.04.72

            Robert J.A. Jones, Roland Hiederer
              Ezio Rusco, Peter J. Loveland
                 and Luca Montanarella

2004                                              EUR 21209 EN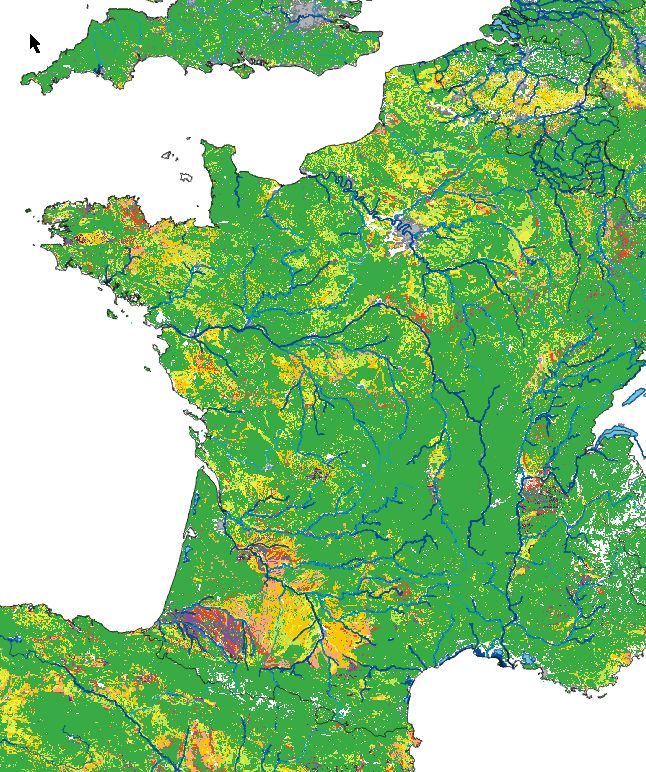
This document may be cited as follows:

Jones, R.J.A., Hiederer, R., Rusco, E., Loveland, P.J. and Montanarella, L. (2004). The map of
    organic carbon in topsoils in Europe, Version 1.2, September 2003: Explanation of Special
    Publication Ispra 2004 No.72 (S.P.I.04.72). European Soil Bureau Research Report No.17,
    EUR 21209 EN, 26pp. and 1 map in ISO B1 format. Office for Official Publications of the
    European Communities, Luxembourg.

                                           COVER PAGE:

              TOP LEFT: SOIL MAPPING UNITS OF EUROPEAN SOIL DATABASE

                TOP RIGHT: LAND USE MAP OF EUROPE BASED ON CORINE

            BOTTOM LEFT: AVERAGE ANNUAL ACCUMULATED TEMPERATURE

        BOTTOM RIGHT: THE MAP OF ORGANIC CARBON IN TOPSOILS IN EUROPE

             Corrigendum: The map of organic carbon by country, inset on S.P.I.04.72,
          shows carbon stocks calculated in Giga tonnes (Gt) not tera tonnes (Tt) as printed.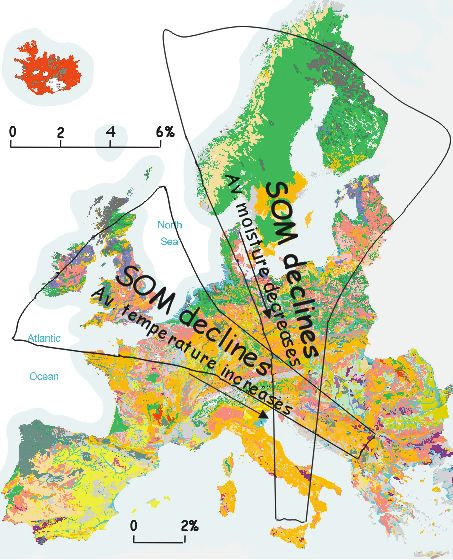
THE MAP OF ORGANIC CARBON
   IN TOPSOILS IN EUROPE:

      VERSION 1.2 - SEPTEMBER 2003
                    Explanation of:
          Special Publication Ispra 2004 No.72
                       S.P.I.04.72

Robert J. A. Jones (1,3), Roland Hiederer (2), Ezio Rusco (1),
     Peter J. Loveland (3) and Luca Montanarella (1)

                   (1) Soil and Waste Unit
         Institute for Environment & Sustainability
      Joint Research Centre (JRC), Ispra (VA), Italy

                 (2) Land Management Unit
         Institute for Environment & Sustainability
      Joint Research Centre (JRC), Ispra (VA), Italy

           (3) National Soil Resources Institute,
              Cranfield University, Silsoe UK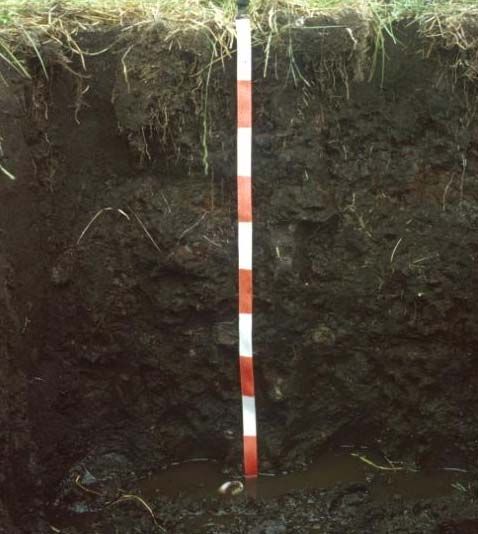
MISSION OF THE INSTITUTE FOR ENVIRONMENT & SUSTAINABILITY
The mission of the Institute of Environment and Sustainability is to provide scientific and technical
support to EU strategies for the protection of the environment and sustainable development.
Employing an integrated approach to the investigation of air, water and soil contaminants, its goals
are sustainable management of water resources, protection and maintenance of drinking waters,
good functioning of aquatic ecosystems and good ecological quality of surface waters.
LEGAL NOTICE
Neither the European Commission nor any person
acting on behalf of the Commission is responsible for
the use, which might be made of the following information.
A great deal of additional information on the
European Union is available on the Internet.
It can be accessed through the Europa server
(http://europa.eu.int)
EUR 21209 EN
European Communities, 2004
Reproduction is authorised provided the source is acknowledged
Printed in Italy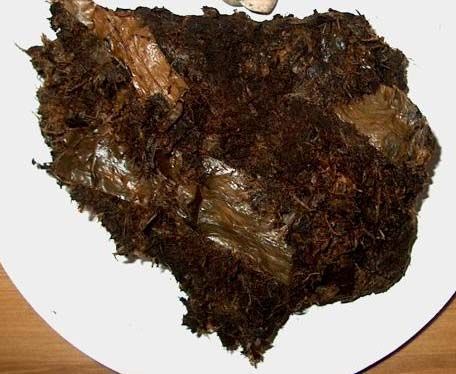
TABLE OF CONTENTS
                                                                                                                                                Page

SUMMARY ........................................................................................................................1
INTRODUCTION ...............................................................................................................3
PURPOSE OF THE MAP ..................................................................................................3
FUNCTION OF OC/OM IN SOILS .....................................................................................3
 Factors Influencing Organic Matter Status of Soils................................................................... 4
  Effect of Climate ........................................................................................................................... 5
  Effect of Soil Properties ................................................................................................................ 6
  Effect of Erosion and Vegetation .................................................................................................. 6
  Effect of Cultivation...................................................................................................................... 6
 Sources of Soil Organic Matter .................................................................................................... 7
 Decline in Soil Organic Matter..................................................................................................... 7
ASSESSING ORGANIC MATTER CONTENT OF EUROPEAN SOILS............................8
 Previous Studies............................................................................................................................. 8
 ESB Approach ............................................................................................................................... 9
  European Soil Database................................................................................................................. 9
  Direct Mapping Approach............................................................................................................. 9
 Revised Pedo-Transfer Approach for Europe ............................................................................ 9
  Description of Pedo-Transfer Rules ............................................................................................ 10
  Data Sources................................................................................................................................ 10
  Temperature Effect...................................................................................................................... 11
  Processing Environment.............................................................................................................. 12
VERIFICATION OF CALCULATED OC ..........................................................................12
 Measured data from Ground Surveys ....................................................................................... 12
  Aggregation ................................................................................................................................. 13
 Results: Ground vs. Modelled Data ........................................................................................... 14
  England & Wales......................................................................................................................... 14
  Italy.............................................................................................................................................. 18
SOIL DEGRADATION.....................................................................................................19
CONCLUSIONS ..............................................................................................................21
RECOMMENDATIONS ...................................................................................................22
REFERENCES ................................................................................................................23
SOIL SUBGROUP CODES AND SOIL NAMES (FAO-UNESCO, 1974).........................26

EUROPEAN SOIL BUREAU RESEARCH REPORTS
EUROPEAN SOIL BUREAU TECHNICAL REPORTS
TABLE OF FIGURES
Page
Figure 1: Mineral-organic soil material in (a) Phaeozem and (b) Calcisol 3
Figure 2 Organic soil material: fibrous peat 4
Figure 3 Organic soil material: semi-fibrous peat 4
Figure 4 Histosol developed in deep peat 4
Figure 5 Ferri-humic podzol showing the accumulation of organic matter in the surface 5
horizon and also translocation of organic material in the subsoil
Figure 6 Influence of temperature and moisture on soil organic matter (OM) in Europe 6
Figure 7 General influence of cultivation and soil management on OC contents at 7
Rothamsted during the past 150 years
Figure 8 Distribution of topsoil organic carbon through application of the original pedo- 9
transfer rule 21 of Van Ranst et al. (1995)
Figure 9 Correction coefficient for organic carbon content by temperature variations 11
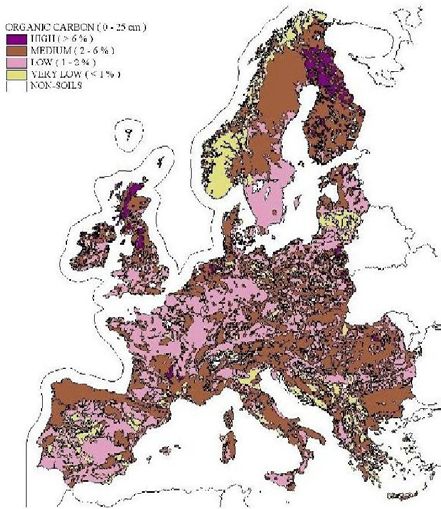
Figure 10 Organic carbon content (%) in the surface horizon (topsoil) of soils in Europe, 13
S.P.I.04.72
Figure 11 Topsoil Organic Carbon content in England and Wales by FAO soil subgroup 15
(all land cover, forest and arable)
Figure 12 Ground data plotted in relation to modelled OC values (%) for three areas in UK 16
Figure 13 Relationship between ground and modelled data for topsoil organic carbon 17
content in England and Wales, for CIS primary catchments (>1000km2) and
NUTS Level 2.
Figure 14 Topsoil Organic Carbon content in Italy by FAO soil subgroup (arable land only) 17
Figure 15 Ground data plotted in relation to modelled OC values (%) for three areas in 19
Italy
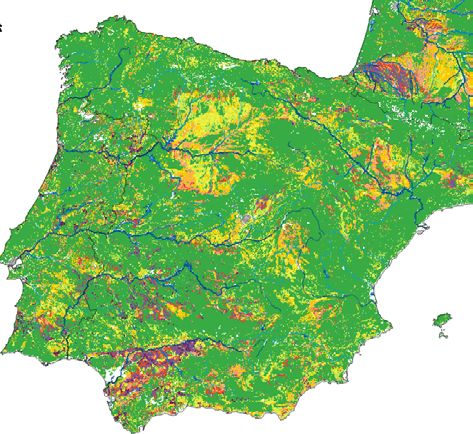
Figure 16 Soil erosion estimates from PESERA (S.P.I.04.73), compared with topsoil 20
organic carbon content in Spain
Figure 17 Soil erosion estimates from PESERA (S.P.I.04.73), compared with topsoil 20
organic carbon content in France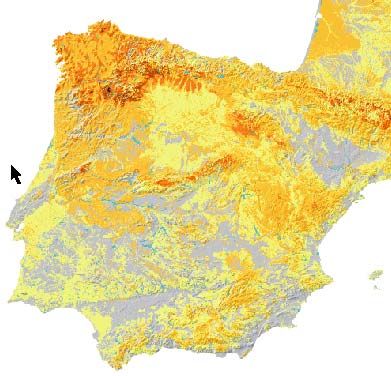
EUROPEAN SOIL BUREAU RESEARCH REPORT NO. 17
SUMMARY
1. Soil organic carbon, the major component 12. In essentially warm and dry areas like
of soil organic matter, is extremely Southern Europe, depletion of organic
important in all soil processes. matter can be rapid because the processes
2. Organic material in the soil is essentially of decomposition are accelerated at high
derived from residual plant and animal temperatures.
material, synthesised by microbes and 13. At the European level, there is a serious
decomposed under the influence of lack of geo-referenced, measured and
temperature, moisture and ambient soil harmonised data on soil organic carbon
conditions. available from systematic sampling
3. The annual rate of loss of organic matter programmes.
can vary greatly, depending on cultivation 14. The European Soil Database, at a scale of
practices, the type of plant/crop cover, 1:1,000,000, is the only comprehensive
drainage status of the soil and weather source of data on the soils of Europe
conditions. harmonised according to a standard
4. There are two groups of factors that international classification (FAO).
influence inherent organic matter content: 15. A Soil Profile Database for Europe
natural factors (climate, soil parent SPADE (v 1), containing data on organic
material, land cover and/or vegetation and carbon in the topsoil (0–30cm) for
topography), and human-induced factors important soil types, is available as part of
(land use, management and degradation). this database.
5. Within belts of uniform moisture 16. These data are not comprehensive
conditions and comparable vegetation, the geographically and have poor replication.
mean total soil organic matter content An expanded profile database for Europe
increases from two to three times for each (SPADE 2) is currently in the advanced
10 deg. C fall in mean annual temperature. stages of compilation and, after 2004, this
6. In general, under comparable conditions, will provide many more measured values
organic matter increases as the effective of OC for European soils under different
moisture becomes greater. land uses.
7. A sandy soil usually contains less organic 17. Organic carbon (OC) data for soils in
matter than a soil of finer texture, e.g. Europe are available from other sources for
heavy loam or clay. example national soil survey archives and
8. Poorly drained soils generally have much the ISRIC-WISE database.
greater organic matter content than their 18. It is not possible to produce distribution
better-drained equivalents. maps of soil OC from these data sources
9. Cultivation can have a significant effect on that would be accurate enough for policy
the organic matter content of soil. support in Europe.
10. Experiments conducted in the USA and 19. Although not generally available for use
UK show a decline of up to 30% in organic outside the country of origin, the national
matter content of soils that have been OC data could be used for validating a map
cropped over a long period. of the distribution of OC in European soils.
11. After 50 years of continuous wheat 20. At the present time, the most homogeneous
cultivation (from 1843 to 1893) at and comprehensive data on the organic
Rothamsted (UK), a soil on Broadbalk carbon/matter content of European soils
field that received no manure contained remain those that can be extracted and/or
0.89% organic carbon whilst the same type derived from the European Soil Database
of soil that received 35 t/ha of farmyard in combination with associated databases
manure (FYM) annually, since 1843, on land cover, climate and topography.
contained 2.23% organic carbon.
The Map of Topsoil Organic Carbon in Europe: 1
Jones, Hiederer, Rusco, Loveland & Montanarella. 2004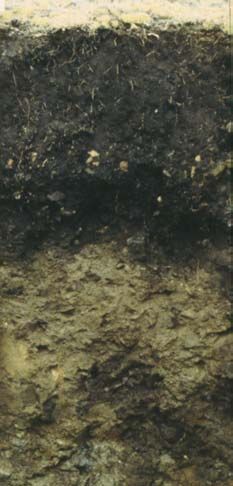
EUROPEAN SOIL BUREAU RESEARCH REPORT NO. 17
21. The first attempt to calculate soil OC 30. The map and 1km data set of OC for
contents at European level used pedo- topsoils in Europe (Figure 3) has been
transfer concepts, combining the limited produced to support the forthcoming
measured OC data that are available, the Thematic Strategy for Soil Protection.
relationship of these OC data to soil type 31. By defining the baseline status of organic
(by texture, structure, classification), land carbon/matter in 1990, the 1km data should
use/land cover, and climatic criteria also prove useful for other areas of
(temperature). research, particularly pollutant transfer and
22. However, the results are not considered to global change.
give an accurate picture of the status of soil 32. In the immediate future, the current version
organic matter in southern Europe. (1.2) of the OC map will be further
23. Consequently, a refined pedo-transfer rule, validated against other national OC data –
for calculating the OC contents of topsoils such as exist in Finland, Scotland,
in Europe, has been applied recently to a Slovakia, Hungary, Czech Republic, The
1km soil data set, derived from the Netherlands and France.
European Soil Database, an extended 33. In parts of Europe where OC/OM data are
CORINE land cover dataset, a digital scarce or inadequate, e.g. Greece and
elevation model (DEM) and mean annual Spain, sampling and measuring
temperature data. programmes should be implemented.
24. The resulting map (S.P.I.04.72), 34. From the soil protection standpoint, it may
accompanying this booklet, and a 1km be wise to examine land use patterns in
digital data set covering the whole of areas where OC is estimated to be 5t/ha/yr) estimated by the PESERA
in the UK (England and Wales) and Italy, model. In other areas, estimated soil loss is
are very encouraging and give a coefficient small where there is less organic carbon.
of determination of >0.9. These relationships should be subjected to
26. The samples for these ground further spatial analysis using GIS.
measurements were collected mostly 36. Soils with large amounts of OM are
during 1971-90. restricted in extent and exist mainly in
27. In constructing the Map of OC in topsoils northern Europe. These soils are a valuable
in Europe (S.P.I.04.72), errors associated and non-renewable resource and should be
with assigning measured OC data from a protected from development wherever
small number of points, deemed to be possible.
representative of a particular soil type, to
polygons delineated on a soil map, that
represent much larger areas where no
measurements of OC have been made,
have been avoided.
28. The OC content, particularly in the topsoil,
changes significantly with land use, and
thus utilisation of CORINE land cover data
(from 1988-92) for producing the OC map
of Europe is appropriate to define a 1990-
baseline.
29. The use of temperature data, computed for
the period 1980-89, is in accordance with
the resulting OC distribution being an
appropriate baseline for OC in 1990.
2 The Map of Topsoil Organic Carbon in Europe:
Jones, Hiederer, Rusco, Loveland & Montanarella. 2004EUROPEAN SOIL BUREAU RESEARCH REPORT NO. 17
INTRODUCTION Effectively this means compiling and analysing
data on the OC content because in most cases
Following the unprecedented expansion and this is the parameter measured. The next
intensification of agriculture during the 20th objective is to establish the future trend in soil
century, there is clear evidence of a decline in OC (and OM) contents with a view to
the organic carbon (OC) contents in many soils developing more sustainable systems of land
as a consequence (Sleutel et al., 2003). This management and to avoid or reduce further
decline in OC contents has important losses.
implications for agricultural production
systems, because OC is a major component of
organic matter (OM) in soil.
The official Communication ‘Towards a
Thematic Strategy for Soil Protection’ (CEC,
2002), adopted in April 2002, identifies eight
main threats to soil, and considers declining
organic matter (OM) as one of the most serious
processes of soil degradation, especially in
southern Europe. The benefits of OM are
linked closely to the fact that it acts as a
storehouse for nutrients, is a source of soil
fertility, and contributes to soil aeration,
thereby reducing soil compaction.
The need for accurate information on the OM
content in soils at European, national or
regional level has been increasing steadily over a b
the past few years. This is a result of increasing
concern about environmental problems such as Figure 1: Mineral-organic soil material in
soil degradation, desertification (CEC, 1992; (a) Phaeozem (photograph by Peter Schad)
UNEP, 1991; EEA, 1995; Kosmas et al., (b) Calcisol (photograph by Otto Spaargaren).
1999), erosion and, at the worldwide level, the
impact of climate change.
To avoid further losses of OM from the soil,
To ensure sustainable management of land, the immediate value of the OC map, and
therefore, it is imperative that OM in the soil is associated database, is to provide a ‘baseline’
maintained and sustained at satisfactory levels. for OC contents in European soils in support of
A decrease in OM content is an indicator of a the forthcoming Thematic Strategy for Soil
reduction in quality in most soils. This is Protection (CEC, 2002). For policy-making
because soil OM is extremely important in all purposes, it is now vitally important to have an
soil processes. accurate picture of the OM content in
European soils and to understand the
components of the systems of land
PURPOSE OF THE MAP management that have the greatest effect.
The main objective in producing the Map is to
identify and to secure an existing information FUNCTION OF OC/OM IN SOILS
base for OC and OM contents of European
soils at time T0 i.e. to define a ‘baseline Organic matter is also an important ‘building
(background) or reference level’ against which block’ for soil structure and for the formation
to monitor future trends. The Map, published of stable aggregates (Waters and Oades, 1991;
as S.P.I.04.72 in ISO B1 format, shows the Beare et al., 1994). Other benefits are related
distribution of calculated (modelled) OC to the improvement of infiltration rates and the
contents in topsoils (0-30cm) in Europe. increase in storage capacity for water.
Furthermore, OM serves as a buffer against
rapid changes in soil reaction (pH) and it acts
The Map of Topsoil Organic Carbon in Europe: 3
Jones, Hiederer, Rusco, Loveland & Montanarella. 2004EUROPEAN SOIL BUREAU RESEARCH REPORT NO. 17
as an energy source for soil micro-organisms. Figure 4 shows a Histosol, which comprises
Without OM, biochemical activity in soil deep peat. More details of the distribution in
would effectively be negligible. Europe of peat and soils rich in OM are
described by Montanarella et al., In press).
Soil organic matter is evident to the layman
because it makes the surface horizon of most
soils darker than the subsoil. Figure 1 shows
(a) Phaeozem in the Andes, with a surface
horizon much darker than the subsoil because
it is rich in organic material, juxtaposed with
(b) Calcisol in Italy containing only a small
amount of organic material as evidenced by the
much lighter coloured surface horizon.
Figure 4: Histosol developed in deep peat
(photograph by Erika Micheli)
In mineral soils, OM is concentrated in the
Figure 2: Organic soil material: fibrous peat topsoil or surface horizon (Figure 1), but a few
(photograph by Erika Micheli) soil types have significant concentrations of
OM in the subsoil, e.g. Ferri-humic Podzol
Figure 2 and Figure 3 show organic soil (Figure 5).
material in the form of peat, with OC contents
in excess of 45% (78% OM). Factors Influencing Organic Matter
Status of Soils
Formation and behaviour of soil OM is a very
complex subject. Organic material in soil is
essentially derived from residual plant and
animal material, synthesised by microbes and
decomposed under the influence of
temperature, moisture and ambient soil
conditions. In essentially warm and dry areas,
like Southern Europe, depletion of OM can be
rapid because the processes of decomposition
are accelerated at high temperatures.
The factors influencing soil OM may be
divided into two groups of:
Figure 3: Organic soil material: semi-fibrous peat 1. Natural factors;
(photograph by Erika Micheli) 2. Human-induced factors.
4 The Map of Topsoil Organic Carbon in Europe:
Jones, Hiederer, Rusco, Loveland & Montanarella. 2004EUROPEAN SOIL BUREAU RESEARCH REPORT NO. 17
The most important natural factors are: 1. Carbon sequestration;
1. Climate: temperate or Mediterranean 2. Soil fertility;
for example; 3. Pollutant transfer;
2. Soil parent material: acid or alkaline 4. Sustainable crop production;
(or even saline); 5. Soil-water relations;
3. Land cover and/or vegetation type; 6. Soil-groundwater relationships.
4. Topography: slope and aspect.
Of considerable concern at continental and
Human-induced factors can be summarised as global scale now are carbon emissions that
follows: influence global warming and climate change.
1. Land use and nature of farming Continuously high temperatures during the
systems; summer in the Mediterranean lead to a rapid
2. Land management; decline in the OM content in cultivated soils.
3. Degradation of soil and land. This decline is further exacerbated by the
removal or burning of crop residues. Unless
sufficient OC is returned to the soil to offset
the loss occurring during mineralization, the
content of OM will decline. When OC stocks
in the soil are in decline, the process is called
‘soil nutrient mining’ (Zdruli et al., 1998).
In examining data on OM content of
representative mineral soils, it is clear that
there are differences between soils of different
physiographic provinces, but also within
particular localities. Heterogeneity is the rule
and is generally expected by most soil and
earth scientists. However, there are some broad
relationships that are helpful in predicting the
distribution of soil OM (Zdruli et al., 2004).
Effect of Climate
Climatic conditions, especially temperature
and rainfall, exert a dominant influence on the
amounts OM found in soils. When moving
from a warmer to a cooler climate, the OM
content of comparable soils tends to increase
(Figure 6). This is because the overall trend in
the decomposition of OM is accelerated in
warm climates, while a lower rate of
decomposition is the case for cool regions.
In summary, within belts of uniform moisture
conditions and comparable vegetation, the
average total OM contents increases from two
to three times for each 10 degree C fall in mean
annual temperature (Buckman and Brady,
Figure 5: Ferri-humic podzol showing the 1960, p152).
accumulation of organic matter in the surface
horizon and also translocation of organic material Effective soil moisture also exerts a very
in the subsoil (photograph by Otto Spargaren) positive control upon the accumulation of OM
in soils. In general, under comparable
Identifying the factors influencing soil OM conditions, OM content increases as the
turnover and quality is important for a number effective moisture becomes greater. This is
of areas of research: explained by the fact that microbes are more
The Map of Topsoil Organic Carbon in Europe: 5
Jones, Hiederer, Rusco, Loveland & Montanarella. 2004EUROPEAN SOIL BUREAU RESEARCH REPORT NO. 17
active, and the humification of OM more rapid OM compared with heavier soils. Generally,
in areas of moderate to low rainfall (Figure 6:), poorly drained soils have high moisture
which tend to have scantier vegetation than contents and low aeration. This results in
wetter areas. generally much larger OM contents in these
soils than in their better-drained equivalents.
In Europe, temperature and precipitation tend
to change in opposing directions. Thus, as Microbial activity, as mentioned above is
rainfall increases, temperature decreases. strongly influenced by soil pH. Where soil pH
Because water supply is not limiting this is raised by the presence of base-rich material,
encourages the growth of plant species, many e.g. limestones, or by an adequate supply of
of which have more lignin-rich components base cations such as calcium, then these
than their lowland neighbours, but microbial processes will be more rapid than where more
activity decreases at these lower temperatures. acid soil conditions prevail, and OM will thus
be mineralised to a greater extent.
Effect of Erosion and Vegetation
Water and wind erosion can be responsible for
physically removing OM from soils, because
OM is concentrated in the top 30cm and this is
the layer that is normally removed first.
Conversely, vegetation is an important source
for replenishment of OM, but where plant
cover is scant OM is usually deficient.
Effect of Cultivation
Cultivation can have a significant effect on the
content and quality of soil OM. During field
operations such as ploughing, drilling,
harrowing etc. soil aggregates are repeatedly
disturbed and broken, thus exposing fresh
surfaces, many of which will have coatings or
particles of OM associated with them.
Figure 6: Influence of temperature and moisture on In the undisturbed state, much of this OM is
soil organic matter(SOM) in Europe relatively protected from mineralization
(adapted from Buckman and Brady, 1960, p152) because it is in equilibrium with soil conditions
on a very local, often microbiologically-
controlled, scale. Continual disturbance will
Thus OM accumulates, e.g. in peat soils, or
change these conditions repeatedly, and this
peat layers at the surface of the mineral soil.
generally leads to a greater degree of
High rainfall also leads to acidification due to
decomposition of the OM, especially of the
leaching and microbial activity is lessened at
labile forms (sugars, gums, amino-acids etc.),
more acid pH. Conversely, at lower altitudes
which play a major role in stabilising soil
and warmer latitudes, production of OM can be
physical structures.
limited by water stress, but microbial processes
are faster. Thus, OM content tends to decrease.
The so-called residual OM, left when the more
labile forms have been mineralized, is less
Effect of Soil Properties
effective at stabilising soil structure. Unless
Provided other factors are constant, the texture OM is quickly replenished, the system is in a
of the soil influences the amount of OM and state of degradation, leading eventually to a
nitrogen present. A sandy soil usually contains non-sustainable situation (World Bank, 1993).
less OM than a soil of finer texture – heavy
loam or clay. This is because the generally Contrary to the situation in northern Europe,
lower moisture content and greater aeration in agriculture in the Mediterranean is dominated
sandy soils result in more rapid oxidation of by fruit-trees, citrus, olives, vines, vegetables,
6 The Map of Topsoil Organic Carbon in Europe:
Jones, Hiederer, Rusco, Loveland & Montanarella. 2004EUROPEAN SOIL BUREAU RESEARCH REPORT NO. 17
and cereal crops, such as wheat, barley and Transportation of animal manures can be
maize. Grasslands and associated stock rearing expensive because the bulk volume to be
are of limited extent and the accumulation of removed is considerable. Rarely are intensive
OM associated with these uses is, therefore, livestock enterprises juxtaposed with extensive
severely restricted. arable systems that would benefit from
applications of the large quantities of the
Nonetheless, the fact that crop yields in areas animal manures produced.
long under cultivation have been maintained or
raised does not mean that OM contents are Other potential sources of organic materials in
being maintained at satisfactory levels. soils under agricultural use are sewage sludge,
urban waste, and litter from forest trees. The
Experiments conducted at Rothamsted (Figure use of these materials for fertilising soils
7) have demonstrated that very different forms requires special technologies for processing the
of manure application and crop rotations have raw material. Collection of plant litter can be
had a very large influence on the carbon and very labour-intensive involving considerable
nitrogen contents in the soil but only a small costs, but is useful to replenish OM.
influence on the C/N ratio (Russell, 1961,
p.277). The vast majority of sewage sludge is
produced distant from areas that could profit
OC (%)
from their application. There is a risk of
3.0 FYM
contaminating soil through the application of
industrial wastes and sewage sludge. Therefore
2.5
FYM since 1885
the use of these wastes, to replenish OM, must
2.0
FYM since
be carefully controlled and only adopted when
1.5
NPK
1968
the food processing and distribution industries
1.0
are ready to accept produce from agricultural
No fertilizer or manures systems receiving such recycled organic waste.
0.5
0 Decline in Soil Organic Matter
50
70
90
10
30
50
70
00
18
18
18
19
19
19
19
19
-1 -1
There are many factors responsible for the
FYM applied at 35 t ha yr
decline in soil OM and many of them stem
[FYM – Farmyard Manure; NPK – nitrogen, phosphate, potassium fertilizer] from human activity.
Figure 7: General influence of cultivation and soil
management on OC contents at Rothamsted during 1. Conversion of grassland, forests and
the past 150 years (after Poulton, 1995). natural vegetation to arable land;
2. Deep ploughing of arable soils causing
rapid mineralization of labile
Jenkinson (1990) and Johnston (1991) describe components of OM;
more details of Rothamsted's research into soil 3. Overgrazing, with high stocking rates;
carbon and Goulding et al. (2003) report more 4. Soil erosion, by water and wind;
recently on trends in OC that can be traced 5. Leaching;
from the experimental field data up to 1990 6. Forest fires.
(Figure 7).
The ‘drivers’ 1-3 above probably lead to the
Sources of Soil Organic Matter most rapid decline in OM contents. Two other
Major sources of OM elsewhere in agricultural important processes, erosion and leaching, are
areas are derived from plant material, crop important contributors.
residues and animal manure, for example from
rearing cattle, sheep, pigs and poultry. When natural or semi-natural habitats are
However, the distribution of agricultural cultivated, new and usually smaller quantities
activities at national level is not uniform, thus of OM are established. It is, therefore, normal
in some areas the concentration of organic to find much less OM (by 30 to 60%) in
materials is much larger than in others. cultivated soils compared to their undisturbed
(or virgin) equivalents.
The Map of Topsoil Organic Carbon in Europe: 7
Jones, Hiederer, Rusco, Loveland & Montanarella. 2004EUROPEAN SOIL BUREAU RESEARCH REPORT NO. 17
Generally, plant roots, root exudates and plant al., 2000a, b; Arrouays et al., 2001; Leifeld et
residues are not generated in sufficient al., 2003, In press). The primary aim in these
amounts in cultivated soils to replace the OM studies was to estimate the carbon
that is lost following repeated soil disturbance sequestration potential of soils in global change
during the cultivation cycle. Thus, the OM research.
content of the soil will drop until some
relatively small equilibrium value is reached Batjes (1996, 1997) used the WISE database
which might be too small to support all soil and calculated OC contents for the major soil
functions at some desired level. groups of the FAO classification. Howard et al.
(1995) estimated soil organic stocks in land
Erosion causes removal of soil particles, under arable agriculture, using OC
particularly from the topsoil. This can have a measurements made during the National Soil
devastating impact on overall soil OM Inventories in England & Wales and Scotland
contents, because organic materials are (1979-83). Smith et al. (2000b) revised the
concentrated in the surface layer of the soil. estimates of Howard et al. (1995) for the UK
Erosion can also remove considerable using data compiled by Batjes (1996) and a
quantities of nutrients, as well as sediments. relationship that assumes a quadratic decline in
Where erosion is severe, more fertiliser and soil OC contents with depth.
organic manure are needed on agricultural land
to counteract the losses, compared to the Arrouays et al. (2001) calculated OC in the
requirements in non-eroded areas. soils of France using the CORINE land cover
data, the 1:1,000,000 scale soil geographical
Leaching of soil nutrients and organic database of France and a database containing
compounds to the groundwater is a problem in point measurements of OC mainly from
some areas. Heavy winter rainfall or excess agricultural areas. More recently, Lettens et al.
irrigation water may exacerbate the problem. (2004) have used national soil profile databases
Salinity and acidity also have devastating in Belgium to plot the distribution of carbon
effects on the quality and quantity of OM. stocks in soil in the country.
Contents of OC have been measured
ASSESSING ORGANIC MATTER systematically in some countries, for example
CONTENT OF EUROPEAN SOILS in UK (McGrath and Loveland, 1992; Bullock
and Burton, 1996), Denmark (Krogh et al., In
This report focuses on mapping of OC content press), Belgium (Sleutel et al., 2003; Lettens et
in European topsoils. In most cases, organic al., 2004), Slovakia (Landscape Atlas of the
matter in soil is measured as OC, and, if Slovak Republic, 2002) and The Netherlands
necessary, the values converted to OM content (Kuikman et al., 2003).
using a standard conversion ratio OC:OM of
1:1.72. This conversion is considered to be Other countries, for example France (Arrouays
satisfactory for providing data on OM, given et al., 2002; Walter et al., 1996) and Italy
OC measurements, for input to broad scale (Rusco, In prep.), have large if not
modelling and the policy-making process. systematically collected national data sets on
Sometimes the more approximate ratio 1:1.7 is OC, whereas some countries have only limited
used – Buckman and Brady (1960, p.149). data (Rodrigues-Murillo, 2001). Regrettably,
However, care is needed when inverting the many sample data from field surveys are either
ratio and converting OM to OC, because insufficiently geo-referenced or not accessible
determining OM by loss on ignition can lead to outside the country of origin, which poses a
an overestimation of OC. Therefore, a standard serious obstacle to using them for defining
procedure for determining OC should be baseline OC status at European level.
adopted for future sampling programmes.
Therefore, an extrapolation procedure based on
Previous Studies sample data from national data sets is
There have been several attempts to estimate impractical for an improved determination of
carbon stocks at regional level in Europe the distribution of OC in European soils at this
(Howard et al., 1995; Batjes, 1996; Smith et time.
8 The Map of Topsoil Organic Carbon in Europe:
Jones, Hiederer, Rusco, Loveland & Montanarella. 2004EUROPEAN SOIL BUREAU RESEARCH REPORT NO. 17
ESB Approach Furthermore, because the results are expressed
as classes of OC it is difficult to establish the
The European Soil Bureau (ESB), based at the
true OC content for some European soils.
Joint Research Centre, Ispra (Italy), has been
sponsoring the collection of soil information
For example, peat soils contain much more OC
throughout Europe for more than fifteen years
(15-60%) than the lower limit of 6% of the
(Montanarella and Jones, 1999).
highest class ‘H’. Consequently, this analysis
does not separate peat soils from soils with less
The result is the construction of a European OC, which fall into the same class.
Soil Database v.1.0 (King et al., 1994, 1995a,
1995b; Le Bas et al., 1998; Heineke et al.,
1998) from source material prepared and
published at a scale of 1:1,000,000 (CEC,
1985), augmented by data from national soil
survey archives. The resulting soil data are
harmonised for the whole of Europe according
to a standard international soil classification
(FAO-UNESCO, 1974; FAO-UNESCO-
ISRIC, 1990), together with a Soil Profile
Analytical Database for Europe, SPADE 1
(Madsen and Jones, 1995).
European Soil Database
SPADE 1, a component of the European Soil
Database v1.0, contains data on OC in the
topsoil (0–30cm) for important soil types, as
well as data for other soil properties.
Unfortunately, because of the difficulties of
collecting geo-referenced data at European
level, the data currently stored in SPADE I are
not comprehensive geographically and have
poor replication. Figure 8: Distribution of topsoil organic carbon
through application of the original pedo-transfer
rule 21 of Van Ranst et al. (1995)
Therefore, applying an extrapolation after Rusco et al. (2001)
procedure, linking the analytical data to
polygons representing Soil Mapping Units
(SMUs), was deemed unsuitable to build an Validation of the distribution of the estimated
accurate distribution of soil OC for Europe as a OC contents, portrayed in Figure 8, proved
whole. Many thousands of OC measurements impossible because, at the European level,
would be needed, thus the soil type and texture, there is a serious lack of measured geo-
as defined in the database, provide the main referenced data on soil organic carbon (Bullock
input parameters for soil in the current studies. et al., 1999). Such data are more readily
accessible at national level.
Direct Mapping Approach
In the first attempt directed at guiding policy- Revised Pedo-Transfer Approach for
makers at European level with respect to OC in Europe
European soils, Rusco et al. (2001) made a For a meaningful spatial representation of
study based on the European Soil Database. topsoil OC (OC_TOP), an alternative
The results obtained, from mapping the topsoil methodology to using sample data, in
OC data generated by a pedo-transfer rule combination with an extrapolation algorithm,
(PTR), are shown in Figure 8. The estimates was developed. The approach is based on
are approximate, appropriate only for use at processing a revised PTR and the European
continental level. Soil Database (Jones et al., 2003). The
conditions in the revised PTR for OC_TOP
were translated into processing commands,
The Map of Topsoil Organic Carbon in Europe: 9
Jones, Hiederer, Rusco, Loveland & Montanarella. 2004EUROPEAN SOIL BUREAU RESEARCH REPORT NO. 17
which operated directly on spatial data layers :
37 IF (SN1=L) AND (SN2=c) AND (TEXT=2) AND
in a Geographic Information System (GIS). (USE=C) AND (ACT=M) THEN LET OC_TOP=L
:
85 IF (SN1=J) AND (SN2=t) AND (TEXT=2) AND
Description of Pedo-Transfer Rules (USE=SN) THEN LET OC_TOP=H
Measured soil properties are extended in the :
database to a range of soil parameters, which
are not observed or measured in a soil survey The revised PTR for OC_TOP uses 5 input
by using a system of PTRs defined by Van parameters instead of the 6 parameters in the
Ranst et al. (1995). Technically, a PTR original PTR21, temperature being removed
condenses the results obtained from sample from the conditions because it is taken into
surveys of typical conditions, which were account through the correction coefficient
found to be associated with a specific soil (TEMPcor).
property. The principal parameters defining a
property and the representative value for that Data Sources
property are identified through expert The methodology applied in the study uses
knowledge (Jones and Hollis, 1996). In detail, soil, land use and climate data to calculate a
a PTR is defined as a series of structured ‘if- continuous spatial thematic layer of
then’ conditions, applied sequentially from quantitative OC content in topsoils in Europe.
general to more specific situations and using a The methodology is explained in more detail in
variety of related environmental parameters Jones et al., In press).
(Daroussin and King, 1997).
Soil
The PTR21 defined by Van Ranst et al. (1995), The European Soil Database provided the main
used to estimate OC in the topsoil horizon input for soil. The spatial component of this
(OC_TOP), uses 6 input parameters – three for database comprises polygons, which represent
soil, one each for texture, land use and Soil Mapping Units (SMUs). These spatial
temperature. Table 1 shows some examples of elements are linked to a database of Soil
the ‘if-then’ conditions that comprise this rule, Typological Units (STUs) in the form of a one-
a total of 150 conditions being defined. to-many relationship. Attribute data exist for
STUs, so these data can be related to SMUs
Table 1: Selected conditions from PTR21 for topsoil and consequently to areas on a map.
organic carbon (OC_TOP)
Co SN1 SN2 SN3 TEXT USE ATC OC
Until a better soil profile database has been
35 L g * * SN M M compiled (a SPADE 2 database is in
37 L c * 2 C M L preparation – Hollis, pers comm), and many
85 J t * 2 SN * H more (standardised) analytical data for soil
117 O * * * * * H
properties become available, OC is calculated,
Co – condition number; * – ‘wild card’ at the European level, by a pedo-transfer rule
SN1 – FAO soil group code (e.g. L Luvisol)
SN2 – FAO soil subgroup code (e.g. g gleyic) combining the limited measured OC data that
SN3 – FAO soil subgroup (2nd) code (e.g. s stagnic in Lgs) are available, the relationship of these OC data
TEXT – FAO texture class (1 coarse – 5 very fine)
USE – Land use class (C cultivated, SN semi-natural
to soil type (by texture, structure,
ATC – Accumulated temperature (L low, M medium, H high) classification), land use/land cover, and
OC – OC_TOP class (L, M, H - see below for limits) climatic criteria (particularly temperature).
Land Use/Cover
The results for OC_TOP are output by Rule21 The land cover information was derived from a
in four classes: data set covering Europe with information
according to the CORINE Land Cover
V(ery) L(ow): < 1.0% classification codes. For areas where CORINE
L(ow): 1.1-2.0% data are absent (e.g. Sweden), land cover was
M(edium): 2.1-6.0% taken from specifically adapted Eurasian land
H(igh): > 6.0% cover data, derived from a US Geological
Survey (USGS) database. To achieve
Conditions 37 and 85 can be translated into comparable thematic coverage between the
program code as follows: CORINE and USGS data, a series of cross-
10 The Map of Topsoil Organic Carbon in Europe:
Jones, Hiederer, Rusco, Loveland & Montanarella. 2004EUROPEAN SOIL BUREAU RESEARCH REPORT NO. 17
classifications was carried out, using various to calculate a correction coefficient were
USGS data layers and re-assigning or merging determined by analysing changes in OC in the
classes where appropriate. The final layer ground data in relation to AAAT. Due to the
corresponds to the CORINE level 3 characteristics of the area covered by the
classification codes. ground measurements, the range of
temperature at sites with ground OC data was
Climate restricted to AAAT > 2000 day degrees C.
Variations in soil OC with different climatic
conditions were taken into account by using The relationship between AAAT (tAAAT) and
the average annual accumulated temperature temperature correction coefficient (TEMPcor)
(AAAT), expressed in day degrees C. The data was defined by a sigmoidal function of the
used were derived from station observations type:
available through the Global Historical
TEMPcor = f × cos(t AAAT ) + c
n
Climatology Network – GHCN – (Easterling et
al., 1996). The influence of station altitude on
temperature observations was adjusted for by where: t is temperature as AAAT
applying an adapted moist adiabatic lapse rate. f, n and c are constants
This period used in the study covered the years
1970-79. The period was chosen because it Figure 9 shows, for the range of values found
precedes the collection of ground samples, in from the available sampling points, the
UK and Italy, used for determining OC and to weighted averages for ground measurements
provide data for verifying the calculated OC and the values used by the function.
contents.
TEMPERATURE CORRECTION FOR OC
Moisture status was not included as a separate Ceofficient for temperature variation
(> 3 ground measurements)
parameter in the PTR, because the influence of 2
this soil-forming factor is implicitly taken into
account with the inclusion of the soil type 1.5
Correction Factor
(parameter SOIL) in the PTR. We believe that
this implicit consideration of moisture is 1
sufficient to satisfy the aims of the study,
which is to produce baseline data, i.e. a data 0.5
layer of estimated OC content, rather than to
model soil development and carbon stocks. 0
0 1000 2000 3000 4000 5000 6000 7000 8000
Using external datasets to model the influence Temperature Range (AAAT deg. C)
day degrees C)
of soil moisture could make the model Semi-natural Cultivated Avg. Ground Data Model
unnecessarily complex and, given the paucity
of OC data from ground measurements, of little
Figure 9: Correction coefficient for organic carbon
value to the current exercise.
content by temperature variations
Temperature Effect
The influence of temperature on OC_TOP According to the land use in the PTR, data
content was taken into account through the points were determined separately for ‘semi-
development of a mathematical function natural’ and ‘cultivated’ areas. The best fit of
designed in accordance with the established the modelled data gave a coefficient of
principle that, within belts of uniform moisture determination (R2) of 0.6.
conditions and comparable vegetation, the
average total OM in soils increases by two to Based on the ground data the function
three times for each 10 degree C fall in mean inflection point was found at 4000 day degrees
annual temperature (Buckman and Brady, C. In practice, AAAT values of this magnitude
1960, p152). occur in southern England, northern France
and southern Germany The lower limit of
This is only a very general relationship but it is TEMPcor was set to 0.5, which corresponds to
considered to be suitable for this basic pan- AAAT values in the range 6500 to 7000 day
European study. The function parameters used degrees C, that are found in southern Europe.
The Map of Topsoil Organic Carbon in Europe: 11
Jones, Hiederer, Rusco, Loveland & Montanarella. 2004EUROPEAN SOIL BUREAU RESEARCH REPORT NO. 17
The upper limit of TEMPcor was set to a value were compared with measured OC contents
of 1.8, found in areas with AAAT of 1800 day from sampling surveys on the ground, in UK
degrees C. These temperatures are and Italy. The verification was performed for
characteristic of northern Europe and in Alpine two different types of reference items:
regions. This upper limit was defined in
consideration of the fact that the OM content of 1. Soil-related reference items: Ground and
a soil cannot exceed 100%, which modelled (calculated) data are compared
approximates to an OC_TOP value of 60%. following aggregation at the level of FAO
Thus compatibility with the relatively stable soil subgroup (STU) codes and SMU
OC:OM ratio of 1:1.72 is maintained. units.
2. Soil-independent spatial item: Ground
Limiting the maximum correction factor to 1.8 and modelled data are compared
is also in accordance with the analysis of the following aggregation based on
ground data that reveals an average of 1.7 at Catchments and NUTS units.
2250 day degrees C. Areas where
0EUROPEAN SOIL BUREAU RESEARCH REPORT NO. 17
Organic Carbon (%)
No Data
0-1
1-2
2-5
5 - 10
10 - 25
25 - 35
> 35
Figure 10: Organic carbon content (%) in the surface horizon of soils in Europe (S.P.I.04.72)
Aggregation measures are likely to be implemented. This
The use of the FAO (FAO-UNESCO, 1974) can be assumed to be administrative units, for
soil subgroup codes for aggregating the data example one of the NUTS (nomenclature of
allows an evaluation of any variation between territorial units for statistics) levels in Europe
modelled (calculated) and observed values as used by Eurostat. European statistical
using parameters that are also included in the information covering a very wide range of
PTR. Data were also aggregated to SMU level, thematic areas is also linked to NUTS units.
i.e. for the actual spatial units in the soil
geographic database. Environmental protection measures linked to
water quality and quantity relate to the
However, for maximum benefit to policy- management of catchments and river basins.
makers, the information provided must be River basin districts are the management units
presented at the level at which protection for the implementation of ‘Directive
The Map of Topsoil Organic Carbon in Europe: 13
Jones, Hiederer, Rusco, Loveland & Montanarella. 2004EUROPEAN SOIL BUREAU RESEARCH REPORT NO. 17
2000/60/EC of the European Parliament and units, as found in the Eurostat databases. This
the Council of 23 October 2000 establishing a level corresponds to the more detailed areas of
framework for Community action in the field the two regional levels. For England and
of water policy', often referred to as the ‘Water Wales, 32 units are defined at this level,
Framework Directive’ (WFD). ranging from 322km2 (Inner London) to
13,122km2 (West Wales and The Valleys) in
FAO Soil Subgroup Codes the GIS layer.
Soil type is an attribute of an STU in the
European Soil Database. Because of the nature Results: Ground vs. Modelled Data
of the SMU-STU relationship (one-to-many) it The average OC_TOP content in the ground
is not possible to generate a definitive OC data was calculated using the arithmetic mean
value for a specific SMU. However, using the of the observed values of all points within the
dominant STU in an SMU, it is possible to spatial unit. The spatial data can be aggregated
calculate an approximate mean value for OC using two different approaches: either the
for the STU, effectively an FAO soil subgroup. average value for a spatial unit is calculated
The SMUs are identified by the FAO subgroup from modelled data at the location of ground
code of the dominant STU. For England and samples (point aggregation) or the average is
Wales, there are 32 different subgroup codes compiled from all data within the spatial unit
for the dominant soils stored in the database, (area aggregation).
whereas the Italian ground data cover 22
different subgroup codes. The method used depends on the question to be
answered. The first approach should be used
Soil Mapping Units (SMU) when relating modelled to measured data,
There is a total of 1,657 SMUs in the European because it reduces the influence of a lack of
Soil Database. England and Wales are covered representativity of the sample for the
by 75 SMUs, of which 4 do not contain any population, for example because the sample is
ground sample points because of their small small.
extent. It was decided not to calculate an OC
value for SMUs in Italy because this would not The second method would be applied when
be meaningful in view of the selective and deriving regional estimates from spatial data,
clustered sampling scheme used. because it integrates information from the area
as a whole and not from a sample. Hence, for
Catchment Layer the purpose of validating the modelled data, a
The catchment units used in the study comprise regression analysis using the point aggregation
the primary data layer of the Catchment method was used. Conversely, regional
Information System (CIS) of the Joint estimates of OC_TOP content by spatial units
Research Centre (Hiederer and de Roo, 2003). were calculated using area aggregation, thus
Primary catchments of the CIS are defined by taking the full range of information into
the flow of surface water to a single point, account.
which is the outlet of the catchment to the sea.
Complete coverage is achieved by combining England & Wales
coastal areas with logical catchment units. A graphical presentation of the mean OC
content in England and Wales by FAO-
For England and Wales 15,979 catchment units UNESCO (1974) soil subgroup is given in
are defined in the CIS. The size ranges from Figure 11. A total of 5591 points were used in
1km2 to 10,969km2. The size of the spatial this aggregation and the number of
units are of importance, because small units observations per FAO soil subgroup ranges
have few or even no ground survey points and from 6 for Rc (Calcaric Regosols) to 696 for
are coastal areas by circumstance. For that Lgs (Stagno-gleyic Luvisols). There is
reason, the study concentrated on catchments generally an extremely close relationship
larger than 1000km2. between the mean OC_TOP content for ground
and modelled data.
Administrative Layer
The administrative units used to aggregate the
OC data are those of NUTS Level 2 territorial
14 The Map of Topsoil Organic Carbon in Europe:
Jones, Hiederer, Rusco, Loveland & Montanarella. 2004EUROPEAN SOIL BUREAU RESEARCH REPORT NO. 17
Ground vs. Model Data: All Land Use (England & Wales)
50
107
Total ground sample points:
5591
Average Organic Carbon Content (%)
40
30
115
50
313 33
20
328
57
10 22 13
432
630 191 240 159 696
248 32373 484 58 68 25423 443 16 39
21 17 94 38 6
0
Bc Be Bgc Gds Gm Jeg Lgs Oe Po Qc U
Bd Bec Bgg Ges Gmf Lc Lo Pg Pp Ql
Bds Bef E Gh Jcg Lg Od Pgs Q Rc
FAO Soil Subgroup Code
Ground Data Model Data
Ground vs. Model Data: Arable Land (England & Wales) Ground vs. Model Data: Forest Land (England & Wales)
40 50
Total ground sample points:
Total ground sample points: 9
369
Average Organic Carbon Content (%)
Average Organic Carbon Content (%)
1856
40
30
4
30 19
24
20 2
29
4
20
9 51
51
10
13 20 1 6 9
68
62 122 13 2 5 1 10 7
36
72
160 21513 37 35 86 314
41
12 3 7
17 16 183 99 165 49 18 1 2 24 18 7
13
9
14 1 2 22 3
0
Bc Be Bgc Gds Gm Jeg Lgs Oe Po Ql 0
Bd Bec Bgg Ges Gmf Lc Lo Pg Pp Rc Bc Be Bgg Ges Gmf Lc Od Po Ql
Bds Bef E Gh Jcg Lg Od Pgs Qc Bd Bec E Gh Jcg Lgs Pg Pp U
Bds Bgc Gds Gm Jeg Lo Pgs Qc
FAO Soil Subgroup Code FAO Soil Subgroup Code
Ground Data Model Data Ground Data Model Data
For explanation of FAO soil subgroup codes, see table on page 26
Figure 11: Topsoil organic carbon content in England and Wales by FAO soil subgroup
(all land cover, forest and arable)
The Map of Topsoil Organic Carbon in Europe: 15
Jones, Hiederer, Rusco, Loveland & Montanarella. 2004EUROPEAN SOIL BUREAU RESEARCH REPORT NO. 17
Notable however, is an over-estimation by the The coefficient of determination (r2) for the
model for Histosols (organic soils): Od relationship is 0.95, indicating that the model
(Dystric Histosol) 36.4% for ground data vs. closely represents the situation within the
45.5% for modelled data and Oe (Eutric SMUs of England and Wales.
Histosols) 14.8% for ground data vs. 20.4% for
modelled data.
The OC data for the soil subgroup units were
further aggregated according to land cover.
The graphs for forest and arable land are also
included in Figure 12. These land cover types
were selected in preference to the land use
parameters ‘semi-natural’ and ’cultivated’
identified in the PTR, because they correspond
better to the needs of policy-makers.
A total of 1,856 points fell on arable land in the
land cover layer. The most obvious Cambridgeshire - Norfolk border, East Anglia
discrepancy between ground and modelled data
occurs for Dystric Histosols Od (OC=39.9%
for ground data compared to 17.5% for
modelled data), for which there are only 2
ground sample points in an SMU and in which 35%
ground data, from 24 ground sample points) vs.
19.8% for modelled data. By contrast, the
model underestimates OC for Gh (Humic
Gleysols) on arable land by 10.6%, albeit there
are only 4 ground observations. Monmouthshire South Wales
In forested areas, 369 ground-sample points are
located within the area. Notable deviations
from the generally good agreement between
ground and modelled data were found only for
Pp (Placic Podzols), 15.3% for ground data vs.
26.8% for modelled data and Qc (Cambic
Arenosols), 10.3% for ground data vs. 3.9% for
modelled data. Other variations are more likely
to be caused by the small number of samples,
for example Gmf (Molli-fluvic Gleysols) 1
point, U (Rankers) 4 points.
Otterburn Northumberland N England
Using SMUs as the aggregation unit, the mean
OC_TOP for all land uses is 6.5% for the Figure 12: Ground data plotted in relation to
modelled OC values for three areas in UK
ground data and 6.4% for the modelled data at
the locations of the ground samples. The
results of aggregating OC_TOP content by The OC measurements from the ground survey
SMU can be characterized by a linear (NSI) are shown, in Figure 12, plotted on the
correlation: modelled values on the OC Map for three areas
in England and Wales. These plots show the
OC_TOPGRD = 0.82 OC_TOPMODEL + 1.45 very good spatial agreement between the two
data sets across the whole range of OC.
16 The Map of Topsoil Organic Carbon in Europe:
Jones, Hiederer, Rusco, Loveland & Montanarella. 2004You can also read