A VITAL AMBITION DETERMINING THE COST OF ADDITIONAL CO2 EMISSION MITIGATION IN THE SOUTH AFRICAN ELECTRICITY SYSTEM - Meridian Economics
←
→
Page content transcription
If your browser does not render page correctly, please read the page content below

A VITAL
AMBITION
DETERMINING THE COST OF ADDITIONAL
CO2 EMISSION MITIGATION IN THE SOUTH
AFRICAN ELECTRICITY SYSTEM
                                                                                             July 2020
                                                                                                 Version 1.06
Adam Roff, Dr Grové Steyn, Dr Emily Tyler, Celeste Renaud, Rian Brand and
Jesse Burton, in collaboration with the CSIR Energy Centre                  info@meridianeconomics.co.za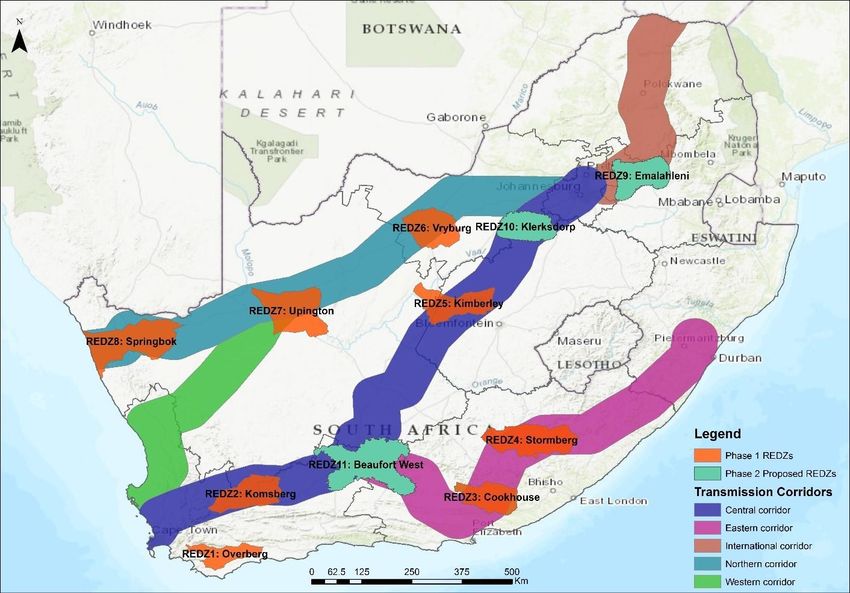
THE QUESTIONS WE SET OUT TO ANSWER • Can South Africa meet its power demand for the coming decades whilst drastically reducing CO2 emissions from electricity generation? • Do future versions of our power system with lower emissions result in higher electricity costs? – how much higher? – and for how much emission reduction? • Is there an inflection point, in other words, a level of emission reduction beyond which the cost of cleaner power becomes unaffordable? • Why is this important? – To inform rational policy decisions – To allow mitigation to be priced and any need for funds required to increase ambition to be quantified – To provide guidance regarding the size and cost of a possible climate transaction ©Meridian Economics 2020 ׀6
HOW MUCH WILL ADDITIONAL MITIGATION COST?
If we move to scenarios with lower emissions than
Least Cost, how much more will electricity system
Curve Curve Curve costs increase? More specifically, is the curve depicting
3? 2? 1? optimised systems at lower emissions levels shallow or
steep?
– For Curve 1, additional mitigation is expensive;
Cost of Electricity
– For Curve 3, additional mitigation is less expensive
To properly assess this:
Current – All power system scenarios must be cost optimised
Policy
– All technologies must be considered
(IRP)
Least – The only constraint imposed is a CO2 emissions one
Cost
Scenario
CO2 Emissions 2020-2050
©Meridian Economics 2020 ׀8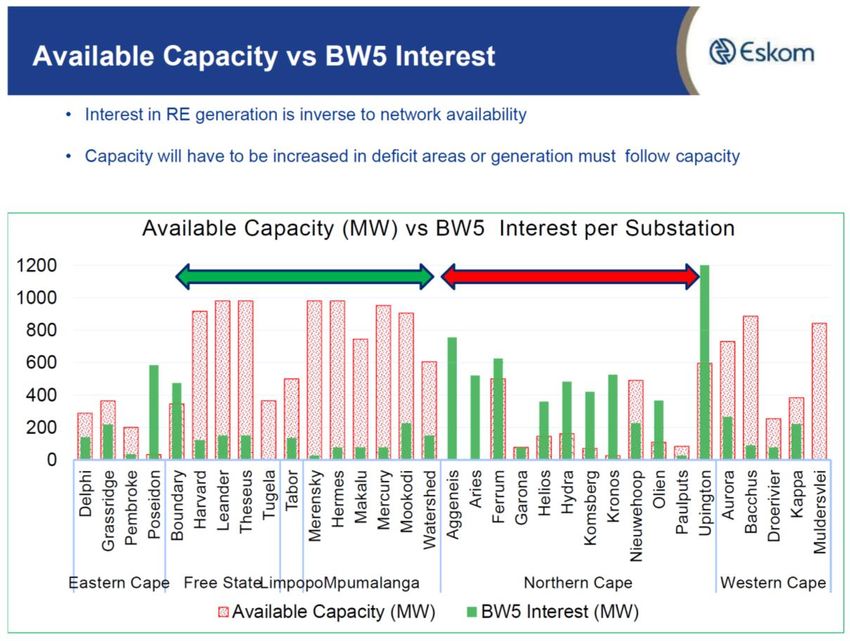
ANSWER: LESS THAN WE THOUGHT • The cost curve is almost flat at least until 2.5 Gt of
WE ARE ASKING THE WRONG QUESTION CO2 emissions reductions. This means that the cost
of lower emissions scenarios is not significantly
different to that of the Least Cost scenario.
* • The key driver for this is the plunge in renewable
energy (RE) costs. New build RE is by far the lowest
cost technology choice for future energy
• Displacing existing coal with new RE comes at a
small cost (that decreases with time as RE costs
continue to decline)
• Challenges remain to achieving emissions
reductions along this curve, but cost is not one of
them. These include: policy and regulatory factors,
political will, the practicalities of renewable energy
(RE) industrialisation ramp-up, grid constraints and
system adjustments required for a greater
proportion of variable generation. None of these
*South Africa’s Integrated Resource Plan (IRP) 2019 is used as a basis for
constructing our ‘Current Policy Trajectory’ which extends to 2050.
barriers is insurmountable.
©Meridian Economics 2020 ׀9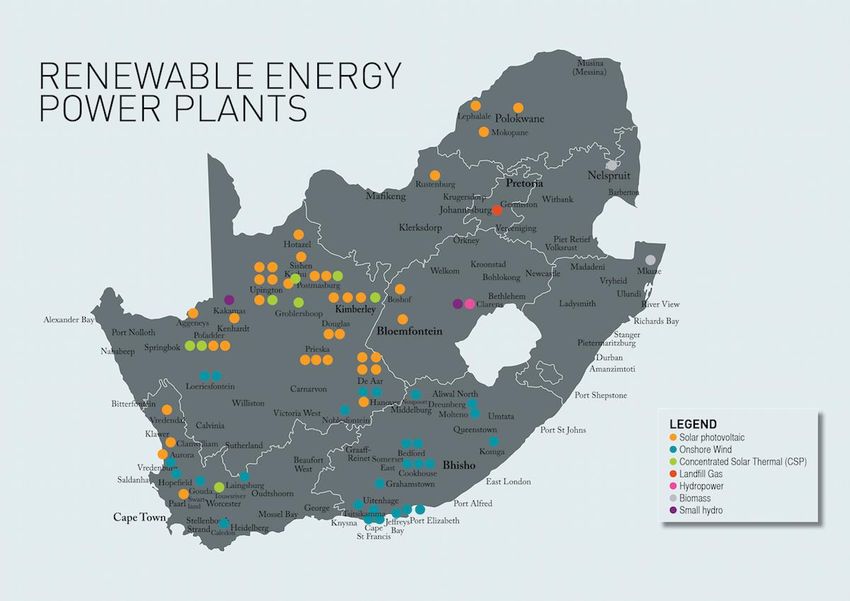
KEY MESSAGES
COST IS NO LONGER A BARRIER TO SIGNIFICANT MITIGATION IN THE RSA POWER SECTOR
1. Significant climate mitigation does not increase the cost of power – it potentially even reduces cost
2. The RE cost revolution resulted in a technological disruption in the power sector: cost-optimal, reliable power supply is now best provided by RE,
storage and peakers. Coal, nuclear and hydro are no longer economically competitive new-build generation technologies in the SA power sector
3. All cost optimal scenarios include a RE build equal to or greater than that envisaged in the current IRP
4. A more ambitious RE build will greatly benefit SA and must begin immediately
– It will deliver a large green stimulus plus value chain localisation opportunities
– Important further benefits include: significant job creation, local air pollutant reduction, foreign and domestic investment, economic recovery for
declining coal mining regions, reduction in the carbon intensity of exports, opportunities to export RE components into Africa, mitigating coal
financing risk and enabling future growth areas such as electric vehicles and green hydrogen
– It is a highly cost effectively strategy to deliver on our international climate mitigation commitments
5. The modelling shows that an ambitious RE build scenario creates options in respect of RSA’s energy future
– the decision to build expensive new gas infrastructure can be avoided for at least a decade and might not be necessary
– should SA come under large pressure to close its coal plant in the longer term it will be able to do so cost effectively
6. Implications for policymakers:
– The IRP should be reviewed urgently with updated RE cost assumptions, given their significant impact on modelling outcomes
– The additional carbon savings could be used to negotiate a large climate finance transaction with climate funders and development finance
institutions that can contribute to resolving Eskom’s financing crisis and provide support for a Just Transition for affected communities
©Meridian Economics 2020 ׀10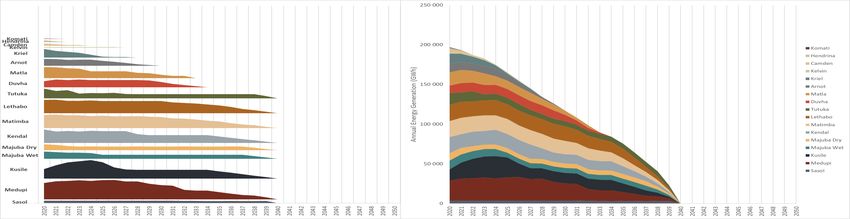
CONTEXTUALISING THE STUDY
THIS IS A SECTOR LEVEL STUDY TO ASSESS THE COST OF CLIMATE MITIGATION IN THE FUTURE RSA POWER SECTOR
• What can the study tell us?
– The power system cost curve associated with increasing carbon constraints on the RSA power system until 2050, with adequacy and reliability
accounted for
– The cost implications of adopting power sector carbon budgets associated with RSA alignment with Paris climate change goals
– The impact of recent disruptive change in RE costs on cost optimal future RSA power system development paths
– A temporal perspective across three decades, and as such demonstrates potential for lock-ins and the creation of and foreclosing on options
• What can the study comment on, but did not consider in detail?
– Investment levels across different scenarios
– A comprehensive view of real world constraints to accelerated RE builds. This is partially dealt with here.
• What can the study not tell us?
– It does not predict the future path of electricity prices, as this involves regulatory tariff-setting considerations
– How best to design an optimal RE build strategy for RSA, including aspects such as the optimal form of grid extension, who should finance and build
the RE, contracting and procurement
– The macro-economic impact of various power sector scenarios, beyond using the cost of electricity as a (simplistic) proxy
– The impact on jobs associated with various scenarios
– The implications of disruptive demand profiles, including the effect of COVID in the near term
©Meridian Economics 2020 ׀11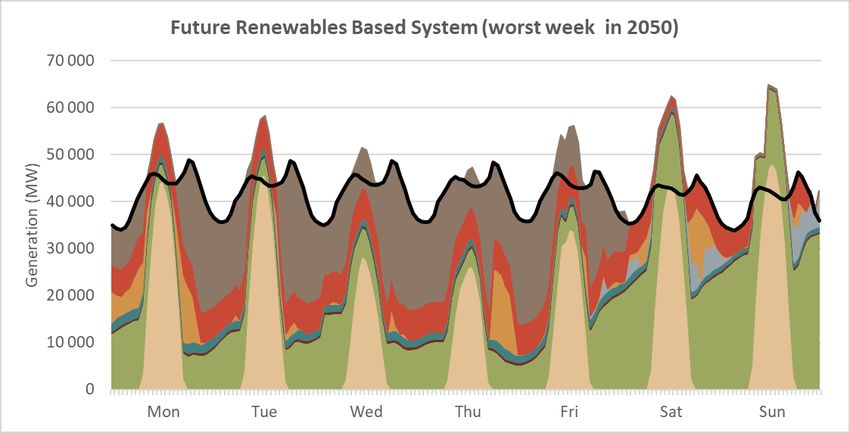
CONTENTS
• Approach and methodology – system modelling is required
• Assumptions – latest public domain information, common to all scenarios
• Current policy reference scenario – projecting the IRP policy intent to 2050
• Least Cost – the most economic scenario in a theoretical world
• Understanding carbon emissions – how low do we need to go in the power sector?
• Optimised Mitigation Scenarios - least cost theoretical power systems under emission constraints
• Reality check – do the results survive in the real world outside of a model?
• Realistic Mitigation Scenarios – assessment of realistic power sector infrastructure build programmes
• Policy Implications
• Conclusion
• Appendix - includes glossary of terms, reference list and additional technical information.
We acknowledge the support of Agora Energiewende and the Children’s Investment Fund Foundation. This work was undertaken in collaboration
with the Council of Scientific and Industrial Research (CSIR) Energy Centre.
This deck is accompanied by a detailed technical report: CSIR (2020) “Systems analysis to support increasingly ambitious CO2 emissions scenarios in
the South African electricity system,” Technical Report, July 2020.
©Meridian Economics 2020 ׀12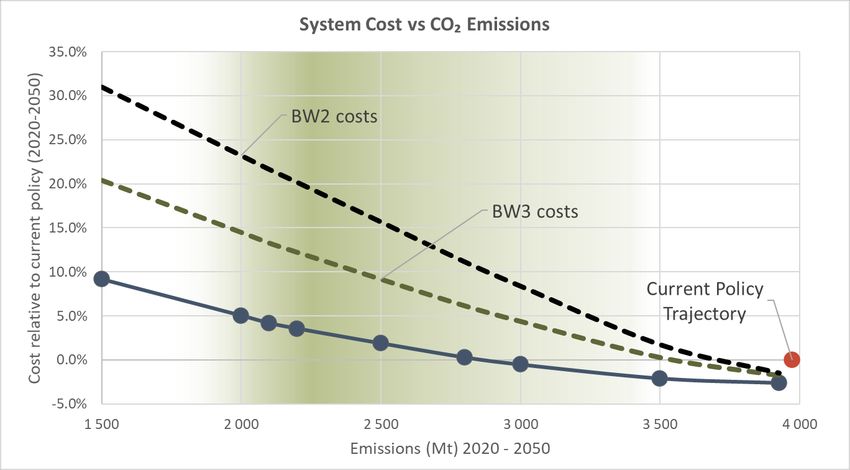
Current Policy Understanding Optimised Mitigation Realistic Mitigation
Modelling Approach Assumptions Least Cost Scenario Reality Check Policy Implications Conclusion
Reference Scenario Carbon Emissions Scenarios Scenarios
THE INVESTIGATION REQUIRED SYSTEM PLANNING TOOLS
A LEAST COST OPTIMISATION MODEL ENSURES ELECTRICITY DEMAND IS MET RELIABLY AND COST EFFICIENTLY
• Different technologies have different capacity1 and
Costs and characteristics for all Hourly demand forecast
System Planning
energy2 profiles, and therefore direct cost generation technologies (for representative days of year) for a Scenario
comparisons are not always valuable. (including cost learning rates)
– Technologies are embedded in a system which has
to deliver power reliably & optimally using
characteristics of each generation source to meet Least Cost Scenario Constraints
System Acceptability Metrics
Optimization e.g. Carbon Budget, Annual
demand most economically. e.g. System Adequacy
(Plexos) capacity build limits
• We therefore needed to consider credible possible
future evolutions (Scenarios) of the entire power
system using powerful system planning software
(Plexos3)
Schedule of new build capacity Energy generated per year for Cost-optimal retirement
• The system planning model ensures that in all for each generation technology each generation technology schedule for existing assets
Scenarios, electricity demand is met on an hourly,
Komati
Hendrina
daily, and seasonal basis - assessed by a ‘system
Camden
Kelvin
Kriel
Arnot
Matla
Duvha
adequacy’ test. Tutuka
Lethabo
Matimba
• All power systems reported are adequate (i.e. meet
Kendal
Majuba Dry
Majuba Wet
Kusile
demand at all times with no load shedding) Medupi
Sasol
2020
2021
2022
2023
2024
2025
2026
2027
2028
2029
2030
2031
2032
2033
2034
2035
2036
2037
2038
2039
2040
2041
2042
2043
2044
2045
2046
2047
2048
2049
2050
1Capacityrefers to the maximum electrical power that can be generated from a source at different times of day.
©Meridian Economics 2020 ׀13 2Energy refersto the cumulative amount of electricity that can be generated from a source over a period of hours, days or years.
3The same Plexos software is also used in the government process to develop the IRP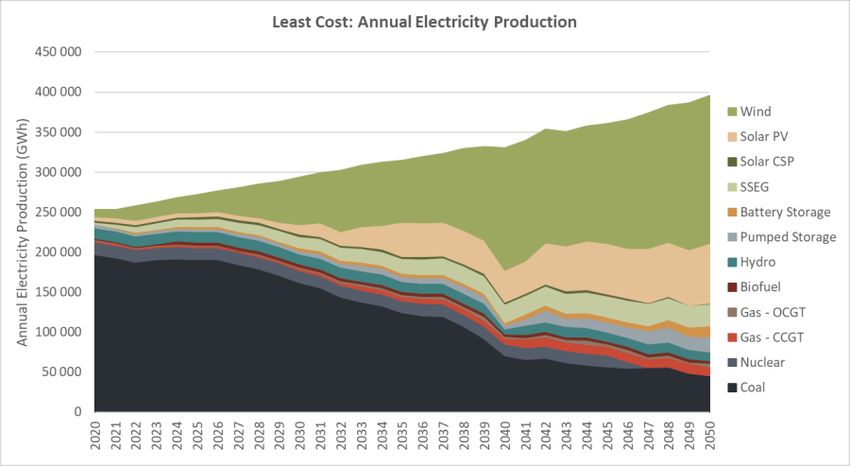
Current Policy Understanding Optimised Mitigation Realistic Mitigation
Modelling Approach Assumptions Least Cost Scenario Reality Check Policy Implications Conclusion
Reference Scenario Carbon Emissions Scenarios Scenarios
LEAST COST POWER SYSTEM DESIGN
OPTIMAL POWER SYSTEM IS BASED ON MINIMISING ‘AVOIDABLE COSTS’
• In economics, an ‘avoidable cost’ is a cost that can be eliminated by not engaging in or no longer performing an activity
– An avoidable cost is therefore any future cost over which we still have decision agency i.e. a cost that we choose to incur
• In context of this study, these are all the yet-to-be-incurred costs of generating electricity from 2020 – 2050
• We refer to the sum of these costs for each power system scenario as its ‘system cost’
• The model ensures the specified system constraints are met for each scenario at the lowest possible system cost
• In attempting to minimise the system cost for a scenario the optimisation model performs the following:
– Selects most economic combination of new technologies and necessary capacity to install each year
– Decides how hard to run existing resources to meet energy generation requirement for the year most economically
• Including the cost-optimised dispatch of coal fired power
– Optimally closes existing generators to avoid fixed costs from keeping them available
• This is a critical element of the modelling we performed.
• Retirement of existing capacity is based on an economic decision, not on a pre-defined retirement schedule
©Meridian Economics 2020 ׀14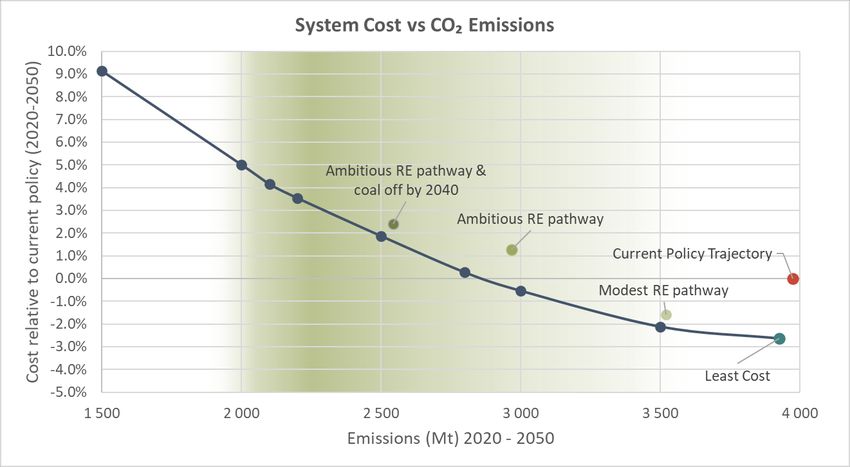
Current Policy Understanding Optimised Mitigation Realistic Mitigation
Modelling Approach Assumptions Least Cost Scenario Reality Check Policy Implications Conclusion
Reference Scenario Carbon Emissions Scenarios Scenarios
COSTS CONSIDERED IN OUR ANALYSIS
THE SCOPE OF COSTS INCLUDED AND THOSE COSTS WHICH FALL OUTSIDE THIS WORK
Included in the ambit of system costs Excluded costs:
modelled are: Excluded due to unavailability of data
• Energy generation costs which include • Any necessary refurbishment capital costs required to sustain the coal fleet to current
― The capital cost of new capacity retirement date (Inclusion would further support our findings)
― Fixed and Variable Operation and • Any retrofit costs required to run the coal fleet at low capacity factors (down to 35%)
Maintenance costs (FOM and VOM) of both Excluded as outside the scope of our modelling
existing and new capacity • Costs associated with Distribution and Transmission (although the shallow connection
― Fuel cost cost is included in the cost of REIPPPP power)
― Start-up and Shutdown cost • Short term reserve services (such as inertia)
• The cost of maintaining reserve capacity, which is • Metering, billing etc
required to maintain system adequacy • All Unavoidable costs (these costs are not incurred by future choices, but result from past
• The Cost of Unserved Energy (COUE) which refers to choices – decision agency no longer exists over these costs)
the opportunity cost to electricity consumers (and ― Cost recovery to address legacy debt and returns on historic investments
the economy) of electricity supply interruptions ― Sunk capital costs – i.e. capital that has already been spent
― Any capital costs committed but not yet spent (e.g. completion of Medupi and
Kusile)
©Meridian Economics 2020 ׀15 ― Actual cost of decommissioning plantsCurrent Policy Understanding Optimised Mitigation Realistic Mitigation
Modelling Approach Assumptions Least Cost Scenario Reality Check Policy Implications Conclusion
Reference Scenario Carbon Emissions Scenarios Scenarios
OUR PRIMARY METRICS: SYSTEM COST AND EMISSIONS
THE BASIS FOR COMPARISON OF DIFFERENT POWER SYSTEM PLANS
System Cost (c/kWh) Least Cost
Optimization
• It is useful to express the system cost per unit of electricity
(Plexos)
to allow comparison between different power system
plans. This is achieved by ‘levelising’ the total system cost Schedule of new build capacity Energy generated per year for
over the electricity consumed from 2020 – 2050 for each generation technology each generation technology
• System cost (c/kWh) is derived by dividing Present Value*
of total System Costs by Present Value of Total electricity
generated Capex & Fuel &
• Levelised Cost of Electricity (LCOE) is often used to FOM VOM
compare energy cost between technologies. The System
cost (c/kWh) is the aggregate Levelised Cost of Electricity
(LCOE) for the entire system
• Expressed in constant real 2019 c/kWh
• System cost (c/kWh) is NOT to be compared with the Emissions (Mt CO2)
current or future tariff path: Total System Total electricity
Emissions for each scenario are
1) The tariff must recover all costs, including those
calculated by summing annual CO₂
Costs generated
excluded from our analysis
emissions from all technologies for
2) The system cost is calculated to be constant in real the period 2020 – 2050 expressed in
terms. The actual tariff path is a function of the
Megatons (Mt) or Gigatons (Gt)
regulatory process. System Cost Emissions
3) System cost (c/kWh) can be seen as the portion of the (c/kWh) (Mt CO₂)
future tariff that is necessary to cover the cost of future
generation
©Meridian Economics 2020 ׀16
*Present Value discounting is at the National Treasury social discount rate of 8.2% realCurrent Policy Understanding Optimised Mitigation Realistic Mitigation
Modelling Approach Assumptions Least Cost Scenario Reality Check Policy Implications Conclusion
Reference Scenario Carbon Emissions Scenarios Scenarios
OUTLINE OF OUR RESEARCH PROCESS
EXPLORING POSSIBLE FUTURES OF THE RSA POWER SYSTEM IN THE COST-EMISSIONS SPACE
1) Current Policy Reference Scenario 2) Least Cost Power System
• The Integrated Resource Plan (2019) is South Africa’s electricity
System Cost
• With cost as the only consideration, we determined the optimal
plan until 2030
power system plan for 2020 to 2050 period
• We construct a credible ‘Current Policy Trajectory’ reference
• System cost and CO₂ emissions are calculated for the Least Cost
scenario which is based on the IRP until 2030, and includes
plan to locate it relative to the Current Policy Trajectory in the
adjustments for policy intent until 2050
‘cost vs emissions’ space
• System cost and CO₂ emissions is calculated for the extended
IRP to locate it in the ‘cost vs emissions’ space
CO2 Emissions 2020-2050
1.5 Gt max
System Cost
emissions 3) Optimised Mitigation Scenarios
• A carbon constraint (maximum total emissions for the power system) is
3 Gt max introduced into the model
emissions
• This allowed us to determine a suite of optimal least cost power system
scenarios for a range of carbon constraints
• System cost and carbon constraints are plotted for each scenario, which
yields the curve representing the cost of mitigation
Practical RE
CO2 Emissions 2020-2050
System Cost
build plan
4) Realistic Mitigation Scenarios
• The optimised scenarios have impractical RE build paths due to the omission of real-world constraints from
the modelling inputs, like industry capabilities and short-term regional grid capacity
• We selected two optimised scenarios with specific carbon constraints and included a minimum annual RE
new build limit to smooth RE new build over the planning horizon, representing a more sustainable and
achievable RE build pathway which achieves similar mitigation
CO2 Emissions 2020-2050 • By calculating system cost and emissions for each of these scenarios, we could quantify any additional cost of
©Meridian Economics 2020 ׀17 mitigation due to real-world constraintsCurrent Policy Understanding Optimised Mitigation Realistic Mitigation
Modelling Approach Assumptions Least Cost Scenario Reality Check Policy Implications Conclusion
Reference Scenario Carbon Emissions Scenarios Scenarios
NEW-BUILD TECHNOLOGY ASSUMPTIONS
COMMON TO ALL POWER SYSTEM SCENARIOS INVESTIGATED
• Technology assumptions (cost and Overnight
Fixed Variable
Capacity Build Economic
operating characteristics) must be Operating Operating LCOE 2020 LCOE 2030 LCOE 2035
Technology Capital Costs Factor Period Lifetime
Cost (FOM) Cost (VOM) [c/kWh] [c/kWh] [c/kWh]
common to the analysis of all future (OCC) [R/kW]
[R/kW/year] [R/MWh]
(typical) [years] [years]
power system scenarios to allow like-
Wind 14 515 742 0 36% 4 20 70.6 62.1 60.0
for-like comparison
Solar PV 10 140 328 0 20% 1 25 62.0 45.7 41.8
• Detailed technology assumptions can be
Solar CSP 110 576 1 236 1 60% 4 30 216.1 159.9 146.9
found in the CSIR report1 covering the
Plexos systems analysis SSEG* 12 310 328 0 20% 1 25 100.0 72.0 66.0
Battery Storage 13 175 757 4 12% 1 10 235.4 175.3 168.8
• Assumptions from the 2019 IRP were
replaced with latest best public domain Pumped Storage 24 680 222 0 33% 8 50 96.7 96.7 96.7
information if available (replacements Hydro 50 156 484 0 67% 8 60 113.0 113.0 113.0
indicated by bold italics) Biofuel 19 468 2 907 76 74% 1 30 79.6 79.6 79.6
• All costs are expressed in Jan 2019 Gas – OCGT/GE 10 015 196 3 8% 2 30 336.9 336.9 336.9
Rands Gas – CCGT/GE 10 997 203 27 36% 3 30 153.1 153.1 153.1
• Summary of available technologies Nuclear 75 728 1 187 45 90% 6 60 128.5 126.6 126.6
shown on this slide (for a full list of Coal (PF) 43 453 1 133 98 85% 9 30 116.7 116.7 116.7
technologies made available to the Coal (FBC) 52 450 762 212 85% 4 30 120.2 120.2 120.2
optimiser see Appendix) *Small Scale Embedded Generation
Sources: Integrated Resource Plan (2019); EPRI (2017); NREL Annual Technology Baseline (2019); 1CSIR, 2020 “Systems analysis to
©Meridian Economics 2020 ׀18 support increasingly ambitious CO2 emissions scenarios in the South African electricity system,” Technical Report, July 2020.Current Policy Understanding Optimised Mitigation Realistic Mitigation
Modelling Approach Assumptions Least Cost Scenario Reality Check Policy Implications Conclusion
Reference Scenario Carbon Emissions Scenarios Scenarios
ANTICIPATED TECHNOLOGY COST LEARNING RATES
DISRUPTIVE REDUCTION IN THE COST OF WIND AND SOLAR PV EXPECTED TO CONTINUE FOR NEXT TWO DECADES
• Renewable energy costs have seen
dramatic declines in the past few
years, now positioning them as the
most cost-optimal energy generation
source in many countries.
• These cost reductions are expected
to continue for the foreseeable
future.
• Nuclear and gas are ‘mature
technologies’ hence cost declines are
not anticipated.
Sources: Integrated Resource Plan (2019); EPRI (2017); NREL Annual Technology Baseline (2019); for more information
©Meridian Economics 2020 ׀19 regarding these assumptions see CSIR (2020) technical report.Current Policy Understanding Optimised Mitigation Realistic Mitigation
Modelling Approach Assumptions Least Cost Scenario Reality Check Policy Implications Conclusion
Reference Scenario Carbon Emissions Scenarios Scenarios
RE PROVIDES LOWEST COST ENERGY FOR NEW-BUILD
HISTORICAL AND FUTURE COST LEARNING IN RE CRITICAL TO POWER SYSTEMS OF THE FUTURE
South Africa has already witnessed rapid renewable energy price declines, as demonstrated through previous bid windows of the country’s Renewable Energy Independent Power
Producer Programme (REIPPPP). Based on interactions with South African industry experts in a separate study (Meridian Economics, 2020c), solar PV and wind energy cost declines
are expected to continue – the assumptions used in this modelling work* lie above or within industry expectations as reported in that study.
Sources: CSIR (2017); CSIR (2020); NREL (2019); *LCOE costs for new-build wind and solar PV were developed using the REIPPPP Bid Window (BW) 4 (Expedited) costs as a starting point
StatsSA (2020); Meridian Economics (2020c) (aligned with IRP 2019), with declining cost trajectories thereafter based on the NREL Annual Technology Baseline (2019) learning assumptions.
Although capacity factor and fixed operations and maintenance costs are anticipated to reduce, only capital expenditure costs was reduced in
©Meridian Economics 2020 ׀20 this assumption. This is highly conservative (particularly for wind).Current Policy Understanding Optimised Mitigation Realistic Mitigation
Modelling Approach Assumptions Least Cost Scenario Reality Check Policy Implications Conclusion
Reference Scenario Carbon Emissions Scenarios Scenarios
AFRAID OF THE DARK? SUFFERING FROM DUNKELFLAUTE?*
FILLING THE GAP BETWEEN DEMAND AND RENEWABLE ENERGY GENERATION IN A TYPICAL WEEK
Gas - OCGT
Gas - OCGT
Pumped Storage
Hydro
Gas - CCGT
Batteries
Pumped Storage
34.5% Wind
Coal 69.9%
34.3% Solar
Nuclear
Wind 4.1%
Solar 6.6%
2020 2050
*In the German language, dunkelflaute is a word that refers to the fear of having Coal-based RE-based
inadequate sunshine or wind to maintain a viable supply of renewable energy. capacity mix capacity mix
©Meridian Economics 2020 ׀22Current Policy Understanding Optimised Mitigation Realistic Mitigation
Modelling Approach Assumptions Least Cost Scenario Reality Check Policy Implications Conclusion
Reference Scenario Carbon Emissions Scenarios Scenarios
DON’T BE AFRAID
FLEXIBLE CAPACITY (DESIGNED TO STAND IDLE MOST OF THE TIME) FILLS THE GAP DURING ADVERSE WEATHER
Gas - OCGT
Gas - OCGT
Pumped Storage
Hydro
Gas - CCGT
Batteries
Pumped Storage
34.5% Wind
Coal 69.9%
34.3% Solar
Nuclear
Wind 4.1%
Solar 6.6%
2020 2050
Coal-based RE-based
capacity mix capacity mix
©Meridian Economics 2020 ׀23Current Policy Understanding Optimised Mitigation Realistic Mitigation
Modelling Approach Assumptions Least Cost Scenario Reality Check Policy Implications Conclusion
Reference Scenario Carbon Emissions Scenarios Scenarios
UNDERSTANDING THE COST OF COAL-FIRED POWER
DISPATCH COST OF COAL IS CURRENTLY LOWER THAN RENEWABLES – IS THIS A USEFUL COMPARISON?
• If early closure of coal power stations is not contemplated,
then fixed costs and future capital expenditure (capex) for
each station until retirement date is unavoidable
– In this case, new sources of energy would need to be lower
than the dispatch cost (coal fuel plus variable O&M) to
economically replace coal power
• As of 2020, New Build Wind and Solar PV LCOE¹ is still higher
than dispatch cost of all coal stations, as the chart shows
• BUT there is no rational reason not to close coal stations early
if it is economically efficient to do so. A more useful
comparison is thus the cost of new build alternatives to the
full cost of coal power including fixed costs and future capex.
A note on coal fuel costs: The data available for analysis remains
high-level, additional, more granular detail would allow:
• Understanding costs related to multiple supply sources per
station, including more expensive short-term contracts
Source: Eskom authored information in the public domain including Eskom (2019a), Dentons (2015), coal mining
• Understanding the proportion of coal that is subject to Take- annual reports, interactions with coal supply and Eskom operations experts, EPRI.
Or-Pay (TOP) contracts (some of this cost would remain
¹ LCOE includes all Capital, Operations and Maintenance Costs, Socio-Economic Development (SED),
unavoidable even if stations were closed) Enterprise Development (ED), and grid connection cost (see Appendix for further information on
©Meridian Economics 2020 ׀24 SED and ED). In general comparing the LCOE of variable and dispatchable plant does not
adequately account for the different capacity and ancillary benefits each bring to the system.Current Policy Understanding Optimised Mitigation Realistic Mitigation
Modelling Approach Assumptions Least Cost Scenario Reality Check Policy Implications Conclusion
Reference Scenario Carbon Emissions Scenarios Scenarios
UNDERSTANDING THE COST OF COAL-FIRED POWER
FIXED OPERATIONS & MAINTENANCE (O&M) AND COST OF LOCAL AIR POLLUTION ABATEMENT
• Fixed O&M
– This cost component is based on EPRI (2017) information and is assumed to be the same R/kW for all units at all stations.
– We assume units can be closed one by one terminating the fixed cost per unit in the year of closure.
• Local air pollution abatement: Compliance with Minimum Emission Standards (MES)
– Coal-fired power plants emit harmful local air pollutants, including Particulate Matter (PM), Nitrogen Dioxide (NO2) and Sulphur Dioxide (SO2)
which are regulated under the Air Quality Act (2004).
– In order to be in compliance with Local Air Quality regulation, most of Eskom’s coal fleet require retrofitting, which implies additional capital and
fixed costs. Eskom has stated that these costs are prohibitive and has proposed a retrofitting schedule which leaves many of its plants out of
compliance. How this issue will be resolved is uncertain at present.
– This study requires assumptions to be made as to what technologies will be retrofitted at which stations when, and at what cost. For this, we
assume Eskom’s retrofit schedule (Eskom, 2019b) and Eskom’s associated costs (Naledzi, 2018) (critiqued as being inflated) for the following
reasons:
• Eskom’s cost dataset is internally consistent, context-specific and publicly available. The alternative would be to use data from different
sources and contexts for different technologies with differing degrees of credibility.
• Eskom’s schedule is consistent with that used in the IRP, promoting consistency and comparability.
• The assumption of partial compliance is conservative, as it reduces the coal fleet costs relative to other technologies.
• In our modelling both MES capital and MES operating expense (Opex) were treated as potentially avoidable costs.
©Meridian Economics 2020 ׀25Current Policy Understanding Optimised Mitigation Realistic Mitigation
Modelling Approach Assumptions Least Cost Scenario Reality Check Policy Implications Conclusion
Reference Scenario Carbon Emissions Scenarios Scenarios
COAL POWER IS CLOSED WHEN ECONOMIC TO DO SO
IN OUR MODELLING AND IN REALITY ALL FUTURE COAL-RELATED COSTS ARE POTENTIALLY AVOIDABLE
• Our modelling allows individual units to
close when economic to do so, saving all
future fuel and variable costs, fixed costs
as well as future capital costs for that
unit
– In this study, individual coal station
units are subject to an operability
constraint - a minimum annual
Capacity Factor of 35%.
• As of 2020 Solar power is cheaper than
the full cost of power from only the
more expensive coal stations.
– Energy from new build coal plant costs
*
nearly twice as much per kWh as new
Solar
*A capacity factor of 65% is assumed for the calculation of FOM cost per kWh
©Meridian Economics 2020 ׀26Current Policy Understanding Optimised Mitigation Realistic Mitigation
Modelling Approach Assumptions Least Cost Scenario Reality Check Policy Implications Conclusion
Reference Scenario Carbon Emissions Scenarios Scenarios
RE COSTS FALL, COAL COSTS, IF ANYTHING, RISE
BY 2030 SOLAR PV ENERGY IS CHEAPER THAN ALMOST ALL COAL
• Solar PV and Wind costs are expected to
fall significantly over the next decade
• Assuming system adequacy and stability
needs can be met, a substantial amount of
coal-fired power should be able to be
replaced by RE at a cost saving
• Any capital costs required to keep the existing
coal fleet running (over and above typical FOM)
are unknown and therefore not included
– These are potentially substantial costs for
Eskom’s older and mid-life stations - avoidable
through early closure of units/stations
(Meridian Economics, 2017)
• Clearly, any required capital would increase the
cost of running coal plant to pre-determined *
retirement dates as is the plan in the 2019 IRP
– Plans that consider early retirement of coal
*A capacity factor of 65% is assumed for the calculation of FOM cost per kWh
can potentially avoid such capital costs
©Meridian Economics 2020 ׀27Current Policy Understanding Optimised Mitigation Realistic Mitigation
Modelling Approach Assumptions Least Cost Scenario Reality Check Policy Implications Conclusion
Reference Scenario Carbon Emissions Scenarios Scenarios
ELECTRICITY DEMAND AND COAL FLEET PERFORMANCE
OUR ASSUMPTIONS CONSIDER LOWER DEMAND THAN IRP, BUT ALSO LOWER ENERGY AVAILABILITY FACTORS (EAF)
• SA’s coal plants have been underperforming and
electricity demand has been lower than
expected.
• Demand and EAF assumptions for this study are
in line with Eskom’s Oct 2019 Medium Term
System Adequacy Outlook [MTSAO] (green lines).
• The IRP 2019 and the MTSAO have highlighted a
short-term energy supply gap of 2-3 GW
between 2019 and 2022, but neither
recommended specific actions to mitigate this
Source: Fabricius et al (Eskom) (2019)
gap.
• In January 2020, the CSIR identified key interventions to mitigate the expected supply shortfall for this period, including emergency power procurement
by the Department of Mineral Resources and Energy (DMRE), customer response through unlocking small-scale embedded generation (SSEG), and
incorporating 200 MW of additional capacity from existing solar and wind projects (CSIR, 2020).
• In all scenarios, including the IRP, we assume that the CSIR’s identified interventions will close the energy supply gap identified.
• SSEG for all scenarios we considered is thus assumed to provide installed capacity of 3.4 GW (built from 2020 – 2022) followed by an additional 500MW
per year thereafter in line with the 2019 IRP assumptions
For more information regarding these assumptions see CSIR & Meridian, 2020. “Systems analysis to support increasingly ambitious CO2
©Meridian Economics 2020 ׀28 emissions scenarios in the South African electricity system.”Current Policy Understanding Optimised Mitigation Realistic Mitigation
Modelling Approach Assumptions Least Cost Scenario Reality Check Policy Implications Conclusion
Reference Scenario Carbon Emissions Scenarios Scenarios
Wind and solar PV new build
OUR CURRENT POLICY TRAJECTORY limits removed after 2030
CONSTRUCTING A CREDIBLE, POLICY REFERENCE SCENARIO BASED ON THE IRP 2019
IRP 2019 is used as a basis for constructing
• The Integrated Resource Plan (2019) contains the best existing our ‘current policy trajectory’
expression of current government electricity policy. We
therefore use this as the basis of our reference scenario – the
Wind and solar PV new build limits
plan against which mitigation scenarios can be compared. retained. Installed capacity stagnates with
• The IRP is constructed on a system modelling basis but new build merely replacing retiring plant
– has ‘policy adjustment’ that forces in new coal, hydro and gas as
well as creates annual new-build constraints on solar PV of 1 GW
and wind of 1.6 GW
– assumes coal stations will all run to their design life end dates,
regardless of cost
– only presents a plan as far as 2030
• We needed to extend the IRP policy intent from 2031 to 2050
for comparison with other scenarios
• Retaining the IRP RE build constraints beyond 2030 results in
new-build coal in the late 2040s – an irrational policy outcome
considering cost of new-build coal relative to RE* in future
years (Merven et al (SA-TIED), 2018)
New
• Therefore our ‘current policy trajectory’ incorporates the same
coal in
new build profile as the IRP for all technologies to 2030, but 2040s
assumes that constraints on new build capacity for solar PV
and wind are lifted from 2030 onwards, and that capacity
expansion then proceeds on a least cost basis *Merven et al (2018) have explored the impact of retaining RE build limits from a macro-economic perspective
©Meridian Economics 2020 ׀29 and conclude the impact of constraining RE could be as high as ZAR 0.16/kWh by 2050, using conservative
assumptions on RE and ZAR 0.18/kWh, using more optimistic RE costs.Current Policy Understanding Optimised Mitigation Realistic Mitigation
Modelling Approach Assumptions Least Cost Scenario Reality Check Policy Implications Conclusion
Reference Scenario Carbon Emissions Scenarios Scenarios
LOCATING CURRENT POLICY IN THE COST–EMISSIONS SPACE
THE POLICY REFERENCE USED IN THIS STUDY IS CONSERVATIVE IN BOTH COST AND EMISSIONS
• The current policy trajectory (reference scenario) used
in our study has cumulative emissions of 3.97GT and
system cost of 73.0 c/kWh
• The impact of retaining the current annual RE new-
build constraints after 2030 would be a greater than
500 Mt increase in emissions, plus a small increase in
system cost compared to the reference scenario used
• The current policy trajectory used as the reference
scenario is thus conservative in terms of both cost and
emissions
The reference scenario
All cost and emissions comparisons in • The reference scenario is further conservative in that it
this study are relative to the lower
cost and lower emission version of
– assumes the post 2030 optimal build programme is
current policy feasible and can be built (any required smoothing of
the build programme will increase cost)
– assumes the post 2030 optimal build programme
will be built (no policy adjustment)
• Relaxation of these conservative assumptions would
serve to increase cost or emissions (or both) of the
reference scenario – strengthening our findings
©Meridian Economics 2020 ׀30Current Policy Understanding Optimised Mitigation Realistic Mitigation
Modelling Approach Assumptions Least Cost Scenario Reality Check Policy Implications Conclusion
Reference Scenario Carbon Emissions Scenarios Scenarios
COAL-FIRED GENERATION AS PER CURRENT POLICY
ALL UNITS RUN TO SCHEDULED RETIREMENT. FORCED-IN NEW COAL CREATES PATH-DEPENDENCE
Current Policy Trajectory: Annual Energy Generation by Coal-fired Power Station With an excess of coal and hydro capacity (Inga)
already forced in, their capital costs sunk by the
early 2030s result in an increase in coal use to meet
increasing demand. Forced build locks in coal and
locks out cheaper RE options.
©Meridian Economics 2020 ׀31Current Policy Understanding Optimised Mitigation Realistic Mitigation
Modelling Approach Assumptions Least Cost Scenario Reality Check Policy Implications Conclusion
Reference Scenario Carbon Emissions Scenarios Scenarios
LEAST COST POWER SYSTEM
THIS IS A THEORETICAL COST-OPTIMAL POWER SYSTEM PLAN WITHOUT CONSTRAINTS
Total new capacity
• No limits are placed on any technology built in the least cost
Technology
– new capacity is built and old capacity scenario from
2020-2050 (GW)
is retired purely on the basis of Wind 76.8
minimising cost Solar PV 42.3
• No new coal, nuclear or hydro is chosen Solar CSP -
by the optimiser SSEG 17.4
– these technologies are more costly Battery Storage 16.9
than the portfolio of alternatives Pumped Storage 3.9
• Most new build capacity is wind and Hydro -
solar PV, with gas and storage to provide Biofuel 0.3
flexibility and reserve capacity as coal Gas – OCGT/GE 28.2
retires (reserve capacity is required Gas – CCGT/GE 4.7
when the primary generation sources Nuclear -
are not available) Coal -
©Meridian Economics 2020 ׀32Current Policy Understanding Optimised Mitigation Realistic Mitigation
Modelling Approach Assumptions Least Cost Scenario Reality Check Policy Implications Conclusion
Reference Scenario Carbon Emissions Scenarios Scenarios
LOCATING THE LEAST COST POWER
Least Cost plan
SYSTEM IN THE COST EMISSIONS SPACE relative to
Current Policy
Trajectory to
LOWER COST THAN CURRENT POLICY, WITH LOWER EMISSIONS 2050
• A ‘least cost’ power system plan is 2.5% cheaper than current policy and
has lower emissions
• Emissions from new coal in the current policy trajectory are offset by
new hydro (Inga)
– Inga is not chosen in the least cost optimisation due to its expense
– There are serious questions around the reality / viability of the Inga
project, bringing its emissions mitigation effect into question.
• Including coal refurbishment capital costs (unavailable to us) into the
assumptions underpinning all scenarios would
a) increase cost of current policy trajectory relative to least cost
scenario and
b) decrease the cost of RE compared to coal, causing the least cost
scenario to build more RE, further decreasing emissions
©Meridian Economics 2020 ׀34Current Policy Understanding Optimised Mitigation Realistic Mitigation
Modelling Approach Assumptions Least Cost Scenario Reality Check Policy Implications Conclusion
Reference Scenario Carbon Emissions Scenarios Scenarios
UNDERSTANDING THE GLOBAL CARBON EMISSIONS SPACE
HOW DO WE TRANSLATE THIS INTO A CARBON BUDGET? Figure 1. Hypothetical Global Emissions Reduction Trajectories
• The Paris Agreement of the United Nations Framework Convention on 40
Business-as-usual (BAU)
Climate Change (UNFCCC) includes the goal of keeping global temperatures
2°C warming trajectory
‘well below 2 degrees’.
Emissions
1.5°C warming trajectory
• Achieving this goal requires significant constraints on global carbon 2000 Gt
emissions. As a signatory to the Paris Agreement, South Africa is required to 150 Gt
1050 Gt Bold (Gt) values represent
Carbon Budget (total emissions
align with these global efforts. How is such alignment assessed, at a global, for the entire period)
South African and SA power sector level?
2020 2030 2040 2050
• There is no definitive way of ascertaining this. Apart from complexities in
Figure 2. Costing Hypothetical Global Emissions Budgets
the climate science, factors that need to be considered include equity of
effort, capabilities, existing fossil fuel intensities, and domestic policy Paris-Aligned emissions range
Cost of mitigation
objectives. The task is as much ethical and political as it is scientific.
1.5°C
• Carbon budgets represent a rigorous yet flexible metric for considering effort
over time. A carbon budget is a number representing cumulative emissions 2°C
over a timeframe (here, 2020 to 2050), i.e. the area below an emissions BAU
trajectory. By defining the trajectory, the budget is implied.
• For example, hypothetical global carbon budgets representing 1.5 and 2
degrees of warming are presented in Figure 1. A carbon budget can be 150 Gt 1050 Gt 2000 Gt
considered against the cost of achieving this, as shown in Figure 2. Cumulative Emissions (Gt) 2020 - 2050
©Meridian Economics 2020 ׀35
Sources: UNFCCC (2015); Ramstorf & Levermann, 2017; Meridian AnalysisCurrent Policy Understanding Optimised Mitigation Realistic Mitigation
Modelling Approach Assumptions Least Cost Scenario Reality Check Policy Implications Conclusion
Reference Scenario Carbon Emissions Scenarios Scenarios
MAPPING THE TERRAIN OF EXISTING RSA CARBON BUDGETS
• The analysis presented here draws on the literature considering the allocation of global budgets to nations, and then on the role of the power sector in achieving South Africa's
contribution to this global effort. The intention is to identify a range of budgets for the power sector which are likely to support an emissions trajectory for RSA that is Paris-aligned.
• The National Benchmark Carbon Trajectory Range is South Africa’s current international and domestic climate policy position, which has an Upper Trajectory carbon budget of
17.5Gt and a Lower Trajectory carbon budget of 10.8Gt for economy-wide emissions. The Lower Trajectory has been assessed as being aligned to 66% probability levels of the
global 2˚C target being achieved, which is generally associated with ‘well below 2˚C’ (Peters, 2017). A Paris-aligned budget at the national, economy-wide level could therefore be
said to be 10,8Gt and below.
Suggesting a Paris-aligned carbon budget range for the RSA power sector
• The IRP 2010 & IRP 2019 Carbon constraint: A carbon constraint was included in
the 2010 IRP based on the power sector continuing to contribute its historical 45%
of SA emissions. This constraint, extended in the 2019 IRP to 2050 is related to the
Upper Trajectory and is therefore both outdated and unlikely to be aligned to the
Paris goals.
• Emissions associated with the Current Policy Trajectory scenario: Consistently
below the IRP carbon constraint, this represents a 3.97 Gt budget. But is it Paris-
aligned? The literature suggests that to enable RSA to achieve 2 degree alignment,
Total Emissions (Gt)
a power sector budget between 2.9 Gt to 3.4 Gt (Burton et al, 2018) would be 2020-2050
appropriate, and for ‘well below 2 degrees’, 2.3 Gt. (McCall et al, 2019).
3.4 Gt
• Noting the uncertainty around these budgets, the broad articulation of the Paris
goals, and the precautionary principle of the UNFCCC, we decided to explore the
range of 2.0 Gt – 3.4 Gt, with an emphasis on 2.3 Gt.
*Noting that the allocation of the global carbon budget to nations has not been achievable in the UNFCCC process to date. In this study we are referring to the use of carbon budgets to assess Paris
goal alignment. Further elaboration of this analysis is provided in ME, 2020b.
©Meridian Economics 2020 ׀36Current Policy Understanding Optimised Mitigation Realistic Mitigation
Modelling Approach Assumptions Least Cost Scenario Reality Check Policy Implications Conclusion
Reference Scenario Carbon Emissions Scenarios Scenarios
A LIKELY PARIS-ALIGNED CARBON
BUDGET RANGE FOR THE RSA POWER
SECTOR
• If a likely Paris-aligned emissions range is 2.0 Gt - 3.4 Gt…
• Current Policy Trajectory and Least Cost scenarios result in
emissions far above Paris-aligned levels
Paris-Aligned Carbon
• We must explore scenarios that achieve emissions in the
Emissions Range likely Paris-aligned carbon budget range
• The optimal way of exploring lower emission options is to re-
run the Least Cost scenario with successively lower emissions
budget constraints
• Another metric for considering alignment with Paris specific
to the power sector is the date when no more coal is burnt for
thermal power. This has been suggested as 2040 in global
analyses (ME, 2020b). We return to this later.
©Meridian Economics 2020 ׀37Current Policy Understanding Optimised Mitigation Realistic Mitigation
Modelling Approach Assumptions Least Cost Scenario Reality Check Policy Implications Conclusion
Reference Scenario Carbon Emissions Scenarios Scenarios
RESULTS OF OUR ANALYSIS
©Meridian Economics 2020 ׀38Current Policy Understanding Optimised Mitigation Realistic Mitigation
Modelling Approach Assumptions Least Cost Scenario Reality Check Policy Implications Conclusion
Reference Scenario Carbon Emissions Scenarios Scenarios
A SERIES OF COST-OPTIMISED +/-2 Gt saving
SCENARIOS WERE DEVELOPED WITH
DECREASING CARBON BUDGETS +/-1 Gt saving
• Power sector scenarios that emit far less than the current policy
trajectory are also cheaper
• The Cost vs Emissions curve is almost flat for the likely Paris-aligned
Optimised emissions range
Mitigation • Substantial mitigation (+/- 1 Gt saving relative to the current policy
trajectory) can be achieved with no increase in cost relative to the
Scenarios Current Policy Trajectory
• Even deeper mitigation comes at a fractional increase in cost
– Emissions can almost be halved (+/- 2 Gt saving relative to the
current policy trajectory) for a 5% increase in electricity cost relative
to the Current Policy Trajectory
• Given the 30-year future timeframe over which any cost difference will
manifest, and inherent difficulty in forecasting over such a period, cost
difference of this magnitude is likely in the error noise
– Relaxing any of our already conservative assumptions would only
serve to reduce any mitigation cost further
©Meridian Economics 2020 ׀39Current Policy Understanding Optimised Mitigation Realistic Mitigation
Modelling Approach Assumptions Least Cost Scenario Reality Check Policy Implications Conclusion
Reference Scenario Carbon Emissions Scenarios Scenarios
POWER SYSTEM PLANS WITH LOWER CARBON EMISSIONS DO NOT
COST SIGNIFICANTLY MORE THAN THE LEAST COST SCENARIO
WHAT DRIVES THIS FINDING?
• RE is currently the lowest cost new build power generation technology available, ensuring that there are no significant emissions
associated with new capacity in any cost optimised scenario.
• The emissions represented in each scenario therefore come predominantly from the coal fleet (emissions from gas are not
material in any optimised mitigation scenario due to its low usage)
• As a result, what drives the reduction in emissions is the accelerated reduction of coal burnt in the existing coal fleet (i.e.
increasingly less energy generated from coal)
• Lowering the carbon budget requires the reduction of coal burn to happen ever sooner.
– This can only happen if RE is built “too early” i.e. earlier than the date determined as optimal from the perspective
of technology learning curves. Hence the (slight) increase in cost as more emissions are mitigated.
– At historic RE costs the penalty of building “too early” was indeed high. With the precipitous drop in RE costs this is no longer
the case
– The following slide elaborates this point
©Meridian Economics 2020 ׀41Current Policy Understanding Optimised Mitigation Realistic Mitigation
Modelling Approach Assumptions Least Cost Scenario Reality Check Policy Implications Conclusion
Reference Scenario Carbon Emissions Scenarios Scenarios
DISRUPTIVE RE COST DECLINES DRIVE
CHEAP MITIGATION ACROSS ALL
SCENARIOS
Latest information
• Is it surprising mitigation is so cheap? Why? Has our
intuition around the cost of RE kept pace with reality?
• If RE costs had remained the same as earlier REIPPP
bid rounds, any mitigation would come with a cost
increase
Using latest information – 1GT mitigation would increase cost 5%-10%
(this is now reality)
– 2GT mitigation would increase cost 15%-25%
– This is no longer the reality
• RE costs have fallen and will continue to fall into the
future as technology cost learning manifests
©Meridian Economics 2020 ׀42Current Policy Understanding Optimised Mitigation Realistic Mitigation
Modelling Approach Assumptions Least Cost Scenario Reality Check Policy Implications Conclusion
Reference Scenario Carbon Emissions Scenarios Scenarios
NEW GENERATION CAPACITY: RE IS THE OPTIMAL CHOICE
NO NEW COAL, NUCLEAR OR HYDRO IS BUILT UNDER ANY COST-OPTIMAL SCENARIO
In all cost-optimal scenarios, the majority of new build
capacity is wind and solar PV, with gas and storage providing
flexibility and reserve capacity as coal retires.
Total new capacity built (GW) in each cost-optimal scenario from 2020 -
2050
2.0 Gt Carbon 3.0 Gt Carbon 3.5 Gt Carbon
Technology Budget Budget Budget
Wind 115.4 101.4 94.1
Solar PV 54.3 44.3 39.6
Solar CSP - - -
SSEG 17.4 17.4 17.4
Battery Storage 27.5 18.5 17.5
Pumped Storage 5.0 5.0 5.0
Hydro - - -
Biofuel 0.3 0.3 0.3
Gas – OCGT/GE 32.1 29.4 28.8
Gas – CCGT/GE 3.6 4.5 5.7
Nuclear - - -
Coal - - -
©Meridian Economics 2020 ׀43Current Policy Understanding Optimised Mitigation Realistic Mitigation
Modelling Approach Assumptions Least Cost Scenario Reality Check Policy Implications Conclusion
Reference Scenario Carbon Emissions Scenarios Scenarios
OPTIMAL LOW EMISSIONS ENERGY GENERATION
THE FUTURE IS RENEWABLES WITH AN INCREASED ROLE FOR STORAGE
• Wind and Solar PV generate by far most of the
energy into the future in all mitigation scenarios
• Although significant gas peaking capacity is built,
its primary role is to provide flexible reserve
capacity not energy. Gas makes a very small
contribution to the energy mix – between 1.5%
and 2.0% in the optimised mitigation scenarios
• Storage cost reductions into the future result in
increased battery usage in the latter part of the
period in scenarios with higher emission budgets.
Gas provides flexibility in the first 15 – 20 years.
• Paris-compliant scenarios exchange coal and gas
energy for increased RE and storage capacity at
little if any cost above the current policy scenario
©Meridian Economics 2020 ׀44Current Policy Understanding Optimised Mitigation Realistic Mitigation
Modelling Approach Assumptions Least Cost Scenario Reality Check Policy Implications Conclusion
Reference Scenario Carbon Emissions Scenarios Scenarios
WHAT HAPPENS TO THE COAL FLEET EMISSIONS?
COAL-FIRED UNITS ARE CLOSED EARLY OR OPERATED TO GENERATE LESS ENERGY OVER THEIR REMAINING LIFE
• Coal fired capacity is retired when it is economically efficient to do so given each scenario’s carbon constraint
– There is no requirement to continue running coal stations even if their design life has not been reached
• Although coal capacity closure is a favoured measure of mitigation success, our findings indicate emission mitigation
may be more optimally achieved by retaining coal capacity at minimum burn levels
– Keeping coal capacity on the system but running at much lower capacity factors (minimum 35%) provides system
stability/capacity while the RE is being built
– Determination of a reliably optimal station-level unit closure schedule is beyond the scope of our modelling due to
lack of granular information regarding the condition of units, the exact Capex and Opex requirements and
individual coal contract details
– Premature closure of coal plant in the South African context could result in a need for more gas fired power and
associated gas infrastructure resulting in a costly and high-emission future locked into long term gas
commitments.
• With each progressively tighter carbon constraint, energy generated from coal reduces.
©Meridian Economics 2020 ׀45Current Policy Understanding Optimised Mitigation Realistic Mitigation
Modelling Approach Assumptions Least Cost Scenario Reality Check Policy Implications Conclusion
Reference Scenario Carbon Emissions Scenarios Scenarios
THE TIGHTER THE CARBON CONSTRAINT, THE EARLIER COAL
GENERATION MUST BE REDUCED
THIS REQUIRES BUILDING SOLAR PV AND WIND BEFORE IT IS COST-OPTIMAL TO DO SO
• In the Least Cost Scenario there is a natural decline in energy generated from coal as the coal fleet ages and retires
• This means the bulk of energy generated from coal – and hence emissions - occurs in the first two decades of the
timeframe explored (i.e. 2020s and 2030s).
• Therefore, the opportunity for increasing carbon mitigation is in the short and medium term, when coal is a
substantial fraction of the mix, not later when it has already reduced.
• This implies rapid early RE build to replace coal generation in the short and medium term
• There are also realistic constraints on how much RE can be built in one year (considered in the next section)
• The following sequence of slides details the theoretically cost-optimal reduction of coal-generated power for the
least cost and increasingly ambitious mitigation scenarios.
©Meridian Economics 2020 ׀46Current Policy Understanding Optimised Mitigation Realistic Mitigation
Modelling Approach Assumptions Least Cost Scenario Reality Check Policy Implications Conclusion
Reference Scenario Carbon Emissions Scenarios Scenarios
COAL GENERATION IN LEAST COST SCENARIO
COAL FIRED POWER GENERATION IS SHOWN PER POWER PLANT
Least Cost Power System: Annual Energy Generation by Coal-fired Power Station
The opportunity for
mitigation is in the
short/medium term
Not the long term
©Meridian Economics 2020 ׀47Current Policy Understanding Optimised Mitigation Realistic Mitigation
Modelling Approach Assumptions Least Cost Scenario Reality Check Policy Implications Conclusion
Reference Scenario Carbon Emissions Scenarios Scenarios
3.5 GT SCENARIO
SIGNIFICANT COAL OFF CIRCA 2030
3.5 Gt Carbon Budget: Annual Energy Generation by Coal-fired Power Station
Early build of RE capacity
displaces coal generation
for all future years.
Is this early enough?
Can we install this fast?
©Meridian Economics 2020 ׀48Current Policy Understanding Optimised Mitigation Realistic Mitigation
Modelling Approach Assumptions Least Cost Scenario Reality Check Policy Implications Conclusion
Reference Scenario Carbon Emissions Scenarios Scenarios
3.0 GT SCENARIO
REQUIRES MORE COAL OFF IN THE 2020S
3.0 Gt Carbon Budget: Annual Energy Generation by Coal-fired Power Station
Reducing this coal
generation relies entirely
on pace and scale of RE
build programme
©Meridian Economics 2020 ׀49Current Policy Understanding Optimised Mitigation Realistic Mitigation
Modelling Approach Assumptions Least Cost Scenario Reality Check Policy Implications Conclusion
Reference Scenario Carbon Emissions Scenarios Scenarios
2.0 GT SCENARIO
COAL GENERATION MUST DECLINE PRECIPITOUSLY IMMEDIATELY
2.0 Gt Carbon Budget: Annual Energy Generation by Coal-fired Power Station
How fast can we build
new RE capacity?
©Meridian Economics 2020 ׀50Current Policy Understanding Optimised Mitigation Realistic Mitigation
Modelling Approach Assumptions Least Cost Scenario Reality Check Policy Implications Conclusion
Reference Scenario Carbon Emissions Scenarios Scenarios
REAL WORLD VS “MODEL-VILLE”
SHORTCOMINGS OF THE OPTIMISATION AND HOW TO ACCOUNT FOR THEM
• Theoretically optimal scenarios are important as they allow us to understand the relative differences in cost and
trends in the choice of new build technologies
• These scenarios have shown that a huge opportunity for cost-effective mitigation exists in the world of optimised
modelling. Do these scenarios exist in reality?
• We need to stress-test whether our findings are sustained when moving from optimal modelling to real world-
type scenarios
• To do this we consider two aspects of the real world not accounted for in the optimised modelling world:
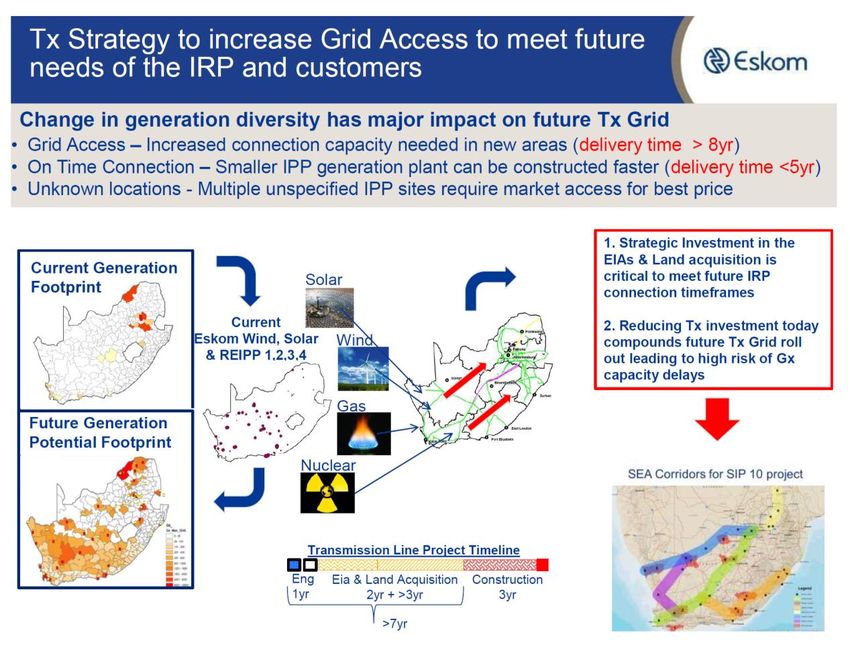
– The need for transmission (Tx) and distribution (Dx) grid infrastructure expansion to accommodate RE
– Practically achievable RE industry build levels over time
• The following slides describe these aspects and their likely impact on the RE build pathways in the Optimised
Mitigation Scenarios
©Meridian Economics 2020 ׀51You can also read