The impact of ship emissions on air quality and human health in the Gothenburg area - Part II: Scenarios for 2040
←
→
Page content transcription
If your browser does not render page correctly, please read the page content below
Atmos. Chem. Phys., 20, 10667–10686, 2020
https://doi.org/10.5194/acp-20-10667-2020
© Author(s) 2020. This work is distributed under
the Creative Commons Attribution 4.0 License.

The impact of ship emissions on air quality and human health in
the Gothenburg area – Part II: Scenarios for 2040
Martin O. P. Ramacher1 , Lin Tang2,3 , Jana Moldanová2 , Volker Matthias1 , Matthias Karl1 , Erik Fridell2 , and
Lasse Johansson4
1 Helmholtz-Zentrum  Geesthacht, 21502 Geesthacht, Germany
2 IVL, Swedish Environmental Research Institute, P.O. Box 53021, 40014 Gothenburg, Sweden
3 WSP Environment Sweden, P.O. Box 13033, 40251 Gothenburg, Sweden
4 Finnish Meteorological Institute, P.O. Box 503, 00101 Helsinki, Finland

Correspondence: Martin O. P. Ramacher (martin.ramacher@hzg.de)

Received: 2 April 2020 – Discussion started: 14 April 2020
Revised: 29 June 2020 – Accepted: 8 July 2020 – Published: 11 September 2020

Abstract. Shipping is an important source of air pollutants,        mately 30 % in simulated future scenarios; for NO2 the de-
from the global to the local scale. Ships emit substantial          crease was over 60 %. The simulated concentrations of O3
amounts of sulfur dioxides, nitrogen dioxides, and particu-         increased from the year 2012 to 2040 by about 20 %. In gen-
late matter in the vicinity of coasts, threatening the health       eral, the contributions of local shipping emissions in 2040
of the coastal population, especially in harbour cities. Re-        focus on the harbour area but to some extent also influence
ductions in emissions due to shipping have been targeted by         the rest of the city domain. The simulated impact of onshore
several regulations. Nevertheless, effects of these regulations     electricity implementation for shipping in 2040 shows reduc-
come into force with temporal delays, global ship traffic is        tions for NO2 in the port of up to 30 %, while increasing O3
expected to grow in the future, and other land-based anthro-        of up to 3 %. Implementation of onshore electricity for ships
pogenic emissions might decrease. Thus, it is necessary to          at berth leads to additional local reduction potentials of up to
investigate combined impacts to identify the impact of ship-        3 % for PM2.5 and 12 % for SO2 in the port area. All future
ping activities on air quality, population exposure, and health     scenarios show substantial decreases in population-weighted
effects in the future.                                              exposure and health-effect impacts.
   We investigated the future effect of shipping emissions
on air quality and related health effects considering differ-
ent scenarios of the development of shipping under current
regional trends of economic growth and already decided reg-         1   Introduction
ulations in the Gothenburg urban area in 2040. Additionally,
we investigated the impact of a large-scale implementation of       Shipping is an important source of air pollutants, from the
shore electricity in the Port of Gothenburg. For this purpose,      global to the local scale. Nearly 70 % of ship emissions oc-
we established a one-way nested chemistry transport mod-            cur within 400 km of coastlines (Corbett et al., 1999), caus-
elling (CTM) system from the global to the urban scale, to          ing air quality problems through emissions of sulfur diox-
calculate pollutant concentrations, population-weighted con-        ide (SO2 ), nitrogen dioxides (NOx ), and particulate matter
centrations, and health effects related to NO2 , PM2.5 , and O3 .   (PM). An increase in shipping activity in the North Sea and
   The simulated concentrations of NO2 and PM2.5 in future          the Baltic Sea has resulted in higher emissions of air pol-
scenarios for the year 2040 are in general very low with up         lutants and subsequently concentrations of pollutants in air,
to 4 ppb for NO2 and up to 3.5 µg m−3 PM2.5 in the urban            in particular of NOx , especially in and around several major
areas which are not close to the port area. From 2012 the           ports (Kalli et al., 2013). The high contribution of shipping
simulated overall exposure to PM2.5 decreased by approxi-           to emissions of sulfur and consequently to acid deposition
                                                                    and air pollution with particulate matter, mainly originating

Published by Copernicus Publications on behalf of the European Geosciences Union.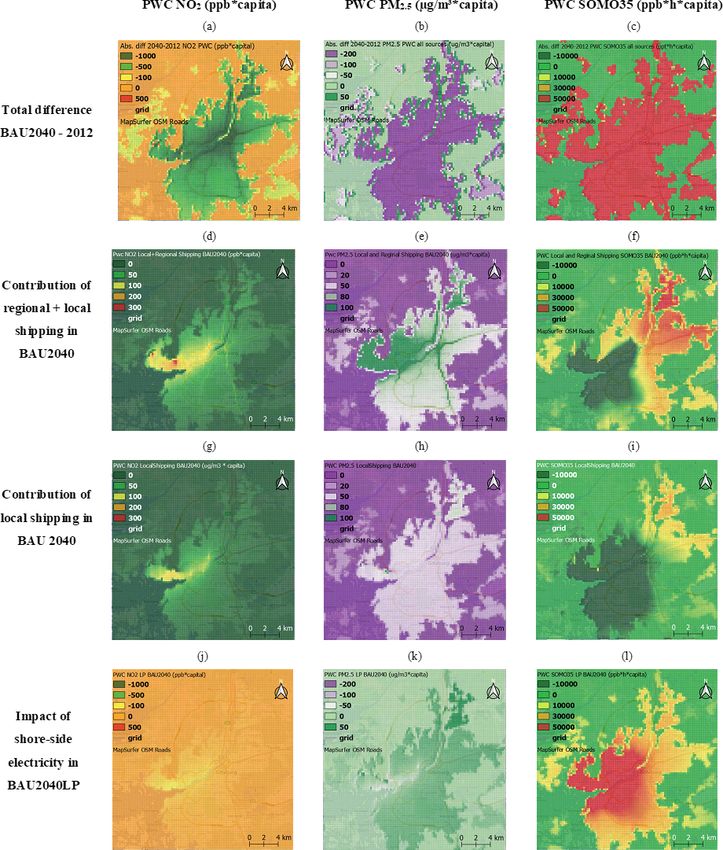
10668                                                                  M. O. P. Ramacher et al.: Part II: Scenarios for 2040

from the oxidation of the SO2 emissions, has been targeted         (particles with a diameter of less than 2.5 µm). The burden of
by the International Maritime Organization (IMO) by setting        PM2.5 over the Baltic Sea region is predicted to decrease by
limits on the maximum sulfur content of marine fuels (IMO,         35 %–37 % between 2012 and 2040 as a result of the regu-
2008). While on the global level a fuel sulfur content limit       lation of SOx and NOx emissions and due to energy savings
of 0.5 %, from previously 3.5 %, came into force on 1 Jan-         in shipping (Karl et al., 2019a). Importantly, the atmospheric
uary 2020, the Baltic Sea and the North Sea were declared          transformation of NOx emitted from shipping is also relevant
Sulfur Emission Control Areas (SECAs) in 2006, gradually           for ozone (O3 ) formation (Eyring et al., 2010). The introduc-
decreasing the fuel sulfur limit to 1.5, 1, and 0.1 % in 2006,     tion of a NECA is thus critical for reducing concentrations of
2010, and 2015, respectively (IMO, 2008). Additionally, a          NO2 , O3 , and PM2.5 at the same time.
fuel sulfur limit of 0.1 % applies for ships at berth in all Eu-      In this study we investigate impacts of shipping on urban
ropean harbours since 2010 (EU, 2005), and a limit of 1.5 %        air quality and the associated health of the population in sev-
applies for all passenger ships in regular line traffic in Euro-   eral future scenarios. We combine the development of emis-
pean waters outside the SECA (EU, 2012). To face the ris-          sions due to the implementation of the IMO rules on air pol-
ing NOx emissions, the IMO has designated the North Sea            lutants and energy efficiency with changes in traffic volumes,
and Baltic Sea NOx Emission Control Areas (NECAs) start-           fleet composition, and fuel types used. In addition, the impact
ing from 1 January 2021 onwards (IMO, 2017). The NECA              of a wide use of shoreside electricity by ships at berth is in-
regulation applies to all vessels built after 2021 and requires    vestigated. Only few studies considering impacts of shipping
approx. 80 % NOx emission reductions (IMO, 2014). Due to           in future scenarios specifically relevant for the Baltic Sea re-
the long lifetime of ships, it will take at least 30 years un-     gion can be found in the literature (Cofala et al., 2018; Karl
til the entire ship fleet is renewed, which means that NOx         et al., 2019b, 2019a; Jonson et al., 2019, 2015). However, the
emissions will only decrease gradually. In combination with        abatement measures considered as well as the methods used
the increasing ship traffic, which grows by roughly 2 % per        differ from our approach. The first part of our study (Tang
year, and the future foreseeable significant decrease in emis-     et al., 2020) gives a brief overview of previous studies about
sions from other anthropogenic sectors (e.g. traffic, heating),    the impacts of shipping emissions on air quality and health
the relative importance of NOx emissions from shipping for         on the Swedish west coast. It provides discussion on how
urban air quality will thus likely remain high.                    the legislation changed between the base year used in our
   To control emissions of greenhouse gases IMO has                study (2012) and the situation today. Also, different methods
adopted a package of technical measures including the En-          of health impact assessment used in these studies are briefly
ergy Efficiency Design Index (EEDI). The EEDI regulation           reviewed. In Tang et al. (2020) we discuss that shipping in
entered into force in 2013 and included requirements on min-       Gothenburg in 2012 was a significant source of air pollution,
imum mandatory energy efficiency performance levels, in-           contributing 35 % and 12.5 % to the annual exposure to NO2
creasing over time through different phases (IMO, 2011). In        and PM2.5 , respectively, and that the regional shipping out-
2018 IMO adopted a resolution on the “Initial IMO Strat-           side the city was responsible for 20 % and 10 % of the NO2
egy on reduction in GHG emissions from ships” stating the          and PM2.5 exposure, contributing more than the local ship-
objective to reduce the total annual greenhouse gas (GHG)          ping in and around the harbours. According to the study of
emissions from international shipping by at least 50 % by          Karl et al. (2019a), the introduction of the SECA with a fuel
2050 compared to 2008 (IMO, 2018). Reaching this objec-            sulfur limit of 0.1 % decreased the exposure to PM2.5 on the
tive implies both efficiency gains and an increased use of re-     Swedish west coast by approximately 35 %. This can be seen
newable fuels. There is still a great potential for efficiency     as the regional part of the shipping contribution because the
gains through better ship and engine design and through op-        maximum fuel sulfur content for ships at berth was limited
erational measures, mainly lower speeds. State of the art          to 0.1 % already in 2010. Sofiev et al. (2018) assessed the
ships can be almost 50 % more efficient than ships that are        impact of the currently introduced global 0.5 % fuel sulfur
10–20 years old. Biofuels, wind power, and electrification         content (FSC) limit on a global scale in terms of health ben-
could play an important part in closing the gap between the        efits and found that the introduction of the global 0.5 % FSC
potential of an improved engine design together with oper-         cap in 2020 leads to an avoidance of ∼ 2000 (5 % of cases
ational measures and the 50 % target for the entire sector,        due to shipping without the 0.5 % cap) premature deaths an-
which, on the other hand, is expected to continue to grow in       nually in Europe and ∼ 137 000 (38 % of cases) globally. The
terms of transported volume in the upcoming decades.               impact on the west coast of Sweden was, however, found to
   An important effect of the emission reductions in SOx and       be very small because the North and Baltic seas have been
NOx is the resulting reduction in atmospheric concentrations       SECAs with a maximum FSC of 0.1 % since 2015.
of PM, especially secondary particulate sulfate and nitrate.          Cofala et al. (2018) assessed impacts of the implementa-
Sofiev et al. (2018) have shown that the global limit on sul-      tion of emission control areas for SOx and NOx in all Euro-
fur content in ship fuels decreases concentrations of particu-     pean seas in several alternative scenarios studying the years
late sulfate by 2–4 µg m−3 in the vicinity of busy ship lanes      2030, 2040, and 2050 and also provided cost–benefit analy-
on a global scale, leading to significant reductions in PM2.5      ses for these different alternatives. Different options of emis-

Atmos. Chem. Phys., 20, 10667–10686, 2020                                          https://doi.org/10.5194/acp-20-10667-2020
M. O. P. Ramacher et al.: Part II: Scenarios for 2040 10669
sion control areas in southern Europe had very limited impact nated by a few large valleys in north–south and east–west
in northern Europe; the study, however, also considered two directions. The major air pollution sources in Gothenburg
different base scenarios, one of them including climate policy are above all road traffic and industry, wood burning, ship-
options for shipping. A comparison of the data supplement ping, agriculture, working machines, and long-range trans-
in Cofala et al. (2018) shows that the PM2.5 -related mor- port (LRT) from the European continent and other parts of
talities caused by shipping decreased in the “climate mea- Sweden. The harbour and shipping activities are important
sures” scenario compared to the “no-climate-measures” sce- emission sources and directly influence the urban air qual-
nario. The decrease was 0.8 % and 2 % (4 and 13 cases) in ity. The centre of the city is situated on the southern shore of
2030 and 2050, respectively, in Sweden and 1 % and 3.7 % the Göta älv. The Port of Gothenburg receives between 6000
(3000 and 12 000 cases) in all of Europe. Cofala et al. (2018) and 6500 calls per year and an additional 600–700 ships pass
also show the overall impact of shipping on the urban scale to and from ports upstream and on the Göta älv. The port
for the model grid cells including Mediterranean harbours. annually handles approximately 900 000 containers, 20×6 t
In the scenario without climate measures in 2030 the ship- of petroleum, and half a million roll-on/roll-off (RoRo) units
ping contributions to annual mean PM2.5 concentrations vary (Fridell et al., 2015). Passenger traffic in Gothenburg is also
from ∼ 0.2 to 2 µg m−3 , while an introduction of additional very busy with 1.5 million passengers who ferry to and from
SECA and NECA rules as in the North and Baltic seas has Gothenburg to Denmark, Germany, etc., on Stena Line fer-
the potential to avoid approximately 50 % of PM2.5 . In 2050 ries each year. This makes the port the largest cargo port in
the shipping contributions to PM2.5 were higher, with con- Scandinavia. Annual analyses of air quality monitoring data
centrations of up to 3 µg m−3 . The reduction potential of the by the Environmental Administration of City of Gothenburg
SECA plus NECA introduction is about 65 %. This is more show exceedances of both the target and the limit values for
than in 2030 because the NECA effects move forward at a NO2 at several stations in Gothenburg in 2012 with decreas-
slow pace. ing trends towards exceedances of only the limit value at traf-
The health benefit of cleaner ship fuels and other emission fic stations in 2019. For PM10 the levels were well below the
reduction techniques in densely populated harbour cities is limit value but exceeded the target value in 2012 without any
estimated to be much greater than on the open sea. In order significant trend towards the present with exception of the
to quantify the future impact of shipping, scenarios for trans- urban background, where a slightly decreasing trend was ob-
ported cargo volumes, composition of the fleet, and energy served and the annual mean was below the target value of
efficiency improvements need to be developed and put into 15 µg m−3 for the last 4 years. The measured concentration
perspective with probable emission reductions on land. levels of PM2.5 have been below the target value without any
The goal of the present study is to investigate the future significant trend at Gothenburg monitoring stations. Concen-
effect of shipping emissions on air quality and related health trations of ozone have a slightly increasing trend from the
effects considering the development of shipping under cur- year 2012 onwards and tend to exceed the limit values for
rent regional trends of economic growth and already decided maximum hourly and 8 h means on a number of occasions
regulations in the Gothenburg urban area in 2040. Addition- each year (Miljöförvaltningen, 2019).
ally, we investigate the impact of a large-scale implementa-
tion of shore electricity in the Port of Gothenburg. For this 2.2 Global- to urban-scale CTM system setup
purpose, we established a one-way nested chemistry trans-
port modelling (CTM) system from the global to the urban For the urban-scale, the prognostic meteorology dispersion
scale. This paper is the second part of a study about the cur- model TAPM (The Air Pollution Model; Hurley et al., 2005)
rent and future air quality situation in the Gothenburg urban was used as part of a one-way nested CTM system from the
area. Part 1 by Tang et al. (2020) is published in the same global to the urban scale (Fig. 2). TAPM has been success-
special issue. fully applied to investigate urban air quality and scenarios
in coastal urban areas all over the world (e.g. Matthaios et
al., 2018; Ramacher et al., 2020; Gallego et al., 2016; Fridell
2 Chemistry transport and health-effect modelling et al., 2014). TAPM consists of a meteorological component
and an air quality component. The meteorological compo-
2.1 The city of Gothenburg nent of TAPM is an incompressible, non-hydrostatic, prim-
itive equation model with a terrain-following vertical sigma
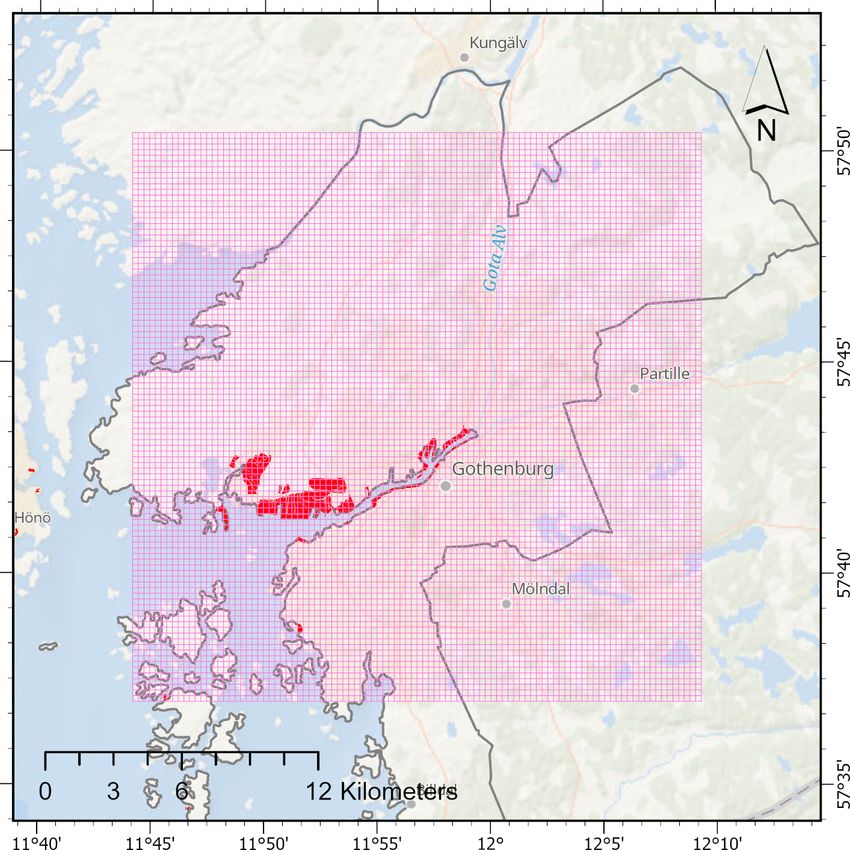
The city of Gothenburg (Fig. 1) is located on the western coordinate system for 3-D simulations. In the meteorological
coast of Sweden, with about 0.57 million inhabitants and an component, it is possible to assimilate wind observations to
area of 450 km2 . The dominant wind direction in Gothen- add a nudging term to the horizontal momentum equations.
burg is south-west with an average wind speed of 3.5 m s−1 , The air pollution component uses data from the meteorolog-
indicating the major transport path from the sea to the land, ical component and consists of three modules: first, the Eu-
especially in summer. The geomorphology of the Gothen- lerian grid module solves prognostic equations for mean and
burg area is described as a fissure valley landscape domi- variance of concentrations; second, the Lagrangian particle
https://doi.org/10.5194/acp-20-10667-2020 Atmos. Chem. Phys., 20, 10667–10686, 2020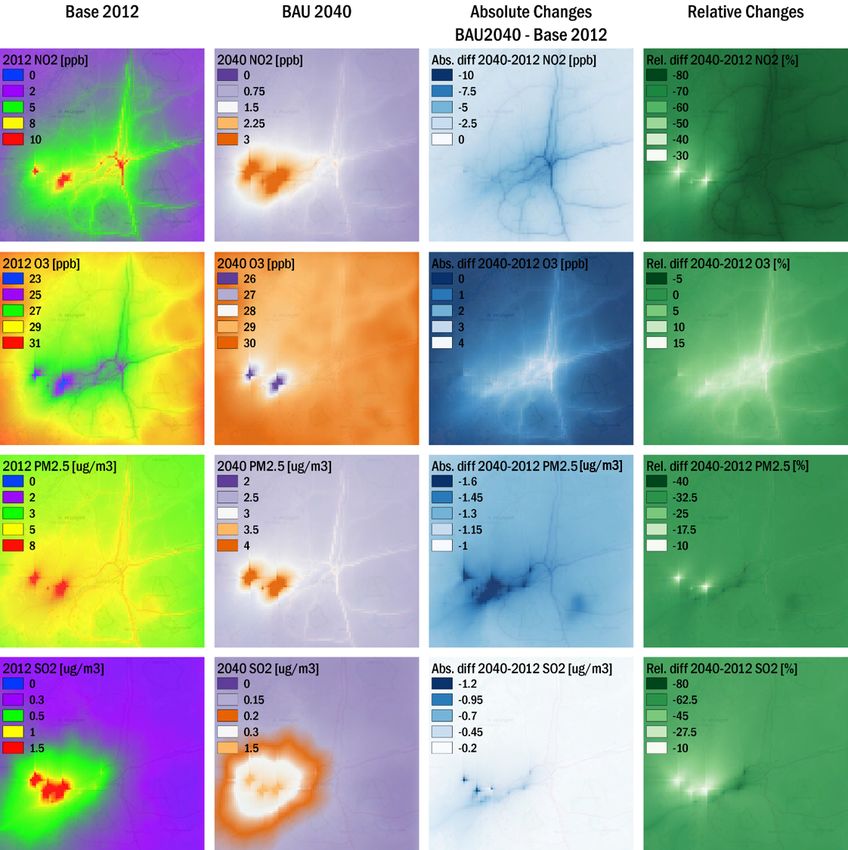
10670                                                                        M. O. P. Ramacher et al.: Part II: Scenarios for 2040

                                                                         Figure 2. Study design to calculate future concentrations, popula-
                                                                         tion exposure, and health effects.

                                                                         accounted for regional land-based emissions in 2012, repre-
                                                                         sented by hourly gridded emissions of NOX , sulfur oxides,
                                                                         carbon monoxide (CO), NH3 , PM2.5 , coarse PM, and non-
Figure 1. The Gothenburg research domain. The light red grid indi-       methane volatile organic compounds (NMVOCs) with the
cates the domain extent and the horizontal grid-cell size of 250 m.      Sparse Matrix Operator Kernel Emissions for Europe model
Red areas indicate port areas and grey lines indicates the city bound-   (SMOKE-EU; Bieser et al., 2011). Regional Shipping emis-
aries as given by the Copernicus Urban Atlas 2012 dataset. Maps          sions for the Baltic Sea and North Sea with high spatial
are created with ArcGIS with the underlying basemap sources Esri,        and temporal resolution were obtained from the Ship Traf-
HERE, Garmin, GEBCO, National Geographic, NOAA, and GIS
                                                                         fic Emission Assessment Model (STEAM; Jalkanen et al.,
User Community.
                                                                         2009; Jalkanen et al., 2012; Johansson et al., 2013). Fridell
                                                                         et al. (2015) also accounted for future emission conditions
                                                                         with future scenarios for land-based and shipping emissions
module can be used to represent near-source dispersion more
                                                                         in the Baltic Sea in 2040 which are consistent with the sce-
accurately; and third, the plume rise module is used to ac-
                                                                         narios used in this study. Details of the regional air quality
count for plume momentum and buoyancy effects for point
                                                                         simulation setup including shipping emissions, the evalua-
sources. The model also includes gas-phase reactions based
                                                                         tions of simulated pollutant concentrations in 2012, and re-
on a generic reaction set (Azzi et al., 1984) to represent the
                                                                         sults for the year 2040 scenarios in the Baltic Sea region are
basic photochemical cycle of NO2 , NO, and O3 , gas- and
                                                                         described in Karl et al. (2019a).
aqueous-phase chemical reactions for sulfur dioxide and par-
                                                                            These simulations are used to interpolate chemical bound-
ticles, and a dust mode for total suspended particles (PM2.5 ,
                                                                         ary conditions for TAPM. Concentrations simulated with
PM10 , PM20 , and PM30 ). Wet and dry deposition effects are
                                                                         CMAQ for the vertical model layer 7 with a mid-layer height
also included.
                                                                         of approximately 385 m above ground are used for this pur-
                                                                         pose. Since TAPM allows only one single boundary concen-
2.2.1   Boundary conditions
                                                                         tration value for the entire urban domain, these values are
For the Gothenburg urban area, we coupled TAPM offline to                calculated every hour using horizontal wind components on
regional CTM simulations with the Community Multi-scale                  each of the four lateral boundaries to give more weight to the
Air Quality (CMAQ) model v5.0.1 (Byun and Schere, 2006)                  concentrations upwind of the urban domain (Fridell et al.,
as performed by Karl et al. (2019a) for the Baltic Sea region            2014). CMAQ simulations with and without ship emissions
in 2012. Karl et al. (2019a) used global hemispheric pollu-              for 2012 and 2040 in the Baltic Sea and the North Sea were
tant concentrations from APTA global reanalysis (Sofiev et               used as boundary conditions in the respective TAPM simula-
al., 2018) to consider global chemical boundaries and ac-                tion runs with and without ship emissions for 2012 and 2040.
counted for meteorological conditions with meteorological                This procedure allows for an analysis of regional influences
fields calculated for the Consortium for Small-scale Mod-                on the Gothenburg area.
elling (COSMO) Climate Limited-area Modelling Commu-
nity (CLM) mesoscale meteorological model version 5.0
(Rockel et al., 2008) for the year 2012 using the ERA-Interim
reanalysis as forcing data (Geyer, 2014). Furthermore, they

Atmos. Chem. Phys., 20, 10667–10686, 2020                                                 https://doi.org/10.5194/acp-20-10667-2020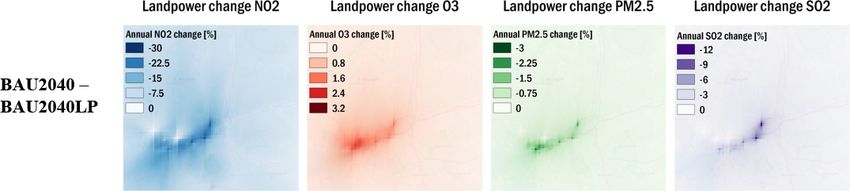
M. O. P. Ramacher et al.: Part II: Scenarios for 2040                                                                    10671

2.2.2   Meteorological fields                                     For the 10 biggest industrial sources, emission fluxes as-
                                                                  signed with coordinates and emission heights were obtained
The spatial resolution of the urban domain for the TAPM           from the Swedish Environmental Emission Data (SMED) for
air pollution component is 250 m × 250 m. With an extent          2012 and modelled as area sources in TAPM. The remain-
of 25 km × 25 km this domain covers the city of Gothenburg        ing sources, which are non-road activities, waste and sewage,
and the harbour area along the shores of the Göta river run-      domestic heating, energy production, combustion in industry
ning through the city. The urban domain for the TAPM air          for energy purposes, non-road working machinery, domes-
pollution component is nested in 30 km × 30 km (500 m hor-        tic aviation, and solvents from product use and agriculture,
izontal resolution) hourly meteorological fields taken from       are gathered from the SMED gridded inventory. They are
the innermost domain of nested simulations with the meteo-        geographically distributed on a 1 km × 1 km grid and mod-
rological component of TAPM. We chose a smaller domain            elled as gridded area sources. The land-based emission in-
for the TAPM air pollution component because of a higher          ventory created in this way takes into account all relevant
efficiency in computing time while having all important city      emission sources for SO2 , NOx , PM10 , PM2.5 , and volatile
features covered.                                                 organic compounds (VOCs) in 2012. For land-based emis-
   TAPM includes a nested approach for meteorology, which         sions in 2040, the 2012 emission inventory was scaled to
allows us to zoom-in to a local region of interest, while the     2040 conditions using source-specific approaches. The road
outer boundaries of the grid are driven by synoptic-scale         traffic emission inventory in 2040 uses detailed activity data
analyses. We applied the meteorological component with            for 2012 scaled with a traffic volume development scenario
four nested domains from a 480×480 km2 extent at the outer        in Sweden specific for light- and heavy-duty vehicles and
domain (D1) to a 30 × 30 km2 extent at the inner domain           busses (Transport administration, 2016, 2018). Combined
(D4). The outer domain (D1) was forced by ECMWF ERA5              with emission factors, which were calculated for the expected
synoptic meteorological reanalyses ensemble means with 30         Swedish car fleet in 2035 using the HBEFA v.3.2 database
vertical layers, and 0.3◦ × 0.3◦ horizontal and 3-hourly tem-     (the year 2040 was not available), a road traffic emission
poral resolution. Additionally, hourly local wind fields of       inventory for 2040 was calculated. The annual road traffic
four measurement stations (Femman, Gothenburg, Landvet-           emissions in 2040 are 265 t NOx yr−1 , 193 t VOC yr−1 , and
ter, Vinga) operated by the Swedish Meteorological and Hy-        141 t PM10 yr−1 and thus about 89 %, 62 %, and 12 % lower
drological Institute (SMHI) have been assimilated in the me-      than in 2012 in the Gothenburg area (Fig. 2).
teorological component to force the meteorological fields to         The area emissions, covering all emission sectors except
be closer to the measurements. Since this study focuses on        road traffic and shipping, are scaled from 2012 to 2040 with
the impact of changes in shipping emissions in 2040 and           factors which describe the change in Swedish emissions be-
not on meteorological effects, the 2040 simulations also use      tween 2010 and 2040. These factors were calculated with
2012 meteorological fields. Details on meteorological and         emissions obtained from the Greenhouse Gas – Air Pollu-
chemical component configurations in TAPM as well as air          tion Interactions and Synergies (GAINS) model using the
quality results and their evaluation for 2012 can be found        emission scenario ECLIPSE_V5a_CLE_base (Kiesewetter
in the accompanying paper by Tang et al. (2020). Based on         et al., 2014) and can be found in Supplement 1. The sce-
the temperature anomalies and precipitation anomalies for         nario emissions for the time period 2000–2040 were pro-
the decade 2004–2014 for the Baltic Proper, the year 2012         vided as national emissions for European countries, includ-
was chosen as the meteorological reference year for the CTM       ing Sweden, specified for GAINS emission sector cate-
simulations in Part I of the Gothenburg study as well as in re-   gories by Zbigniew Klimont, IIASA (personal communica-
gional studies for current (2012) and future (2040) conditions    tion, 3 March 2016). These categories were translated into
and shipping scenarios (Karl et al., 2019b; Tang et al., 2020).   the emission categories of Swedish Environmental Emis-
                                                                  sion Data (SMED), and the 2040/2010 factors were applied
2.2.3   Current and future land-based emission                    to the 2012 area emission sectors to derive a land-based
        inventories                                               emissions scenario for 2040 (CLE2040). The year 2012 is
                                                                  not available for ECLIPSE_V5a_CLE_base, but the change
A bottom–up emission inventory for the Gothenburg urban           between 2010 and 2012 is small on the 30-year horizon.
area has been created to account for road traffic, indus-         Based on these factors, the annual industrial emissions in
trial processes, and other sources of land-based emissions in     2040 are 468 t NOx yr−1 , 9958 t VOC yr−1 , 85 t PM10 yr−1 ,
2012. The road traffic emissions are calculated with traffic      and 189 t SO2 yr−1 and thus about 19 % lower, 45 % higher,
activity data from the database of the Environmental Admin-       7 % lower, and 2 % lower than in 2012 in the Gothenburg
istration, City of Gothenburg (Miljöförvatningen), and a set      area (Fig. 2). The reason for an increase in VOC emissions
of emission factors for the Swedish road vehicle fleet in 2035    in the future is a scaling factor of 1.45 for the sector “Com-
(latest year available) by HBEFA v. 3.2 (Hand Book of Emis-       bustion in industry for energy purposes”, which 6 out of 10
sion Factors for Road Transport; Keller et al., 2017). The        industrial sources in the Gothenburg area belong to. As part
traffic sources are treated as line emission sources in TAPM.     of the CTM chain, the treatment of area emissions for the ur-

https://doi.org/10.5194/acp-20-10667-2020                                       Atmos. Chem. Phys., 20, 10667–10686, 2020
10672 M. O. P. Ramacher et al.: Part II: Scenarios for 2040
ban area of Gothenburg is consistent with the method used The exposure calculation was based on the concentration
in the regional-scale CMAQ simulations. Thus, the bound- fields of PM2.5 , O3 , and NO2 calculated for the examined
ary conditions in the local TAPM runs were taken from cor- future scenarios by the modelling system described above.
responding regional-scale simulations of the CMAQ model Annual means and SOMO35 were calculated from hourly
with consistently derived emissions for 2012 and 2040 (Karl ozone concentration fields. Population data at a 1 km × 1 km
et al., 2019a). resolution were obtained from Statistics Sweden (SCB) for
2015, with a population of 572 779 in the city of Gothen-
burg, and used for calculating the population-weighted av-
2.3 Exposure and health impact assessment
erage concentrations (PWCs) for the model domain in 2012
(Tang et al., 2020). For the 2040 scenarios the PWCs were
The impacts of exposure to air pollutants on the health of calculated using the same population data for 2015 since a
people living in the Gothenburg region were assessed with geographically resolved prognosis for 2040 was not avail-
the ALPHA-RiskPoll model (ARP; Holland et al., 2013), able. In ARP the PWCs are applied to the population statis-
which calculates a wide range of air-pollutant-specific health tics for Sweden for the year 2040 and scaled to the population
effects in the assessed year. The RAINS methodology, which of Gothenburg with the help of the year 2012 “Gothenburg
calculates years of life lost over the expected lifetime of a population”/“total Swedish population” ratio. This approach
population (Amman et al., 2004), has been used as well to neglects any potential trend of increase in urbanization in the
enable a comparison with other studies. Both methods are country, which would lead to higher impacts than calculated
based on national population statistics for European coun- with our approach.
tries and on a forecast of the age distribution of the pop- With the introduced study design, it is possible to estimate
ulation, as well as mortality and morbidity data for 2040. the impact of shipping-related air pollution on the health of
In addition, effect-specific dose–response relationships are citizens in the Gothenburg area regarding current and future
taken into account. In the case of the RAINS methodology emission scenarios and to identify the effectiveness of sev-
only all-cause mortality from PM2.5 exposure has been con- eral air pollution abatement measures. For this purpose, it is
sidered. In the ARP analysis, impacts of exposure to PM2.5 , necessary to create a set of scenarios with emphasis on ship-
ozone, and NO2 have been considered (Heroux et al., 2013). ping activities in the future, translate them into emission in-
Only the most serious impacts, i.e. losses of lives, are pre- ventories, and simulate the health effects with the introduced
sented, taking into account impacts of chronic exposure to CTM–exposure–health-effect modelling system.
PM2.5 , short-term exposure to ozone, and short-term expo-
sure to NO2 , i.e. the impacts marked A* in the HRAPIE
(Health risks of air pollution in Europe) study (Heroux et 3 Current and future shipping emissions scenarios
al., 2013). For ozone, the indicator SOMO35 is used, stand-
ing for the annual sum of the daily maximum of the 8 h mean 3.1 Ship emission inventories for the Gothenburg area
ozone concentrations above a threshold of 35 ppb. The health
impacts of some pollutants are correlated, and that is why the A shipping emission inventory for the area of Gothenburg
premature deaths attributed to each pollutant cannot simply with high temporal and spatial resolution was calculated with
be added up. The concentration-response functions (CRFs) STEAM for the year 2012, representing the present situa-
for all-cause mortality used in ARP are those from the WHO tion (Tang et al., 2020) and giving a baseline to be compared
(Heroux et al., 2013): 6.2 % (95 % confidence interval 4.0 %– with future scenarios. In STEAM, position data of individual
8.3 %) relative risk increase per 10 µg m−3 increased expo- ships taken from reports from the Automatic Identification
sure for the long-term PM2.5 exposure, 0.29 % (95 % con- System (AIS) is used to model fuel consumption and emis-
fidence interval 0.14 %–0.43 %) relative risk increase per sions as a function of vessel activity, engine, and fuel type.
10 µg m−3 increased exposure for the short-term ozone expo- The calculation of ship emission inventories for the Gothen-
sure, and 0.27 % (95 % confidence interval 0.16 %–0.38 %) burg area follows the approach that has been applied for the
relative risk increase per 10 µg m−3 increased exposure for North and Baltic Sea region and which is described in Karl et
the short-term NO2 exposure. The RAINS methodology uses al. (2019a). The emission inventory in this work is therefore
5.8 % relative risk increase per 10 µg m−3 increased exposure consistent with the one in Karl et al. (2019a). Nevertheless,
to PM2.5 . The health impacts of some pollutants are corre- the regional shipping emission inventory contains hourly up-
lated, and that is why the premature deaths attributed to each dated emission data on a 2 km × 2 km grid, while the local
pollutant cannot simply be added up. In particular, it has been emission inventory comes with a resolution of 250 m×250 m
estimated that adding premature deaths attributed to PM2.5 for the local research domain. The ship emissions in the
to those attributed to NO2 could result in double counting Gothenburg area include combustion emissions from all ship
of around 30 % (Heroux et al., 2013). More details on the engines (boilers, auxiliary, and main engines) for the com-
methodology can be found in Part 1 of these papers (Tang et pounds NOx , SOx , CO, CO2 , NMHC, and PM. Tang et
al., 2020). al. (2020) used STEAM shipping emission inventory in the
Atmos. Chem. Phys., 20, 10667–10686, 2020 https://doi.org/10.5194/acp-20-10667-2020M. O. P. Ramacher et al.: Part II: Scenarios for 2040 10673
Gothenburg area and applied it in the presented global-to- 2013) (still not achieving the IMO 2018 Initial Strat-
local CTM system to identify the impact of shipping on urban egy to reduce CO2 emissions by 50 % relative to 2008
air quality in the year 2012. In 2012, the local ship emissions by the year 2050);
in Gothenburg hold with 308 t SO2 yr−1 , 2089 t NOx yr−1 ,
91 t PM10 yr−1 , and 23 t VOC yr−1 for about 60 % of SO2 , – BAU2040LP – BAU2040 with additional implementa-
40 % of NOx , 25 % of PM10 , and 1 % of VOC, respectively, tion of shoreside electricity;
to the total emission situation (Fig. 3). Thus, shipping emis-
sions are a major contributor to the urban air quality in – EEDI2040 – as BAU2040, but fuel efficiency just fol-
Gothenburg in 2012. lows the Energy Efficiency Design Index regulation of
the IMO;
3.2 Future scenarios for shipping emissions
– EEDI2040LP – EEDI2040 with additional implementa-
The scenarios used in this work describe future developments tion of shoreside electricity.
of policy and technology regarding energy efficiency and ex-
haust gas emissions from ships in the North and Baltic Sea 3.2.1 Future reference scenario BAU2040
region as well as in the Port of Gothenburg all taking the fol-
lowing into account: The BAU2040 scenario is based on current trends in shipping
and takes into account already decided policy measures (Ta-
– the development of ship traffic and transport volumes, ble 1). This represents a conservative development of ship-
ping in line with the Shared Socioeconomic Pathway (SSP)
– fleet development of different ship types,
II “Middle of the Road” scenario (Zandersen et al., 2019),
– changes in fuel mixture, which is developed for the climate community and adapted
for shipping in the Baltic Sea. The trends in shipping were
– the use of abatement measures and other technologies analysed from AIS data from recent years and combined with
that influence emissions from shipping, an analysis of the different shipping sectors to obtain the de-
velopment regarding transport work, ship size, ship speed,
– regulations influencing emissions and fuel consump-
and number of ships for different ship types as done for the
tion,
regional scale by Karl et al. (2019a). In combination with as-
– possible local port actions in Gothenburg, e.g. the use of sumptions on ship age distribution and upcoming regulations
shoreside electricity for ships at berth. (Fridell et al., 2015), this allows for the calculation of emis-
sions to air. The following regulations affecting emissions to
The scenarios were created in the BONUS SHEBA (Sus- air were applied in BAU2040 (Table 1).
tainable Shipping and Environment of the Baltic Sea Re-
gion) project and are based on literature reviews and expert 1. Sulfur regulation: the Baltic and North seas are SE-
and stakeholder consultations to assess shipping in the future CAs, where the maximum allowed sulfur content in ma-
within different developments (Fridell et al., 2015; Karl et al., rine fuel was lowered from 1 % to 0.1 % in 2015. For
2019a). The ship traffic volumes are expected to continue to sea areas outside SECAs the maximum fuel sulfur con-
grow with about 1 % per year on average (it varies with ship tent is 0.5 % from 2020 onwards. For ships berthing in
type); the current trend of using larger vessels is expected EU ports the maximum allowed fuel sulfur content is
to continue as well (Kalli et al. (2013). The trends in cargo 0.1 %; these regulations directly influence the emissions
volumes, passenger numbers, and ship sizes are described in of SOX and have a strong impact on the PM emissions.
detail in Fridell et al. (2015) and translated to emission sce- These regulations are also applied in the EEDI2040 sce-
narios in Karl et al. (2019). The overall goal was to investi- narios.
gate changes in impacts of shipping on the marine and ter-
restrial environment as well as on human health in the Baltic 2. NOx regulation: NOx emissions from marine engines
Sea region. The scenario results have been used to assess have been regulated with Tier I for new ships since 2000
urban-scale impacts on air quality and human health in the and Tier II since 2011. Tier III is applied in NOx Emis-
Gothenburg area and several other Baltic Sea harbour cities sion Control Areas for new ships operating in the Baltic
(Ramacher et al., 2019). In this work shipping in the urban and North seas from 2021. These regulations are also
area of Gothenburg in the future is modelled in four scenarios applied in the EEDI2040 scenarios.
for 2040:
3. Energy efficiency: the regulation by IMO regarding the
– BAU2040 – business as usual 2040, this scenario is the EEDI (IMO, 2018) requires new ships to become gradu-
future reference scenario including all currently adopted ally more fuel-efficient. The improvements in energy ef-
regulations including climate measures with high en- ficiency, fuel use reductions and emissions are assumed
ergy improvements in energy efficiency (Kalli et al., to be proportional.
https://doi.org/10.5194/acp-20-10667-2020 Atmos. Chem. Phys., 20, 10667–10686, 202010674 M. O. P. Ramacher et al.: Part II: Scenarios for 2040 Figure 3. Present-day and future 2040BAU scenario emission inventories for the local CTM simulation in Gothenburg. The BAU2040 scenario assumes a share of ships driven by in 2012 were a major contributor to the overall air pollu- liquefied natural gas (LNG) of about 10 % in the ship fleet tion (Fig. 3), in 2040 the relevance of shipping emissions in 2040. This is modelled as a fraction of new ships intro- decreases in comparison to industry, road traffic, and other duced each year that will use LNG since retrofitting of exist- sources to 19 % for NOx , 1 % for VOC, and 2 % for PM10 ing ships from fuel oil to LNG is assumed less likely due to and SO2 . high costs. Since LNG is used as a means to comply with the sulfur and NOx regulations, ship types that operate mainly within SECAs are modelled as being more likely to use LNG. 3.2.2 Future scenario EEDI2040 The BAU2040 scenario also assumes that on average 20 % of the ships in the Baltic Sea use scrubbers. This measure, how- As the scenario work revealed that energy effectivization has ever, does not affect emissions to air in our study since the large impact on emissions in the target year, encompassing scrubbers are required to reach SOX emissions equivalent at the same time great uncertainty, we have chosen to include to using magnesium oxide (MGO) and that the PM emis- an alternative scenario with a different effectivization level. sions are similar as for MGO (Fridell and Salo, 2016). The In the EEDI2040 scenario, improvements in fuel efficiency energy efficiency for new ships in BAU2040 is assumed to strictly follow the requirements of the EEDI regulation of improve further than what is required from the EEDI regu- the International Maritime Organization. Annual efficiency lation, following recent trends and assumptions from Kalli increases of 0.65 % to 1.04 %, depending on ship type, are et al. (2013), assuming annual efficiency increases of 1.3 % assumed in the EEDI2040 scenario, while the corresponding to 2.25 %, depending on ship type (corresponding efficiency values in the BAU2040 scenario are 1.3 % to 2.25 %. From increase values required by the IMO EEDI regulation are the difference between BAU2040 and EEDI2040, the effect 0.65 % to 1.04 %), which significantly reduces shipping fuel of the higher fuel efficiency increase than required by the consumption. EEDI regulation can be deduced. Based on these assumptions scaling factors for 2040/2012 Based on these assumptions, scaling factors have been were calculated by applying fleet development, fuel mix, calculated in the same manner as for the BAU2040 sce- abatement technology implementation, and improvements in nario and applied to the 2012 shipping emissions inventory. energy efficiency trends to fleet composition in the Gothen- Compared to the present situation in 2012, the annual ship- burg area calculated with STEAM for the year 2012. These ping emissions in EEDI2040 are decreased to 666 t NOx yr−1 have been applied to the 2012 gridded shipping emissions in- (−68 %), 22 t VOC yr−1 (−2 %), 19 t PM10 yr−1 (−79 %), ventory to calculate the BAU2040 emission scenario. Com- and 38 t SO2 yr−1 (−88 %) (Fig. 4). In comparison to 2012, pared to the present situation in 2012, the annual ship- the relevance of shipping emissions in the EEDI2040 sce- ping emissions in BAU2040 are decreased to 466 t NOx yr−1 nario decreases in comparison to industry, road traffic, and (−78 %), 23 t VOC yr−1 (−31 %), 91 t PM10 yr−1 (−85 %), other sources to 26 % for NOx , 1 % for VOC, and 3 % for 27 t SO2 yr−1 (−91 %) (Fig. 4). While the shipping emissions PM10 and SO2 . Atmos. Chem. Phys., 20, 10667–10686, 2020 https://doi.org/10.5194/acp-20-10667-2020
M. O. P. Ramacher et al.: Part II: Scenarios for 2040                                                                            10675

Table 1. Major regulation changes for the different scenarios.

                                                           FSC in    NOx                  NOx
                              FSC in       FSC in      Gothenburg    regulation           regulation in
            Scenario           global   SECA area            area    in NECA              Gothenburg area     LNG    Scrubbers
            2012 reference     3.5 %          1.0 %          0.1 %   Tier II standard     Tier II standard       –          –
            2040 scenarios     0.5 %          0.1 %          0.1 %   Tier III standard    Tier III standard   10 %       20 %

3.2.3    Future shoreside electricity scenarios –
         BAU2040LP and EEDI2040LP

In addition to regional developments and regulations, which
are reflected in the BAU2040 and EEDI2040 scenarios,
large-scale implementation of shoreside electricity (or land
power, LP) in the Port of Gothenburg was studied in both
scenarios. Concerns about air quality in port cities as well as
policies on greenhouse gas emissions have led to measures
aimed at reducing the use of auxiliary engines by ships at
berth and thereby reducing emissions of air pollutants and
greenhouse gases as well as noise through the use of shore-
side electricity.                                                      Figure 4. Annual shipping emissions of NOx , VOC, PM10 , and
   A gridded emission inventory with large-scale shore-                SO2 for the local CTM simulation in Gothenburg for 2012,
side electricity use in 2040 was calculated with STEAM                 BAU2040, and BAU2040LP emissions scenarios.
in the following way: all RoRo, RoPax, and cruise ships
and 50 % of all other ships use shoreside electricity. Scal-
ing factors have been calculated in the same way as for                  2. the impact of local shipping activities in 2040 in two
the future scenarios BAU2040 and EEDI2040, except that                      different scenarios, and
emission from ships at berth were reduced as described.
These factors were then applied in the gridded emis-
                                                                         3. the additional impact of local port measures (shoreside
sion inventories, resulting in 165 t NOx yr−1 , 5 t VOC yr−1 ,
                                                                            electricity) in scenarios for 2040.
5 t PM10 yr−1 , and 17 t SO2 yr−1 emissions in Gothenburg in
the BAU2040LP scenario (Fig. 4). The EEDI2040LP annual
                                                                       Moreover, simulations for all months in 2012 have been per-
shipping emissions result in 234 t NOx yr−1 , 7 t VOC yr−1 ,
                                                                       formed as described in Tang et al. (2020). The meteorological
7 t PM10 yr−1 , and 24 t SO2 yr−1 . Compared to the BAU2040
                                                                       conditions were held constant for all regional and local CTM
and EEDI2040 scenario, the annual emissions in both the
                                                                       runs as our focus is on the impact of changing emissions.
BAU2040LP and EEDI2040LP scenario are 65 % lower for
                                                                       The regional boundary conditions applied to the local-scale
NOx , 68 % lower for VOC, 62 % lower for PM10 , and 37 %
                                                                       TAPM simulations for the BAU2040LP and EEDI2040LP
lower for SO2 . While the shipping emissions in 2012 have
                                                                       were taken from regional CTM simulations with BAU2040
been a major contributor to the overall air pollution (Fig. 3),
                                                                       and EEDI2040 emissions including shipping emissions (Ta-
in 2040 the relevance of shipping emissions decreases in
                                                                       ble 2). By using the local land-based emissions in line with
comparison to industry, road traffic, and other sources to
                                                                       the regional land-based emissions and varying the local ship-
19 % for NOx , 1 % for VOC, and 2 % for PM10 and SO2
                                                                       ping emissions, this scenario setup allows for the assessment
in the BAU2040LP scenario.
                                                                       of local shipping impacts in different local scenarios. To de-
                                                                       rive the contribution of ships to the selected pollutant con-
3.3     Scenario setup                                                 centrations, two model runs for each scenario – one including
                                                                       and one excluding local shipping emissions in TAPM simu-
The introduced land-based (CLE2040) and shipping                       lations – were performed. The difference is regarded as the
(BAU2040, BAU2040LP, EEDI2040, and EEDI2040LP)                         contribution of ships to the individual pollutant. For the sce-
emission inventories for 2040 have been applied in the                 narios, the difference between two model runs with different
established global-to-local CTM system to identify                     shipping emissions is regarded as the change in the contribu-
                                                                       tion of ships between the respective scenarios. In the discus-
  1. the impact on air quality in Gothenburg through a                 sion of the results, the BAU2040 scenario will be discussed
     change in total emissions from 2012 to 2040,                      as the future reference scenario. Consequently, we will show

https://doi.org/10.5194/acp-20-10667-2020                                                Atmos. Chem. Phys., 20, 10667–10686, 2020
10676 M. O. P. Ramacher et al.: Part II: Scenarios for 2040
results for the BAU2040 scenario in the main paper, while part of the city in 2012, on one side, and the high reduction
results for EEDI2040 are available in Supplement 3. in road traffic emissions and a high density of highways and
road traffic in the eastern part of the Gothenburg domain, on
the other side. The port area, which is located westward of the
4 Future impact of shipping on concentrations of centre, shows a comparably high reduction potential with up
pollutants to 70 %. The nearby industrial sources might hide reductions
in NO2 from other sources due to their high absolute contri-
BAU2040 serves as a reference scenario all other scenarios butions and relatively low reduction from 2012 to BAU2040.
are compared to. It was first compared to the present-day air When it comes to changes in O3 concentrations, there is an
quality situation in 2012, which is discussed in detail in the increase in the city centre by up to 15 % (about 4 ppb) from
accompanying paper by Tang et al. (2020). Ship activities in 2012 to BAU2040, especially near major roads. This contrary
Gothenburg 2012 contribute to peak values, in particularly in trend follows the principles of ground-level ozone formation,
the north of the city port and the river Göta due to the domi- which is produced in photochemical reaction cycles involv-
nant SW wind. The local shipping contribution to NO2 con- ing the precursors NOx and VOCs. The ozone–precursor re-
centrations in Gothenburg was about 14 % (around 0.5 ppb) lationship in urban environments is a consequence of the fun-
to the annual mean averaged over the entire model domain. damental division into an NOx -sensitive and a VOC-sensitive
These contributions were higher in summer due to higher regime (Sillman, 1999). VOC-sensitive regimes in dense ur-
ship activities. Emissions of NOx from ships added up with ban areas with many emission sources lead to higher O3 with
land-based NOx emissions and enhanced the local ozone increasing VOC and lower O3 with increasing NOx (Karl et
loss by NO titration. The negative effect of NOx emissions al., 2019a). Therefore, the contribution of local ship emis-
from local shipping on O3 concentrations in summer was sions with ozone precursors NOx and VOCs can selectively
−2 % (around −0.5 ppb) on average. For PM2.5 , the local be very significant, in terms of both increasing the O3 levels
ship emissions contributed about 2 % (around 0.07 µg m−3 ) in urban areas and decreasing them in the outskirts. Figure 5
to the annual mean, while the annual average SO2 concentra- shows that both the absolute and the relative change in impact
tions from local shipping were the major contributor to local of shipping activities between 2012 and BAU2040 becomes
SO2 emissions with 0.2–0.5 ppb along major shipping lanes. more visible for O3 than for NO2 in the western parts of the
In the following, maps illustrating changes in annually aver- city, due to the higher ozone formation in the absence of NOx
aged concentrations of NO2 , O3 , PM2.5 , and SO2 are shown sources in the BAU2040 scenario.
for the total change in ambient air concentrations from 2012 For PM2.5 and SO2 the high impact of some industrial
to 2040BAU (Fig. 5), the impact of change in shipping emis- sources in the west of Gothenburg is even more visible.
sions from 2012 to BAU2040 on shipping contribution to While in 2012 the average PM2.5 concentrations peak at
ambient concentrations of these air pollutants (Fig. 6), and 53 µg m−3 in the vicinity of the largest point sources, in
impact of a large-scale introduction of shoreside electricity BAU2040 they peak at 48 µg m−3 . The domain-averaged
in the BAU2040LP and EEDI2040LP scenarios on the con- PM2.5 concentrations are much lower with 4 µg m−3 in 2012
tribution of shipping compared to BAU2040 and EEDI2040, and 2.7 µg m−3 in BAU2040; thus they are reduced by 33 %
respectively (Fig. 7 for BAU2040 results; Supplement 3 for on average. Slightly higher reductions close to roads are
EEDI2040 results). Seasonal plots for summer and winter caused by lower PM2.5 road traffic emissions. Reductions in
months can be found in Supplements 2 and 3. the northeast of the urban area of Gothenburg are probably
due to less secondary particle formation. This pattern also
4.1 Air quality changes in 2040 compared to the holds true for SO2 . There is an absolute reduction potential
present day for SO2 of up to 1 µg m−3 and a relative reduction poten-
tial of up to 75 % in the port area, following shipping routes.
The local concentration of NO2 , given as an annual average Nevertheless, the characteristic industrial point sources bear
over the model domain, decreased by 74 % (around 2.8 ppb) the highest absolute SO2 reductions and therefore partly di-
from about 3.7 ppb in 2012 to 0.9 ppb in the future reference minish the relative SO2 reduction potential in the port area of
scenario BAU2040. The highest changes in NO2 are located Gothenburg.
in the centre of Gothenburg with an average NO2 reduction In total, the air quality situation with respect to NO2 ,
of up to 80 % (and 8 ppb) next to major roads. Besides the PM2.5 , and SO2 is clearly improving in the urban area of
high reductions due to road traffic, a reduction in NO2 con- Gothenburg in the BAU2040 scenario. However, the large
centration due to the reduction in emissions from industrial industrial point sources, such as three refineries (Preem
sources is visible in the western part of the Gothenburg do- Gothenburg, St1 Refinery AB, Nynäs Gothenburg), are iden-
main with reductions of up to 7 ppb (∼ 30 %). The smaller tified as large contributors to spatially selective high concen-
relative reduction in industrial areas is due to the compara- trations of NO2 , PM2.5 , and SO2 and still contain a high re-
tively low change in industrial NO2 emissions and their al- duction potential compared to all other sources of air pol-
ready high contribution to NO2 concentration in the western lution in the urban area of Gothenburg. When it comes to
Atmos. Chem. Phys., 20, 10667–10686, 2020 https://doi.org/10.5194/acp-20-10667-2020M. O. P. Ramacher et al.: Part II: Scenarios for 2040 10677
Table 2. Meteorology, regional boundary conditions, and emissions setup for the calculated scenarios.
Scenario Meteorology Reg. boundary Local emissions
Land based Shipping
2012 Reference 2012 2012 (incl. shipping) 2012 2012
BAU2040 2012 BAU2040 (incl. shipping) CLE2040 BAU2040
BAU2040LP 2012 BAU2040 (incl. shipping) CLE2040 BAU2040LP
EEDI2040 2012 EEDI2040 (incl. shipping) CLE2040 EEDI2040
EEDI2040LP 2012 EEDI2040 (incl. shipping) CLE2040 EEDI2040LP
Figure 5. The total modelled present-day concentration for NO2 , O3 , PM2.5 , and SO2 (column 1), as well as the concentration in BAU2040
(column 2) and the difference between the present day and BAU2040 in absolute (column 3) and relative (column 4) values. ©OpenStreetMap
contributors 2019. Distributed under a Creative Commons BY-SA License.
ozone there is an average increase of up to 1 ppb in sum- pollution in Gothenburg in the BAU2040 scenario show high
mer, probably due to a lower background concentration and reductions relative to the year 2012 for all pollutants un-
consequently less ozone titration by the lower NOx emission der investigation except of O3 , which is slightly increasing
in 2040. (Fig. 6). Higher absolute and relative contributions of lo-
cal shipping are detected in and around the port area, while
4.2 Influence of ship emissions in the future scenarios: there are some minor impacts in the northern urban area of
BAU Gothenburg due to predominant winds from the southwest.
This general pattern also holds true for the EEDI2040 sce-
The modelled contributions of local shipping to atmospheric nario. The maximum value for the contribution to annual
concentrations and relative contributions to the overall air
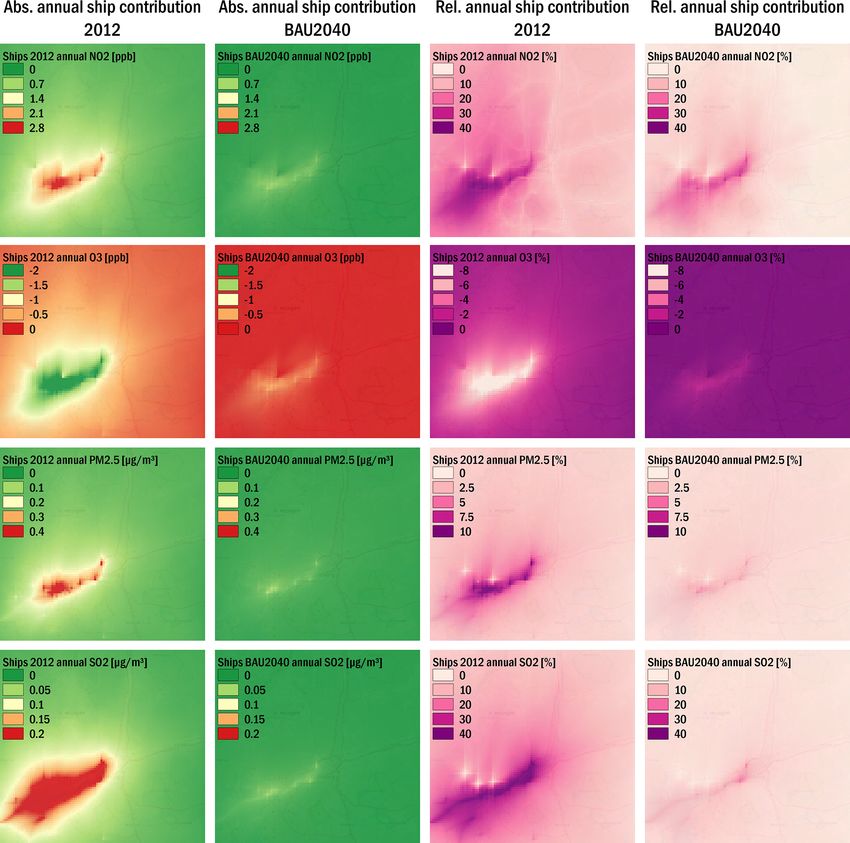
https://doi.org/10.5194/acp-20-10667-2020 Atmos. Chem. Phys., 20, 10667–10686, 202010678 M. O. P. Ramacher et al.: Part II: Scenarios for 2040 Figure 6. Absolute contributions of local ship emissions to annual mean concentration levels in Gothenburg in 2012 (column 1) and BAU2040 (column 2), as well as the relative contributions (columns 3 and 4). ©OpenStreetMap contributors 2019. Distributed under a Creative Com- mons BY-SA License. Figure 7. Relative changes in annual mean NO2 , PM2.5 , and O3 concentrations for BAU2040LP compared to 2040BAU scenario. © Open- StreetMap contributors 2019. Distributed under a Creative Commons BY-SA License. mean NO2 concentrations in BAU2040 merely reaches 1 ppb port area of Gothenburg is up to 25 % in BAU2040 and up in the port area and is about 80 % lower compared to a maxi- to 45 % in EEDI2040. In 2012, NO2 concentrations due to mum of 4.1 ppb in 2012. In the EEDI2040 scenario the maxi- shipping are involved as a precursor in the photochemical mum ship contribution to NO2 is slightly higher with 1.4 ppb. reaction-cycle of O3 formation and form a depletion pattern The relative contribution of shipping given as annual aver- around the harbour area with up to −4 ppb O3 . Following the age in the entire model domain changed from 14 % to 6 % principles of O3 formation in a high-NOx environment the in BAU2040. In the EEDI2040 scenario, the relative contri- pattern shows ozone formation from shipping emissions fur- bution of local shipping to the annually averaged grid means ther from the harbour area. The same pattern is visible in fu- reaches 18 %. The relative contributions of shipping in the ture scenarios but with only a small depletion of −0.5 ppb O3 Atmos. Chem. Phys., 20, 10667–10686, 2020 https://doi.org/10.5194/acp-20-10667-2020
M. O. P. Ramacher et al.: Part II: Scenarios for 2040                                                                                      10679

Table 3. Population-weighted exposure in the Gothenburg area to NO2 (in ppb), PM2.5 (in µg m−3 ), and ozone (as sum of hourly means
over 35 ppb) in 2012 and in the BAU2040 and EEDI2040 scenarios. The exposure caused by local shipping, local and regional shipping, and
ships at berth is given separately.

                              Population-weighted concentration (PWC)                  NO2          PM2.5       SOMO35
                                                                                      (ppb)      (µg m−3 )      (ppb h−1 )
                              Year 2012
                              Total base                                               4.70            4.12         19 698
                              Local shippinga                                          0.68            0.09         −1186
                              Local + regional shipping                                1.65            0.51         −1115
                              Year 2040
                              Total BAU2040                                            1.16            2.80         18 723
                              Local shipping BAU2040a                                  0.08            0.02          −115
                              Local + regional shipping BAU2040                        0.18            0.31             35
                              Shipping emissions at berthb BAU2040                     0.12            0.01          −241
                              Total EEDI2040                                           1.39            2.83         18 434
                              Local shipping EEDI2040                                  0.28            0.01          −727
                              Shipping emissions at berthb EEDI2040                    0.18            0.01          −267
                            a Includes emissions at berth. b Emissions avoided by being replaced by land power in the BAU2040LP
                            and EEDI2040LP scenarios.

at most in BAU2040 and −1.2 ppb O3 in EEDI2040. While                           2012, resulting in very low contributions to atmospheric pol-
in 2012, O3 concentrations increase by up to 8 % (∼ 2 ppb)                      lution levels.
outside the port area, in the future scenarios shipping-related
O3 concentrations are on average around 0, except for the                       4.3     Influence of shoreside electricity use in future
area with industrial emission sources in the west. Here, high                           scenarios
VOC emissions from the industrial sources react with NOx
emissions from nearby shipping and form about 1 ppb O3 at                       The model simulations show that the contribution of ship-
most, which can be accounted to shipping activities. Never-                     ping to air pollution in Gothenburg in the future scenarios
theless, the overall contribution of shipping to increased NO2                  is focussed on the port area (Fig. 6). The results for the
and O3 concentrations is very low in both future scenarios.                     shoreside electricity scenario BAU2040LP show visible re-
   The pollutants PM2.5 and SO2 show similar reduction pat-                     ductions in NO2 , PM2.5 , and SO2 concentrations in the port
terns in the future scenarios. The huge reductions in PM2.5                     area (Fig. 7). For NO2 , local concentration reductions in the
(−85 %) and SO2 (−91 %) emissions are consequently lead-                        port area are up to 25 % in comparison to BAU2040, and
ing to a reduced impact of shipping in BAU2040. The con-                        for the EEDI2040LP scenario, the NO2 reduction due to the
tribution of PM2.5 from local ship emissions is relatively low                  shoreside electricity is up to 30 % (Fig. 6). In the surrounding
in 2012 (maximum of 0.9 µg m−3 in the western port area),                       areas of Gothenburg, the reductions range between 1 % and
and even lower (maximum of 0.15 µg m−3 in the western port                      15 %. In terms of O3 , replacement of emissions from auxil-
area) in the BAU2040 scenario. The SO2 concentrations in                        iary engines at berth with electricity (BAU2040LP scenario)
the Gothenburg area are driven by industrial and shipping                       causes an increase of up to 2.5 %. In the EEDI2040LP sce-
emissions, which account for more than 99 % of the total,                       nario the relative increase in annual mean O3 concentrations
both in 2012 and in BAU2040. Between 2012 and BAU2040                           compared to the EEDI2040 scenario is up to 3 % (Fig. 7).
the SO2 emissions from shipping decreased by 91 % and                           In both scenarios, the decrease in NOx emissions leads to
therefore the concentration of SO2 decreased as well. While                     an increase in O3 concentrations due to less titration of O3 .
there has been a relative contribution of shipping to SO2 con-                  The results for PM2.5 and SO2 show similar characteristics.
centrations in summer of about 70 % in the harbour and its                      BAU2040LP and EEDI2040LP lead to additional local re-
surrounding areas in 2012 (concentration contribution max-                      duction potentials of up to 3 % for PM2.5 and 12 % for SO2
ima of up to 0.7 µg m−3 ), in the 2040BAU scenario the con-                     in the port area, but almost no difference can be seen outside
tributions are below 20 % with a maximum concentration                          the port area. EEDI2040LP shows a slightly higher reduction
contribution of less than 0.2 µg m−3 to the summer mean. To                     potential than BAU2040LP. In total, the implementation of
summarize, the air pollution from shipping in the BAU2040                       shoreside electricity is clearly beneficial to reduce the impact
scenario reflects the large emission reductions compared to                     of shipping emissions and therefore increase the air quality
                                                                                in areas close to the port.

https://doi.org/10.5194/acp-20-10667-2020                                                          Atmos. Chem. Phys., 20, 10667–10686, 2020
You can also read