Columbia River Gorge Air Study and Strategy - Oregon Department of Environmental Quality Southwest Clean Air Agency February 29, 2008 - DRAFT
←
→
Page content transcription
If your browser does not render page correctly, please read the page content below
Columbia River Gorge Air Study and Strategy

    Oregon Department of Environmental Quality
           Southwest Clean Air Agency

            February 29, 2008 – DRAFT
Executive Summary Introduction This document describes the Oregon Department of Environmental Quality (DEQ) and Southwest Clean Air Agency’s (SWCAA) (together, “air agencies”) past work, scientific studies, strategy and rationale for managing visibility in the Gorge. It summarizes the current and future potential actions that, taken together, will help guard against long-term visibility degradation from current levels and drive continued visibility improvements in the future. Gorge Commission Charge to the Air Agencies The Columbia River Gorge Commission has responsibility under the Scenic Area Management Plan to protect natural, scenic, cultural, and recreational resources. In May 2000, the Gorge Commission recognized that while a Class I designation is not appropriate for the Gorge; there is some potential risk to those resources from air pollution that must be protected under the National Scenic Area Act. Therefore, the Gorge Commission approved an air quality amendment to the National Scenic Area (NSA) Management Plan that asked the air agencies to (A) continue to monitor air pollution and visibility levels in the Gorge, (B) analyze monitoring and emissions data to identify all sources, both inside and outside the Scenic Area, that significantly contribute to air pollution, and (C) develop and implement a regional air quality strategy to carry out the purposes of the NSA. The Commission has noted it does not have expertise in air quality planning and they will rely on the air agencies to develop an air quality strategy for the NSA. Gorge Air Project – Background In 2001, the air agencies and the Washington Department of Ecology drafted a Gorge Air Quality Work Plan based on the Gorge Commission’s charge to develop an approach to study and protect air quality in the Gorge with a focus chiefly on visibility and the emission sources that contribute to haze in the Scenic Area. In 2003, budget cutbacks forced the study and process to be redesigned. Resource reductions at the state level resulted in the Washington Department of Ecology dropping out of the Gorge project. DEQ and SWCAA had to abandon efforts for a large bi-state advisory committee process, and they were forced to scale back the technical study. The scope and funding for the Gorge project did not allow for a comprehensive and exhaustive evaluation of all possible air pollution effects on scenic, cultural, natural, and recreational resources. It was recognized that the redesigned technical study would not be able to provide answers to all possible questions about air quality in the Gorge. Because similar pollutants affect both visibility and acid deposition, visibility was selected as a surrogate of air quality in general. The air agencies developed an addendum to the Work Plan, which the Gorge Commission approved in August 2003. Gorge Air Study and Strategy – 2-29-08 - DRAFT ii
During the course of its technical study, the air agencies learned of concerns relating to
air quality impacts on ecological effects and cultural resources in the Gorge. For
example, the U.S. Forest Service (USFS) conducted studies that looked at fog water
chemistry, ozone injury to forests, and potential impact to lichen ecosystems. The Gorge
Area Tribes began looking into the effects of air pollution on Native rock images. These
studies have been very useful as a starting point for studying these issues and are
discussed in this report.

Because many of the pollutants that impair visibility are the same ones that can affect
broader ecosystem issues in the Gorge, the air agencies believe that the majority of
strategies set forward in this document would both directly and indirectly benefit all the
valued resources to be protected under the Scenic Area Act.

Gorge Commission Concurrence

The air agencies believe they have met the charge given them by the Gorge Commission
and respectfully request the Commission concur with the following package of four key
conclusions and recommendations that cannot be separated from each other:

1) The air agencies have:
      a. Monitored air pollution and visibility levels in the Gorge, and
      b. Analyzed monitoring and emissions data to identify the sources, both inside
           and outside the Gorge, that contributes to air pollution.

2) The air agencies have described in this document a reasonable approach to a regional
air quality strategy for the Gorge that will produce continued improvement in visibility.
This strategy is grounded in the chief conclusions of the air agencies’ science study that
no single action can feasibly be taken to dramatically improve Gorge visibility, but that
visibility improvement can only be accomplished through the cumulative effect of many
different emission reduction efforts. Any viable approach to achieve further visibility
improvement in the Gorge must involve all the governmental entities, stakeholders, and
agencies working together to implement a combination of the following:

       a) Current and existing federal and statewide strategies for regional air pollution
          reduction;
       b) New emission reduction strategies and projects that focus specifically on
          Gorge visibility improvement;
       c) Pursuit of future strategies and concepts to benefit the Gorge as they are
          developed and become available.

3) In five years (2013) the air agencies will conduct a progress assessment to verify
whether visibility improvements in the Gorge attributed to man-made sources have
occurred as expected. The agencies will also update the Gorge Commission on the
implementation of current and new strategies and the development of potential future
strategies.

Gorge Air Study and Strategy – 2-29-08 - DRAFT                                               iii
4) The air agencies will continue to work as needed with all affected agencies,
stakeholders, elected officials, the public, and Native American Tribes, and will be open
to reviewing new research conducted by the USFS, Native American Tribes, and others
as it is developed.
Overview of Agency Conclusions from Gorge Air Studies
After reviewing the available scientific studies looking at visibility trends, ecological
effects, and sources of haze, the air agencies’ findings and conclusions from the scientific
studies are:
1. What are the visibility trends (Current and Future)?
• High haze events do occur in the Gorge. These events vary year-to-year, are
influenced by local and regional emissions sources as well as local and regional
meteorology. (i.e., local stagnation and regional and global transport winds).
• Visibility in the Gorge is not degrading and is in some instances improving
slightly despite regional growth pressures. While there is not consensus among
all stakeholders about the exact trajectory of this trend line, additional studies to
reconcile the various views would not likely lead to a different conclusion by the
agencies.
• Visibility is expected to improve somewhat in the coming years. The Agency’s
modeling analysis of expected future visibility trends suggests that visibility will
improve slightly over the next decade (through 2018) - again despite strong
anticipated regional growth pressures.
2. When is haze most significant and where does it come from?
• Visibility impairment in the Gorge is typically worse in the winter than it is in the
summer, particularly at the eastern end of the Gorge when air stagnation
conditions trap and concentrate pollution.
• Winter haze episodes are dominated by easterly winds with the majority of
emissions coming from sources east of the Gorge. Winter haze concentrations are
most significant at the east end of the Gorge, less significant at the west end of the
Gorge.
• Summer haze episodes are dominated by westerly winds with emissions typically
coming from the Portland/Vancouver area and other regional sources west of the
Gorge. Summer haze concentrations are most significant at the west end of the
Gorge, less significant at the east end of the Gorge.
Gorge Air Study and Strategy – 2-29-08 - DRAFT iv• Haze pollution comes from everywhere. Some haze pollutants are generated
locally, but a large fraction of haze pollution comes from regional sources as far
away as Canada and beyond. Also, a large fraction of haze pollution is from
natural sources, such as forest fires.
3. What are the most significant emission sources contributing to Gorge haze?
• Haze comes from all over the region, both locally and from far way. Generally,
“man-made” emission sources (such as motor vehicles, power plant emissions,
and woodstoves) each contribute a small amount to total haze. Haze events are
the result of the collective contribution of these many sources.
• Natural sources such as wildfires and vegetation, and sources from outside the
region (i.e. Canada and overseas) play a large role in Gorge haze, and contribute
approximately 20% to over 50% of total haze depending on the season and
location in the Gorge.
• Local sources from the Portland/Vancouver area play a minor to modest role in
haze, contributing in the range of 3% to 20% of total haze depending on the day,
season, and meteorology.
• Sources east of the Gorge contribute in the range of 13% - 57% of haze, and are
most significant in the winter.
• The most significant man-made sources contributing to Gorge haze include:
o power plant emissions,
o woodstoves,
o motor vehicles,
o non-road emissions (e.g., ships, trains, trucks), and
o agricultural sources of ammonia.
4. What can be done to reduce emissions and improve visibility?
• For each of the key contributing emission sources listed above, there exists today,
or will soon exist, an emission reduction strategy that will reduce emissions over
time, help improve regional and Gorge visibility, and reduce acid disposition,
lowering the risk to cultural resources and ecosystems.
• The air agencies’ science study confirms that there is no single source or group of
sources that are primarily responsible for haze events in the Gorge. Therefore,
continued improvement in visibility will require the collective benefit of emission
reductions from many different sources, both locally and across the region. Many
emission reduction strategies are currently underway, and new strategies are being
developed. In the coming years these strategies will all act together to reduce haze
in the Gorge.
Gorge Air Study and Strategy – 2-29-08 - DRAFT v• All these strategies (current, new, and those developed in the future), will evolve
and play out over the next several years primarily as part of the federal Regional
Haze reduction effort, or as targeted special emission reduction projects
undertaken to benefit the Gorge. Other air quality planning efforts around the
region, such as plans to meet or maintain public health standards or reduce air
toxics may also contribute new emission reduction strategies that will provide co-
benefits to the Gorge.
• DEQ and SWCAA will conduct a progress assessment in 2013 to determine
whether these strategies are indeed producing the continued visibility
improvements expected by the agencies.
5. What are the ecological effects of air pollution in the Gorge?
• Important work done by the USFS to date suggests that acidic deposition in the
Gorge may pose some risk to sensitive ecosystems and Native American rock
images.
• At this point, these studies are not conclusive. The air agencies would encourage
the USFS and Gorge area tribes to continue this very valuable research to better
understand the actual risk to Gorge ecosystems and cultural resources.
More discussion of the Agency’s conclusions and strategies is provided in the section
below and throughout this report.
Gorge Strategy Overview
The Gorge visibility strategy will rely on four basic approaches that together, over time,
will drive continued visibility improvement in the Gorge. The four components include:
a) Current and existing federal and statewide strategies for regional air pollution
reduction. (Report Section VII. A.) Key examples of theses strategies include:
• Prevention of Significant Deterioration (PSD): air quality permitting
program for new and expanding major industrial sources.
• Motor Vehicle Inspection and Maintenance Program.
• Ultra-Low Sulfur Diesel Fuel Requirements.
• Diesel Retrofit on School Buses in SW Washington.
• Woodstove Smoke Reduction Project in Oregon and Washington.
• Federal Air Toxics Source Standards in Oregon and Washington.
b) New emission reduction strategies and projects that focus specifically on
regional visibility improvement with benefits to the Gorge; or adopted for other
purposes with co-benefits to the Gorge. (Report Section VII. B.) Key examples of
theses strategies include:
Gorge Air Study and Strategy – 2-29-08 - DRAFT vi• Federal Regional Haze Program.
• Best Available Retrofit Technology (BART) Facilities.
• Smoke Management in Oregon and Washington.
• California Low Emission Vehicles in Oregon and Washington.
• Diesel Retrofits for Local Government Fleets.
• Portland Air Toxics Solutions plan.
• Oregon’s Utility Mercury Rule.
c) Pursuit of future strategies and concepts to benefit the Gorge as they are
developed and become available. (Report Section VII. C.)
• Bi-State Solutions Initiatives:
1) Columbia River Regional Diesel Reduction Project (project in
development)
2) Eastern Dairies and Agriculture Best Management Practices
(concept)
• Oregon’s “Heat Smart” Woodstove Upgrade Initiative (2009)
• Agricultural Burning
• Dust Management Plan for the Gorge
• Public Health – New Potential Strategies to Meet and Maintain Air
Quality Health Standards
• State Greenhouse Gas Initiative
d) Progress Evaluation (Report Section VII. F.)
• In five years (2013) the air agencies will conduct a progress
assessment to verify whether visibility improvements in the Gorge
attributed to man-made sources have occurred as expected. The
agencies will also update the Gorge Commission on the
implementation of current and new strategies and the development of
potential future strategies.
Note that in any given year visibility conditions may be better or worse depending on the
influence of natural emission sources such as forest fires. The air agencies’ will be
focusing primarily on trends in man-made emissions to conduct a progress assessment to
verify whether visibility improvements in the Gorge have occurred as expected.
Special Issues of Interest
1. PGE Boardman Facility
Oregon DEQ expects that both NOx and SO2 emissions at the Boardman facility will be
significantly reduced through the application of emission controls under the federal
Regional Haze rule requiring Best Available Retrofit Technology (BART). DEQ is
currently evaluating control technology options for the facility. The selection of BART
Gorge Air Study and Strategy – 2-29-08 - DRAFT viicontrols (and thus the level of emission reduction required) will be decided in late 2008 by the Oregon Environmental Quality Commission (EQC), after the lengthy public process. Oregon DEQ intends to begin this public rulemaking process in the summer of 2008. Emission reductions at the Boardman facility will provide a relatively modest but significant improvement in Gorge visibility as well as reduce emissions contributing to acidic deposition. This will help reduce the risk to cultural resources and ecosystems in the Gorge. 2. Other BART Source Reductions While likely not as significant as Boardman, other BART eligible major industrial facilities in Oregon and Washington will be reducing emissions to meet BART visibility improvement objectives. Benefits to the Gorge cannot be quantified at this time, but all reductions achieved from BART will help collectively improve regional visibility and reduce acid deposition. 3. Ammonia Emissions The air agencies’ Science Study suggests that regional ammonia emissions are a significant factor in haze formation affecting both Class I wilderness areas and the Gorge. There are many sources of regional ammonia, including the use of agriculture fertilizers, and regional animal feeding operations, such as dairies. In January 2008, the Oregon Task Force on Dairies and Air Quality convened to study air emissions from dairy operations and explore options for reducing those emissions. The Task Force will release its report in July 2008. The air agencies hope the Task Force report will identify ways to reduce dairy emissions statewide. The air agencies also hope the Task Force report will be a springboard for bi- state cooperation in reducing air emissions from Oregon and Washington dairy operations, especially in regions east of the Gorge. DEQ and SWCAA will have a better sense of future possibilities when the Task Force has completed its work this summer. Section VII of this report discusses an initial concept for a bi-state dairy ammonia reduction project that could potentially be informed and encouraged by the result of the Dairy Task Force work. 4. Cultural Resources and Ecosystems The USFS and Gorge-area Native American Tribes have begun important research into the question of acid deposition in the Gorge and the potential risk to important cultural and ecosystem resources there. The air agencies encourage this work to continue, and would welcome reviewing the results of any new studies during its 2013 visibility progress assessment. The agencies cannot, at this time, fund or lead any new studies in the area of acid Gorge Air Study and Strategy – 2-29-08 - DRAFT viii
deposition. We would however, be happy to participate in the design phase of new
research and in the peer review of any study results.

In the air agencies’ view, several additional studies will be required before conclusions
can be drawn about the risk to cultural and natural resources from acidic deposition.
While current studies suggest some acidic deposition is occurring, at this time the air
agencies do not know with any certainty to what extent cultural or natural resources are at
risk or are being harmed. Additional research by the USFS and Native American Tribes
would help answer those questions.

As future studies are developed, the air agencies note that many of the same pollutants
that impair visibility also play a key role in acidic deposition. Therefore, many of the
upcoming strategies that improve visibility will also help reduce acidic deposition and
reduce risks to cultural and natural resources.

Tribal Consultation

The air agencies have been in contact with each of the four Gorge-area Native American
Tribes to discuss the Gorge Air Quality Study, the Gorge Air Strategy, and emerging air
issues of concern. DEQ and SWCAA are currently pursuing a government-to-
government consultation convened by the U.S. Environmental Protection Agency or U.S.
Forest Service to discuss the Gorge project.

Conclusion

The air agencies have presented the Gorge Commission with a comprehensive
understanding of the emission sources that influence scenic resources in the Gorge, a look
into the likely future of haze trends in the Scenic Area, and a path forward for continued
visibility improvement over time. With this framework now in place, the air agencies
believe the Columbia River Gorge Commission should concur that the air agencies have
met the charge given them.

Gorge Air Study and Strategy – 2-29-08 - DRAFT                                             ix
Table of Contents

Section I. Introduction...................................................................................................... 3
Section II. Gorge Commission Charge to the Air Agencies ......................................... 3
Section III. Gorge Air Project – Background .................................................................... 4
Section IV. Gorge Commission Concurrence with Gorge Air Strategy ..................... 4
Section V. Air Studies ....................................................................................................... 6
  A. Background on Haze ............................................................................................ 6
  B. Gorge Visibility Studies........................................................................................ 6
     1) Current Visibility Trends........................................................................................ 7
     2) Future Visibility Trends (to 2018).......................................................................... 9
     3) Source Contribution to Haze ................................................................................ 13
     4) Ecological Effects................................................................................................. 15
  C. Air Agencies’ Overall Conclusions Based on the Study Results........................ 16
Section VI: Key Focus Areas for Emission Reduction Actions to Provide Visibility
Improvement ................................................................................................................... 18
  A. August 2004 Haze Event..................................................................................... 18
  B. November 2004 Haze Event ............................................................................... 20
  C. Regional Emissions Forecast to 2018 ................................................................ 21
  D. August 2018 – Haze Event.................................................................................. 21
  E. November 2018 Haze Event ............................................................................... 23
  F. ”What-If” Scenarios: What Influences Haze Levels in the Gorge ................. 24
Section VII. Gorge Strategy .......................................................................................... 27
  A. Current Strategies.................................................................................................. 30
  B. New Strategies ........................................................................................................ 32
  C. Potential Future Strategies and Concepts ........................................................... 38
  D. Future Research ..................................................................................................... 43
  E. Special Issues of Interest........................................................................................ 44
  F. Progress Tracking, Contingency Planning, Periodic Reports to Gorge
  Commission ................................................................................................................. 46
Section VIII: Tribal Consultation ................................................................................. 47
Section IX. Conclusion................................................................................................... 47

Gorge Air Study and Strategy – 2-29-08 - DRAFT                                                                                  1
Figures
Figure 1: AQ Trends Showing the Worst 20% Visibility Days (Norville, 2006)............... 8
Figure 2: Who Is Polluting the Columbia Gorge Trends Slide, presented at Gorge Policy
Day, September 25, 2007 (Jaffe 2006) ....................................................................... 9
Figure 3: CAMx Modeling (Emery 2007) Future Visibility Trends: August................... 10
Figure 4: CAMx Modeling (Emery 2007) Future Visibility Trends: November ............. 11
Figure 5: WRAP TSS Visibility Modeling Results for 2018 (2008)................................ 12
Figure 6 : August 2004 Haze Event – Contributing Sources at Mt. Zion......................... 19
Figure 7: August 2004 Contributing Sources at Wishram................................................ 19
Figure 8: November 2004 Contributing Sources at Mt. Zion........................................... 20
Figure 9: November 2004 Contributing Sources at Wishram .......................................... 21
Figure 10 : August 2018 Contributing Sources to Haze at Mt. Zion................................ 22
Figure 11: August 2018 Contributing Sources to Haze at Wishram ................................ 22
Figure 12 : November 2018 Contributing Sources to Haze at Mt. Zion........................... 23
Figure 13: November 2018 Contributing Sources to Haze at Wishram ........................... 24
Figure 14: BART Eligible Sources in Oregon, Southern Washington and Western Idaho
................................................................................................................................... 36
Tables
Table 1: Summary of Source Contribution to Haze.......................................................... 14
Table 2: Summary of Ecological Effects of Air Pollution in the Columbia River Gorge
National Scenic Area ................................................................................................ 15
Table 3: Agency Test Scenarios for Changes in Haze (November) ................................. 25
Table 4: Agency Test Scenarios for Changes in Haze (August) ...................................... 26
Table 5: Identified Controllable Sources and Proposed Strategies to Address Them ...... 28
Appendices
Appendix A: Additional What-If Modeled Scenarios
Appendix B: Air Toxics Source Standards
Appendix C: National Policy Consensus Center (NPCC) Stakeholder Interview Report
Appendix D: Public Comments on the Gorge Strategy Document and Air Agencies’
Response
Gorge Air Study and Strategy – 2-29-08 - DRAFT 2Section I. Introduction
This document describes the Oregon Department of Environmental Quality (DEQ) and
Southwest Clean Air Agency’s (SWCAA) (together, “air agencies”) rationale and
strategy for managing visibility in the Gorge. It summarizes the current and future
potential actions that, taken together, will guard against long-term visibility degradation
from current levels and drive continued visibility improvements in the future. It includes
on-going oversight and evaluation of our progress. The Air agencies are requesting
Gorge Commission concurrence with this strategy.
Section II. Gorge Commission Charge to the Air Agencies
In May 2000, the Gorge Commission approved an air quality amendment to the National
Scenic Area Management Plan. The amendment language states that:
“Air quality shall be protected and enhanced, consistent with the purposes
of the Scenic Area Act. The States of Oregon and Washington shall: (1)
continue to monitor air pollution and visibility levels in the Gorge; (2)
conduct an analysis of monitoring and emissions data to identify all
sources, both inside and outside the Scenic Area that significantly
contribute to air pollution. Based on this analysis, the States shall
develop and implement a regional air quality strategy to carry out the
purposes of the Scenic Area Act, with the U.S. Forest Service, the
Southwest Air Pollution Control Authority [now the Southwest Clean Air
Agency] and in consultation with affected stakeholders.
The States and the Forest Service together shall provide annual reports to
the Commission on progress made regarding implementation of this
policy. The first report shall include a work plan and timeline for
gathering/analyzing data and developing and implementing the strategy.
The work plan shall be submitted to the Commission for approval at the
next annual update (August 2001).” 1
There was recognition by the Gorge Commission in their discussions amending the
Management Plan in 2000 that while a Class I (wilderness area) designation is not
appropriate for the Gorge, there is some potential risk to the resources that must be
protected under the National Scenic Area Act. The new air quality amendment language
reflects both purposes of the National Scenic Area Act.
The Columbia River Gorge Commission has responsibility under the Scenic Area
Management Plan to protect natural, scenic, cultural, and recreational resources. It is
recognized that the Commission does not have expertise in air quality planning and that
they will rely on the Oregon and Washington air quality agencies to develop an air
1
Management plan amendment language adopted by the Columbia River Gorge Commission on May 9,
2000. SMA Natural Resources Policy 12[pages I-123]
Gorge Air Study and Strategy – 2-29-08 - DRAFT 3quality strategy for the Scenic Area. However, as the regional policy-making body for the Scenic Area, the Gorge Commission must ensure that any proposed air quality strategy carries out the purposes of the Scenic Area Act. Therefore, in its review of the strategy, the Gorge Commission must find that it is consistent with those purposes. Section III. Gorge Air Project – Background In 2001, the air agencies and the Washington Department of Ecology developed an approach to study and protect air quality in the Gorge with a focus chiefly on visibility and the emission sources that contribute to haze in the Scenic Area. After a lengthy public process and Gorge Commission approval of the plan, the 2001 Work Plan encompassed two elements: (1) the development of a bi-state air quality advisory committee to lead a strategy development process and (2) a technical study to assess the causes of visibility impairment and to identify the emission sources that contribute to haze in the Scenic Area. In 2003, budget cutbacks forced the study and process to be redesigned. Resource reductions at the state level resulted in the Washington Department of Ecology dropping out of the Gorge project and its statewide visibility protection program. DEQ and SWCAA had to abandon efforts for a bi-state air quality advisory committee and the technical study was scaled back. The scope and funding for the Gorge project did not allow for a comprehensive and exhaustive evaluation of all possible air pollution effects on scenic, cultural, natural, and recreational resources. It was recognized that the redesigned technical study would not be able to provide answers to all possible questions about air quality in the Gorge. Because similar pollutants affect both visibility and acid deposition, visibility was selected as a surrogate of air quality in general. The air agencies developed an addendum to the Work Plan and the Gorge Commission approved the changes in August 2003. During the course of its technical study, the air agencies also learned of concerns with other air quality issues affecting the Gorge, specifically relating to ecological effects and cultural resources. For example, the U.S. Forest Service conducted studies that looked at fog water chemistry, ozone injury to forests, and potential impact to lichen ecosystems. The Gorge Area Tribes began looking into the effects of air pollution on Native rock images. Because the pollutants that impair visibility in the Gorge are the same ones that can affect broader ecosystem issues in the Gorge, the air agencies believe that the strategies set forward in this document would both, directly and indirectly, benefit all the valued resources to be protected under the Scenic Area Act. Section IV. Gorge Commission Concurrence with Gorge Air Strategy This strategy document, together with the air agencies’ Science Summary Report, represents fulfillment of the work set out to be performed in 2000. The emission reduction strategies described in this document, both existing and new, together with the Gorge Air Study and Strategy – 2-29-08 - DRAFT 4
progress tracking and evaluation milestones in 2013, are designed to drive continued
improvement in Gorge visibility in the future. Any additional research conducted by the
Tribes and USFS on the topic of rock image or ecosystem risks will be welcomed as part
of the agency’s 2013 progress assessment.

The air agencies believe they have met the charge given them by the Gorge Commission
and respectfully request the Commission concur with the following package of four key
conclusions and recommendations that cannot be separated from each other:

1) The air agencies have:
      a. Monitored air pollution and visibility levels in the Gorge, and
      b. Analyzed monitoring and emissions data to identify the sources, both inside
           and outside the Gorge, that contributes to air pollution. (Report Section V.)

2) The air agencies have described in this document an approach to a regional air quality
   strategy for the Gorge that will produce continued improvement in visibility. This
   strategy is grounded in the chief conclusions of the air agencies’ Science Study that
   no single action can feasibly be taken to dramatically improve Gorge visibility, but
   that visibility improvement can only be accomplished through the cumulative effect
   of many different local and regional emission reduction efforts. Any viable approach
   to achieve further visibility improvement attributed to man-made sources in the
   Gorge must involve all the governmental entities, stakeholders, and agencies working
   together to implement a combination of the following: (Report Section VII.)

           a. Current and existing federal and statewide strategies for regional air
              pollution reduction; (Report Section VII. A.)

           b. New emission reduction projects that focus specifically on Gorge visibility
              improvement; (Report Section VII. B.)

           c. Pursuit of future strategies and concepts to benefit the Gorge as they are
                 developed and become available. (Report Section VII. C.)

3) In five years (2013) the air agencies will conduct a progress assessment to verify
    whether the visibility improvements in the Gorge have occurred as expected. The air
    agencies will also update the Gorge Commission on the implementation of current
    and new strategies and the development of potential strategies. (Report Section VII.
    F.)

4) The air agencies will continue to work as needed with all affected agencies,
   stakeholders, elected officials, the public, and Native American Tribes and will be
   open to reviewing new research conducted by the USFS, Native American Tribes,
   and others as it is developed. (Report Section VIII.)

The air agencies have presented the Gorge Commission with a comprehensive
understanding of the emission sources that influence scenic resources in the Gorge, a look

Gorge Air Study and Strategy – 2-29-08 - DRAFT                                             5
into the likely future of haze trends in the Scenic Area, and a path forward for continued visibility improvement over time. With this framework now in place, the air agencies believe the Columbia River Gorge Commission should concur that the agencies have met the charge given them and that the above approach is consistent with the National Scenic Area Act and Gorge Management Plan. Section V. Air Studies A. Background on Haze Haze is air pollution that results in reduced visibility of an area. In general, the higher the concentration of the pollutants, the more visibility is impaired. Visibility impairment typically occurs at pollution levels much lower than federal air quality health standards, and so does not generally pose a risk to public health. Haze does degrade valued scenic vistas, and visibility impairing pollutants can also, in high enough concentration, potentially harm sensitive ecosystems and other resources. The air pollutants responsible for haze are particulate matter (PM). Particulate matter (PM) can be released as primary particles (PM emissions released directly into the atmosphere from fire, dust, etc.) or as secondary particles, (PM chemically formed in the atmosphere from precursor gases). The major precursor gases are sulfur dioxide (SO2), nitrous oxides (NOx), ammonia (NH3) and volatile organic compounds (VOCs). Particulate matter can be further broken down to distinct particle species in the atmosphere: ammonium sulfate, ammonium nitrate, organic compounds, elemental carbon, and coarse PM. Air monitoring on bad visibility days shows the main pollutants impacting the Gorge are organic carbon, nitrates, and sulfates. Sulfates and nitrates are secondary particles chemically formed in the atmosphere from precursor gases such as sulfur oxides (SOx) and oxides of nitrogen (NOx), which are products of fossil fuel combustion (coal burning power plants, automobiles, and industrial boilers). The presence of ammonia (NH3) also plays a key role in the formation of sulfates and nitrates. Sources typically associated with ammonia emissions include livestock farming, application of fertilizer, and the decomposition of manure. For the most part, organic carbon comes from sources that emit wood smoke directly into the atmosphere such as wildfires and residential woodstoves. Another pollutant of concern is elemental carbon, a byproduct of fossil-fuel combustion. Elemental carbon affects visibility by absorbing light. These pollutants all have the ability to affect visibility by scattering or absorbing light. B. Gorge Visibility Studies Since 2004, the air agencies and other scientists have conducted several visibility studies to learn as much as possible about regional and local emission sources influencing haze levels in the Gorge. The studies used a combination of air monitoring, chemical analysis, and computer model simulations to investigate the causes of haze. They evaluated hundred of emission source types from in-Gorge sources to sources as far as Seattle and Gorge Air Study and Strategy – 2-29-08 - DRAFT 6
beyond. The scientists explored fundamental questions like: where is haze pollution
coming from, what emission sources are significant contributors to haze levels and what
is the expected future trend in visibility looking out about ten years. These studies were
all conducted to obtain a better understanding of what is happening with visibility in the
Gorge.

This document highlights the key findings and conclusions and does not attempt to
reconcile all of the studies. Each study was designed to look at a different part of the
visibility story. No single study provided all the needed information. However, taken
together the results of all the studies provide a good picture of the geographic areas and
significant emission sources that influence haze in the Gorge. The results will help guide
the air agencies and others on how to best focus resources for future emission reduction
efforts.

The key visibility study highlights are summarized below. The complete body of
research is available from the air agencies, and is also available at the following web site
http://www.gorgeair.org.

1) Current Visibility Trends

Several independent researchers offered the agencies their analysis of current visibility
trends in the Gorge. The highlights of the findings are presented below. The observation
of historical monitoring data in the Gorge suggests improving trends for some pollutants,
(like sulfate and lead), but no improvement in other pollutants (like nitrate and
ammonium).

The highlights of current monitoring trend analyses are presented below in Figures 1-2.
The historical trend data tells a relatively consistent story, although the interpretation of
the data can be expressed somewhat differently by various researchers. One trends
analysis suggests that current haze levels show a slightly improving or flat trend.
Another analysis suggests that there is no significant improving trend, but that the trend is
not worsening.

Gorge Air Study and Strategy – 2-29-08 - DRAFT                                                 7
Study                                                                         Findings
Updated Air Quality Trends For the                                            Historical look at air quality trends:
Columbia River Gorge (Kent Norville, Air                                      • All long-term (> 7 years) monitoring
Sciences, 2006 - prepared for Klickitat                                         stations show a downward (improving)
County)                                                                         trend in air quality.
                                                                              • Shorter-term monitoring stations (3 to 7
                                                                                years) are either flat or show a
                                                                                downward trend.
                                                                              • No monitoring station shows a long-term
(See Figure 1)
                                                                                upward (worse) trend even though
                                                                                population has increased.

Figure 1: AQ Trends Showing the Worst 20% Visibility Days (Norville, 2006)

                                        A Q T re n d s (W o rs t 2 0 % E x tin c tio n )
                                       160

                                       140

                                       120
   Worst 20% Total Extinction (Mm-1)

                                       100

                                        80
                                                                                                                M t Z io n
                                                                                                                W is h ra m
                                        60                                                                      H e lls C a n yo n
                                                                                                                M t H ood
                                                                                                                M t R a in ie r
                                                                                                                Puget Sound
                                        40
                                                                                                                Spokane R es
                                                                                                                S ta rs k y
                                                                                                                T h re e S is te rs
                                        20                                                                      W h ite P a s s
                                                                                                                L in e a r ( M t R a in ie r )
                                                                                                                L in e a r ( T h re e S is te rs )
                                         0
                                         1988   1990   1992   1994   1996     1998   2000   2002    2004
                                                                       Year

Gorge Air Study and Strategy – 2-29-08 - DRAFT                                                                                  8
Study Findings
Who is polluting the Columbia River Historical look at air quality trends:
Gorge? (Dan Jaffe, University of • No evidence for improving air quality on
Washington, 2006 – prepared for the the worst days or in the fall, when most
Yakama Nation) air quality problems occur in the Gorge.
(See Figure 2)
Figure 2: Who Is Polluting the Columbia Gorge Trends Slide, presented at Gorge
Policy Day, September 25, 2007 (Jaffe 2006)
V is ib ility T r e n d s in th e G o r g e
A n n u a l a v e r a g e P M 2 .5 c o n c e n t r a t io n a t W is h r a m
S o m e im p r o v e m e n t in a n n u a l a v e r a g e , b u t r e s u lt is n o t
s t a t is t ic a ll y r o b u s t .
2) Future Visibility Trends (to 2018)
One of the key outcomes of the visibility study was to estimate the future trend in Gorge
visibility that can be projected over the next decade, given expected growth and already
adopted emission reduction strategies. The air agencies estimated visibility in 2018 for
summer and winter haze episodes in the Gorge. The forecast was based on expected
emissions changes in the region. Figures 3-5 show the projected future trends in Gorge
visibility over the next decade.
Gorge Air Study and Strategy – 2-29-08 - DRAFT 9Study Findings
CAMx Modeling Study (Chris Emery, Future look at visibility trends:
ENVIRON, 2007 – sponsored by DEQ & • Little visibility change (1% - 3%) in the
SWCAA) summertime (August episode).
• Wintertime (November episode)
visibility haze levels will improve a
small (10%) yet noticeable amount.
• Haze levels have held steady and will
likely show a small improvement over
the next decade, despite population
(See Figures 3-4)
growth.
Figure 3: CAMx Modeling (Emery 2007) Future Visibility Trends: August
Gorge Air Study and Strategy – 2-29-08 - DRAFT 10Figure 4: CAMx Modeling (Emery 2007) Future Visibility Trends: November Gorge Air Study and Strategy – 2-29-08 - DRAFT 11
Study Findings
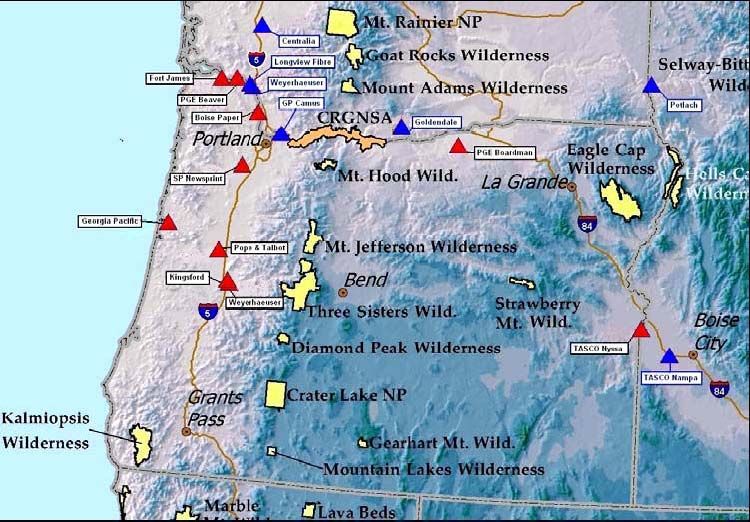
Western Regional Air Partnership (WRAP) Future look at visibility trends:
(Technical Support System-TSS) • Some visibility improvement.
Haze Reduction Glide Slope Analysis 2008) • Sulfate visibility greatly improved.
2
(http://vista.cira.colostate.edu/tss/)
• Nitrate visibility somewhat improved.
(See Figure 5)
The WRAP is a regional organization in the
west that assists states in the analysis and
preparation of Regional Haze plan for
improving visibility in wilderness areas and
national parks.
Figure 5: WRAP TSS Visibility Modeling Results for 2018 (2008)
Visibility Trends at Mt. Hood
60 Visibility
50 NO3 (Nitrate)
d e c iv ie w
40
SO4 (Sulfate)
30
Elemental Carbon
20
10 Organic Matter
Carbon
0
2004 2008 2013 2018
Year
Taken together, the agencies conclude that current monitoring trends show that visibility
in the Gorge is not getting worse, but rather holding steady or improving slightly in the
face of significant regional growth pressure. Even so, trends are not improving as much
as the agencies would hope.
2
The Technical Support System (TSS) has been developed by the Western Regional Air Partnership
(WRAP) to provide technical data and analytical results prepared by WRAP Forums and Workgroups. The
TSS is a tool to support implementation of Regional Haze plans and to provide a tool to show past and
future visibility conditions.
Gorge Air Study and Strategy – 2-29-08 - DRAFT 123) Source Contribution to Haze
The air agencies analyzed monitoring and emissions data to identify the sources, both
inside and outside the Gorge that contributed to air pollution. The air agencies sponsored
a number of separate studies with each study providing a clearer link to determining the
causes of visibility impairment in the Gorge. The three main studies conducted were:
• Haze Gradient Study: The Haze Gradient study provided a snapshot of how haze
moves into and throughout the Gorge, from both the west and east, and how haze
movement relates to wind directions and seasons. The haze gradient study did not
attempt to identify specific emission source types contributing to haze.
• CoHaGo Study: The CoHaGo Study built on the findings from the Haze Gradient
Study and tried to estimate individual sources likely to be contributing
significantly to haze.
• CAMx Modeling Study: The CAMx Modeling Study further identified what
sources were contributing to haze and identified specific source regions. The
CAMx Modeling Study was conducted for one haze event in the summer and one
haze event in the winter. While the source categories and regions are likely
representative of most haze events, the actual percent contribution to haze by a
single source category may vary. The CAMx study was not able to include the
effects of fugitive dust.
Table 1 provides a summary of findings from the three studies describing the different
source contributions to haze.
Gorge Air Study and Strategy – 2-29-08 - DRAFT 13Table 1: Summary of Source Contribution to Haze
Study Summer Winter
Haze • Summertime episode is • Wintertime haze is worst.
Gradient cleaner. • Winds from the east blowing haze
(Mark Green, • Increased haze at the western into the Gorge.
DRI, 2006 – end of the Gorge from west
DEQ & winds transporting emissions
SWCAA through the Gorge.
sponsored study)
Causes of • Main contributors of haze are • Wintertime haze is worse than the
Haze in the estimated to include organic summer.
Gorge carbon and sulfate: • Caused by haze-forming pollutants
o Burning – such as forest such as nitrates, sulfates, and
(CoHaGo) fires (organic carbon) organics.
(Mark Green,
DRI, 2006 –
o Oil combustion and paper • Contributing sources include:
DEQ & mill emissions (sulfate) • Sources to the east of the Gorge:
SWCAA o Portland/Vancouver metro o Wood burning emissions
sponsored study) area emissions (organics)
o Dust o Coal fired power plant (sulfates
and nitrates)
o Regional ammonia sources,
including nearby confined
animal feeding operations
(CAFO) (ammonia –contributes
to the formation of sulfates and
nitrates).
• Sources to the west of the Gorge:
o Pulp & paper
o Shipping
o Mobile sources
o Wildfires
o Agricultural burning
CAMx Emission sources responsible for Emission sources responsible for haze:
Modeling haze: • Sources east of the Gorge (~13% -
(Chris Emery, 57%)
• Natural sources such as
ENVIRON, o power plants,
2007 – DEQ &
wildfires and vegetation
(~33%) o vehicle emissions
SWCAA o residential wood heating
sponsored study) • Outside the region - overseas
emissions (~22%) o ammonia
• Portland-area emissions (~3% • Emissions from outside the region,
- ~20%) including Canada and overseas
(~19% - ~23%)
Gorge Air Study and Strategy – 2-29-08 - DRAFT 144) Ecological Effects During visibility study, the air agencies became aware of a number of other studies conducted to look at the ecological effects of air pollution in the Gorge. Given the special historic and cultural value of Native American rock images and natural resources in the Gorge, the Forest Service funded studies to sample and analyze fog and cloud water chemistry, lichen chemistry, and ozone injury to forests for assessing potential risks to culturally significant artifacts and ecosystems in the Scenic Area. Briefly, excess nitrogen is of concern. Nitrogen enrichment of the ecosystem is occurring, based on lichen data. Additionally, acid fog has been observed in the Eastern Gorge at levels as low as pH 3.7. The stability of Native American rock images may be at risk due to nitrogen enrichment or acid fog. Ammonia is believed to be the primary cause of excess nitrogen in the eastern Gorge, while fossil fuel combustion is believed to be the primary cause of excess nitrogen in the western Gorge. The highlights of the findings are presented below. The acid deposition monitoring data shows that ammonium is increasing, while nitrates are steady and sulfates are decreasing. The ecological studies on lichen show that nitrogen loading is increasing, while sulfur remains steady and lead is decreasing. Table 2 presents a summary of these studies and their conclusions. Table 2: Summary of Ecological Effects of Air Pollution in the Columbia River Gorge National Scenic Area Study Findings Air Pollution in the CRGNSA – • Nitrogen deposition is high in the Gorge. Detection, Trends, and • Sulfur deposition has held steady and remains Ecological Effects (Linda moderately high in the Gorge. Geiser, USDA Forest Service, • Lead deposition has decreased dramatically. Gorge Science Day presentation – Sept 2006.) Atmospheric deposition inputs • Nitrogen deposition rates very high, more than and effects on lichen chemistry double expected and indicator species in the • Acidity of the fog & cloud water samples were Columbia River Gorge, USA characterized as extreme (seven day average fog (USDA Forest Service, samples as low as pH 3.7) Published in Environmental • Impacts of nitrogen deposition well documented Pollution 146 – June 2006.) for lichen communities Deposition of Nitrogen and • Nitrogen enrichment of ecosystem underway based Sulfur in the Columbia River on lichen data Gorge National Scenic Area • Acidic fog and precipitation events occur, but no (Mark Fenn, USDA Forest clear evidence of soil acidification in forested Service, Gorge Science Day areas presentation – Sept 2006.) Gorge Air Study and Strategy – 2-29-08 - DRAFT 15
Ozone Injury in West Coast         •   Ozone injury was found at one biomonitoring site
Forests: 6 Years of Monitoring         in OR & WA
(Sally Campbell USDA Forest        •   Site is unique (Jeffrey Pine at an irrigated site)
Service – June 2007)               •   Overall, federally managed forests in OR & WA
                                       are not being injured by ozone

In addition, the Tribal Nations of the Gorge area have initiated a study of air pollution
effects on rock image stability, based on concerns that air pollutions levels could have the
potential to impact cultural and natural resources. Rock images may be damaged either
directly or indirectly. Direct damage may result from acid rain, acid fog, and soot.
Indirect damage may result from accelerated weather caused by lichen growth. Excess
nitrogen, which can lead to acid precipitation and increased lichen growth, has been
documented to be occurring in the Gorge.

It is currently unclear the levels at which nitrogen or acid deposition are harmful to the
ecosystem. These studies are a first step in understanding ecological effects in the Gorge,
and the results can help inform decision-makers as to the next steps that could be taken to
evaluate this issue. The air agencies look forward to the results of the Tribal study and
any additional studies by the U.S. Forest Service to obtain a better understanding of air
quality’s impact on acid rain deposition, cultural resources, and ecological effects in the
Gorge.

C. Air Agencies’ Overall Conclusions Based on the Study Results

The air agencies have evaluated the various studies and modeling scenarios and believe
our conclusions are consistent with findings from the various studies. For example, all
the scientists and peer reviewers who reviewed the air agencies’ Gorge scientific studies
agreed that no single source, or group of sources was primarily responsible for Gorge
haze events, and that haze reduction would need to result from the cumulative effect of
numerous emission reduction activities. This is consistent with the air agencies’
conclusion and forms the basis for our strategic approach. In summary, the Agencies
have concluded the following:

What are the visibility trends (Current and Future)?

   •   High haze events do occur in the Gorge. These events vary year-to-year, are
       influenced by local and regional emissions sources as well as local and regional
       meteorology. (i.e., local stagnation and regional and global transport winds).
   •   Visibility in the Gorge is not degrading; and is in some instances improving
       slightly despite regional growth pressures. Based on the scientists’ review of
       historical data, one trend analysis suggests that current haze levels show a slightly
       improving or flat trend while another analysis suggests that there is no evidence
       for improvement on the worst air quality days. While there is not consensus
       among all stakeholders about the exact trajectory of this trend line, additional
       studies to reconcile the various views would not likely lead to a different
       conclusion by the agencies.

Gorge Air Study and Strategy – 2-29-08 - DRAFT                                           16
• Visibility is expected to improve somewhat in the coming years. The Agency’s
modeling analysis of expected future visibility trends suggests that visibility will
improve slightly over the next decade (through 2018); again despite strong
anticipated regional growth pressures.
When is haze most significant and where does it come from?
• Visibility impairment is typically worse in the winter than it is in the summer,
particularly at the eastern end of the Gorge when air stagnation conditions trap
and concentrate pollution.
• Winter haze episodes are dominated by easterly winds with the majority of
emissions coming from sources east of the Gorge. Winter haze concentrations are
most significant at the east end of the Gorge, less significant at the west of the
Gorge.
• Summer haze episodes are dominated by westerly winds with emissions typically
coming from the Portland/Vancouver area and regional sources west of the Gorge.
Summer haze concentrations are most significant at the west end of the Gorge,
less significant at the east end of the Gorge.
• Haze pollution comes from everywhere. Some haze pollutants are generated
locally, but a large fraction of haze pollution comes from regional sources as far
away as Canada and beyond. Also, a large fraction of haze pollution is from
natural sources, such as forest fires.
What are the most significant emission sources contributing to Gorge haze?
• Haze comes from all over the region, both locally and from far way. Generally,
“man-made” emission sources (such as motor vehicles, power plant emissions,
and woodstoves) each contribute a small amount to total haze. Haze events are
the result of the collective contribution of these many sources.
• Natural sources such as wildfires and vegetation, and sources from outside the
region (i.e. Canada and overseas) play a very large role in Gorge haze, and
contribute approximately 20% to over 50% of total haze depending on the season
and location in the Gorge.
• Local sources from the Portland/Vancouver area play a minor to modest role in
haze, contributing in the range of 3% to 20% of total haze depending on the day,
season, and meteorology. Sources east of the Gorge contribute in the range of
13% - 57% of haze, and are most significant in the winter.
• A break out of key contributing sources is presented in Section VI below.
What are the ecological effects of air pollution in the Gorge?
• Important work done by the USFS to date suggests that acidic deposition in the
Gorge may pose some risk to sensitive ecosystems and Native American rock
images.
Gorge Air Study and Strategy – 2-29-08 - DRAFT 17• At this point, these studies are not conclusive. The USFS and Gorge area tribes
should continue this very valuable research to better understand the actual risk to
Gorge ecosystems and cultural resources.
Section VI: Key Focus Areas for Emission Reduction Actions to Provide
Visibility Improvement
Some of the most valuable information learned from the studies involved a better
understanding of the role of natural sources of haze, sources of haze coming from far
away and beyond the air agencies’ jurisdiction, and those sources that could be within the
air agencies’ ability to influence.
The Modeling Study demonstrated that a rather large fraction of haze in the Gorge comes
from sources outside the region (i.e. outside of Oregon and Washington) and also from
natural sources. The air agencies’ modeling study looked at regional and source
contributions for both the 2004 base-year assessment and the 2018 future visibility
forecast. The air agencies recognized that the natural and distant source emissions are
beyond its jurisdiction and tried to characterize those emission sources and regions where
emissions reduction efforts could be achieved.
A. August 2004 Haze Event
Figures 6-9 provides an overview of the 2004 contributing sources based on the CAMx
Modeling Study. The figures provide source allocation information for both the August
and November 2004 haze episodes studied, and for both the Mt Zion (west Gorge) and
Wishram (east Gorge) monitoring sites. For the August 2004 episode, natural (vegetation
and wildfires) and distant (outside the region from overseas and Canada) emissions
dominate. These natural and distant (“beyond our jurisdiction”) emissions comprise up
to 59% - 77%, respectively, of the visibility impairment in the summertime. Other
emissions consist of man-made “within our jurisdiction” sources (23% - 41%). These
include man-made source emissions, such as motor vehicles, nonroad sources
(construction equipment, trains, and boats), area sources (such as residential woodstoves,
open burning), and point sources (permitted industrial facilities).
Gorge Air Study and Strategy – 2-29-08 - DRAFT 18You can also read