Pasture-Based Livestock Economics under Joint Production of Commodities and Private Amenity Self-Consumption: Testing in Large Nonindustrial ...
←
→
Page content transcription
If your browser does not render page correctly, please read the page content below
agriculture

Article
Pasture-Based Livestock Economics under Joint Production of
Commodities and Private Amenity Self-Consumption: Testing
in Large Nonindustrial Privately Owned Dehesa Case Studies
in Andalusia, Spain
Pablo Campos *, Bruno Mesa and Alejandro Álvarez

                                          Spanish National Research Council (CSIC), Institute for Public Goods and Policies (IPP), C/Albasanz, 26–28,
                                          E-28037 Madrid, Spain; bruno.mesa@cchs.csic.es (B.M.); alejandro.alvarez@cchs.csic.es (A.Á.)
                                          * Correspondence: pablo.campos@csic.es; Tel.: +34-91-602-2535

                                          Abstract: In this study, we apply the hypothesis of private amenity which simulates that the nonin-
                                          dustrial livestock farmers are assured an ex-ante normal minimum operating profitability rate for
                                          their investments in the production systems of livestock species based on grazing in a case study of
                                          dehesas in Andalusia, Spain. The ex-post measurement in the Agroforestry Accounting System of the
                                          commercial operating opportunity cost incurred by the owners at the close of the period corresponds
                                          to the lower limit of the additional amount of noncommercial intermediate product of the private
                                amenity self-consumption service (ISSnca). When the livestock farmers obtain an above-normal

                                          operating profitability rate, it is assumed that the absence of opportunity cost results in the free use
Citation: Campos, P.; Mesa, B.;           of the private amenity and, therefore, the latter is a free (noneconomic) service with zero value. In
Álvarez, A. Pasture-Based Livestock       the case study of dehesa farms, the results show that the commercial operating profitability rates at
Economics under Joint Production of       basic prices are below the normal. When the ISSnca is included, the operating profitability rates at
Commodities and Private Amenity           social prices for the livestock species exceed by 30%, on average, the assumed normal rate of 3%.
Self-Consumption: Testing in Large
                                          However, due to the decline in the prices of the inanimate fixed capital in 2010, the average total
Nonindustrial Privately Owned
                                          profitability rate for the livestock species is estimated at 0.1%, which differs substantially from the
Dehesa Case Studies in Andalusia,
                                          assumed normal operating profitability rate. These results are of interest with regard to the design
Spain. Agriculture 2021, 11, 214.
                                          and application of official economic accounts at farm scale, which, as in the European Commission
https://doi.org/10.3390/
agriculture11030214
                                          Farm Accounting Data Network, omit the measurement of ISSnca.

Academic Editor: Peter Tozer              Keywords: Farm Accounting Data Network; government compensations; Agroforestry Accounting
                                          System; net value added at social price; ordinary cash flow
Received: 12 February 2021
Accepted: 1 March 2021
Published: 5 March 2021
                                          1. Introduction
Publisher’s Note: MDPI stays neutral            The European Union policies for rural development highlight the preservation of
with regard to jurisdictional claims in
                                          extensive livestock activity in areas of high natural value with the aim of mitigating the
published maps and institutional affil-
                                          loss of unique domestic biological variety threatened with extinction, while also favouring
iations.
                                          economic activity in rural villages [1]. The planning of budget cycles in the European
                                          Union periodically leads to arguments concerning government policies for economic
                                          investment in the livestock farming activity, with these debates often being most heated in
                                          the negotiations for compensations under the Common Agricultural Policy (CAP).
Copyright: © 2021 by the authors.               The individual nonindustrial owners of large private dehesa farms in Andalusia de-
Licensee MDPI, Basel, Switzerland.        mand compensation from the government for the additional production of public goods
This article is an open access article
                                          and services of the agro-silvo-pastoral landscape, which provides continuity for livestock
distributed under the terms and
                                          grazing in extensive livestock farm production [2]. This demand from the livestock farmers
conditions of the Creative Commons
                                          is based on the hypothesis that the commercial products of extensive livestock farming
Attribution (CC BY) license (https://
                                          are not competitive, and, to mitigate the decline in livestock grazing demanded by soci-
creativecommons.org/licenses/by/
                                          ety, the livestock farmers should receive fair compensation from the government for the
4.0/).

Agriculture 2021, 11, 214. https://doi.org/10.3390/agriculture11030214                                    https://www.mdpi.com/journal/agriculture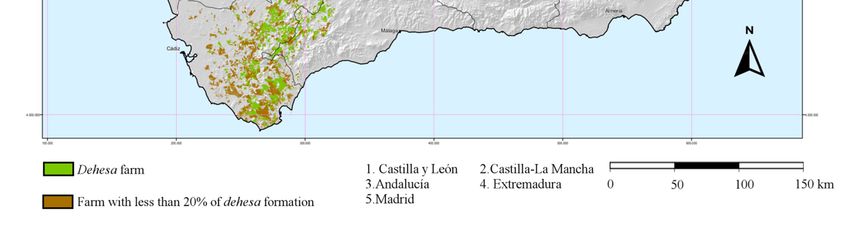
Agriculture 2021, 11, 214                                                                                            2 of 38

                            contribution of the livestock farming to the increased offer of public goods and services in
                            working landscapes which are consumed without direct payment by the beneficiaries [3].
                            In this economic context of public and private products of extensive livestock farming,
                            governments are faced with the choice between accepting the tendency toward future
                            decline in the supply of public products if livestock grazing continues to diminish or
                            mitigating/avoiding the decline by increasing compensations.
                                  The main novelty with regard to extending the total product in the Agroforestry
                            Accounting System (AAS) application to the case study of dehesas is the incorporation of
                            government compensations (ISSncc) and the private amenities (ISSnca) as noncommercial
                            intermediate products of services (ISSnc). The incorporation of the concept of ISSnca, first
                            defined in [4], based on the voluntary opportunity cost of the livestock farm owners, is
                            the innovation which most affects the economic results for individual livestock species
                            in situations where the normal net operating margins exceed the respective commercial
                            residuals, estimated by their basic prices.
                                  The official Farm Accounting Data Network (FADN) methodology gives the values
                            added, at basic prices, of the commercial goods of the agricultural and livestock farms
                            during the period, aggregated according to the main type of product of the farms [5]. In
                            other words, for those in which extensive livestock farming predominates, the commercial
                            values added in the FADN are not presented separately for each livestock species or
                            livestock farming activity.
                                  Hence, the academic literature on extensive livestock farming generally presents the
                            aggregate value added at basic prices for the economic activities of the farms in which
                            livestock farming predominates, without incorporating modifications into the official
                            FADN methodology [6,7]. Other authors have presented qualitative reviews of the literature
                            on livestock rearing in extensive systems without including economic results [3,8]. The
                            exception to these omissions in the literature can be found in our publications which
                            apply the AAS to farms with a predominance of tree species of the Quercus [4,9,10] and
                            Pinus [11] genera.
                                  The aim of the application of the AAS methodology to the case study livestock species
                            at the real management scale of an individual dehesa farm in 2010 was to illustrate, through
                            economic results captured in the field, the rationales behind the livestock investments of
                            nonindustrial individual private owners of large farms. The purpose of the case studies
                            is to further our microeconomic understanding of the qualitative interpretations of the
                            incentives of the owners of large private dehesas where agricultural land and pasture only
                            make up a small part of the total farm area. These dehesas mainly comprise holm oak
                            (Quercus ilex L.) and cork oak (Quercus suber L.) open woodland, along with small amounts
                            of other tree species (e.g., wild olive trees, riparian forest, and eucalyptus).
                                  The objective of this research was to test the modelling of the economic rationales
                            for the livestock species production systems based on natural grazing in large private
                            dehesa farms belonging to nonindustrial owners of the land and livestock in Andalusia,
                            Spain. This objective required the incorporation of noncommercial intermediate products
                            of private amenity services (ISSnca) [4]. These services are based on the economic rationale
                            of the livestock farmers, characterized by prior voluntary acceptance of the possibility of
                            receiving a commercial net operating margin at a basic price below the normal amount
                            received in exchange for guaranteed personal and family self-consumption of the private
                            amenities provided by the livestock species which graze in their dehesa farms. The nonin-
                            dustrial owners immobilize their livestock investments with the aim of joint production of
                            commercial goods and self-consumption of private amenity services, with productive links
                            with other activities in the dehesa. Hence, the challenge in this research was to validate the
                            hypothesis that the immobilized investment in the rearing of a livestock species, based on
                            grazing of the farmer’s own land, fulfils the dehesa farmer’s expectation of attaining at least
                            the normal net operating margin at the close of the period.
                                  The organization of this research continues as follows: Section 2 includes a summary of
                            the dehesa landscapes of Andalusia along with a brief description of the main characteristics
Agriculture 2021, 11, 214 3 of 38
of the case study farms and the livestock farming activity which takes place on them.
Section 2 compiles and describes the main economic indicators estimated. In Section 3, we
present and comment on the results obtained in this research. In Section 4, we discuss the
implications for government policy implementation. Lastly, Section 5 presents the main
conclusions of this research.
2. Materials and Methods
The materials and methods applied in the large nonindustrial privately owned dehesa
case studies in Andalusia, Spain are presented in this section. First, we define open wood-
lands, known as dehesas, where the farm case studies are located. Then, we briefly describe
the livestock species studied and the main characteristics of the livestock management in
the dehesa case studies (Section 2.1).
Second, we present the most relevant accounting framework of the Agoforestry Ac-
counting System (AAS) applied in the large nonindustrial privately owned dehesa case
studies (Section 2.2). This should help readers’ comprehension of the text without a need
to turn to previously published literature. The main variables described here are the
following: (i) total product; (ii) noncommercial intermediate product of private amenity
self-consumption; (iii) intermediate consumption; (iv) forage unit livestock consumption;
(v) total income; (vi) net value added; (vii) capital gain; (viii) net operating margin; (ix) prof-
itability rates; (x) ordinary cash flow. In addition, we compare the net value added under
the Farm Accounting Data Network (FADN) and the AAS.
2.1. Case Studies of Pasture-Based Livestock Farming on Large Nonindustrial Privately Owned
Dehesas in Andalusia, Spain
The livestock species reared on natural pasture are those which have led to the
formation of the open woodland working landscapes comprising trees of the Quercus
genus (Quercus ilex L., Qurecus suber L., Quercus faginea Lam., Quercus pyrenaica Willd.)
along with small areas of other species (e.g., Olea europaea L., Fraxinus angustifolia Vahl.)
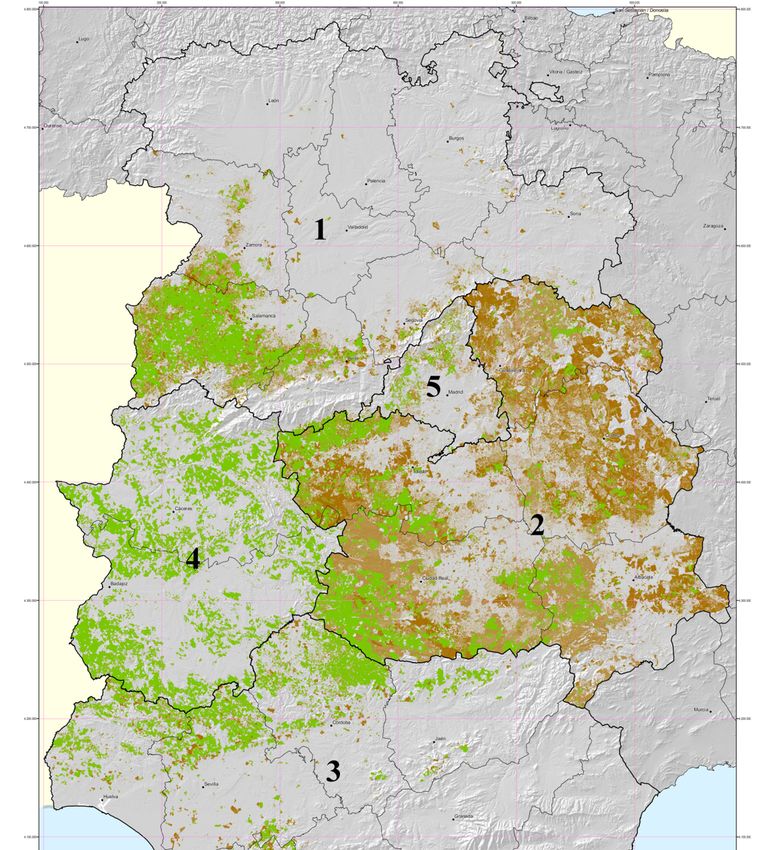
in the five regions in the west, center, and south of Spain (Figure A1, Appendix A). These
working landscapes account for 61% of the total area of 3,606,154 ha of the 112,000 agro-
silvo-pastoral farms known as dehesas in Spain ([4] Table 2, p. 3). In Andalusia, the open
woodland working landscapes of the 4408 dehesas occupy 62% of the total area of 743,775 ha.
The 1009 dehesas of more than 200 ha in Andalusia contain 63% of the open woodland
working landscapes and 68% of the total dehesa area ([12] Table 23, p. 46).
The livestock species reared on natural pasture are those which have led to the
formation of the open woodland working landscapes comprising trees of the Quercus
genus (Quercus ilex L., Qurecus suber L., Quercus faginea Lam., Quercus pyrenaica Willd.)
along with small areas of other species (e.g., Olea europaea L., Fraxinus angustifolia Vahl.)
in the five regions in the west, center, and south of Spain (Figure A1, Appendix A). These
working landscapes account for 61% of the total area of 3,606,154 ha of the 112,000 agro-
silvo-pastoral farms known as dehesas in Spain ([4] Table 2, p. 3). In Andalusia, the open
woodland working landscapes of the 4408 dehesas occupy 62% of the total area of 743,775 ha.
The 1009 dehesas of more than 200 ha in Andalusia contain 63% of the open woodland
working landscapes and 68% of the total dehesa area ([12] Table 23, p. 46).
In this study, we applied the Agroforestry Accounting System (AAS) separately to
the bovine, ovine, caprine, porcine, equine, and apicultural livestock species that graze
on the large nonindustrial privately owned dehesa case-study farms in Andalusia, Spain.
The open woodland working landscapes make up 77% of the total area of 15,372 ha of
these dehesas case studies, with open woodlands of holm oak and cork oak occupying 46%
and 20%, respectively, of the total dehesa case-study area. Due to the relatively small area
covered by the case-study dehesas, it is not possible to transfer the statistically significant
results obtained for the livestock activity to the total area of the large dehesas of Andalusia.
Nevertheless, the results for the case-study dehesas do provide a qualitative illustration of
the economic rationale trends present in the extensive livestock-rearing activity of the large
silvo-pastoral farms of Andalusia belonging to individual private nonindustrial owners.Agriculture 2021, 11, 214 4 of 38
Livestock grazing occurs in all the area occupied by the Quercus genus on the farms
and it may also take place to a far smaller extent in 4% of the forested area of the Pinus
genus on the case-study dehesas. The grazed fodder consumed by the livestock species
comprises mainly grasses, twigs, and wild fruits (e.g., acorns). In several of the case-study
dehesas, Iberian pigs are still fattened by feeding on acorns (termed montanera). Acorns
account for 11.9% of the 288.5 FU/ha grazed forage units (FUs) consumed by the livestock
in the period (Table A1, Appendix A).
The livestock species reared on the dehesas are native or crosses with other foreign
breeds of meat cattle and fighting bulls, meat sheep, meat and milk goats, Iberian fattened
and suckling pigs of the breed “Negro Entrepelado”, horses for breeding, and bees. The
studied farms usually rear several species, with the most common being meat cattle. With
regard to bovine, ovine, and caprine species, livestock production is mainly directed toward
the sale of weaned offspring to be fattened and slaughtered away from the farm, as well as
the rearing of fighting bulls, in cycles of 2–5 years required in the legislation, for subsequent
use in festivals and bullfights. The production of porcine species is directed toward final
fattening of Iberian pigs or montanera and a token amount of extensive breeding of suckling
pigs of the breed “Negro Entrepelado”. With regard to the equine species, the pure-bred
Andalusian, Hispano-Arabe, and Anglo-Arabic breeds are sold as studs for breeding and
recreational use by the owner, with mules and donkeys being used for pulling and other
tasks. The production of honey and beeswax is destined for sale and a small amount for
consumption by the bees.
The labor in the livestock activity of the dehesas is mainly paid labor (employees). The
exception is the labor associated with the goats and beekeeping activity, which is mainly
self-employed, family labor (Table A2, Appendix A).
The concept of livestock species stocking rates applied to the definition of livestock
rearing according to the consumption of natural pasture is ambiguous, since pasture forage
may be supplemented by trough feeding. This is the case of existing livestock rearing in
the private dehesas studied, where an average of 57.3% of the metabolizable energy of their
food in 2010 came from supplements, such that, in the case-study dehesas, stabled fattening
of livestock is not practiced and only a small number of breeding sows of montanera pigs
do not graze. The large area occupied by woodland, exceeding 80% of the total area,
the halting of grass growth in the summer, the montanera or fattening of pigs on holm
oak acorns in the autumn, and the predominance of bovine species both for meat and
bullfighting result in a livestock stocking rate which on average reaches 0.44 livestock units
(LU) per hectare, which is notably lower than the upper limit of 1.4 LU/ha considered in
the literature to define extensive livestock rearing ([3] p. 1365).
Apart from the livestock activity, other activities are undertaken in the studied dehesas
which give the owners the greatest profitability margins. These activities include cork
production, grazing, private amenity, and hunting. It should be noted that the game
species in the case-study dehesas compete with the domestic livestock in terms of grazing,
consuming similar amounts of pasture (Table A1, Appendix A). The main game species on
these farms are deer and wild boar, although there are other species such as the Iberian ibex,
mouflon, fallow deer, roe deer, partridge, rabbit, and other small game migrant species
such as the thrush or pigeon.
2.2. Economics of Private Livestock Farming under the Hypothesis of Amenity Self-Consumption
In this section, we present the concepts of economic rationales of private nonindustrial
owners for investment in extensive rearing of livestock species, along with the estima-
tion of total income for these species. We focus on the case-study dehesas in terms of
internal economic exchanges of noncommercial intermediate product of private amenity
self-consumption services (ISSnca) and government compensations (ISSncc) with the fi-
nal products consumed of private amenity (FPcaa) and public landscape (FPcla) valued
through the Agroforestry Accounting System (AAS). We summarize the similarities andAgriculture 2021, 11, 214 5 of 38
differences in the values added between the AAS and the official Farm Accounting Data
Network (FADN) methodologies.
2.2.1. Total Product Factorial Allocations
The exclusivity of the livestock owner over the ownership of the products and the
transmission of property rights to third parties are the initial conditions for identifying and
estimating the exchange value of the eligible products (with and without market prices) of
the livestock activity, which give the total income. The total product (TP) is composed of
the intermediate product (IP) and the final product (FP). The final product is made up of
the final product consumed (FPc) and the own-account gross capital formation (GCF) of
the livestock activity. The total product consumed (TPc) is obtained by adding the IP and
the FPc.
The TPc incorporates the ordinary total cost (TCo) of the total cost (TC) of the livestock
activity, while the total cost of investment (TCi) is incorporated in the GCF. The alive
gross capital formation (GCFa) may incorporate own production factors indirectly through
intermediate consumptions of grazing and harvested forage. The inanimate gross fixed
capital formation (GFCFi) of infrastructures and livestock farming equipment is valued ac-
cording to the respective production costs. Thus, we obtain an estimate of the net operating
margin (NOM) of the livestock activity, which corresponds entirely to the manufactured
capital of the case-study dehesas. This corollary is derived from the fact that the AAS avoids
double-counting of the ecosystem services of own grazing (ESg) consumed by the livestock
in the period, since these services are counted in the grazing activity, with this being the
activity which produces them.
However, in the academic literature and government institutional reports, there are
issues surrounding the polysemy of ecosystem services terms, since holistic definitions
of the term are used which are incompatible with the concept of observed or simulated
nature production factor transaction value applied in the AAS. The ecosystem services have
been defined as “the direct and indirect contributions of ecosystems to human wellbeing,
many of which do not have a market value and are ignored within evaluation [accounting]
frameworks” ([3] p. 1361), being human wellbeing “a broad concept, one that includes
many aspects of our everyday lives. It encompasses material wellbeing, relationships with
family and friends, and emotional and physical health. It includes work and recreation,
how one feels about one’s community, and personal safety” (https://www.eopugetsound.
org/science-review/section-3-nature-human-well-being, accessed on 11 February 2021).
This academic definition of ecosystem services is equivalent to that of the United Nations
Statistics Division (UNSD) which states that “ecosystem services (ES) are the contributions
of ecosystems to benefits used in economic and other human activity” [13], being benefits
defined as: “Goods and services that are ultimately used and enjoyed by people and which
contribute to individual and societal wellbeing. Two broad types of benefits are described
in ecosystem accounting—SNA benefits and non-SNA benefits” [13].
The livestock activity does not contribute ecosystem services to the observed or
simulated exchange value of the total product (TP) of the livestock species in the period.
We consider that the economic production function f of the livestock total product (TP)
depends on the production factors of manufactured intermediate consumptions (ICm),
labor (L), and manufactured fixed capital (FCm).
TP ≡ f(ICm, L, FCm). (1)
Among other inputs of materials and services, the ICm contains the value of the
grazing with observed or simulated market price. Apart from paid labor, L also includes
self-employed family labor with simulated residual remuneration. The FCm comprises
breeding (and working) livestock and inanimate fixed capital of infrastructures and equip-
ment used in the livestock farming activity.
The accounting equation for the factorial distribution of TP incorporates the manufac-
tured intermediate consumption (ICm), the labor cost (LC), the consumption of inanimateAgriculture 2021, 11, 214 6 of 38
manufactured fixed capital (CFC), and the manufactured net operating margin (NOM). The
first three factors make up the total cost (TC) of the livestock species and the last production
factor is the operating profit of the owner.
TP = ICm + LC + CFC + NOM. (2)
TC = ICm + LC + CFC. (3)
The official Farm Accounting Data Network (FADN) selects a list of standardized
livestock commercial products (International Standard Industries Classification (ISIC)) and
omits other noncommercial products, which are chosen and valued by the owner when
making livestock investment decisions. The AAS methodology classifies the re-employed
animal commercial raw materials as commercial intermediate products (IRMc), whereas
some of these are recorded as final intra-consumption of the farm in the FADN methodology.
2.2.2. Livestock Noncommercial Intermediate Product of Private Amenity Self-Consumption
In our research applied to agro-silvo-pastoral extensive livestock systems, we veri-
fied the mixed commercial-amenity auto-consumption rationale of the large individual
nonindustrial private landowners in real case studies [10,14,15].
The investments in livestock species which graze the Andalusian dehesas belonging
to large nonindustrial private owners are motivated by the aim of obtaining normal net
operating margins (NOMn). We assume the hypothesis that the owners will accept net
operating margins at basic prices (NOMbp ) below the NOMn in exchange for ensuring the
auto-consumption of private amenities, which would be lost if extensive rearing of their
livestock species were abandoned. This voluntary opportunity cost reveals the implicit
existence of a noncommercial intermediate production of private amenity service (ISSnca)
of livestock farming.
In our articles subsequent to [16], we estimated the ISSnca for this type of livestock
owner. Our hypothesis of the existence of ISSnca assumes that the nonindustrial owner
obtains at least a normal net operating margin (NOMn), and a part of this margin may
correspond to the ISSnca. Thus, in accordance with this hypothesis, by definition, all the
livestock species that incur a net operating margin at basic price (NOMbp ) of less than
the NOMn are seen to be compensated through the ISSnca, founded according to their
voluntarily accepted opportunity costs (VOC).
The official FADN registers the NOMbp but does not allow the incorporation of the
ISSnca when the NOMbp is less than the NOMn in the livestock investments. The AAS
methodology, however, does incorporate the ISSnca and assumes that the ISSnca is used
by the private amenity activity as the input of own ordinary noncommercial intermediate
consumption of services (SSncooa) in the period [4,15,17].
In this study, we assume that the AAS estimates the ISSnca according to the difference
between the NOMn and the NOMbp .
ISSnca = NOMn − NOMbp . (4)
The NOMbp and NOMn are estimated directly. The NOMbp is estimated through
the difference between the total product at basic price (TPbp ) and the total cost (TC). The
NOMn is estimated by simulating a normal operating profitability rate (r) being obtained
for the livestock farming immobilized manufactured capital (IMC).
NOMbp = TPbp − TC. (5)
NOMn = r × IMC. (6)
In our application of the AAS to the case-study dehesas in Andalusia in this research,
we estimated the NOMn applying a normal profitability rate (r) of 3%.Agriculture 2021, 11, 214 7 of 38
2.2.3. Intermediate Consumption
The AAS methodology extends the concept of own intermediate consumption to
include own raw materials of animals and grazing (RMo) along with work in progress
animals (WPu). Livestock rearing on the farm is considered that which is present for at least
6 months, while livestock grazing which remains for less than 6 months is considered as the
final product of grazing. The FADN methodology omits own intermediate consumptions
employed in obtaining livestock products in the period when they are not harvested and
re-employed in the same period by the livestock farming activity (e.g., own grazed fodder).
The livestock work in progress inventoried at the opening of the period and bought during
the period is not included in the intermediate consumption by the FADN, which includes
it in the product, forming part of the change in the animal inventory in the period.
The FADN methodology incorporates the purchases of inputs for use in the livestock
activity as intermediate consumptions and records the period changes in the inventory of
stored products in the total product. The AAS methodology only registers as purchases the
external raw materials used regardless of the date when they were purchased and ignores
the change in stored products in the period.
2.2.4. Forage Unit Livestock Consumption
The value of the grazing consumed (FUg) by livestock for each species present in
the individual case-study farms is estimated through the residual valuation method. This
involves calculating the difference between the total energy requirements (FUt) and the
supplements (FUs) given to the animals in the period, measuring this quantity in forage
units (FU), which refers to the energy content of a kilogram of barley with a humidity
content of 14.1% and totals 2723 kcal [18].
FUg = FUt − FUs, (7)
where g is grazing, t is total, and s is supplements.
The calculation of the FUt consumed by the livestock depends on the physical char-
acteristics of the livestock population on the farm, as well as the gestation and lactation
management parameters. Hence, the distribution and weights according to breeds and
ages must be known. This information is gathered from the livestock inventories carried
out at the beginning and end of the studied period. The method used for estimating these
quantities is described in [19].
To estimate the amount of supplements during the year, data provided by the livestock
owners with regard to the supplemented portion per species, together with the period
during which this takes place, are used. All supplementary feed is transformed to FU
content equivalent according to the type of feed [19].
Once the quantity of total forage units consumed by the livestock through grazing
(FUg) in the period is known, it is possible to estimate the standing forage unit price. On
the basis of the price paid for the annual lease of grazing pasture [4,19,20] and the total
quantity of FUg consumed for each farm, the consumed standing forage unit price can
be estimated.
The FU value of the pasture consumed by grazing livestock is considered a consump-
tion of intermediate raw materials from the silvo-pastoral activity [4,15,17]. Grazing is only
considered to have a value lower than or equal to the normal estimated for Andalusia for
each vegetation type and province [19]. If the consumption of FUg exceeds the threshold,
the excess FUg is considered to be free and, therefore, have a price of zero. Grazing con-
sumption by game species is considered to be free as long as it is an open game reserve. In
the case of closed game reserves, where the game species compete with domestic livestock
for food, only the part of the consumption which allows the abovementioned normal
consumption threshold to be reached is considered with economic exchange value, as long
as this threshold has not been reached by the domestic livestock.Agriculture 2021, 11, 214 8 of 38
2.2.5. Total Income
We define the sustainable social income at social price (TIsp, AAS ) of the extensive
livestock species production as the maximum possible consumption of the goods and
services, with and without market prices, produced in the period and appropriated by the
farmer without the final total capital of the livestock activity for the period decreasing in
real terms ([14] p. 87). The indispensable detailed process of accounting records, which
leads to the complete production and capital accounts of the AAS, gives the net value
added at social price (NVAsp, AAS ) and the capital gain (CGsp, AAS ), respectively, which
make up the total sustainable income of the livestock species.
TIsp, AAS = NVAsp, AAS + CGsp, AAS . (8)
2.2.6. Net Value Added
The net value added (NVA) represents the contributions of the labor cost (LC) and
the net operating margin (NOM) services of the immobilized livestock capital to the value
of the total product (TP) in the period. In other words, the NVA is the operating income
embedded in the total product of livestock farming and does not incorporate the capital
gains of the capital account. The net value added (NVA) of the livestock activity is estimated
by the difference between the total product (TP), the intermediate consumption (IC), and
the fixed capital at replacement cost (CFC).
NVA = TP − IC − CFC. (9)
NVA = LC + NOM (10)
The difficulty in estimating the individual economic result for the livestock species is
the need to subjectively attribute the general shared costs and consumption of inanimate
fixed capital. In the case of the costs, the criterion followed is that they should be divided
among the same farm activities proportionally to the direct cost of each. The consumption
of inanimate fixed capital is divided, in the case of infrastructures, according to the weight
of the livestock units, and, in the case of equipment, the attribution is proportional to
the time the equipment is used in the management of the individual species (Text S1,
Supplementary Materials).
2.2.7. Capital Gain
The capital gains (CG) come from the breeding (and working) livestock and from the
inanimate fixed capital of infrastructures (buildings) and equipment. The fixed capital
account for the period records the revaluation (Cr), destructions due to death of the adult
breeding livestock (Cda), and the final inanimate fixed capital (FCic), which is embedded in
the effects of the depreciation (CFCi) and future revaluation/devaluation (CFCri), resulting
from the effect of replacement cost change in the period ([16] Supplementary Text S11,
p. 45). These records allow the livestock capital gain to be estimated as the Cr less the Cda
plus the adjustment of the depreciation (Cadi). The latter comprises the consumption of
fixed capital (CFCi) less its revaluation (CFCri) to avoid it being double-counted in the net
value added ([4] Supplementary Text S1, pp. 4–5).
CG = Cr − Cda + Cadi. (11)
Cadi = CFCi − CFCri. (12)
The capital gains for animals of livestock species relate only to the breeding and
working animals (CGa), and the capital gains of the inanimate capital (CGi) embrace the
infrastructures and equipment employed in the management of the livestock species. TheAgriculture 2021, 11, 214 9 of 38
CG shows the effects on the livestock farming incomes of the changes in the alive and
inanimate fixed capitals of the extensive management of the livestock species.
CG = CGa + CGi. (13)
In the AAS methodology, the sales of breeding and working (draught, denoting
an animal used for pulling heavy loads) livestock fixed capital are incorporated in the
capital gain only according to their revaluation in the period, as opposed to the FADN
methodology which includes the sales of breeding and draught livestock in the total
product. The revaluations of alive (CGra) and inanimate (CGri) manufactured fixed
capitals employed in the productions of livestock species are incorporated in the capital
gains (CG) estimated by the AAS. The destructions of livestock fixed capital (Cda) figure
in the inventory implicitly changes in the total product of the FADN methodology. The
AAS deducts the Cda from the revaluations (CGra) according to the opening inventory or
purchase values in the period used for estimating the capital gain (CGa). Although the
FADN methodology estimates the live fixed capital gain (CGa), it omits the inanimate fixed
capital gain (CGi) of buildings and equipment. However, they are not completely omitted
as the consumptions of inanimate fixed capital are incorporated in the net value added
according to their replacement price (CFCirp ).
The AAS methodology excludes Common Agricultural Policy (CAP) payment quo-
tas from the fixed capital (FC) and it does not estimate the financial liabilities or the
total capital (C) at the close of the period coinciding with the net worth (NW). The de-
tails for the distribution of inanimate fixed capital per species can be found in Text S1
(Supplementary Materials).
2.2.8. Net Operating Margins at Producer, Basic, and Social Prices
The FADN methodology estimates the net operating surplus/margin (NOM) at pro-
ducer price (pp) and basic price (bp). In addition, the AAS methodology also estimates the
NOM at social price (sp).
The normal net operating margin (NOMn) represents the lower limit of the net op-
erating margin of the livestock farming, which is based on the hypothesis of voluntary
opportunity cost of the livestock investment incurred in the period by the owners. The
residual net operating margin at producer price (NOMpp ) is that which is derived from
the observed and simulated market transactions of the livestock products generated in the
period. The NOMpp , which excludes the noncommercial intermediate products of services
(ISSnc), is estimated by the difference between the total product at producer price (TPpp )
and the total cost at producer price (TCpp ) of the livestock species. The NOMbp is obtained
when the FADN government compensations, reclassified in the AAS as the noncommercial
intermediate product of compensation services (ISSncc), are added to the NOMpp .
NOMpp = TPpp − TCpp . (14)
NOMbp = NOMpp + ISSncc. (15)
In cases where the NOMbp exceeds the NOMn, the NOMbp and the NOMsp coincide.
NOMsp = NOMbp , if NOMpb ≥ NOMn. (16)
The FADN does not estimate the net operating margin at social price (NOMsp ) in cases
where the net operating margin at basic price (NOMbp ) does not exceed the normal net
operating margin (NOMn). In this situation, the AAS methodology incorporates the ISSnca
leading to the valuation of the AAS net operating margin at social price (NOMsp,AAS ).
NOMsp,AAS = NOMbp,AAS + ISSnca, if NOMpb,AAS < NOMn. (17)Agriculture 2021, 11, 214 10 of 38
2.2.9. Comparison of the FADN and AAS Net Values Added
Below, we describe the conceptual integration of the net values added under the
Farm Accounting Data Network (FADN) and Agroforestry Accounting System (AAS)
methodologies at basic prices and social prices. In the applications of the FADN, the
estimates are not observable for livestock species as they are applied to the aggregate
activities of the farm. The FADN methodology does not estimate the factorial distribution
of the net value added of the livestock species among the production factors of labor and
manufactured capital since the net mixed income (NMIbp, FADN ) is not separated into its two
components of self-employed labor cost (LCse) and net operating surplus (NOSbp,FADN ).
In contrast, the AAS methodology does present the factorial distribution of the net value
added since it separates the net mixed income (NMI) into the components of imputed self-
employed labor compensation (LCseNMI ) and normal manufactured net operating margin
(NOMnNMI ) [4,10]. We refined the FADN in order to estimate the factorial distribution of
the net value added of the farm under this system.
NVAbp,FADN = LCseFADN + NOSbp, FADN + NMIbp, FADN . (18)
NVAbp,rFADN = LCrFADN + NOMbp, rFADN . (19)
The FADN methodology presents the aggregate results for the farm activities in which
the total product of the livestock farming activity directed at a specific type of production
predominates. Although the FADN does not present results for the livestock activity
income of the farm, we make this income visible in order to compare the concepts of
income from the extensive livestock activity with those of the Agroforestry Accounting
System (AAS).
The official FADN methodology, unlike the academic AAS, does not incorporate the
noncommercial intermediate product of government compensation services (ISSncc) and of
private amenity self-consumption (ISSnca) in the total product (TP) of the livestock species.
However, the FADN does incorporate the ISSncc in the net value added at basic price.
The variation in the value of the livestock species inventories net of livestock purchases
in the period is considered in the FADN as a final product [5] (the FADN methodology also
includes the change in stored inventory net of purchases which we omit in this comparison).
The AAS does not register the net variation of the livestock inventories in the final product;
rather, the value of the livestock census at the end of the current period (GWPCFa) and of
the completed renewal of breeding livestock (GFCFa) are registered as final products of
own-account gross capital formation (GCFa) in the period. At the opening of the period, the
initial value of the livestock species work in progress inventories and the purchases of this
type of livestock are registered in the AAS as a manufactured intermediate consumption
cost of the period (WPmu). The previously mentioned livestock species inventory and
purchase records in the production account of the AAS have the effect of excluding the
capital gain of the breeding livestock (CGa) from the value added, in contrast to the FADN
which does include it in the value added. However, the CGa is included by the AAS in the
estimation of the total capital gain of the livestock activity (CG). The FADN does not count
the own-account gross formation of inanimate fixed capital (GFCFi) of infrastructures and
buildings and its corresponding total cost of inanimate investments (TCii) for the livestock
species. The FADN excludes own grazing raw materials (RMog) from the livestock species
intermediate consumption.
The differences in the results for the values added under the AAS and FADN method-
ologies are due to the net effects of the production account records for ISSnca, livestock
inventories, own-account gross investments in infrastructures and buildings, and interme-
diate consumptions of own grazing raw materials.
NVAbp,FADN = NVAsp,AAS − ISSnca − GFCFi + RMog + TCii + CGa. (20)
GFCFi = TCii. (21)Agriculture 2021, 11, 214 11 of 38
NVAbp,FADN = NVAsp,AAS − ISSnca + RMog + CGa. (22)
The livestock species net value added at basic price under the official FADN method-
ology (NVAbp,FADN ) can be considered an incomplete and inconsistent concept of the
total income of the livestock activity at basic price. It is incomplete because it omits the
intermediate consumption of grazing and the labor cost of own-account gross investment
in infrastructures and buildings. This conclusion refers to the concept of net value added
of the livestock activity, but not to its practice as it is not measured in the FADN. The
aggregate value added of the national/sub-national products and of the farms does not
incur the bias of incorporating grazing as it is only counted once in the livestock products
and not as an intermediate product. The conceptual inconsistency of the FADN is due to
the fact that it incorporates the fixed capital gain of breeding livestock.
The factorial distribution of the AAS net value added at social price (NVAsp,AAS )
among the labor cost (LCAAS ) and the net operating margin at social price (NOMsp,AAS ) is
inevitably subjective in its components of self-employed work and the ISSnca. In the AAS
valuation, self-employed work is rewarded with a maximum marginal hourly remuneration
of 80% of the market remuneration for the same task done by employee labor [10]. Similarly,
a subjective choice of normal profitability rate is necessary to estimate the ISSnca.
NVAsp,AAS = LCAAS + NOMsp,AAS . (23)
2.2.10. Profitability Rates
The operating profitability rates (Po) and capital gain (Pg) are estimated according to
the ratios between the net operating margin (NOM) and the capital gain (CG) over the live-
stock immobilized capital (IMC) in the period. The total profitability rate (P) of the capital
income (CI) of the livestock activity is estimated by the sum of both profitability rates.
IMC = Co + 0.5 × (Cb + TC − RMo − WPu − CFC − FPs − Cs), (24)
Po = NOM/IMC, (25)
Pg = CG/IMC, (26)
P = CI/IMC, (27)
where Co is the opening capital, Cb is the capital bought (purchases), RMo is the own raw
materials consumed in the production process, FPs are the final products sold, and Cs are
the sales of capital occurring during the accounting year.
The Po rate is estimated subjectively, except where no self-employed labor is used
and the net operating margin at basic price (NOMbp ) exceeds the simulated normal net
operating margin (NOMn).
The livestock farm landowners risk their investment in livestock taking into account
the overall result with other economic activities in the dehesa. However, the non-land-
owning livestock farmers who lease the grazing land risk their investment taking into
account only the results for the game species and ignoring the non-compensated effects
of the livestock on the biophysical and economic results of the remaining activities on the
farms which their livestock graze. In this research, the biases which may be incurred in the
measurements of livestock profitability rates of large dehesa owners are canceled out in the
exchanges among the activities linked to livestock, grazing, and private amenity. Thus, the
operating profitability rate at basic price (Pobp,D ) of the private activities of the dehesa as a
whole is not affected by the incorporation of the noncommercial intermediate production
of amenity services (ISSnca) of livestock species, coinciding with the operating profitability
rates at basic price (Posp,D ) and social price (Posp,D ). The incorporation of the ISSnca of
the dehesa owner has the effect of increasing and decreasing, by the same amount, the
net operating margins of the livestock activity and private amenity, respectively [4,15,17].
Consequently, the operating profitability rates of the livestock farming at basic price (Pobp,li )Agriculture 2021, 11, 214 12 of 38
and social price (Posp,li ) do not coincide. The latter results from adding the profitability
rates of livestock species private amenity self-consumption (Poali ) to the former.
Pobp,D = Posp,D , (28)
Pobp,li 6= Posp,li , (29)
Poali = ISSnca/IMClli , (30)
Pospli = Pobp,li + Poali , (31)
Posp,li = NOM sp,li /IMCli , (32)
where IMCli is the immobilized capital of the livestock species, and NOM sp,li is the net
operating margin of the livestock species.
The estimates of the Pobp,li are objective in the case of the dehesa owners. The normal
operating profitability rate (Ponli ) is not applicable in situations where the normal net
operating margin of the livestock species (NOMnli ) is equal to or less than the net operating
margin at basic price (NOMbp,li ); in this case, the ISSnca is zero and the Pobp,li and Posp,li
coincide, both being equal to or more than the Ponli . As long as NOMnli ≥ NOMbp,li , then
the ISSnca is applicable and the Posp,li and Ponli do not coincide.
2.2.11. Ordinary Cash Flow
The real management of the livestock species is conditioned by the monetary flows of
revenues net of expenditures, which can lead to notably different values to those of the
livestock species incomes in the same period. Although the ordinary cash flow (CFo) (in-
cluding the annualized compensations and purchases of fixed capital, but not the incomes
and payments of medium- and long-term loans received) does not signify direct income;
instead, it shows the capacity of production at basic prices of the livestock species in the
period in order to finance the costs of external production factors. The components of the
monetary revenues (R) considered are the sales (S), commercial amenity self-consumption
(Ac), and the noncommercial intermediate production of compensated services (ISSncc)
of the government. The components of the expenditures (E) are the intermediate con-
sumptions of the raw materials (RMb) and services (SSb) purchased, the head of livestock
purchased (Cbli), employed labor cost (LCe), and inanimate consumption of fixed capital
(CFC) in representation of ordinary bought inanimate fixed capital (FCb).
CFo = R − E. (33)
R = S + Ac +ISSncc. (34)
E = RMb + SSb + Cbli + LCe + CFC. (35)
3. Results
In this section, we focus on describing the average absolute economic results with
reference to livestock units in the case of the head of livestock along with the bee hives
on the large nonindustrial privately owned individual case-study dehesas in Andalusia.
However, the results for the livestock species are also aggregated in relative terms compared
with the livestock farming activity and the private activities as a whole of the case-study
dehesa owners.
The selected economic results for the livestock species estimated by applying the
AAS methodology to the case-study dehesas are livestock species stocking rates, livestock
species forage units grazed, livestock species units per annual work units, government
compensation and private amenity noncommercial intermediate products of services, final
product sales, bought and own commercial intermediate consumption of raw materials,
consumption of inanimate fixed capital, net value added at basic and social prices, em-
ployee and self-employed labor costs, net operating margin at basic and social prices, totalAgriculture 2021, 11, 214 13 of 38
incomes at basic and social prices, operating cash flow at basic price, live and inanimate
capital gains, and operating and total profitability rates at basic and social prices.
The notable effort required for daily monitoring of the time spent on tasks for
each individual livestock species, in terms of both labor and machinery, may affect the
lack of economic results published for overall productions in real case studies of silvo-
pastoral and agroforestry farms such as the private dehesas in this study. The primary data
for this research came from the RECAMAN (Renta y Capital de los Montes de Andalucía)
project [15–17,20,21] (Additional information which readers may consider necessary to
better understand the results of this research can be requested from the authors).
The absolute economic indicators for the livestock species are presented with reference
to livestock units (LU) in the cases of ruminant species and horses; Montanera fattened
head for Iberian pigs; sold head for suckling pigs; and hives in the case of bees. LU are
estimated as a coefficient of the annual energy requirements of an empty “Retinta” cow
with a weight of 450 kg [22]). A LU is equal to an annual requirement of 5171.32 Mcal of
metabolizable energy (For meat cattle, sheep, and goats, it is equal to the equivalent LU
of adult breeders. For fighting bulls and horses, it is the equivalent LU of animals older
than 1 year). The values recorded in the production and capital accounts for the livestock
activity are presented per hectare of the total aggregate of the case-study dehesas.
We organize the analysis of the production management and economic results by first
presenting the eight classifications of species reared on the case-study dehesas, with two
bovine and porcine variants. The second part of this section reveals the contribution of the
livestock activity to the economy of the nonindustrial farmers of the large private dehesas in
the case study.
3.1. Livestock Species Production Management and Economic Results
3.1.1. Meat Cattle
Dehesas with cattle, where production is directed toward calf rearing for sale after
weaning at around 4–7 months, contributed 14.6% of the 0.44 LU/ha opening livestock
stocking rate in the 21 case-study private dehesas in 2010 (Table 1). The native breeds reared
are the “Retinta”, the “Andalusian Berrenda en Negro” and the “Andalusian Berrenda en
Colorado”. The foreign breeds crossed with native cattle are the Limousin and the Charolais.
There are also other foreign breeds such as the Simmenthal-fleckvieh (Table S1, Supplemen-
tary Materials). The labor employment ratio is 92.6 LU/AWU (annual work unit (AWU)
is equivalent to 1826 h worked per year [23]) (Table 2 and Table A2, Appendix A). Meat
cattle are those with the lowest dependence on supplementary feed, with grazing (FUg)
accounting for 72.1% of the total consumption of metabolizable energy in 2010 (Table 3).
However, there are cases where, despite free grazing of animals, the dependence on supple-
mentary feed is very high due greater inclination of the owner toward recreational rather
than livestock production activity (Table S2, Supplementary Materials). The extensive
management and coarseness of the grazing forage is reflected in the moderate ratios of
births and sales of calves and in the high culling ratio, per breeding female (fb) (Table 4
and Table S2, Supplementary Materials).
Of all the ruminant and equine species compared, the meat cattle activity is that which
contributes the intermediate production of compensation services of greatest value per
livestock unit (LU). In this respect, it is the third in terms of provision of self-consumed
private amenity, sales of livestock products, and intermediate consumptions of raw ma-
terials and services purchased, per LU in all cases (Table 5 and Table A3, Appendix A).
Own grazing per LU is also greatest and is 1.8 times greater than that of the next ruminant
species (Table 5). It is the third species, whether ruminant or equine, in terms of use of
inanimate capital investment per LU (infrastructure and equipment), as reflected by the
inanimate fixed capital consumption value (amortization). This species also occupies third
place in the contribution to the net value added, labor, and net operating margin per LU
(Table 5 and Table A3, Appendix A). It is second among the ruminant and equine species
with regard to the intensity of immobilized capital (IMC) and capital losses (CG), in bothAgriculture 2021, 11, 214 14 of 38
cases per livestock unit. The CG losses are the consequence of adult livestock mortality
and decreasing prices of livestock, buildings, and equipment in 2010 (Tables 5 and 6, and
Table A4, Appendix A). The total income per LU is the third largest among the ruminant
and equine species (Table 5). Furthermore, the ordinary cash flow is the third largest
negative value (Table 5 and Table A5, Appendix A). The operating profitability rate at basic
price is negative and, after incorporating the private amenities, reaches a value of 3.5% at
social price (Table 7). The high volatility of livestock capital gain means that there is little
point in drawing conclusions from the results of a single period (Table 7).
Table 1. Livestock species stocking rate for large privately owned case-study dehesas in Andalusia (2010).
Class Dehesas (n) Stocking Rate (LU/100 ha)
Meat cattle 12 6.4
Fighting bulls 2 12.3
Sheep 8 3.0
Goats 6 1.6
Montanera pigs 9 10.0
Extensive piglets 1 0.0
Horses 8 2.1
Total 21 44.0
Source: Own elaboration. Abbreviations: n is the number of dehesas with the presence of this species more than
6 months per year (total = 21); LU is the livestock unit. Notes. A livestock unit (LU) is estimated as a coefficient
of the annual energy requirements of an empty red cow with a weight of 450 kg [22]. An LU is equal to an
annual requirement of 5171.32 Mcal of metabolizable energy. For meat cattle, sheep, and goats, it is equal to the
equivalent LU of adult breeders. For fighting bulls and horses, it is equal to the equivalent LU of the animals
older than 1 year. For montanera pigs, it is equal to the equivalent LU of the average number of Iberian pigs in
montanera per year and dehesa. Absolute stocking LUs are as follows: meat cattle, 988 LU; fighting bulls, 1896 LU;
sheep, 465 LU; goats, 241 LU; montanera pigs, 1536 LU; extensive piglets, 7 LU; horses, 330 LU. The total area of
case-study dehesas is 15,372 hectares. The average area of case-study dehesas is 732 hectares.
Table 2. Livestock species annual labor and ownership for large privately owned case-study dehesas in Andalusia (2010).
Ratios
Class Unit (u) Livestock Owners (n)
Labor (u/AWU) Ownership (u/n)
Meat cattle (n = 12) LU 12 92.6 82.3
Fighting bulls (n = 2) LU 2 137.0 947.9
Sheep (n = 8) LU 8 111.4 58.1
Goats (n = 6) LU 6 33.5 40.2
Montanera pigs (n = 9) heads (1) 9 350.0 306.4
Extensive piglets (n = 1) heads sold 1 162.9 93.0
Horses (n = 8) LU 8 42.3 41.3
Bees (n = 5) hives 5 586.5 138.0
Source: Own elaboration. Abbreviations: n is the number of dehesas with the presence of this species more than 6 months per year (total = 21);
LU is the livestock unit; AWU is the annual work unit. Notes: (1) Average number of Iberian pigs in montanera per year and dehesa. A
livestock unit is estimated as a coefficient of the annual energy requirements of an empty Retinta cow with a weight of 450 kg [22]. An LU is
equal to an annual requirement of 5171.32 Mcal of metabolizable energy. For meat cattle, sheep, and goats, it is equal to the equivalent LU
of adult breeders. For fighting bulls and horses, it is equal to the equivalent LU of the animals older than 1 year. Absolute unit measures
are as follows: meat cattle, 988 LU; fighting bulls, 1896 LU; sheep, 465 LU; goats, 241 LU; montanera pigs, 2758 heads; extensive piglets,
93 heads; horses, 330 LU; bees, 690 hives. An annual work unit is equivalent to 1826 h worked per year [23]. The total area of case-study
dehesas is 15,372 hectares. The average area of case-study dehesas is 732 hectares.Agriculture 2021, 11, 214 15 of 38
Table 3. Livestock species grazing forage unit consumption and supplements in large privately owned case-study dehesas in
Andalusia (2010: %).
Grazing Supplements Total
Class Grass and Browse Acorn Total
Commercial Free Total Commercial Free Total Commercial Free Total
Meat cattle (n = 12) 64.0 8.1 72.1 64.0 8.1 72.1 27.9 100
Fighting bulls (n = 2) 43.5 3.8 47.3 43.5 3.8 47.3 52.7 100
Sheep (n = 8) 46.4 5.4 51.8 3.2 3.2 49.7 5.4 55.1 44.9 100
Goats (n = 6) 11.7 5.5 17.2 1.3 1.3 13.0 5.5 18.6 81.4 100
Montanera pigs (n = 9) 14.9 0.5 15.4 15.4 15.4 30.3 0.5 30.8 69.2 100
Extensive piglets (n = 1) 15.7 15.7 15.7 15.7 84.3 100
Horses (n = 8) 19.4 0.3 19.8 19.4 0.3 19.8 80.2 100
Total (n = 21) 34.0 3.7 37.7 5.1 5.1 39.1 3.7 42.8 57.2 100
Source: Own elaboration. Abbreviations: n is the number of dehesas with the presence of this species more than 6 months per year (total = 21).
The total area of case-study dehesas is 15,372 hectares. The average area of case-study dehesas is 732 hectares.
Table 4. Livestock yield ratios and prices for large privately owned case-study dehesas in Andalusia (2010).
Class Unit (u) Baseline Unit (bl) Ratio (u/bl) Mean Price (EUR/u)
Birth
Meat cattle (n = 12) he fb 0.6 277.6
Sheep (n = 8) he fb 1.1 52.9
Goats (n = 6) he fb 0.9 35.0
Fighting bulls (n = 2) he fb 0.6 226.9
Sales
Meat cattle (n = 12) he fb 0.5 474.3
Sheep (n = 8) he fb 1.0 53.2
Goats (n = 6) he fb 0.7 34.8
Montanera pigs (n = 9) arroba (1) he (2) 5.4 19.6
Fighting bulls (n = 2) he fb 0.4 1475.2
Culling (breeders)
Meat cattle (n = 12) he fb 0.2 491.8
Sheep (n = 8) he fb 0.1 21.9
Goats (n = 6) he fb 0.2 11.6
Fighting bulls (n = 2) he fb 0.1 143.1
Source: Own elaboration. Abbreviations: n is the number of dehesas with the presence of this species more than 6 months per year (total = 21);
he is the number livestock heads; fb is the number of heads of female breeders. Notes: (1) Iberian pigs gain of weight during montanera
fattening (1 arroba is 11.5 kg); (2) average number of Iberian pigs heads in montanera per year and dehesa. Absolute baseline unit measures
are as follows: meat cattle female breeders, 813 heads; sheep female breeders, 2997 heads; goat female breeders, 1632 heads; fighting
bull female breeders, 417 heads; montanera pigs, 2758 heads. The total area of case-study dehesas is 15,372 hectares. The average area of
case-study dehesas is 732 hectares.You can also read