National Beef Conference 2019 - Teagasc 'Irish Beef - A Changing Landscape'
←
→
Page content transcription
If your browser does not render page correctly, please read the page content below
Animal &
                                        Grassland Research
                                        & Innovation
                                        Programme

Teagasc
National Beef
Conference 2019
‘Irish Beef –
A Changing Landscape’

Tuesday, 10th December
McWilliam Park Hotel, Claremorris, Co. Mayo
Teagasc National
   Beef Conference 2019

          ‘Irish Beef –
     A Changing Landscape’

                 Compiled and edited by:
Paul Crosson, Aidan Murray and Loreto Ferguson, Teagasc

                    Published by

            Tuesday, 10th December
   McWilliam Park Hotel, Claremorris, Co. Mayo
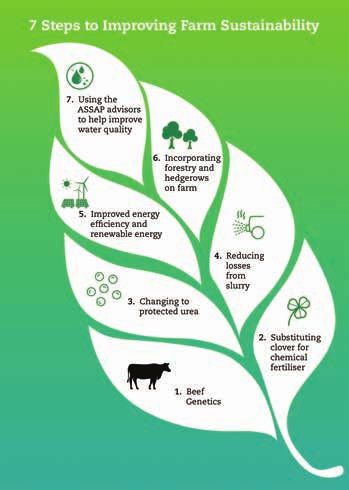
2 | Teagasc National Beef Conference 2019

Table of Contents

Programme                                                               3

Foreword                                                                4

International markets of growing importance
  for Irish beef and livestock                                          5
  Joe Burke, Bord Bia

The role of efficiency in suckler beef production                       10
  Alan Dillon, Teagasc, Aidan Murray, Teagasc & Paul Crosson, Teagasc

BDGP & BEEP; key initiatives that are helping deliver
greater profit and sustainability for our suckler beef farmers          18
  Dr. Andrew Cromie, ICBF

The genetics of meat eating quality – what can be achieved?             24
  Dr. Donagh Berry, Teagasc

Improving Farm Sustainability                                           38
  Teagasc
‘Irish Beef – A Changing Landscape’ | 3

Programme

6:00pm              Welcome:
                    Vivian Silke, Teagasc Regional Manager, Mayo

6:10pm              Opening Address:
                    Professor Gerry Boyle, Teagasc Director

                    ‘Irish Beef – A Changing Landscape’
                    Chaired by:
                    Ger Ryan, Dovea

6:20pm              New Markets for Irish Beef
                    Joe Burke, Bord Bia

6:45pm              Suckler Efficiencies in Practice
                    Alan Dillon, Teagasc

7:10pm              Beef Data Genomics Programme (BDGP)
                    Beef Environmental Efficiency Pilot (BEEP)
                    Dr. Andrew Cromie, ICBF

7:35pm              Genetics of Beef Eating Quality
                    Dr. Donagh Berry, Teagasc

                    ‘Beef – Facts and the Future’
Panel Discussion:   Facilitated by Adam Woods, Beef Editor, Irish Farmers Journal

Panel participants Dale Crammond, Department of Agriculture Food & The Marine
include:           Kevin Hanrahan, Teagasc
                   Senator Ian Marshall
                   Bernie Earley, Teagasc

Topics Covered:     Meeting Requirements for Climate Change
                    Contribution of the Cattle Sector to the Rural Economy
                    Brexit and Beef
                    Animal Welfare

9:00pm              Close of Conference
                    Professor Tom Kelly, Director of Knowledge Transfer
4 | Teagasc National Beef Conference 2019 Foreword ‘Irish Beef - A Changing Landscape’, the theme for this year’s conference, is very apt as there are many challenges facing all involved in cattle production in Ireland. We all know them; low average income levels on cattle farms, the drop in cattle prices in 2019, the threat of market disruption from Brexit in the future, and the challenge facing Irish agriculture to reduce its greenhouse gas emissions. But we can also point to some positives; 2019 was a good grass growing year which resulted in lower spending on feed and fertilizer, some new markets opened for Irish beef like China, a reduction in global pigment supplies is having a positive impact on other meats such as beef, and additional financial support was provided for farmers through Beef Data Genomics Programme (BDGP) and the Beef Environmental Efficiency Pilot (BEEP). Through our ever increasing knowledge of genetics, we are improving our understanding of the genetics of beef eating quality. There was a modest recovery in cattle farmer incomes in 2019 after the extreme weather related additional costs of 2018. The Teagasc Rural Economy department are predicting that average gross margins on the cattle rearing enterprises and cattle finishing enterprises increased by 8 per cent and 9 per cent respectively in 2019. In the absence of the BEAM and BEEP schemes, the gross margins on the cattle rearing enterprise and cattle finishing enterprise would have declined by 11 and 13 per cent respectively in 2019. While the threatened disruption to beef markets from Brexit still faces the sector, global beef demand is expected to grow in 2020 with China and Brazil both playing important roles in rising consumption levels and helping to underpin global beef prices. The Teagasc / Irish Farmers Journal BETTER Farm Beef programme will be finishing up at the end of 2019. Teagasc will continue to provide support to the participating farmers for 2020. The lessons learned over the last 10 years, during three phases of the programme, have been substantial, and I thank all of the farmers who participated over that period for making their information available to all cattle farmers to learn from, and utilise. Teagasc will be introducing a new beef extension programme in the future, which will embrace both the economic and the environmental sustainability challenges facing the sector. As the spring approaches, and the peak calving period is nearly upon us, there is a need for all farmers to maintain high standards of welfare for all animals in their care. I would like to thank my colleagues for organising this conference and I expect you will get some really practical and useful take home messages to improve your own farm business. Gerry Boyle. Teagasc Director
‘Irish Beef – A Changing Landscape’ | 5

       International markets of
     growing importance for Irish
          beef and livestock
                                 Joe Burke
                      Meat & Livestock Manager, Bord Bia

    Summary
  • Beef prices have fallen in Ireland in 2019; for example the R3 steer price
     has fallen by 6.5%. Similar price decreases have occurred in the UK (7%)
     and continental Europe (5%).
  • Over the last number of years Irish cattle prices have generally moved
     closer to and exceeded EU average male cattle prices. In 2010 Irish R3
     steers were 91% of the EU-15 R3 male cattle average. In 2018 this figure
     was 101%.
  • As part of the commitments to the Beef Sector Taskforce Bord Bia now
     provides a “Beef Market Tracking” report which provides the following
     three market indicators; the Export Benchmark Price indicator, the US
     By-product Market Indicator and the Beef Market Price Index.
  • For the year to-date, total slaughterings have decreased by 60,000 head
     when compared to 2018 to 1.57 million cattle. Correspondingly, Irish beef
     exports look set to decline slightly in volume terms for 2019.
  • Live exports of cattle from Ireland increased by more than 20% in
     comparison with 2018, and are likely to reach 300,000 head by the year-
     end. Calf exports in particular reached new record levels, are will account
     for approximately two thirds of total live exports in 2019.

Cattle Prices
To-date in 2019 Irish steer prices have fallen by 6.5% ,or 25 cent per kilogramme
behind last year’s levels, with returns averaging €3.62/kg (excl. VAT) for R3 grade
steers (Figure 1). By comparison, UK R3 steer prices have fallen by 7% relative to
2018, at €3.88/kg, whereas the average R3 Young Bull price around continental
Europe has averaged €3.60/kg for the year to-date. This was 5% lower than the
same period last year, and marginally below the Irish R3 steer price.
6 | Teagasc National Beef Conference 2019
450
400
350
300
250
M
No
Au
Ju
M
Ap
Ja
Oc
Se
Fe
Ju
ar
ay
n
p
b
n
g’
v’
t’
l ’1
r’
’19
’19
’19
’19
’19
’19
19
19
19
19
9
UK R3 Steer Ireland R3 Steer EU 15 R3 Young Bull
Figure 1. Producer Prices: Ireland vs. UK & Continental EU (c/kg excl. VAT)
During recent weeks, there has been some recovery in the carcase prices reported by
the EU Commission across key markets. For example, UK R3 steer prices averaged
£3.34/kg sterling for week ending 17th of November. Although the increase was
just £0.03p/kg on previous weeks, the value of sterling had also strengthened by
3% over the same period. As a result, in Euro terms the average UK R3 steer price
reached €3.86/kg, representing a 5% improvement (+€0.19/kg) since mid-October.
Meanwhile, the average European price for R3 young bulls has also recorded some
recovery in recent weeks, to €3.61/Kg. By comparison, the Irish R3 steer price has
been relatively static at €3.43/kg (excl VAT).
Over the last number of years Irish cattle prices have generally moved closer to
and exceeded EU average male cattle prices. In 2010 Irish R3 steers were 91% of
the EU-15 R3 male cattle average. In 2018 this figure was 101%. Irish steer prices
have reached or exceeded the EU average in six of the years since 2010. It is worth
remembering that between 2000 and 2009 Irish prices only reached the EU average
in one of those years.
Market Tracking
One of the commitments under the recently-established Beef Sector Taskforce
involves the tracking of market trends over time with regard to the prices of beef
cattle, meat cuts at wholesale and retail level and 5th quarter products. Visitors
to Bord Bia’s website will now see a concise report under “Beef Market Tracking”
summarising each of the main elements on an ongoing basis. This can be accessed
at https://www.bordbia.ie/beef-market-tracking/ and comprises the following
components:‘Irish Beef – A Changing Landscape’ | 7 1. The Export Benchmark Price is a market indicator which takes account of the prevailing cattle prices for the different carcase categories and grades, across the main EU markets for Irish beef (including the UK, France, Italy, Germany, the Netherlands and Sweden), as reported by the European Commission. Essentially, this equates to the average price that Irish producers would theoretically receive, if their cattle were priced according to the prevailing carcase prices across the primary export markets. The Export Benchmark Price is tracked against the actual average price per kilo paid for all animals slaughtered in Ireland on a weekly basis. 2. The US By-product Market Indicator summarises the latest market trends in the hide and offal markets, as reported by USDA. These by-products contribute to the overall value returned from the market, and therefore they influence the demand for finished cattle by beef processors. While there are no published prices for Irish or EU hides or offal products, regular reports are available from the USDA. Because these are globally traded commodities, the US data provides a reasonable reflection of market trends. 3. The Beef Market Price Index looks at the price performance of prime beef in key markets over time, at the level of the retail or wholesale customer. The index acts as a monthly indicator of market conditions for Irish beef, relative to the situation prevailing during the initial base period of this study, which was September 2019. Each month, Bord Bia monitors specific retail and wholesale prices across seven principal markets (Ireland, the UK, France, Italy, the Netherlands, Germany and Sweden) which collectively account for over 90 percent of Irish beef sales (2018). Market prices are weighted according to their relative importance, and collated into a Retail Sub-Index and a Wholesale Sub-Index, whose values are aggregated to form an Overall Beef Market Index. Cattle Supplies For the most recently available week ending 23rd of November, cattle throughput at export meat plants reached its highest level for the year to-date, of 39,500 head (Figure 2). However, this figure remains slightly below the equivalent week in 2018, when 40,300 cattle were processed. For the year to-date, a total of 1.57 million cattle have been slaughtered, which represents an overall decline of 60,000 head compared to the same period last year. At the beginning of August, prior to the factory protests, throughput levels had been running more than 40,000 head ahead of 2018 levels. However the subsequent disruptions resulted in a considerable backlog in finished cattle supplies which is likely to continue into 2020. Collectively for the year to-date, throughput of steers is running 7.5% (-46,000 head) lower, while cow supplies are back by 13% (-47,000 head). These declines are partly offset
8 | Teagasc National Beef Conference 2019

by higher numbers of heifers (+4% / +18,000 head) and young bulls (+4% / +7,500
head) being processed. Average carcase weights have increased by approximately
1.5% in 2019, which was helped by favourable grazing conditions across most
regions.

      40,000
      35,000
      30,000
      25,000
      20,000
      15,000
      10,000
        5,000
           0
                Ja     Fe    M     Ap    M      Ju     Ju     Au     Se        Oc     No    De
                   n     b    ar     r    ay      ne     ly      g        pt      t     v      c

                                               2019                        2018

Figure 2. Irish weekly finished cattle supplies for 2018/19 (head of cattle)

Beef Exports
As a result of the lower production, Irish beef exports look set to decline slightly in
volume terms for 2019. There have been notable developments with regard to the
key export markets. Trade data from the CSO (Central Statistics Office) for the first
nine months of the year shows a dramatic 9% decline in Irish beef exports to our
main market, the UK, which reflected weaker demand, particularly at foodservice
level. Looking at the UK’s import statistics from AHDB, overall imports of beef into
the market are down even more significantly, by 13%, so Irish beef now occupies an
80% share of the UK’s total beef imports, up from 76% last year.
In response to the reduction in Ireland’s beef exports to the UK, there has been
a steady increase in exports into most of the continental EU markets. Increased
trade has been recorded to key markets such as Germany (+15%), the Netherlands
(+11%), Italy (+9%) and France (+8%). Following several years of stable or slightly
rising consumption across Europe, it is estimated that the overall consumption
of beef is likely to have fallen by 1% during 2019. This reflects some challenges to
the beef category across several markets, along with an estimated 8% increase in
exports of European beef and live cattle from non-EU markets.
‘Irish Beef – A Changing Landscape’ | 9 Irish beef exports into international markets have grown significantly, and are likely to reach 60,000 tonnes for the year, more than double the level recorded in 2018. Key destinations include the Philippines, China, Hong Kong and the United States. Looking forward to 2020, supply issues in key global markets look set to drive demand for all of the major meat proteins. Asian markets in particular will demand further increases in their beef imports, thereby presenting opportunities for Irish exports, both directly and indirectly. Live Exports Exports of live cattle from Ireland increased by more than 20% in comparison with 2018, and are likely to reach 300,000 head by the year-end. Calf exports in particular reached new record levels, making up almost 200,000 head. This represented a 25% increase year on year. The two principal markets for Irish calves are the Netherlands and Spain, followed by France, Belgium and Poland. In relation to exports of other categories of livestock, adult or finished cattle numbers grew by 33%, while weanlings recorded an 11% increase. Exports to Northern Ireland have risen by almost 50%. These comprise mainly of finished cattle for slaughter as well as some dairy heifers and cows. Exports to Italy have also seen a 27% percent recovery. The Turkish market has been quite subdued, as a result of weakening in their currency and a slowdown by the Turkish Ministry for Agriculture in the issuing of import licences. However, some further shipments of Irish young bulls are planned for the Turkish market over the coming months, along with additional consignments being assembled for export to Libya.
10 | Teagasc National Beef Conference 2019

           The role of efficiency
        in suckler beef production
           Alan Dillon1, Aidan Murray2 and Paul Crosson3
                       1
                        Teagasc, Kilmallock, Limerick.
       2
        Teagasc Advisory Office, Cavan Lower, Ballybofey, Co. Donegal.
                   3
                    Teagasc Grange, Dunsany, Co. Meath.

    Summary
  • Improvements in technical efficiency have led to increases in profitability
     for the top third cohort of suckler calf to beef farmers completing profit
     monitor analysis.
  • When adjusted for beef price increases, the top third have increased net
     margin from €293/ha to €380/ha for the period 2008 to 2018. Premia
     as a percentage of total farm profit has reduced from 63 percent to 57
     percent in this time period.
  • Achieving high live weight gains from grazed pasture is a key target for
     beef farmers; weekly grass budgeting allied to investment in grassland
     infrastructure have led to improvements in gross margin of 78 percent
     for a Co. Galway farmer.
  • A productive cow herd producing a calf per cow annually during a compact
     calving season makes an important component of meeting live weight
     output targets. A Co. Kerry farmer increased net margin by four fold with
     improvements in reproductive performance, including more compact
     calving and a focus on genetics with higher fertility, being a key factor in
     this improvement.
  • Underlying all animal performance is having a healthy herd. Increasing
     the level of vaccination in the herd and making simple modifications to
     cattle sheds to improve ventilation led to improvements in herd health
     outcomes for a Co. Wicklow farmer with net margin improving by 70
     percent during this period.

Introduction
Teagasc have a key role in providing research and advice to improve efficiencies
at farm level. Given the current climate within the sector pushing efficiency is a
difficult sell but it is one aspect that remains within farmers’ control.
‘Irish Beef – A Changing Landscape’ | 11
Clearly, a lack of profitability over a prolonged time period in any sector is a main
concern and threatens the long term viability of that sector. Thus, a review of
profitability in the beef sector was carried out. Teagasc have been completing Profit
Monitors since 2002 and so have amassed a good deal of data over that period.
The data that follows shows that those farmers who have improved their levels of
technical efficiency have been rewarded with greater profitability relative to those
who have not. When ranked on gross margin per hectare, the top third of suckler to
beef farmers represent those who have improved their efficiency on a per livestock
unit basis and consequently on a per hectare basis; the gap between this cohort of
farmers and the bottom third has widened.
Table 1 compares the top third of suckler to beef farms in the profit monitor
dataset for the years 2008 and 2018. The first striking feature is that they have
increased stocking rate from 1.95 LU/ha to 2.26 LU/ha on their farms, an increase
16 percent. This has resulted in a 31 percent increase in live weight output per
hectare. Correspondingly, gross output has increased by 60 percent on this group
of suckler farms, reflecting the increase beef price over this period allied to the
increase in live weight output generated. The increase in beef price (R3 steer) for
this time period is approximately 20 percent (Figure 1) and so 2008 data was
adjusted to take account of this price movement and thus, to permit a price-
corrected comparison with 2018 data.
450
400
R3 Steer Price €/kg
350
300
250
200
Jan Feb Mar Apr May Jun Jul Aug Sep Oct Nov Dec
2008 2018
Figure 1. Comparison of R3 Steer beef price in 2008 and 2018 (Source: Bord Bia)12 | Teagasc National Beef Conference 2019
The improved efficiency and output achieved on these farms over the period has
manifested itself in such a way that in 2008 the top third of suckler to beef farms
achieved a net profit from production of just €61/ha and premia accounted for 92
percent of total profit/ha on suckler farms. When adjusted for price and premia
value changes, the revised values are €293/ha and 63 percent, respectively. In 2018
profit from production was €380/ha with premia now making up 57 percent of
total profit/ha. Thus, profit has increased by 30 percent and premia as a percentage
of total farm profit has reduced by 6 pecentage units.
Table 1. Profit monitor data for the top third of farmers in the suckler to beef
category for the years 2008 and 2018. 12008adj represents the 2008 data adjusted
for price conditions prevailing in 2018.
2008 2008 adj1 2018
Number of farms in sample 252 - 203
Stocking rate (LU/ha) 1.95 - 2.26
Live weight output (kg/ha) 637 - 832
Gross output (€/ha) 1,203 1,435 1,921
Gross margin (€/ha) 627 859 965
Net profit (€/ha) 61 293 380
Premia (€/ha) 645 503 503
Total profit (€/ha) 706 796 883
Premia as % of total profit 91% 63% 57%
For the top third of farms they have demonstrated that, with improved efficiency
and cost control, they have been able to deliver more profit from production while
their premia income has been progressively reduced.
What are the key areas of efficiency?
It is clear from the above that, although levels of profitability in the suckler beef
sector are generally low, there is a cohort of farmers who continue to generate
positive net margins by focussing on factors under their own control which can
improve profitability. Indeed the data presented in Table 1 suggests that increases in
profitability were achieved by the top third of farmers with a much reduced reliance
on premia to subsidise farm incomes. To elucidate the factors underpinning this
improvement in technical efficiency, the steps that individual farmers have taken
in the key areas of farm management, grassland, herd health and breeding, were
explored.‘Irish Beef – A Changing Landscape’ | 13 This analysis took the form of three case studies in the respective management areas. While many of the farms that took part in various Teagasc monitor farm programmes have increased stocking rate, in some cases large increases may not be achievable due to a variety of factors such as poor land type, fragmentation or limited labour availability due to off farm employment. However implementing technical improvements at the existing stocking rate can still deliver improvements to profits. Case study 1 – Grassland Management. Irish grassland has the potential to produce high yields of highly digestible herbage due to favourable climate and soil types. The farmers who exploit this opportunity to grow and utilise grass efficiently can achieve a high proportion of grazed grass in the annual feed budget of cattle herd. Turnout date of suckler cows and progeny is a critical element influencing composition of the annual feed budget. Where grass is available and where grazing conditions are appropriate, earlier turnout leads to higher levels of animal live weight gain and increases the proportion of grazed grass in the total farm feed budget and thus, improving profitability (e.g. McGee et al., 2014). Farmer 1 has a 30-cow, autumn calving suckler to weanling herd. He farms 24 hectares of dry free draining land in Co. Galway with progeny sold off grass at approximately 12 months of age. Excellent performance from grazed grass is a critical objective of this farm and thus presenting the cattle with high quality grass swards is a key management aim. In addition to achieving consistent target weight gains for the yearling bulls, this also ensures that heifers reach target breeding weights at 14.5 months and can calve down at an average of 24 months of age, an important factor in managing the costs of producing replacements. The target live weight of weaned bulls on the farm is 500 kg bulls at 12 months of age, from a predominantly grazed grass diet. For the past number of years as a result of a focus on genetics and grassland management this farm has increased sale weight of bulls while reducing concentrate (Table 2). While live weight dropped slightly due to drought in 2018, this is on target to recover in 2019 with grass growth returning to previous years’ levels. According to the farmer, achieving high output cheaply is very important and he pays a lot of attention to grassland management during the year to ensure he achieves early turnout and a long grazing season and has quality swards for grazing. The aim is to graze each paddock for three days and allow 18 to 21 days recovery and regrowth (the “three weeks to grow, three days to graze” rule). Most importantly, the farm is walked weekly to (1) ensure pregrazing sward yields are in the optimum range of 1,000 to 1,400 kg DM per ha, (2) measure the total grass available on the farm, and (3) take corrective
14 | Teagasc National Beef Conference 2019

action where required such as removing surpluses during periods of high growth
or supplementing/reducing demand during periods of low growth. Grass yields are
measured using a plate meter. Although nationally grass yields on beef farms is
approximately six tonne DM/ha, this farm grew 10.9 tonnes DM per ha in 2017. As
a result of the summer drought in 2018, this dropped by approximately 22 percent,
however, this is expected to recover to previous levels in 2019.

Table 2. Liveweight and meal feeding per head to weanling bulls for the years 2015
to 2018 for Case Study 1.

        Year               Live weight (kg)                Meal feeding (kg)
        2015                     499                              150
        2016                     513                              125
        2017                     525                              100
        2018                     497                              125

Much of the progress made in recent years has been facilitated by investments in
grazing infrastructure with new roadways installed in recent years and paddock
fencing improvements carried out. He makes extensive use of pigtails and reels for
temporary management of grassland during peak grazing periods. The farm of 24
ha of land now has 45 paddocks. Farmer 1 feels that further progress is possible, in
particular with respect to soil fertility. Although soil pH is good on the farm with
76 percent of the farm having a pH of 6.3 or higher, indexes for phosphorus (P)
and potassium (K) levels are low; 77 percent of soil samples taken in recent years
are at Index 2 or lower for P and K. Farmer 1 accepts that further investment in P
and K will be needed to further improve grass growth in the next number of years.

Case study 2 – Herd Fertility
One of the key aspects of running an efficient suckler system is good breeding
management and herd fertility. Cow condition score, bull fertility, the incidence of
difficult calving and herd health are some of the main factors that affect fertility in
the herd. Having a defined compact calving period and setting out clear objectives
for reproductive performance as described by Diskin and Kenny (2014) are key
targets.
Regardless of when the calving season starts, a key focus for breeding herds should
be to keep the calving season to a maximum of 12 weeks. A compact calving pattern
allows for easier management of stock, reduced labour, fewer groups of stock and
‘Irish Beef – A Changing Landscape’ | 15
potentially less disease problems. In recent years, there has been a perceptible
increase in focus on compactness of calving. Where both spring and autumn herds
are present, there can be temptation to recycle cows from one herd to another.
This leads to a widening of the calving pattern, an increase in costs and should be
avoided; ideally, each herd should be maintained as a separate entity.
Farmer 2 farms 60 hectares of heavy land in Co. Kerry. In 2012 the farm ran 81
cows in a weanling system with calving spread from October to April. A plan was
put in place to increase cow numbers to over 100 while tightening up the calving
spread from seven to four months. Given the effect of date of birth on weaning
weight (Table 3), it was decided that later calving cows would be culled and the
target calving spread would be mid September to mid January.
Table 3. Weaning weight of calves with varying dates of birth.
Date of birth Age at weaning Live weight at weaning
(days) (kg)
1st Feb- 22nd Feb 245 310
22nd Feb- 15th Mar 224 287
15th Mar- 5th Apr 203 263
5th Apr- 26th Apr 182 240
26th Apr- 17th May 161 217
It was clear that this would not be achieved in single year without requiring
a significant number of replacements. Thus the end of the breeding season was
truncated as follows:
• Year 1 – breeding ceased in early June (i.e. no cows calving after the first week
of April).
• Year 2 – breeding ceased in late April (i.e. no cows calving after mid-February).
• Year 3 – breeding ceased in late March (i.e. no cows calving after mid-January)
The replacement heifer policy was an important element of managing the calving
pattern since these provided the best opportunity to (1) introduce more fertile
genetics, and (2) ensure that a high proportion was calved early in the calving season.
Given that replacement numbers would increase somewhat it was decided that
some pregnant heifers would be purchased to supplement home-bred replacement.
Pregnant heifers were purchased with September calving dates. In addition,
home-bred heifers were bred by artificial insemination starting in December to16 | Teagasc National Beef Conference 2019 ensure calving commenced in September. The stock bull was sold and all cows and replacement heifers were bred to artificial insemination to optimise genetic gain in the herd. This also allowed for the use of fixed time AI with a particular focus on later calving cows in an effort to move their calving dates forward. In addition, shorter gestation sires (predominantly Angus and Belgian Blue) were used on late calvers to pull back calving spread and easy calving sires used on heifers to ensure quicker return to heat. The impact of shortening the calving season and improving herd fertility helped Farmer 2 improve net margin per hectare by four fold over a four-year period. Case study 3. Herd Health Farmer 3 is a suckler to beef farmer in County Wicklow farming a total of 44 hectares of grassland. A total of 45 cows calve in spring on the farm with all progeny finished. Around 40-50 store cattle are purchased in local marts annually. Stocking rate on this farm has increased over the past 3 years from 1.77 LU/ha to 2.15 LU/ ha. A new shed was built to accommodate extra stock over the winter. This farmer experienced protracted scour outbreaks in the past and, as a result, was vaccinating for rota virus and corona virus. However, calves on the farm were still developing scours despite this vaccination policy. These calves required treatment with antibiotics which added expense and labour to the farmer along with stressing both farmer and calves. The first step to rectify the problem was to develop a herd health plan. As outlined above for Farmer 2, an important element of the herd health plan to was to tighten the calving pattern; in this case the driver was to have young calves turned out to grass soon after calving and to minimise the mixing of different aged calves. This was done by, firstly, delaying the commencement of calving from November to January; this reduced the housing duration for new born calves prior to turnout. The second component of contracting the calving pattern was to remove April/ May calvers . By eliminating later calving cows, this ensured that more cows and calves were turned out to grass from late February onwards thus, reducing stocking pressure in the sheds. A new shed that was also built to reducing stocking density during housing while also allowing for an increase in stock carrying capacity on the farm. Ventilation was improved on existing sheds and draughts were eliminated. The farmer took part in an IBR eradication trial which involved blood testing 30 breeding females in the herd. The results showed 7 cows were positive. As a result it was decided to begin a vaccination programme for IBR. The farm also had recurrent issues with pneumonia had a high number of calves presenting with “runny” noses. In the winter of 2017/2018 a bad outbreak of pneumonia occurred resulting in a very large number of calves requiring veterinary
‘Irish Beef – A Changing Landscape’ | 17

intervention and medication. Although no calves were lost a very substantial cost
was incurred and a huge amount of the farmer’s time was invested in treating the
calves. A decision was made to vaccinate calves for the main strains of pneumonia.
A product that covered RSV, Pi3 and Pasturella is now administered to all calves
in the autumn time each year with a booster shot administered one month before
weaning. The reduction in costs and improvement in live weight performance
deriving from these herd health management practices saw gross margin on the
farm increase by 70% over a three year period.

Conclusions
The difficulties with low levels of farm profitability in the beef sector are undeniable.
In particular, the low prices being returned from the market in 2019 have
exacerbated what were already low margins for beef farms in Ireland. Although
beef price will remain the main driver of profitability for beef farms, it is important
to recognise that levels of technical efficiency also play an important role in farm
economic performance. It is clear that the top third of farmers in the profit monitor
dataset have made substantial gains in technical efficiency with reliance in premia
decreasing and a greater retention of gross output. It is important to understand
how these gains have been made with case study analysis providing an opportunity
to do this. Three case studies presented here have highlighted the role of grassland
management, herd fertility and herd health in improving performance on three
suckler beef farms.

References
Diskin, M. G. and Kenny, D. A. (2014). Optimising reproductive performance
  of beef cows and replacement heifers, Animal, 8(1): 27-39. doi:http://dx.doi.
  org/10.1017/S175173111400086X.
McGee M., Drennan M.J. and Crosson P. (2014) Effect of concentrate feeding level
  in winter and turnout date to pasture in spring on biological and economical
  performance of weanling cattle in suckler beef production systems. Irish Journal
  of Agricultural and Food Research, 53 (1), 1-21
18 | Teagasc National Beef Conference 2019

  BDGP & BEEP; key initiatives
 that are helping deliver greater
 profit and sustainability for our
       suckler beef farmers
                              Andrew Cromie
     Irish Cattle Breeding Federation, Highfield House, Bandon, Co. Cork.

    Summary
  • The Beef Data and Genomics Program (BDGP) and the Beef Environmental
     and Efficiency Pilot (BEEP) were introduced with the objective of using
     genetics/genomics to address the decline in key maternal traits within the
     national suckler herd and in doing so improve the profitability and carbon
     efficiency of our livestock sector.
  • This has led to the current rate of genetic gain in our suckler beef herd
     increasing to €5/cow/year which is comparable with that being achieved
     in our national dairy herd.
  • An analysis of the first females that calved into BDGP herds showed that
     on average, 5 star females calved 59 days earlier than 1 star females and
     had a 13.6 days shorter average calving interval.
  • Of the first females that calved in BDGP herds and were weighed as part
     of the BEEP, 5 star cows were, on average, some 16 kg lighter than 1 star
     cows and yet had a 8 kg heavier weanling, representing a 2% gain in
     weanling efficiency.
  • In terms of progeny carcass performance, 5 star females were generating
     progeny which were slightly lighter in terms of carcass weights but were
     significantly younger in terms of age at slaughter representing a net gain
     in profitability of almost €60/animal.
  • These results demonstrate the effectiveness of the initial €uro-Star
     genomic predictions as a means to accurately identify more profitable and
     sustainable suckler herd replacements.

Background
The Beef Data and Genomics Program was introduced in 2015 as part of Ireland’s
EU Rural Development Program (2014-2020), with the objective of using genetics/
genomics to address the decline in key maternal traits within the national suckler
‘Irish Beef – A Changing Landscape’ | 19
herd and in doing so improve the profitability and carbon efficiency of our livestock
sector. This was followed by the Beef Environmental and Efficiency Pilot (BEEP),
introduced in 2019, which had the goal of further supporting the objectives of
the BDGP by collecting important data on cow and calf live-weights, which are
important traits for profitable suckler beef production.
In this paper, we review the success of both programs to date, looking firstly at rates
of genetic gain in our suckler beef herd and how these have then translated into
productivity/sustainability benefits for our suckler beef industry, in terms of the
replacements index. Finally, we will look forward at some of the new opportunities
that are presenting themselves in the context of future, more profitable and
sustainable suckler beef production.
Rates of genetic gain in our suckler beef herd
The current rate of genetic gain in our suckler beef herd is €5/cow/year. This is
based on year of first calving for suckler female replacements, with the average
replacement index of females calved in during 2019 (year to date), being €92,
compared to €74 for heifers calving in during 2014. Across our National suckler
beef herd (approximately 900k cows), this has been worth some €60m or equivalent
to 0.15 cents/kg in terms of beef price.
Expressing this rate of gain in genetic standard deviation units, indicates that our
current rate of gain in our suckler beef herd (0.20 genetic standard deviation units/
year) is now comparable with that being achieved in our national dairy herd (see
Figure 1).
3
Genetic Standard Deviation Units
2.5
Dairy EBI Beef Replacement Index
2
1.5
1
0.5
0
2000
2001
2002
2003
2004
2005
2006
2007
2008
2009
2010
2011
2012
2013
2014
2015
2016
2017
2018
-0.5
Year of first calving
Figure 1. Rates of genetic gain in our National Suckler Beef and Dairy Herds.20 | Teagasc National Beef Conference 2019 This is a remarkable turn-around and highlights the potential that genetics/ genomics has to offer our suckler beef industry in the future. Indeed, the only difference between the shape of the 2 lines from Figure 1 is the time lag between when each program was initiated. For dairy, this was in the mid-2000’s, whilst for beef this was some 10 years later, as a result of the direct introduction of the BDGP. This is a major endorsement of the strategy applied in the BDGP, which was to utilise a new “cutting edge” technology such as genomics to help support and develop an important indigenous industry. Using the replacement index to drive productivity and carbon efficiency in our suckler herd At this stage, there are some 23k farmers and 540k cows participating in the scheme, representing about 55% of the total suckler beef cow herd. In addition, there are some 17k herds and 400k cows involved in BEEP, with the majority of these also in the BDGP. One of the key actions of the scheme is the use of 4 and 5 star females as suckler herd replacements, with a minimum of 50% of new replacements females required to be genotyped 4 and 5 star by October 2020. To help support this objective, farmers were encouraged to keep (and/or purchase) replacement females that were genotyped 4 or 5 star on their initial genomic evaluation; in effect, these heifers were then deemed eligible for the program. Whilst the vast majority of participants are now in line to meet this requirement, this was an action that caused a lot of angst at the outset of the scheme, as (i) farmers were using a new technology and new genetic/genomic indexes that they were not that familiar with and (ii) in some cases the predictions were not consistent with their expectation regarding the future performance of individual animals. The rationale behind the action was that by using genomic predictions for replacement index, the scheme could help farmers identify replacements females that were more consistent with our future industry needs, which was ultimately to breed a more profitable and carbon efficient suckler cow. The question then is, has it been successful? One of the best ways to answer this question is to undertake an analysis of the first females that calved into BDGP herds based on the use of these new genomic predictions. By looking at their subsequent performance in terms of female fertility, cow live-weight, calf growth rate and progeny carcass performance, we can establish the effectiveness (or otherwise) of the €uro-Star genomic evaluations as a means of predicting real change in key traits linked to profitable and carbon efficient suckler beef production. A total of 59,466 heifers were included in the analysis, with all of these having calved into BDGP herds for the first time during the period 1st January 2017 to 30th
‘Irish Beef – A Changing Landscape’ | 21

June 2017. The animals were ranked on their genomic evaluations from August
2016, which is important as it then ensures that we are assessing the effectiveness
of the initial genomic evaluation, independent of the animal’s subsequent own
performance.
Looking firstly at female fertility performance (Table 1), indicates that on average,
5 star females calved 59 days earlier than 1 star females (in terms of age at first
calving) and had a 13.6 days shorter average calving interval (across completed
calvings to date). Furthermore, 77% of these females are still on farms compared
to 70% for the 1 star females. These are significant differences in female fertility
performance, which is a critical trait in the context of suckler beef profitability and
carbon efficiency.

Table 1. Comparison of BDGP animals for fertility traits, based on €uro-Star
Replacement Index.

 Stars         Number        Age first      Average    Still on farms     Current
                             calving        CI Days                        parity
 5 stars        20,931         866.0         402.3          77%             2.55
 4 stars        11,712         888.1         406.2          75%             2.51
 3 stars         8,581         895.9         406.1          74%             2.47
 2 stars         5,855         907.3         412.3          72%             2.44
 1 star          4,134         925.0         415.9          70%             2.38
 Diff                          -59.0         -13.6           6%             0.18

Of the 59,466 heifers that had an initial calving date in BDGP herds, 14,331 of
these were weighed as part of the BEEP in 2019 (i.e., after accounting for age at
weighing between 150-250 days, cows culled/sold and also herds not participating
in both programs). Looking at the cow and calf liveweight data from these animals
(Table 2), indicates that on average 5 star cows were some 16 kg lighter than 1
star cows and yet had a 8 kg heavier weanling, representing a 2% gain in weanling
efficiency. Again, these results confirm that the €uro-Star genomic evaluations are
helping identify cows that are more carbon efficient and hence more profitable (the
principle of “more from less”).
22 | Teagasc National Beef Conference 2019
Table 2. Comparison of BDGP animals for cow & calf live-weight traits, based on
€uro-Star Replacement Index.
Stars Count Cow Calf Age at Weanling
live weight live weight weighing efficiency
5 stars 5,585 665.3 278.8 186.7 41.9%
4 stars 2,939 667.4 273.9 185.4 41.0%
3 stars 1,967 669.0 272.5 185.3 40.7%
2 stars 1,228 678.7 272.6 186.5 40.2%
1 star 792 681.2 271.1 186.7 39.8%
Diff -15.9 7.7 0.0 2.1%
Finally, looking at progeny carcass performance, indicates that, on average, 5 star
females were generating progeny which were slightly lighter in terms of carcass
weights (7 kg in the context of the differences from Table 3), but were significantly
younger in terms of age at slaughter (some 29 days younger), representing a net
gain in profitability of almost €60/animal (based on a carcass price of €4/kg and a
cost of finishing of €3/day during the finishing period.
Table 3. Comparison of BDGP animals for progeny carcass traits, based on €uro-
Star Replacement Index.
Steers Heifers Young Bulls
Stars Num Carcass Age Num Carcass Age Num Carcass Age
weight weight weight
5 stars 3,416 374 784 4,389 319 725 3,907 394 549
4 stars 1,806 376 795 2,591 324 745 1,992 395 558
3 stars 1,303 376 800 1,816 325 752 1,309 392 561
2 stars 861 380 813 1,188 328 756 833 397 566
1 stars 550 379 810 902 328 764 548 401 571
Diff 5.5 26.1 9.3 38.9 7.3 22.1
New opportunities
Whilst the previous results are hugely encouraging in the context of profitable and
sustainable suckler beef production, there are several potential new areas of focus
that could help us accelerate genetic progress for greater carbon efficiency. These‘Irish Beef – A Changing Landscape’ | 23
include; (i) direct measurement of methane, (ii) new genetic evaluations for age
at slaughter, and (iii) continued roll-out of genotyping cows and calves within the
suckler herd.
(i) Direct measurement of methane. The ICBF performance test station is now the
largest site globally measuring methane data directly on beef cattle. Early
results from work undertaken by ICBF and Teagasc has validated the initial
hypothesis within the BDGP that high replacement animals have a lower
methane output/animal than lower replacement index animals. Indeed, the
initial results indicate up to a 20% difference in total methane output, which
is hugely significant in the context of addressing global challenges regarding
methane output from animal agriculture.
(ii) New genetic evaluations for age at slaughter. Data from Table 3 clearly indicates
the potential of genetic/genomics to reduce age at slaughter and in doing so
contribute to climate/environmental challenges. As a result, ICBF and Teagasc
are working on a new genetic evaluation for 2020, termed age at slaughter
to a target carcass weight/specification. This new trait will have the added
advantage of rewarding animals that grow quickly and then hit the target
weight and spec from an industry perspective, which is exactly what farmers
and industry need from a profitability and sustainability perspective.
(iii) Continued roll-out of genomics. One of the clear outcomes from the BDGP has
been the benefits of genomics to help identify more profitable and sustainable
animals. Extending the level of genotyping in future programs to consider
all progeny (not just potential female replacements) would have the added
benefit of helping further develop genomic predictions for traits linked to
terminal systems, such as feed intake, methane output, age at slaughter to a
target carcass weight/spec and meat eating quality.24 | Teagasc National Beef Conference 2019
The genetics of meat eating
quality – what can be achieved?
Donagh Berry1, PJ. Hegarthy2, Stephen Conroy2, Andrew Cromie2
Ross Evans2 and Michelle Judge1
1
Teagasc, Animal & Grassland Research and Innovation Centre, Moorepark,
Fermoy, Co. Cork,
2
Irish Cattle Breeding Federation, Highfield House, Bandon, Co. Cork
Summary
• Meat eating quality characteristics such as tenderness, juiciness and
flavour are becoming increasingly important in maintaining demand for
beef products.
• While herd management and abattoir processing procedures have greatly
improved in recent times, considerable between-animal variability still
exists in eating quality.
• Although large breed differences in meat eating quality are evident, up
to 15% of the within-breed differences in meat eating quality is due to
genetic differences.
• While single gene solutions are being marketed as being able to
differentiate products on meat tenderness, they account for only a very
small proportion of the underlying variation and are therefore not reliable.
• National genetic evaluations for meat eating quality will soon be available
in Ireland; Ireland will therefore be one of the world leaders in this area
and currently boast the largest database globally of meat sensory data on
genotyped cattle assessed by trained panels.
Introduction
The contribution of breeding to improving animal performance has been well
recognised across a range of different species. Using a controlled experimental
study in broilers, it was reported that up to 90% of the gains in performance in
recent decades could be attributable to genetic improvement (Havenstein et al.,
2003). Unlike many of the required interventions to improve animal performance
(e.g., nutrition, vaccination), the gains achieved through breeding are cumulative‘Irish Beef – A Changing Landscape’ | 25 and permanent. This implies that improvements achieved are compounded with each generation. In the same manner, however, any deleterious (indirect) consequences of breeding are also compounded with successive generations. A well- publicised example of such indirect unfavourable consequences of selection is the documented deterioration in reproductive performance in dairy cows concurrent with aggressive genetic selection for increased milk production. It is therefore imperative the breeding schemes are optimised to, where possible, achieve gains in performance at a holistic level. Moreover, because of the long generation interval in cattle, cognisance needs to be taken of the likely conditions that will prevail in several years and, not only which animal characteristics will be important, but also their degree of importance, relative to other traits. Although the term meat quality encompasses a multitude of factors including food safety, nutritive value, lipid content and composition, The Irish Cattle Breeding Federation and Teagasc have embarked on generating genetic evaluations for what are called the organoleptic properties or sensory characteristics of meat such as tenderness, flavour and juiciness. What is heritability and what are the international estimates for meat quality Heritability is arguably the most commonly used statistic in animal breeding, but unfortunately, is possibly also the most misunderstood and misinterpreted statistic. The heritability of a trait reflects the proportion of the variability amongst individuals (after accounting for environmental effects such as herd) that is attributable to genetic differences in those individuals. Heritability may also be defined as the extent of resemblance between what is observed in an individual (e.g. meat tenderness or growth rate) and the genetic merit of that individual. It is often construed that a low heritability results in slow genetic gain. This cannot be deduced from heritability, but instead heritability simply reflects how many records need to be collected on the trait of interest to generate accurate estimates of genetic merit. It is the accuracy of genetic evaluations, and not the heritability, that impacts the rate of genetic gain. A meta-analysis of heritability estimates for a selection of meat quality traits is in Figure 1; 20 studies were included in the analysis. The median, within species, heritability estimates for tenderness, measured using Warner-Bratzler shear force (a mechanical method to objectively gauge tenderness) or a sensory panel varied from 0.19 to 0.23 (Figure 1); this is consistent, albeit generally slightly lower than heritability estimates for many performance traits including milk production in dairy cows and growth rate in other species. Nonetheless considerable variability exists in heritability estimates across populations (Figure 1) with, for example,
26 | Teagasc National Beef Conference 2019

the reported heritability estimates for shear force across 20 cattle studies varying
from 0.08 to 0.53. Therefore, rapid genetic gain in meat sensory characteristics is
possible. Nonetheless, these parameters are population specific as evidenced by the
range in values demonstrated in Figure 1 and thus need to be estimated using Irish
cattle managed in Irish production systems.

Figure 1. Box and whisker plot of the heritability estimates for a selection of meat quality
traits in cattle; the number above each box-whisker is the number of studies contributing
to the plot; the horizontal line represents the median, 50% of the study estimates lie
within the range of the vertical box with the remaining 50% located between the top/
bottom of the box and the end of the whisker.

Irish data on meat sensory characteristics
Data on meat tenderness, flavour and juiciness have been collected on Irish cattle
for the past 5 years. All cattle performance tested at the ICBF Tully test station
have been evaluated for meat tenderness since 2014; these animals also have
information on performance traits such as growth rate, feed intake and therefore
feed efficiency providing knowledge of the relationships among all these traits. The
goal is to have 8,000 meat sensory results by the end of 2020 ensuring that the
dataset held in Ireland is three times larger than the next largest international
dataset on meat sensory results generated from a trained panel (Figure 2). The
cattle are from a wide mixture of sire lines and breed crosses with the latter
enabling the prediction of breed differences. A total of 737 different sire lines are
represented in the dataset and such diversity is crucial when generating accurate
genetic evaluations to identify superior (and inferior) sire lines.
‘Irish Beef – A Changing Landscape’ | 27

Figure 2. Number of cattle sensory measures for the published scientific studies
alongside those currently available in Ireland and projected to be available by the end of
2020.

Forty-eight hours post-mortem, after hanging, 2.54 cm thick striploin steaks are
taken from all animals. Each steak is then individually vacuum-packed, aged for
14 days, and frozen. The steaks are sealed on a high heat griddle and then moved
to the lower heat hot plate. Each steak is removed from the heat and allowed to
rest for 2 minutes. Steaks are then cut into 2.5 cm cubed portions and presented
to each panellist while hot. All samples are scored for tenderness, juiciness and
flavour on a linear scale from 1 to 10 where a value of one represents very tough,
not juicy and no beef flavour, respectively.
Breed differences for tenderness, flavour and juiciness are illustrated in Figure 3.
Clear differences exist in that the Angus, Hereford and Belgian Blue have the most
tender meat although the biological mechanism as to why the Belgian Blue has
superior tenderness is likely to differ to that of both British breeds. The meat of
the Simmental breed is, on average, the least tender although it is not worse than
the average Holstein-Friesian. Both British breeds are the most flavoursome with
all other breeds being relatively similar; both British breeds also tend to be the
most juicy.
While differences among breeds exist, of real interest to breeders is the extent of
the with-in breed differences and how these can be exploited. Figure 4 illustrates
the extent of with-in breed variability that exists in the sensory traits among sire
28 | Teagasc National Beef Conference 2019

lines. While mean breed differences clearly exist, there are Simmental bulls who
have a superior genetic merit for tenderness compared to some Angus, Hereford
and Belgian Blue bulls; the same is true of the extent of within breed variability
in the other sensory metrics. Genetic evaluations attempt to exploit this within
breed variability and, in doing so, achieve genetic gain without necessarily a breed
substitution.

Figure 3. Mean relative breed differences (on a scale of 1 to 10) for (a) meat tenderness,
(b) flavour and (c) juiciness based on the 5,530 Irish animals; also included are one
standard error each side of the predicted mean.
‘Irish Beef – A Changing Landscape’ | 29

Figure 4. Box and whisker plot of the variability that exists in meat sensory
characteristics per sire for a selection of breeds; the horizontal line in the coloured box
represents the median, 50% of the sires exist within the range of the coloured vertical
bar with the remaining 50% located between the top/bottom of the coloured bar and the
end of the whisker.

Heritability also depicts the extent of these within breed differences. The
heritability of tenderness, flavour and juiciness for the Irish population is in Table
1. Up to 15% of the variability in meat sensory characteristics in Irish cattle is
due to genetic differences which is consistent with the international estimates.
Moreover, significant genetic variability exists implying that breeding for these
traits will prove fruitful.

Table 1. Heritability estimates for tenderness, flavour and juiciness from 5,530 Irish
cattle.
                   Trait                                    Heritability
                Tenderness                                     0.15
                  Flavour                                      0.12
                 Juiciness                                     0.11

The DNA of meat quality
DNA technologies in cattle have been used for decades in Ireland as an instrument
for parentage verification. More recently, DNA technologies have been successfully
used to generate more accurate estimates of genetic merit for individual animals
30 | Teagasc National Beef Conference 2019
for a range of traits. This process uses DNA information on approximately 50,000
sites along the DNA of each animal and is the process used globally in a multitude
of species to accelerate genetic gain. Nonetheless, only a handful of DNA variants
touted to be associated with meat quality are being sold commercially. While
many studies (including those based on the current dataset available in Ireland)
have demonstrated an association of DNA variants with meat tenderness, the
association has not always been consistently proven in different populations.
Moreover, the effect of the DNA variants is always small implying that its power to
differentiate meat of different tenderness value is weak.
Two such genes that have been subjected to extensive analysis for their putative
association with meat tenderness are Calpain 1 (CAPN) and Calpastatin (CAST).
The myostatin gene (which underlies double muscling in Belgian Blue cattle) has
also been reported to be associated with meat quality. Calpain is responsible for the
breakdown of myofibrillar proteins which are known to be associated with meat
tenderness. Calpastatin binds directly to calpain, thereby inhibiting calpain activity
which regulates proteolysis post-mortem. Therefore, both genes are firm candidate
genes. While the effect of mutations in these genes, albeit statistically significant,
are biologically small, they are included in the Irish bespoke genotyping platform
used to genotype all Irish cattle and are thus available on request. Using the Irish
dataset, only two of the six DNA variants, CAPN1 316 and CAST 2870, were actually
associated with tenderness. However, both DNA variants explained less than 1% of
the variability in tenderness rendering them very poor at differentiating between
tender and tough meat. The best DNA-based strategy still remains to follow suit
with international best practice and use all 50,000 DNA markers to predict the
genetic merit of an individual for the quality of its meat but also that of its progeny.
Breeding strategies for improved meat quality
Once genetic variation in a trait exists, then there is scope to improve that trait
through breeding. Whether improvement is justified, or will occur, depends on
the breeding strategy adopted. The perils of single trait selection are now well
documented in many species and thus selection should be practiced within the
framework of a total merit index such as the Replacement Index or Terminal
index in Ireland. Three criteria need to be fulfilled for a trait to be considered in a
breeding objective;
1) the trait must be either economically, socially, or environmentally
important,
2) the trait must exhibit genetic variation, and
3) sufficient information must exist to differentiate between genetically elite
and inferior animals for the trait of interest.You can also read