Creative Sectoral Overview - Galway City and County Economic and Industrial Baseline Study - Galway Dashboard
←
→
Page content transcription
If your browser does not render page correctly, please read the page content below

        Creative Sectoral
                Overview


       Galway City and County Economic
           and Industrial Baseline Study
       CREATIVE SECTORAL OVERVIEW

              James Cunningham
                Brendan Dolan
                  David Kelly
                 Chris Young

                   14/04/2015
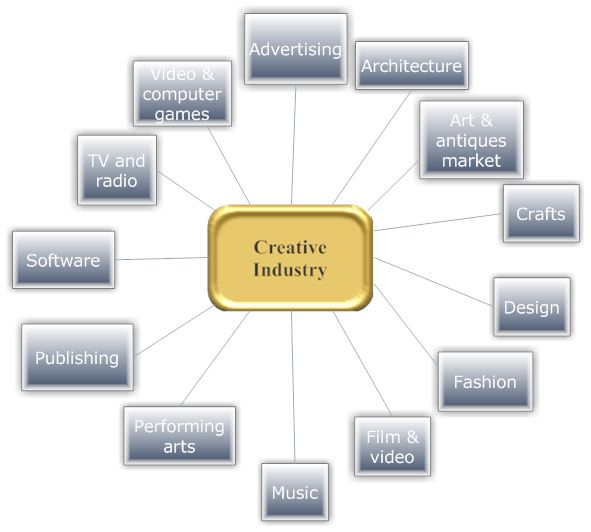
Table of Contents

Executive Summary Overview of the Creative Sector ......................................... 6


Global Overview of the Creative Sector .............................................................. 8

       1.1
     Global Market Size .......................................................................................... 8

       1.2
     Classification of the Creative Industry ........................................................... 11

       1.2.1
   Heritage ......................................................................................................... 11

       1.2.2
   Art Crafts ....................................................................................................... 12

       1.2.3
   Performing Arts ............................................................................................. 12

       1.2.4
   Music ............................................................................................................. 13

       1.2.5
   Visual Arts ..................................................................................................... 16

       1.2.6
   Audio Visuals ................................................................................................. 17

       1.2.6.1
  Film Industry .................................................................................................. 18

       1.2.6.2
  Television and Radio ..................................................................................... 20

       1.2.7
   Publishing and Printed Media ........................................................................ 21

       1.2.8
   Design ........................................................................................................... 22

       1.2.9
   New Media .................................................................................................... 23

       1.3
     Major Drivers of the Global Creative Sector .................................................. 24

       1.3.1
   Technology .................................................................................................... 24

       1.3.2
   Demand for Creative Products ...................................................................... 25

       1.3.3
   Tourism ......................................................................................................... 25


National Overview of the Creative Sector.......................................................... 26


2
   National Overview ........................................................................................ 26

       2.1
     National Market Size ..................................................................................... 26

       2.1.1
   Heritage ......................................................................................................... 26

       2.1.2
   Art Crafts ....................................................................................................... 27

       2.1.3
   Performing Arts ............................................................................................. 28

       2.1.4
   Music ............................................................................................................. 28

       2.1.5
   Audio Visual .................................................................................................. 29

       2.1.6
   Publishing and Printed Media ........................................................................ 30

       2.1.7
   Design ........................................................................................................... 31

       2.1.8
   New Media .................................................................................................... 32

       2.1.9
   National Policies ............................................................................................ 33
Regional and Local Overview of the Agriculture Sector .................................... 35


3
   Regional and Local Overview ...................................................................... 35

       3.1
     Regional Market Size .................................................................................... 35

       3.1.1
   Heritage ......................................................................................................... 36

       3.1.2
   Art Crafts ....................................................................................................... 40

       3.1.3
   Infrastructure Performing Arts ....................................................................... 40

       3.1.4
   Music ............................................................................................................. 41

       3.1.5
   Visual Arts ..................................................................................................... 42

       3.1.6
   Audio Visual .................................................................................................. 43

       3.1.7
   Publishing and Printed Media ........................................................................ 45

       3.1.8
   Design ........................................................................................................... 46

       3.1.9
   New Media .................................................................................................... 47

       3.1.10
   Promotion and Support ................................................................................. 48

       3.1.11
   Future Growth ............................................................................................... 49


4
   References ................................................................................................... 50
THE WHITAKER INSTITUTE


Acknowledgements
We wish to acknowledge the support of Liam Hanrahan, Patricia Philbin, Sharon Carroll, Niamh
Farrell of Galway City Council and Alan Farrell and Brian Barrett of Galway County Council in
preparing this sectoral review.

Our Approach1
Our approach in undertaking this overview of the creative sector was to take a global and
national perspective before focusing on the regional and local level. One of the main limitations
we faced preparing this sector review is the lack of quality and reliable data at the local level.
The framing of the global and national level overviews against publicly available local data
provides a basis and context to consider the future of the in Galway City and County.


1
  The information contained in this overview has been compiled from many sources that are not all controlled by the
Whitaker Institute. While all reasonable care has been taken in the compilation and publication of the contents of this
resource, Whitaker Institute makes no representations or warranties, whether express or implied, as to the accuracy or
suitability of the information or materials contained in this resource.

                                                                                                                                              CREATIVE SECTORAL OVERVIEW                                                           5
THE WHITAKER INSTITUTE


Executive Summary Overview of the Creative
Sector

Global Overview
•      World exports of creative goods and services reached €624 billion in 2011.

•      The creative industry of the EU accounts for 3.3% of GDP and employs 6.7 million people.

•      Art crafts account for 6% of global value of the creative goods market in 2011.

•      The global music industry has been in decline for 14 years and total music sales for 2013
       were down 3.9% from 2012.

•      Global sales for visual arts reached $65.4 billion in 2014 up 8% from 2013.

•      India was the leading film producing country in 2013 with 1,325 films with Ireland producing
       22 in 2014.

•      Major drivers of the global creative sector are technology, demand for creative goods and
       tourism.

National Overview
•      The creative sector for Ireland is €4.6 billion, composing approximately 2.8% of GDP.

•      Employment created by the creative industries amounts to 76,862 in Ireland.

•      3.7m overseas visitors engage in cultural/historical cultural activities.

•      2.3m Irish citizens engage in performing arts on an annual basis, which is 66% of the adult
       population.

•      The Irish music industry decreased by €79 million between 2005 and 2010.

•      The audio visual sector is estimated to be worth €550 million employing over 6,000, with
       over 560 SMEs.

•      The design sector is valued at €465 million employing 5,100 with 37% of SMEs employing
       between 2 to 5 people.

•      The animation sector generated €326.8 million in 2011 while employing 2,321 people.

•      Tax incentives and art promotion charters are productive policies enhancing the sector.

                                                                 CREATIVE SECTORAL OVERVIEW           6
THE WHITAKER INSTITUTE


Regional and Local Overview
•      3,878 people are employed in Galway in the Creative Sector accounting for 3.4% of total
       employment in the county.

•      Some 12% of businesses have more than 10 employees, 49% have between 2 and 10
       employees and 39% are sole traders.

•      1 in every 33 jobs in the Western Region is in the creative economy.

•      Creative technology companies account for 7% of total number of business, 25% of
       turnover and 15% direct employment.

•      There are 35 heritage sites, 32 museums, 10 art galleries in the city and county.

•      There were 83 festivals and events hosted in Galway in 2012 bringing in an estimated €62
       million in expenditure.

•      €136 million plus is the estimated value of the Irish language, with €59 million accrued to
       Galway City.

•      25,000 domestic and foreign students attend Irish colleges in the Gaeltacht each summer
       and contribute €24.3 million in added value to GNP each year.

•      Traditional Irish music is part of Galway’s cultural identity.

•      There is the potential for Galway to become the national flagship for contemporary visual
       arts.

•      The Audio Visual sector is worth €72 million employing over 600 people.

•      Connemara has a cluster of audio visual companies with the success of TG4 influencing the
       establishment of 40 companies.

•      There are 162 design and craft businesses in Galway with the greatest concentration in
       textile making, wood working and jewellery.

•      Galway is now one of five UNESCO’s Creative Cities in the world.

•      The sector generates an annual turnover of €534 million and contributes 3% towards
       employment within Galway.

•      The West of Ireland has 2,466 creative companies.

•      The Irish language is worth in excess of €136 million annually to the economy of Galway
       City and County.

•      There are 162 design/craft businesses in Galway.

•      Galway is now a City of Film and recognised as a standard of excellence.

•      Galway has 50 production companies and its audio visual sector’s employment rate is
       growing at 24.5%.

                                                                  CREATIVE SECTORAL OVERVIEW         7
THE WHITAKER INSTITUTE


Global Overview of the Creative Sector

Global Overview

Introduction
Despite the global economic crisis of 2008, world exports of creative goods and services has
continued to grow, reaching €624 billion in 2011, indicating an annual growth rate of 14% over
six consecutive years.     The creative industry accounts for approximately 2%-8% of the
workforce of the economy (UNCTAD, 2010) as well as contributing to social development
(UNESCO, 2013).


Global Overview
1.1 Global Market Size
While global exports account for €624 billion (UNCTAD, 2010), the majority of creative
production and consumption takes place in Europe, the United States and Japan, followed by
other OECD countries, then China, India and Brazil (light years IP, 2014). The creative industry
of the EU accounts for 3.3% of GDP and employs 6.7 million people accounting for 3% of total
employment (Epthinktank, 2013).

The main creative goods exports include interior design products, fashion, jewellery and new
media products.     Figure 1 illustrates the global values of exports from 2003 to 2012
(UNCTADSTAT, 2013b).        China currently remains the leading exporter of creative goods,
tripling in value from $32 billion in 2002 to $125 billion in 2011. The United States are the next
largest exporters, followed by Hong Kong, Germany and then India (UNCTAD, 2014).


                                                            CREATIVE SECTORAL OVERVIEW               8
THE WHITAKER INSTITUTE


Figure 1:
Creative Goods, Global Export Value, 2003-2012

       600,000


       500,000


       400,000


       300,000


       200,000


       100,000


               0

                       2003
     2004
     2005
     2006
     2007
     2008
     2009
     2010
     2011
     2012

           US$m
   223,795
  259,047
  287,517
  313,108
  364,423
  417,285
  375,306
  416,323
  489,814
  473,791


(Adapted from UNCTADSTAT, 2013b).


The value of all creative goods as of 2012 was $431.703 billion. Figure 2 illustrates the global
values of the various creative goods. Design goods, including architecture, fashion, glassware,
interior, jewellery and toys have the greatest value, totalling $255.077 billion in 2012. Fashion is
worth $71.137 billion as of 2012 followed by interior design products, jewellery and then toys.
Art Crafts include carpets, celebration, paperware, wickerware and yarn products and is valued
at $27.741 billion. Audio Visuals include film, CD, DVD and tapes and is valued at $29.748
billion. New Media includes recorded media and video games and is valued at $45.905 billion.
Performing Arts includes musical instruments and printed music and generates the global value
of $5.166 billion. Publishing, including books and newspapers is valued at $38.132 billion and
visual arts, including antiques, paintings, photography and sculptures is valued at $29,933
billion (UNCTADSTAT, 2013).


                                                                                  CREATIVE SECTORAL OVERVIEW                                9
THE WHITAKER INSTITUTE


Figure 2:
Global Value of Creative Goods, 2006-2012

                                  500,000

                                  450,000

                                  400,000

                                  350,000

                                  300,000

        $
  US
  Millions


                                  250,000

                                  200,000

                                  150,000

                                  100,000

                                   50,000

                                          0


(Adapted from UNCTADSTAT, 2013).

Figure 3 illustrates the percentage value of the global creative goods. Design creative products
account for 59% of all creative goods (UNCTADSTAT, 2013).

Figure 3:
Percentage Value of Global Creative Goods

                                                  Publishing
   Visual
  Arts
                  Art
  Cra
THE WHITAKER INSTITUTE
1.2 Classification of the Creative Industry
A number of different models have been developed in order to classify the creative industry.
Figure 4 classifies the creative industry using the UK’s Department of Culture Media and Sport
(DCMS) model.
Figure 4:
Classification of the Creative Industry
(Adapted from UNESCO, 2013).
1.2.1 Heritage
Heritage sites are the focal attractions in cultural tourism worldwide. Heritage is also embedded
within cultural celebrations, festivals and folklore. Many indigenous communities, such as the
Mayas and the Incas reproduce their ancient crafts, using original designs, generating revenue.
Heritage goods are such items as carpets, wickerwork and yarn products while heritage
services include services associated with monuments, archaeological sites, museums and
libraries. Global heritage services were valued at $11.3 billion in 2008. Developing economies
export almost twice as much heritage goods as developed economies (UNCTAD, 2010).
CREATIVE SECTORAL OVERVIEW 11
THE WHITAKER INSTITUTE


1.2.2 Art Crafts
Art Crafts accounts for 6% of the global value of the creative goods market. It generated $34.2
billion in 2011 (UNESCO, 2013b). World exports increased 95% from $17.5 billion during 2002
to 2011. Art Crafts are paramount for exporting earnings in developing countries. The main
exporting regions for art crafts are Europe and Asia. Figure 5, illustrates the art and crafts
exports for 2002 and 2011. The graph shows the global art crafts exports as well as exports for
the developing, developed and transitions economies. In 2002 both the developing economies
and the developed economies exported a similar amount. In 2011 there was a difference of
$12.7 billion, outlining the changed trend. The developing economies account for 64% of global
exports, China being the largest exporter (UNCTAD, 2010).


Figure 5:
Art Crafts Exports by Economic Region, 2008

                               34,209

       35,000

       30,000

                                                         23,383

       25,000

                      17,503

       20,000

       15,000
                                                                     10,653

                                             9,201
                    8,256

       10,000

        5,000
                                                                                    45
     172

              0

                        World
             Developing
               Developed
               TransiNon


                                              2002
  US$m
          2011
  US$m


(Adapted from UNESCO, 2013b).

1.2.3 Performing Arts
The global market for performing arts is estimated at $40 billion as of 2008. It is expressed as
an intangible service which makes it difficult to quantify.                                The three largest markets for
performing arts are the United States, the United Kingdom and France. Income from this sector
is derived from box-office revenues, touring and performance royalties and taxation. Theatre,
opera, poetry, dance, ballet, concerts, the circus and puppetry are all examples of performing
arts. In developed countries, performing arts benefit from government grants or subsidies, while
in developing countries, such funds are extremely limited. Intellectual property matters are

                                                                                CREATIVE SECTORAL OVERVIEW                 12
THE WHITAKER INSTITUTE


constant issues for performing artists as well as tax regulations and permit application
procedures (UNCTAD, 2010).


1.2.4 Music
Digital technologies are changing the way in which music is created, produced, reproduced,
commercialised and consumed in both national and global markets.           Digital tools such as,
internet peer-to-peer networks, mobile phones and mp3 players have impacted the music
industry. Large transnational, vertically and horizontally integrated conglomerates dominate the
global music industry.   Even though more and more music is being consumed worldwide,
songwriters, producers and performers’ profits have been declining. This is due to issues with
intellectual property rights and a lack of control of current ICT tools used for accessing the
global music industry. In order for the music industry to maximise profits, governments and
international treaties need to be approached in order to enforce the development of copyright
legislation. Furthermore, the development of an alternative to illegal copyrighted music and the
commercialisation of peer-to-peer file sharing and online distribution will enhance the global
music industry (UNCTAD, 2010).

The recorded music market consists of consumer spending on music that is distributed in
physical and digital format. Live performances and merchandising revenues are not included.
Digital distribution includes, downloads by mobile devices, computers and wireless carriers via
online licensed services. Although the market is fragmented with thousands of independent
artists, producers and bands, four major labels dominate the market; Sony/BMG, Universal
Music, EMI and Warner Music. These four labels command 80% of the global music market
(UNCTAD, 2010). The USA and Japan are the largest markets for recorded music in the world.
Figure 6 illustrates the leading markets for recorded music (Artfacts, 2014).

                                                            CREATIVE SECTORAL OVERVIEW              13
THE WHITAKER INSTITUTE


Figure 6:
Global Market Share of Top Ten Music Markets

                                                               Percentage
  of
  Market
  Share


                  Italy
      1

       Netherlands
           1

                Brazil
               2

             Canada
                          3

          Australia

                      3

             France

                              6

                    UK
                                              9

          Germany
                                                   9

                Japan
                                                                                          25

                  USA
                                                                                              26


(Adapted from Artfacts, 2014).

Total music sales for 2013 were down 3.9% from 2012 (IFPI, 2014). The global digital revenue
for 2013 reached US$5.9 billion. Digital sales account for 39% of total industry global revenues
and in three of the top 10 markets, digital channels account for the majority of revenues. Global
brands such as Deezer and Spotify are reaping the benefits of geographical expansion (IFPI,
2014).         Subscriptions increased by 51% from 2012 making downloads the most significant
digital tool.            Figure 7 illustrates the top online music providers, with iTunes dominating the
market with 200 million subscribers worldwide (IFPI, 2014).

                                                                                                    CREATIVE SECTORAL OVERVIEW    14
THE WHITAKER INSTITUTE


Figure 7:
Top Online Music Providers

                                                         Subscribers
  in
  Millions


          Rhapsody
          1.7


       Muve
  Music
        2


            Pandora
           4


             Deezer
            5


             SpoNfy
                    10


              iTunes
                                                                                                      200


(Adapted from Adegoke, 2014).

Due to decreasing CD sales, global music revenues have been decreasing since 2002, from
$US25.1 billion to $US15 billion (See Figure 8) (Statista, 2014).

Figure 8:
The Declining Revenues of the Music Industry 2002-2013

                                                              $US
  Billions


              25.1
   23.3

                                22.4
   21.8
   21.1

                                                           19.5
   18.1

                                                                             16.5
   15.9
   15.7
   15.6
     15


            2002
   2003
   2004
   2005
   2006
   2007
   2008
   2009
   2010
   2011
   2012
   2013


(Adapted from Statista, 2014).

The music industry has been in decline with 2013 bringing about the 14th year of decline for the
industry. The CD continues to decline the global market as well as a reduction of 9% in the
world’s second largest music market; Japan. Table 1 shows a decline of 3.9% between 2012
and 2013. Digital sales are expected to outpace physical sales by 2015. Physical revenue is

                                                                                         CREATIVE SECTORAL OVERVIEW                   15
THE WHITAKER INSTITUTE


forecasted to decline by 44% by 2019, while streaming and subscriptions transition is expected
to reduce download revenues by 39% (midiaresearch, 2014).

Table 1:
Global Recorded Music bb Format, 2012 & 2013 (US$ millions)

                      2012 Share        2012 Value         2013 Share         2013 Value
       Physical           56%                8,752              51%                7,730
       Digital            36%                5,637              39%                5,872
       Other               8%                1,263              10%                1428
       Total Market                         15,652                                15,029

(Adapted from IFPI, 2014).

International trade of recorded music is dominated by developed economies accounting for 90%
of total global exports. The export and import of music CDs by developed countries accounted
for 80%-90% of world trade in music goods in 2008.            As music is created, recorded and
commercialised by transnational companies, developing countries import both foreign music
and their own music (UNCTAD, 2010).

1.2.5 Visual Arts
Visual arts comprises of antiques, paintings, sculptures and photography as well as engravings,
carvings, lithographs and collages.     The value of art is determined by the exclusivity and
originality of the piece. The global sales of visual arts reached $65.9 billion in 2014 which is an
increase of 8% from 2013.         The United States is the international art market leader,
representing 38% of the market. China accounts for 24%, while the UK accounts for 20%
(Kazakina, 2014).

Developed countries generally trade art via auction sales, galleries and museums, while
developing countries typically trade informally in flea markets, targeting tourists. The largest
marketplace is the auction houses, which can charge commission of up to 20% (UNCTAD,
2010). Global online sales generated €2.5 billion in 2013, with an estimated 25% per annum
growth rate, with a forecasted €10 billion estimate for 2020 (Kazakina, 2014).

There are, like the music sector, issues regarding the intellectual property rights for the resale of
original art works. The export value of visual arts increased from $6.3 billion in 2002 to $15

                                                              CREATIVE SECTORAL OVERVIEW                16
THE WHITAKER INSTITUTE


billion in 2008. Figure 9 illustrates the global export values of the different visual arts (UNCTAD,
2010).

Figure 9:
Global Export Value of the Visual Arts

                                                  $
  Billions


                        15


                                          9


                                                                      3.2
                2.5


                PainNngs
       Sculpture
             AnNques
                Photography


(Adapted from UNCTAD, 2010).

1.2.6 Audio Visuals
The audio visual sector comprises of motion pictures, television, radio and other forms of
broadcasting.    This industry poses challenges for governments, especially in developing
countries due to low levels of investment as well as economic difficulties. The main issue for
developing countries is the lack of domestic facilities and the difficulty in accessing global
distribution channels (UNCTAD, 2010).             The audio visuals sector has decreased within
developed countries and the transition countries between 2002 and 2011. In contrast, due to
increased levels of investment, an improving economic climate and with an expanding middle
class the developing countries have seen a 157% increase in audio visuals exports between
2002 and 2011. Figure 10 illustrates the change in the audio visual sector between 2002 and
2011.

                                                                                CREATIVE SECTORAL OVERVIEW   17
THE WHITAKER INSTITUTE


Figure 10:
Audio Visual Exports by Economic Group, 2002-2011

                             492

                   455

       500
                                                       417
      400

       400

       300

       200
                                          90

       100
                                 35

                                                                                                3
     2

           0

                   World
               Developing
            Developed
             TransiNon


                                   2002
  US$
  millions
      2011
  US$
  millions


(Adapted from UNESCO, 2013b).

1.2.6.1 Film Industry
The making, distribution and exhibition of global films are dominated by a small number of
vertically integrated groups. Film revenue for 2014 is $90.9 billion. Figure 11 illustrates the
forecasted global growth of the film industry.

                                                                                        CREATIVE SECTORAL OVERVIEW   18
THE WHITAKER INSTITUTE


Figure 11:
Forecasted Growth of the Film Industry, 2013-2018

                                                 $
  Billions


                                                                                    110.1

                                                                         104

                                      94.3
                98.5

            88.3
       90.9


          2013
       2014
       2015
               2016
        2017
      2018


(Adapted from Statista, 2014b).

Global box office revenue for 2013 was $38 billion with China being the leading box office
market with revenue of $3.6 billion in 2013 (Statista, 2014c). Developing countries’ growth
potential is limited due to high cinema admission costs, compared with GDP per capita as well
as a shortage of venues. The majority of films are produced in India with 1,325 movies being
produced in 2014. Nigeria produced the second most films with 872 followed by the United
States with 520. Figure 12 shows the leading film producing countries in the world.

                                                                       CREATIVE SECTORAL OVERVIEW   19
THE WHITAKER INSTITUTE


Figure 12:
Leading Film Producing Countries

                                                                       Number
  of
  produced
  films


                    Ireland
           22

               Germany
                          125

                        Spain

                 173

                    Nigeria
                                                                                 872

                      Russia
                             220

          United
  States
                                                             520

                             UK
                111

                    France

                             240

                           Italy
                 154

       Republic
  of
  Korea
                 113

                         Japan
                                               418

                         China
                                              406

                          India
                                                                                          1,325


(Adapted from Chartsbin, 2014).

The increase in production of digital films allows for economies of scale and yields savings for
film producers. Digital films are distributed as removable disks, over specialised networks and
by satellite. Digital screens are growing in popularity, with the United States having 5,500
screens in 2008, 1,000 in the EU and 800 in China. Box office receipts rose in the United
States in five out the last seven recessions (UNCTAD, 2010).

1.2.6.2 Television and Radio
The television and radio sector generates income from copyrights, trademarks, advertising,
subscriptions and viewer licences. The number of TV households worldwide is forecasted to
reach 1.675 billion by 2018, with the number of digital TV households reaching 1.542 billion.
Cable with 592.3 million subscribers is predicted to gradually lose ground to satellite and IPTV.
Satellite will account for 32.9% and IPTV will account for 10.9% by 2018. Global TV industry’s
revenue is forecasted to reach €459.2 billion by 2018 with video-on-demand reaching €35.4
billion (Paoli-Lebailly, 2014).                        The majority of developing economies are net importers of
television creative content (UNCTAD, 2010).

                                                                                                   CREATIVE SECTORAL OVERVIEW          20
THE WHITAKER INSTITUTE


Radio, due to its broad coverage, is a major communication tool. Its main source of revenue is
through advertising. The total radio advertising revenue is valued at $17.6 billion (Plunkett
Research, 2014). The global radio sector is currently valued at $45.7 billion and is expected to
increase to over $50 billion by 2018. Figure 13 shows the forecasted increase in the global
radio industry from 2013-2018.

Figure 13:
Global Radio Industry Revenue, 2013-2018

       51

       50

       49

       48

       47

       46
                                                                                  $
  Billions

       45

       44

       43

       42

       41

                2013
     2014
     2015
     2016
     2017
     2018


(Adapted from Statista, 2014d).

Most countries require radio broadcasters to provide a minimal domestic production, covering
local news and national music.                   Exports of audio visual goods from developed countries
reached $706 million in 2008 while developing countries reached $75 million (UNCTAD, 2010).

1.2.7 Publishing and Printed Media
Publishing and printed media is comprised of literacy production, including books, newspapers,
magazines etc. This industry faces challenges due to the growing trend of electronic publishing.
The industry is supported by advertising revenue. Consumer e-book revenue is estimated at
US$8.4 billion and is forecasted to increase to US$18.9 billion by 2018 while global consumer
books are forecasted to increase to US$64.9 billion (Statista, 2014e). Tablet ownership is a
major driver of the increase in global digital revenue.                           Figure 14 illustrates the global unit

                                                                                  CREATIVE SECTORAL OVERVIEW              21
THE WHITAKER INSTITUTE


shipment of e-readers from 2010 to 2014 with 30 million units being shipped in 2014 (Statista,
2015). China is forecasted to overtake Japan and become the second largest book market by
2017 with revenues of US$13.2 billion, after the United States with revenue of US$37 billion.
Magazine revenue is predicted to reach US$98.1 billion by 2018 with a 0.2% year-on-year
growth as digital gains outweigh falling print revenue. The declining global newspaper industry
is expected to cease its decline in 2015 as developing countries’ newspaper revenue improves.
While developing countries newspaper revenue increases, developed countries revenue will fall
(PWC, 2014).

Figure 14:
Unit Sales of E-Readers Worldwide from 2010 to 2014 (millions)

                                                        41.4

                                    39.6

       45

                                                                                 34.2

       40
                                                                                            30

       35

       30

       25
          16.7

       20

       15

       10

        5

        0

                2010
          2011
           2012
                      2013
         2014


                                               units
  in
  millions


(Adapted from Statista, 2015).

1.2.8 Design
Creative design comprises of items such as jewellery, graphics, architectural plans, toys,
glassware and fashion accessories as well as interior objects (UNCTAD, 2010). The global
fashion industry is valued $1.2 trillion annually, employing 4,200,000 people (Statisticbrain,
2014). Design is the leading subgroup for creative goods. Its value doubled from $115 billion in
2002 to $242 billion in 2008. China and Italy have become leading exporters of design goods
(see Figure 15). Italy has a large share of the world market due to its renowned role in the

                                                                                CREATIVE SECTORAL OVERVIEW             22
THE WHITAKER INSTITUTE


fields of interior design, fashion and architectural services. With developing economies, design
is the third-largest creative sub-group, after art crafts and new media.

Figure 15:
Leading Design Goods Exporters, 2008

                                                               $
  Millions


                                                         58,848


         23,618

                                                                                   16,129

                      12,150
                                                                  10,871
   7,448
   7,759

                                   3,783
   2,773
                  1,140


(Adapted from UNCTAD, 2010).

1.2.9 New Media
New media began in the 1990’s due to the advances in ICTs. It is the newest group among the
creative industries. As a creative product it comprises of software, cartoons and video games.
It is also a distribution and marketing tool of other creative products like music, films, books or
services such as advertising and architectural services (UNCTAD, 2010).                                                     The worldwide
software revenue totalled $407.3 billion in 2103, which was a 4.8% increase from 2012, with
Microsoft retaining the leading spot, followed by Oracle (Gartner, 2014).                                                The global video
games revenue for 2013 was $93 billion, with forecasted revenues of $55 billion for 2015
(Gartner, 2014b).

Table 2 illustrates the top 5 countries in the world for creativity in advertising. As can be seen
from Table 2, The United States ranks first in the world for creativity in advertising (Creative
Industries, 2014).

                                                                                           CREATIVE SECTORAL OVERVIEW                       23
THE WHITAKER INSTITUTE


Table 2:
Top Five Countries in the World for Creativity in Advertising

       Rank          2008                         2013
       1             USA                           USA
       2              UK                        Australia
       3          Argentina                         UK
       4          Germany                         Brazil
       5            Japan                        France

(Adapted from Creative Industries, 2014).

1.3 Major Drivers of the Global Creative Sector
The primary drivers of growth in the global creative sector are technology, demand and tourism
(UNCTAD, 2010).

1.3.1 Technology
In order to improve the collaboration between academic and creative research, an increasing
number of countries are building platforms to stimulate innovative projects that involve science
and creativity and incorporate open-source technology. In the Netherlands, for example, an ICT
innovation platform has been established to implement a strategic research agenda for the
creative industries, helping to make creativity more visible (UNCTAD, 2010).

The manner in which creative content is produced, distributed and consumed has been
impacted by the merging of multimedia and telecommunication technologies. A substantial
growth in private-sector investment due to the deregulation of media and telecommunication
industries and the privatisation of state-owned enterprises has improved output and
employment (UNCTAD, 2010).

Due to digital technology, distribution channels and platforms have increased such as video-on-
demand, music podcasting, streaming, computer games and TV services via cable, satellite and
the internet (UNCTAD, 2010). Netflix, founded in 1997, for example is the global leader in
internet television, with over 50 million customers in nearly 50 different countries. Customers
access more than 2 billion hours of TV shows and movies per month. The company’s annual

                                                            CREATIVE SECTORAL OVERVIEW             24
THE WHITAKER INSTITUTE


revenue in 2013 reached $4.37 billion and employs 2,200 individuals (Netflix, 2014). Figure 16
illustrates the accumulating Netflix subscribers from 2011 to 2014.

Figure 16:
The Accumulation of Netflix Subscribers

                                             Subscribers
  in
  millions


                                                                                                  53.06

                                                                             44.35

                                         33.27

                  23.53


           2011
                 2012
                              2013
               2014


(Adapted from Statista, 2014).

1.3.2 Demand for Creative Products
Another driver of growth within the global creative industries is the increase in demand for
creative products. This increase in demand is influenced by technology advances, rising real
incomes as well as the falling prices of creative products and their distribution channels.
Demand-side interactions include DVD and MP3 players, which in turn depend on the quality of
the films and music. The demand for video games requires innovative games and newer,
cheaper games consoles.       Demographics also influence demand, with the expected world
population to grow to 9 billion by 2050 and the increasing average life expectancy generating an
aging population with more leisure time (UNCTAD, 2010).


1.3.3 Tourism
The growth in worldwide tourism is a further driver of the global creative industry. Tourists are
the primary consumers of recreational and cultural services as well as substantial purchasers of
creative products like crafts and music. The growth in cultural tourism contributes substantially
to growth of the creative industry which includes visits to cultural heritage sites, festivals,
museums and galleries as well as music, dance, theatre, opera etc.                       The UNESCO World
Heritage list contributes to the growth of this sector with 890 recommended heritage sites.

                                                                           CREATIVE SECTORAL OVERVIEW         25
THE WHITAKER INSTITUTE


National Overview of the Creative Sector

National Overview

Introduction
Ireland has a strong international reputation for creativity and the creative industries of Ireland
are gaining more and more recognition as a major sector of the economy (Collins et al., 2014).
This sector is a large provider of employment and contribution to GNP (DKM, 2009).


2 National Overview
2.1 National Market Size
The last estimate of the value of the creative sector for Ireland was €4.6 billion, composing
approximately 2.8% of GDP. Employment directly created by the creative industries amounts to
48,308 while all employment (direct, indirect and induced) amounts to 76,862. Ireland is highly
                                                                  th
ranked as 10th on the Global Innovation Index 2013 and 12 on the Global Creativity Index
2011. The largest sectors within Ireland’s creative industries is software which makes up more
than half of overall gross value added, followed by literature and publishing, radio and television
and advertising.

2.1.1 Heritage
In 2008, 43% of all overseas visitors engaged in some historical/cultural activity, generating
expenditure that represents 56% of the total overseas visitor expenditure in Ireland (DKM,
2009). Figure 17, illustrates the number of overseas visitors that visit heritage sites in Ireland.


                                                              CREATIVE SECTORAL OVERVIEW              26
THE WHITAKER INSTITUTE


Figure 17:
Number of Overseas Visitors Engaging in Cultural Activities

                                                                 Visitors
  in
  millions


                                        3,723


                                                             2,438

                        1,594
                                                  1,508
          1,760
         1,668


(Adapted from Fáilte Ireland, 2014).


2.1.2 Art Crafts
It is estimated that there are 5,771 individuals employed within the art crafts sector of Ireland.
Within this sector there are 4,191 persons employed within enterprises that employ 3 or more
people. The highest employing subsectors are pottery and ceramics, jewellery, graphic crafts,
textiles and stone.                 Approximately €124.5 million is exported annually, while €373.5 million
accounts for Irish sales. Figure 18, displays an estimation of craft employment in Ireland, with
enterprises that employ 3 or more employees (Indecon, 2010).


Figure 18:
Number of People Employed within Art Craft Sector in Ireland

                                                     Employed
  within
  art
  cra
THE WHITAKER INSTITUTE
Graphic Crafts generate the highest revenue, followed by pottery and ceramics then stone
(Indecon, 2010). Figure 19 displays the gross value added of each subsector of the art craft
sector, with enterprises employing more than 3 people.
Figure 19:
Gross Value Added of Art Craft Sector in Ireland
€
Gross
Value
added
Other
713,053
Glass
9,199,955
Heritage
&
Rural
CraTHE WHITAKER INSTITUTE
this time increased by approximately €17 million (Grant Thornton, 2013). Figure 20 illustrates
the value of the Irish music market between 2006 and 2012.
Figure 20:
Irish Music Market Value, Digital & Physical
Physical
(€million)
Digital
(€million)
151
133
108
84
58
47
42
14
17
19
8
10
13
2
2006
2007
2008
2009
2010
2011
2012
(Adapted from Grant Thornton, 2013).
It is estimated that 770,000 people or one in six people in Ireland have engaged in illegal music
or movie downloading, costing the exchequer €4.5 million (Retail Ireland, 2014).
In Ireland, there are over 20 licenced digital music outlets, including download stores, video
streaming sites and subscription offerings. These combined offerings generated 34% of the
recording industry’s trade revenue, accounting for €14 million (IRMA & PPI, 2011).
Regarding the sales of recorded music, digital album sales in Ireland account for 34% of the
industry’s digital trade revenues. Subscription services accounted for 10% of record
companies’ trade revenue in 2011 (IRMA & PPI, 2011).
2.1.5 Audio Visual
The Irish audio visual sector is estimated to be worth over €550 million, employing in excess of
6,000 individuals, with over 560 small and medium enterprises. A target of creating 5,000 new
jobs and increasing annual revenue to €1 billion by 2016 has been outlined in the Creative
Capital – Building Ireland’s Audio Visual Economy report prepared for the Minister of Arts,
Heritage and the Gaeltacht by the Audiovisual Strategic Review Steering Group in April 2011.
CREATIVE SECTORAL OVERVIEW 29
THE WHITAKER INSTITUTE


Ireland has 110,000 square foot of industry standard studio space and would require an
additional 100,000 square foot in order to reach this target. The cost of this space is estimated
at €30 million. The Government have been called upon by the chairwoman of TG4 to establish
a €15 million infrastructure fund to support the project (Coyle, 2014).

Table 3 displays the revenue generated by the different audio visual outputs in Ireland in 2010.
As can be seen from table 3, the feature film and independent TV sectors show an increase of
almost 100% from 2009 to 2010, while the animation sector experienced a drop of nearly 50%
(IFTN, 2011).


Table 3:
Audio visual output 2007-2010

       Audio visual Output      2007 €m        2008 €m        2009 €m      2010 €m
       Feature Film                19.3           71.9           58.6        116.7
       Independent TV             154.0          136.0          127.1        241.5
       Animation                   22.4           38.9           57.6         29.7

(Adapted from IFTN, 2011).


Ireland currently has 465 cinema screens with 72% of them being digital (IFB, 2014). It is
estimated that 100,000 movies are downloaded illegally in Ireland each week (Grant Thornton,
2013).

Ireland has access to 558 TV stations, with 542 being foreign and 16 being local. Over 80% of
Irish television viewers watch 25 services of which 17 are established in Ireland. There are 6
National stations, 5 regional stations and 26 local radio stations and 26 community stations
(Shaw et al, 2010).      The UK satellite packager BskyB has approximately 600,000 Irish
subscribers, while the cable market is controlled by one operator, UPC Ireland, with 410,000
Irish customers. Two operators, Magnet Networks and Eircom provide IPTV, which take up
only 2% of households (mavise, 2013).


2.1.6 Publishing and Printed Media
Ireland’s newspaper industry generated €830 in revenue in 2011, employing 4,494 people.
Some 5.2 million newspapers are sold each week in Ireland (NNI, 2013). This sector however
is experiencing the highest rate of decline with a 7.1% contraction forecasted up to 2018.
Publishers are investing in the digital elements of their business models and are experiencing

                                                             CREATIVE SECTORAL OVERVIEW             30
THE WHITAKER INSTITUTE
some growth with digital advertising revenues (PWC, 2014). Online advertising increased by
40% with Irish Times Ltd, earning €8 million in digital revenues in 2014, equating to 13% of total
publishing revenues, which is up 8% from 2013 (Slattery, 2014).
EBooks are a very important and profitable part of the sales mix, yet if Irish readers want to buy
an eBook, they typically have to purchase from a foreign retailer. Easons have improved their
eBook listings, by offering 60% of the titles from the top ten list (Irish Publishing News, 2011).
2.1.7 Design
Ireland’s design sector is valued at €465 million, employing 5,100 individuals. The design
services sector is predominantly comprised of smaller organisations. The largest of these
companies are those with employees of five or less. Figure 21, illustrates the size of design
firms in Ireland by the number of employees (IntertradeIreland, 2010).
Figure 21:
Size of Design Firms in Ireland
4%
4%
21%
1
Employee
10%
2-‐5
Employees
24%
6-‐10
Employees
37%
11-‐20
Employees
21-‐50
Employees
50+
Employees
(Adapted from IntertradeIreland, 2010)
The types of services offered by Irish design firms are illustrated in Figure 22. Communications
and graphic services account for 54% of all Irish design firms, followed by interior design and
multi-media.
CREATIVE SECTORAL OVERVIEW 31
THE WHITAKER INSTITUTE
Figure 22:
Types of Services Provided by Irish Design Firms
Design
Service
Type
CommunicaNons
&
Graphics
54%
Product
&
Industrial
Design
19%
Interior
&
ExhibiNon
Design
38%
Fashion
&
TexNles
3%
Digital
&
MulN-‐Media
37%
(Adapted from IntertradeIreland, 2010)
The Design & Crafts Council of Ireland in collaboration with such organisations as Enterprise
Ireland, the Department of Foreign Affairs and Trade and Enterprise & Innovation have
organised ‘Irish Design 2015’. The objective of Irish Design 2015 is to grow employment
opportunities, sales and export potential for the Irish design sector (Design and Craft Council of
Ireland OI, 2014).
2.1.8 New Media
Ireland has developed a strong global reputation as a centre for software excellence over the
last 30 years, due to a strong multinational presence as well as a greater number of successful
indigenous companies (Smyth, 2014). There are an estimated 806 indigenous software
companies in Ireland, with total annual revenues of over €1.8 billion, employing over 10,000
individuals (ISA, 2014). Some 98% of Irish software companies are SMEs with over half of
these employing between 5 and 20 individuals. Approximately one third of Irish software
companies have a turnover of over €1 million and 75% have over €100,000 (ISA, 2014). The
Irish software sector has challenges sourcing skilled candidates as there are more jobs than
applicants, especially in all core programming areas, with 51% of Irish software companies
stating that this is their main challenge (Smyth, 2014).
The Irish animation sector generated €326.8 million in 2011, employing 2,321 individuals. Irish
animation companies are becoming more export orientated, providing content to such
CREATIVE SECTORAL OVERVIEW 32
THE WHITAKER INSTITUTE


companies as Disney, Nickelodeon and the BBC, accounting for 80% of overall sales.
Enterprise Ireland is aiding the development of indigenous animation companies, and to help
grow their businesses globally (Animation Ireland, 2012).

Another subsector of the new media sector is the video games sector. The video games market
was valued at €248 million in 2012. This sector employs more than 2,800 individuals in 80
companies across Ireland (Ryan, 2013). The average video gamer is 32 years old, with 25%
being over 50.

2.1.9 National Policies
The Department of Environment, Community and Local Government cooperate to fund local
heritage projects through the Rural Development Programme. The Department of the Arts,
Heritage and the Gaeltacht and the Department of Social Protection also cooperate to develop
arts sector internships in conjunction with local authority arts offices. In 2013, The Department
of Arts, Heritage and the Gaeltacht launched a charter which places responsibility on
government departments and cultural institutions to promote the arts in schools. Tax incentives
also exist to support cultural and creative industries (Collins et al., 2014).


Table 4:
Government Depts, Authorities, Agencies in Charge of Culture and Creative Industry Policy

       Dept./Authority/Agency               Function
                                            Responsible for the arts, culture, film, music,
       The Department of Arts,
                                            heritage, the Irish language and oversight of cultural
       Heritage and the Gaeltacht
                                            institutions.
       The Department of
       Communications, Energy and           Responsible for policy on broadcasting
       Natural Resources
       The Department of Jobs,
                                            Responsible for business development
       Enterprise and Innovation
                                            Responsible for local government policy with a focus
       The Department of
       Environment, Community and           on culture and heritage.
       Local Government

(Adapted from Collins et al., 2014).

                                                               CREATIVE SECTORAL OVERVIEW            33
THE WHITAKER INSTITUTE


The Arts Act 2003 provides the national cultural institutions displayed in Table 5 with a degree
of autonomy. The National Campaign for the Arts also provides autonomy and a degree of
separation from the government bodies. There is collaboration however as Enterprise Ireland,
who is funded by The Department of Jobs, Enterprise and Innovation in turn supports The
Crafts Council. Funding cuts as a result of recession are a key issue for cultural policy in
Ireland and private investment from well established businesses and multinationals are
necessary (Collins et al., 2014).

Table 5:
National Cultural Institutions and their Functions

       Cultural Institution   Function
       The Irish Film         Responsible for the development of the film industry in
       Board                  Ireland

       The Crafts Council     Supports Craft in Ireland

                              Responsible for funding, developing and promoting the
       The Arts Council
                              arts

(Adapted from Collins et al., 2014).


                                                          CREATIVE SECTORAL OVERVIEW               34
THE WHITAKER INSTITUTE


Regional and Local Overview of the Agriculture
Sector

Regional and Local Overview

Introduction
Approximately 3% of total employment within the Western Region of Ireland is employed within
the creative sectors. The sector generates an estimated annual turnover of €534 million and
contributes to €270 million to the Gross Value Added of the region (White, 2013).

3 Regional and Local Overview
3.1 Regional Market Size
The creative sector in the West of Ireland is typically composed of self-employed individuals or
micro-enterprises, with 12% of the businesses having more than 10 employees, 49% having
between 2 and 10 employees and 39% being sole traders. Only one third of these businesses
received more than 5% of their total turnover from exports. The West of Ireland has 2,466
creative companies (Collins et al., 2014), with 41% of all creative industries in the region based
in Galway. Table 6 outlines the estimated number of people employed in the creative sector
within the West of Ireland and the share of the county’s total employment (White, 2013). It was
announced in Budget 2015 that the threshold for the artists’ exemption will be €50,000 for
creative work with cultural or artistic merit such as books, plays, musical compositions, paintings
and sculptures (Department of Finance, 2014).

Table 6:
Number and Share Employed in the Creative Sector in the West of Ireland

       County      Employed        Share of Total Employment              Population
       Galway         3,878                       3.4%                       250,653
       Donegal        1,929                       3.1%                       161,137
       Mayo           1,536                       2.7%                       130,638
       Claire         1,303                       2.3%                       117,196
       Sligo          1,265                       4.2%                        65,393
       Leitrim         619                        4.4%                        31,798
       Roscommon       478                        1.7%                        64,065

                                                            CREATIVE SECTORAL OVERVIEW                35
THE WHITAKER INSTITUTE
(Adapted from White, 2013).
Galway has the largest number of individuals employed within the creative sector within the
Western Region of Ireland. The city of Galway has an internationally recognised reputation for
the arts as well as being a high-tech environment (White, 2013).
The creative sector accounts for 1 in every 33 jobs in the Western Region of Ireland. According
to the most recent retrievable data the highest number of companies within the creative sector
are in the music, visual and performing arts sectors, followed by craft, video, and film and
photography businesses, accounting for 66% of total businesses. They account for 31% of total
direct employment as well as 21% of turnover (Collins et al., 2014). Creative technology
companies, including internet and software, digital media and design have the largest economic
contribution, accounting for 7% of the total number of businesses, 25% of turnover and 15%
direct employment. Creative industry clusters are present around Galway city in the form of a
technology-based cluster. A digital media cluster is present on the outskirts of Galway city
where TG4 has been a strong anchor (Collins et al., 2014)
3.1.1 Heritage
There are 35 heritage sites, 31 museums and 10 art galleries in Galway City and County.
Galway’s Dún Aonghasa, Aran Island heritage site was awarded the Silver Merit Award of
Excellence 2013 (OPW, 2013). These sites attract many overseas visitors and generate
income for the economy. An initiative granting all OPW heritage sites free access on the first
Wednesday of every month has helped stimulate interest in Galway’s and Ireland’s built
heritage. Figure 23 illustrates the benefits of this initiative showing June’s visitors compared to
July’s in 2011 (Nee, 2011).
Figure 23:
Visitors to Galway’s Heritage Sites Jun-July 2011
485
600
400
181
183
96
200
24
86
22
59
10
46
0
Athenry
Aughnanure
Dún
Portumna
Patrick
Castle
Castle
Aonghasa
Castle
and
Pearse’s
on
Inis
Mór
Gardens
Co]age
Jun-‐01
Jul-‐06
CREATIVE SECTORAL OVERVIEW 36
You can also read