An Overview of the
Latest Climate Science
   for Policymakers
←
→
Page content transcription
If your browser does not render page correctly, please read the page content below
An Overview of the Latest Climate Science for Policymakers
‐ Latest Climate Science, Feb 2019

                             An Overview of the
                            Latest Climate Science
                               for Policymakers
                                        Summary
This paper provides a brief overview of the latest Climate Science, compiled by the ICSF for
the information of the Oireachtas Joint Committee on Climate Action and of the Draft
National Energy and Climate Plan (NECP), 2021‐2030.

It is a summary compilation of the latest climate research and observations by independent
scientists worldwide. The summary does not claim to be scientifically rigorous in every
aspect, but hopefully encapsulates the key facts in this rapidly‐evolving field.

The latest research and observations indicate that while there is an anthropogenic Green‐
House Gas (GHG) influence, it is considerably less than depicted by the IPCC. Much more is
also now understood about solar and other natural influences, weather events and many
physical observations. Objective analysis of the facts points to prudent mitigation action but
does not indicate a looming climate crisis.

Therefore the ICSF proposes that national climate policy should be based on ongoing energy
innovation, efficiency and conservation measures compatible with continued economic
growth, rather than imposing any economically and socially‐regressive measures.

                          The Irish Climate Science Forum
The Irish Climate Science Forum (ICSF) was founded in 2016 and is composed of a small
group of Irish scientists, engineers and several other professions. The ICSF is committed to
identifying and disseminating the latest climate science. Its members are characterized by an
open and enquiring mind on the science, driven by the imperative of truth and objectivity.

The ICSF seeks a sustainable future for Ireland and its people. It aims to better inform
national energy and climate‐related policymaking in the best long‐term national interest. It
therefore arranges invited lectures by distinguished international climate scientists. It also
engages in relevant public consultations.

ICSF operates to a very modest budget and is entirely self‐funded. It has no vested interests
other than disseminating the latest climate science in the public interest. To learn more
about the ICSF, please see www.ICSF.ie.

Jim O’Brien, Chair, ICSF.
Contact: jimobriencsr@gmail.com.

                                              2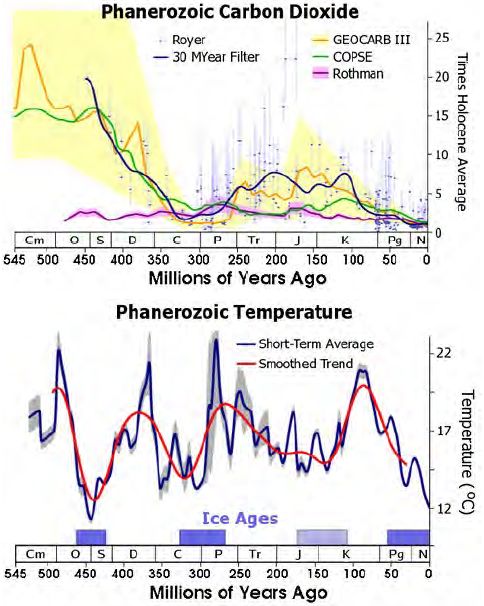
‐ Latest Climate Science, Feb 2019

  An Overview of the Latest Climate Science for Policymakers

  List of Contents:

Section                 Content                                                          Page

  1                     Evidence that the IPCC Models are “Overheated”                    3
          1.1           Global Temperature Trends lie below IPPC projections              3
          1.2           Recent Research shows low Climate Sensitivity                     3
          1.3           Agricultural Emissions have low GHG Influence                     5
          1.4           Effectively a Global Temperature Hiatus since 1998                5
          1.5           Sea Surface Temperatures exhibit non‐GHG Influences               6
          1.6           Evidence of Discrepancies in Temperature Databases                7

  2                     Climate Observations do not indicate a Planetary Crisis           9
          2.1           Arctic Sea Ice has been relatively stable since 2007              9
          2.2           Greenland also continues to be relatively stable                 10
          2.3           The Antarctic has regional variations, but is stable overall     11
          2.4           Global Sea Levels continue to rise at about 1‐3mm/year           12
          2.5           Recent “Extreme” Weather Events are not unprecedented, nor       13
                        is there a proven link with anthropogenic GHG emissions
                2.5.1   Wild Fires                                                       13
                2.5.2   Droughts                                                         14
                2.5.3   Hurricanes and Tornados                                          16
                2.5.4   Floods                                                           17
                2.5.5   Coral Bleaching                                                  18
                2.5.6   Heatwaves                                                        18
                2.5.7   Irish Weather Events                                             20

  3                     Understanding Solar and other Natural Influences                 22
          3.1           Influence of the Sun, Cosmic Rays on Clouds and Climate          22
          3.2           Possible Influence of Interplanetary Oscillations on Climate     23
          3.3           Longer term Solar Influence and possible Global Cooling          24

  4                     Lessons from Paleoclimate, recent Millennia and Centuries        26
          4.1           Warming and Cooling Episodes in Paleoclimate                     26
          4.2           Warming and Cooling Episodes in recent Millennia                 28
          4.3           Warming and Cooling Episodes in recent Centuries                 29

  5                     Increasing CO2 Levels are beneficial to Greening of the Planet   30

                        Appendix: List of References                                     31

                                              3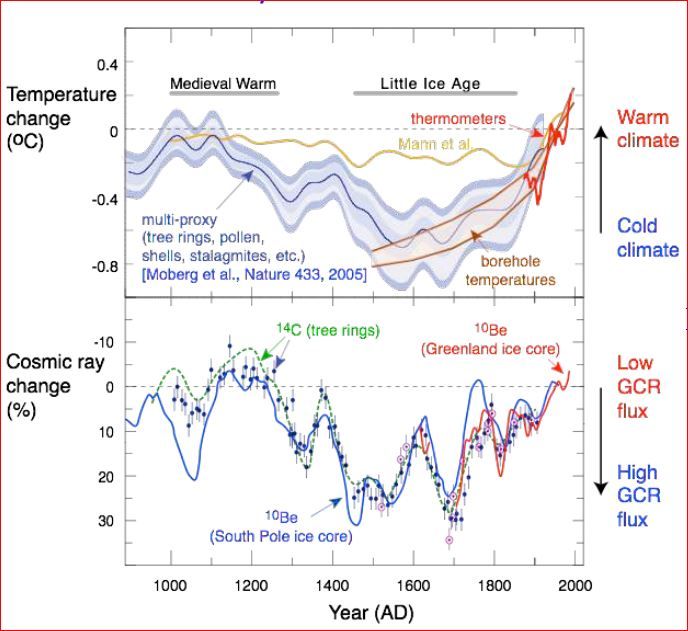
‐ Latest Climate Science, Feb 2019
1. Evidence that the IPCC Models are “Overheated”

1.1. Global Temperature Trends continue below IPCC Model Predictions

The IPCC (Intergovernmental Panel on Climate Change) Fifth Assessment Report (AR5) [Ref
1] was published in 2013, followed by its Special Report SR1.5 [97] in 2018. Since 2000,
actual tropical mid‐tropospheric temperature trends, even with the peak of the naturally‐
occurring 2015/17 El Niño, are lying well below the prediction of the IPCC models [2,3], as
illustrated in Figure 1. Tropical mid‐tropospheric temperatures are referenced in that this is
the region where the GHG warming “hot‐spot” should have occurred according the IPCC
global climate models. Both facts demonstrate that the IPCC models are “overheated”.

Figure 1: This graph demonstrates that tropical mid‐troposphere temperatures, based on satellite and
balloon data, which even at the El Niño peak, lie about 0.5°C below the mean of all IPCC AR5 models,
and the divergence continues to widen as the post 2015/16 hiatus continues. Source [2,87,94,100].

1.2. Recent Research shows lower Climate Sensitivity than estimated by IPCC

The “Climate Sensitivity” is the amount of global warming in degrees Celsius that is expected
to occur from a doubling of atmospheric Carbon Dioxide (CO2). The IPCC AR5 climate models
calculated that this value is somewhere in the range 1.5°C to 4.5°C, which range the IPCC has
not been able to narrow over the last 40 years.

However recent independent research [4] has produced successively lower limits of climate
sensitivity, as in Figures 2 and 3. The current view is that climate sensitivity due to GHG
(Green House Gases) is only about 1°C or less. In particular, the recent paper by Prof Ray
Bates [5] demonstrates climate sensitivity of the order of 1°C, similar to that previously
estimated by Lindzen and Choi in 2011 [7,26]. Serious questions are also beginning to arise
in the scientific literature [6,8,9] about the tuning procedures for the sub‐grid scale physical
processes used in the IPCC Global Climate Models. The average global temperature rise since
1880 is about 1°C, based on IPCC’s AR5 estimate of 0.85°C to 2012 and the continuing hiatus
since then, though IPCC AR5 did not attribute all that warming to GHGs.

                                                 4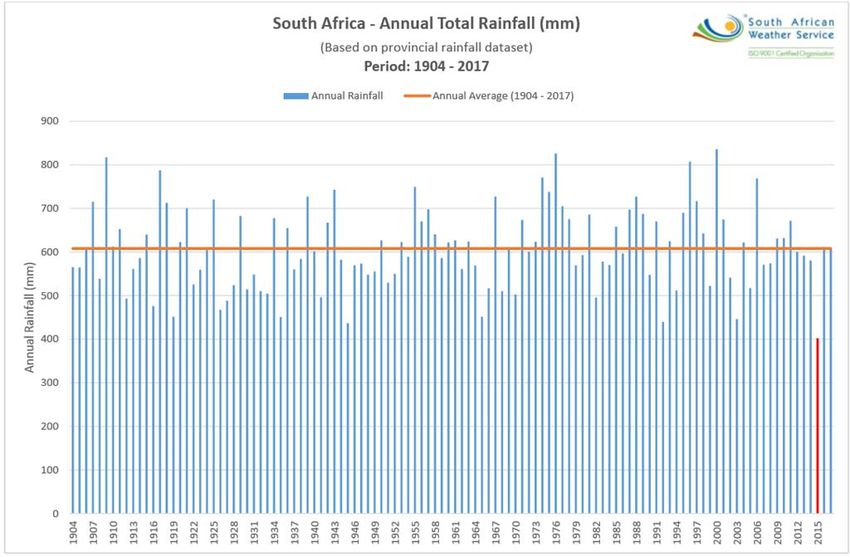
‐ Latest Climate Science, Feb 2019

Figure 2: Compilation of published Transient Climate Response (TCR) and Equilibrium Climate
Sensitivity (ECS) values to atmospheric CO2 doubling. Source [72].

Figure 3: A more recent comparative chart of estimated Equilibrium Climate Sensitivity (ECS) for
doubling of atmospheric CO2, illustrating those of Lindzen and Choi (2011) and Bates (2016) being in
the region of only 1°C. Source [86].

                                                 5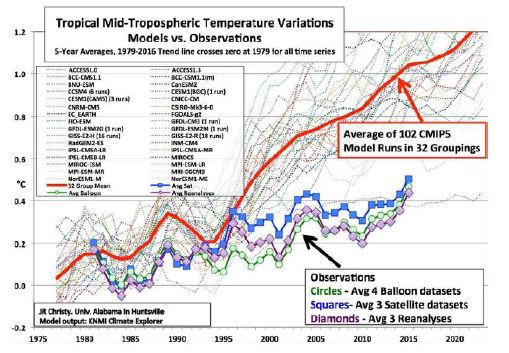
‐ Latest Climate Science, Feb 2019
In October 2016, an article by Voosen [11] appeared in Science Magazine under the title
“Climate scientists open up their black boxes to scrutiny”. This has been followed by an
article with lead author Hourdin [10] in the March 2017 issue of the Bulletin of the American
Meteorological Society entitled “The art and science of climate model tuning”. Until
recently, it had been assumed that the climate sensitivity given by the GCMs was
determined by the physics of the models, but it now appears that these were tuned by the
modelers to give a climate sensitivity that lay in “an anticipated acceptable range”. Prof Ray
Bates has further described these modeling deficiencies in his recent paper [98].

1.3. Agricultural Emissions have lower GHG influence than estimated by IPCC

Another significant update in climate since AR5 is that the actual GHG influence of Methane
(CH4) and Nitrous Oxide (N2O), typical agricultural emissions, is significantly less than
estimated by IPCC [12,13], another significant error in its modelling.

This is because, in the real life situation, the absorption bands of both CH4 and N2O overlap
with those of the dominant greenhouse gases, water vapour (H2O) and Carbon Dioxide
(CO2). This limits how much radiative forcing can be caused by CH4 and N2O, as shown in
Figure 4 below. Accordingly, both CH4 and N2O make miniscule contributions to radiative
forcing (and hence on global warming) in comparison to H2O and CO2. This key new research
is shortly to be published by Profs William Happer and William van Wijngaarden [99].

Figure 4: This graph demonstrates the overlapping absorption bands of methane and nitrous oxide
compared to CO2 and water vapour. Source [12].

1.4. There has effectively been a Global Temperature Hiatus since 1998

This lower sensitivity is confirmed by ongoing scientific observations, particularly by satellite
and balloon data, that actual global temperature (despite the peak of the recent El Niño) are
now effectively at the same level as after the 1998 El Niño [14,15]; there has effectively been
a global temperature hiatus since then, as depicted in Figure 5. This again questions IPCC
modelling and confirms the lack of any climate crisis.

                                               6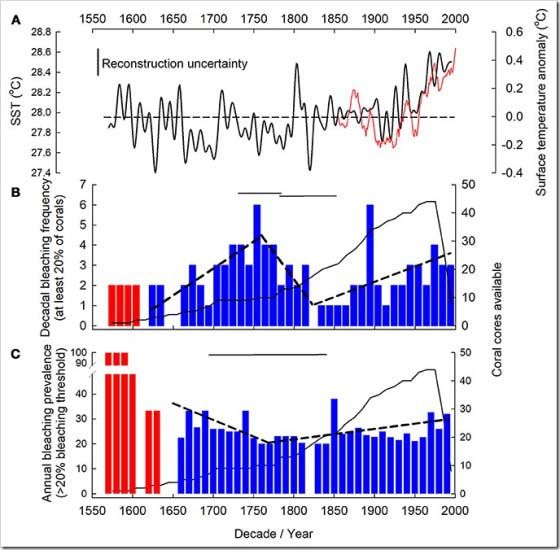
‐ Latest Climate Science, Feb 2019

Figure 5: Global temperatures, based on satellite data since 1979, illustrating marked natural
variability and effectively a temperature hiatus during the last 20 years since the El Niño peak of 1998
until after to the recent El Niño of 2015/16. Source [15].

1.5. Sea Surface Temperatures since 1850 illustrate non‐GHG influence

Sea Surface Temperatures (SST) for the period 1850‐2018 are based on thousands of
measurements across the globe (sea being 71% of the global surface).

Figure 6: HadSST3 global temperature anomalies from 1850 to 2018. Source [Royal Netherlands
Meteorological Institute/Global Temperatures (Ocean only)]

The graph of SST (Figure 6) shows the following points clearly:

    o    The spike in warming in late 2015/early 2016 has given way to a period of rapid
         cooling; monthly SST anomalies are now about 0.2°C below the 2015‐2016 El Niño
         spike.

                                                   7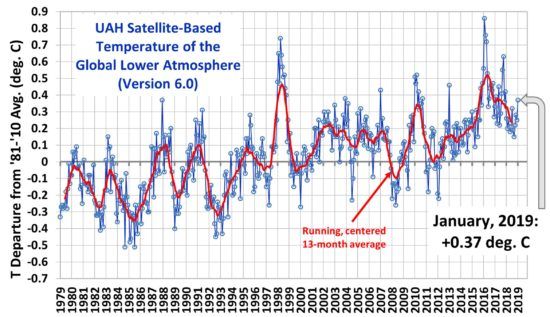
‐ Latest Climate Science, Feb 2019
    o   The average SST for the period 2000‐2014 (before the onset of the El Niño) was only
        about 0.4°C above the average for the period 1936‐1950; this very slow rate of
        warming is entirely consistent with low climate sensitivity, and again is not indicative
        of any “climate emergency”.
    o   Looking at the 20th century as a whole, the period of strongest warming was 1910‐
        1945, during which period the global SST increased by about 0.6°C. This was
        preceded by a cooling period from 1880 to 1910, with another cooling from 1945 to
        1978. These varying temperature trends clearly demonstrate influences (namely
        solar and natural) other than anthropogenic greenhouse gas influence.

Figure 7: Global average ocean heat content for the upper 300 m., from the ECMWF CERA‐20C
reanalysis ensemble, and redrawn from Laloyaux et al. its Figure 10.

Recently, results of an extensive ocean data study carried out at the 34‐nation (including
Ireland) European Centre for Medium Range Weather Forecasts (ECMWF) have been
published [27,28]. The study involved rescuing over two million station‐days of surface data
and importing them into the most up‐to‐date data‐assimilation system. The results for the
upper ocean heat content (OHC, top 300m) for the period 1900–2010 are shown in Figure 7.
This figure shows that the OHC (0‐300m) reached values during the period 1945–1955 that
exceed any reached during the period 2000–2010. These results clearly suggest the
possibility that the natural variability of OHC (0‐300m), and hence of the closely related
global SST, is greater than had previously been estimated.

1.6. There is Evidence of Discrepancies in Global Temperature Databases

There are questions over the accuracy of adjustments that have been applied to global land
temperature datasets, some of which have tended to introduce spurious warming effects
[16,17,18,19,41]. These were again investigated in a paper by Christy, Spencer, et al [87],
indicating a lower global warming trend of only +0.10+0.03°C/decade.

There is also likely significant warming bias introduced by the Urban Heat Island (UHI) effect,
the most plausible explanation for recent apparently elevated land temperatures (Figure 8).
All datasets spiked during 2015/2016 due to the powerful El Niño, leading to spurious
“hottest year ever” claims, with a declining temperature trend since then.

                                               8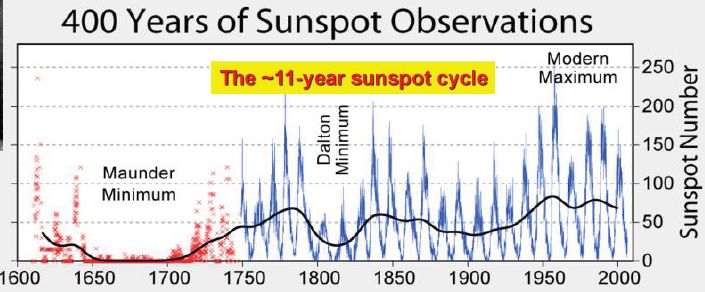
‐ Latest Climate Science, Feb 2019

Figure 8: Figure from Osborn et al. (Weather, Nov 2017), 12‐month running means from HadCRUT4
combining land and sea (black) and its separate land surface air temperature (red: CRUTEM4) and SST
(blue: HadSST3) components, strongly hinting that land‐based measurements may be subject to the
Urban Heat Island (UHI) effect. Source [NOAA].

A recent report by Wallace, D’Aleo and Idso [18] tested if the NOAA, NASA and Hadley CRU
Surface Temperature datasets provided sufficiently credible estimates of global average
temperatures to be relied upon for climate modeling and policy analysis purposes.

In this research report, the most important surface data adjustment issues were identified
and past changes in the previously reported historical data were quantified. It was found
that each new version of Global Average Surface Temperature (GAST) has nearly always
exhibited a steeper warming linear trend over its entire history. And, it was nearly always
accomplished by systematically removing the previously existing cyclical temperature
pattern. This was true for all three entities providing GAST data measurement, NOAA, NASA
and Hadley CRU.

As a result, this research sought to validate the current estimates of GAST using the best
available relevant data. This included the best documented and understood data sets from
the U.S. and elsewhere as well as global data from satellites that provide far more extensive
global coverage and are not contaminated by bad siting and urbanization impacts. Satellite
data integrity also benefits from having cross checks with balloon data.

The conclusive findings of this research were that the three GAST data sets are not a valid
representation of reality. In fact, the magnitude of their historical data adjustments, that
removed their cyclical temperature patterns, is inconsistent with published and credible US
and other temperature data.

Another audit of HadCRUT4 data by Maclean found multiple database errors that seriously
undermined their reliable use in IPCC climate modeling.

                                                9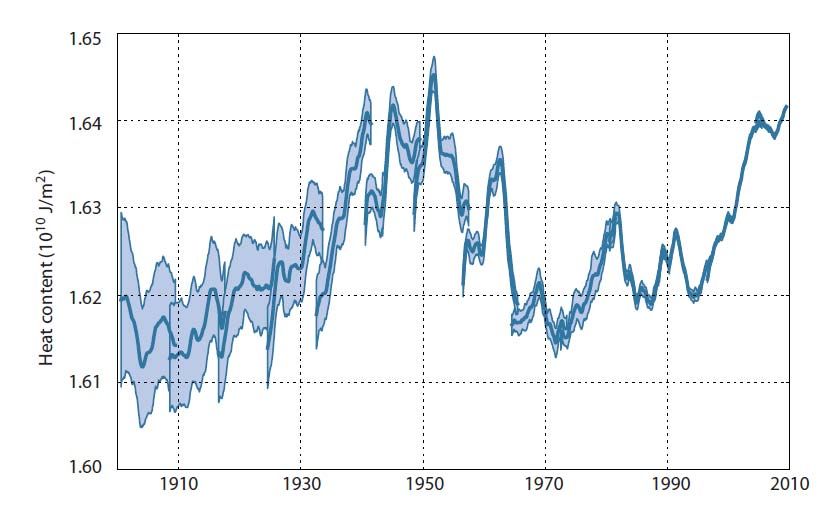
‐ Latest Climate Science, Feb 2019
2. Climate Observations do not indicate a Planetary Crisis

2.1 Arctic Sea Ice continues to be relatively stable since 2007

Reducing Arctic sea ice extent is viewed by many as the clearest demonstrating of global
warming, with predictions of its demise before 2050. Arctic sea‐ice extent and volume have
declined since 1979, but are effectively at a standstill since 2007 (Figures 9 & 10).

Figure 9: Arctic Sea Ice September low extents since satellite records began in 1979, demonstrating
stabilisation since 2007 [Source: DMI, http://ocean.dmi.dk/arctic/icecover_30y.uk.php.].
The 2017/2018 season saw a cold summer with high levels of precipitation, which benefitted the ice
sheet, whilst glaciers have maintained their area during the last six years, source
http://polarportal.dk/fileadmin/user_upload/polarportal‐saesonrapport‐2018‐EN.pdf

Fig 10: Arctic sea ice volume year‐end trends, again showing stabilisation since 2007, source:
http://ocean.dmi.dk/arctic/icethickness/txt/IceVol.txt

Recent studies have interpolated a similar warmer Arctic temperature anomaly in the 1930‐
1940s, followed by cooler anomalies from 1945 to 1978, during which two episodes Arctic
sea ice is inferred to have shrunk and grown again respectively (Figure 11). It is notable that
the current shrinking began in 1979 coincident with the advent of satellite measurement. On
a short‐term basis, there can be significant short‐term temperature anomalies in the Arctic;
the recent anomalies are not unprecedented in that similar occurred in 1976 [32].

                                                  10
‐ Latest Climate Science, Feb 2019
Figure 11: Recent arctic temperature anomalies are similar to those of the 1930‐40s, the cycle being
likely connected with the AMO [Source: http://climate4you.com/]
Recent reports by Susan Crockford [30,31] indicate that global polar bear numbers have
been stable or risen slightly since 2005. Abundant prey and adequate sea ice in spring and
early summer since 2007 appear to explain why global polar bear numbers have not
declined, as might have been expected as a result of low summer sea ice levels. Some
studies show bears are lighter in weight than they were in the 1980s, but none showed an
increase in the number of individuals starving to death or too thin to reproduce.
2.2 Greenland also continues to be relatively stable
Not unsurprisingly, Greenland shows a similar historical temperature trend, with a previous
warmer period in the 1930‐1940s (Figure 12), again the last time the AMO was in warm
phase, as it presently is.
Figure 12: Observed fluctuations in Greenland’s temperatures since 1851, based on re‐analysis by
KNMI, showing current temperatures to be similar to those as far back as the 1880s.
[Source: https://www.the‐cryosphere.net/12/39/2018/tc‐12‐39‐2018‐supplement.pdf].
11‐ Latest Climate Science, Feb 2019
2.3 The Antarctic exhibits some regional variations, but is also relatively stable
IPCC AR5 indicated that while there had been some recent loss of sea ice from the Antarctic
Peninsula and the Amundsen Sea Sector of the East Antarctic, however the annual mean
Antarctic sea ice had increased at a rate of 1.2%‐1.8% per decade between 1979 and 2012.
More recent research indicates that the Antarctic went through a 1,900‐year cooling trend
before slight warming in the last century. Ice core reconstruction of Antarctic temperatures
over the past two millennia confirmed a significant cooling trend from 0 to 1900 AD across
all Antarctic regions where records extend back into the 1st millennium, with the exception
of the Wilkes Land coast and Weddell Sea coast regions (Figure 13). The study [33] also
found that the warmest period occurred between 300 and 1000 AD, and the coldest interval
occurred from 1200 to 1900 AD, suggesting that today’s slightly warmer Antarctic
temperatures are not unprecedented. The warming might be related to activity of the 91
geothermal hotspots recently discovered under the West Antarctic ice.
Figure 13: A 2000‐year reconstruction of Antarctic temperatures shows a warm period from 300‐
1000AD, and a cool period from 1200‐1900AD; the current slight warming is not unprecedented.
[Source: www.clim-past.net/13/1609/2017/cp-13-1609-2017.pdf]
Figure 14: Southern Ocean SSTs have been dropping since 1980, and currently are below the long
term mean. https://bobtisdale.wordpress.com/2016/11/08/october‐2016‐sea‐surface‐temperature‐
sst‐anomaly‐update/.
12‐ Latest Climate Science, Feb 2019
A recent paper [89] claimed that the Antarctic Ice Sheet had lost 2.7 trillion tonnes of ice
between 1992 and 2017, however this represents only 0.01% of its total ice mass and
therefore lies within the bounds of natural variability. It is also notable that Southern Ocean
SSTs have been cooling since 1980 (Figure 14).
2.4. Global Sea Levels continue to rise at about 1‐3mm/year
Global sea level has been rising gradually for thousands of years (refer Figure 38). The key
issue is whether the rate of global mean sea level rise (GMSLR) is accelerating owing to
anthropogenic global warming. However Gregory [38] et al. (2013) found that “the rate of
GMSLR was not much greater during the last 50 years than during the 20th century as a
whole, despite the increasing anthropogenic forcing”.
Data from tide gauges from all over the world since the Little Ice Age (which ended about
1850) suggest an average global sea‐level increase of 1‐2mm a year, while satellite records
demonstrate a rise of 3‐3.4mm a year, the difference between the two sets of
measurements being unexplained. At local levels, higher or lower variances can occur due
to ongoing tectonic land level shifts. There also appears to be some correlation with solar
cycles [34,35,36,37].
While a recent paper by Nerem et al [84] detects a minor acceleration in the last 25 years,
most studies exhibit no significant acceleration of sea‐level rise, contradicting claims that
rapid sea‐level rise could occur this century (Figure 15). GMSL is therefore unlikely to rise by
more than 30cm during the 21st century.
Figure 15: Reconstructed global sea levels, showing a gradual rising trend since about 1860, with no
signs of acceleration as predicted by some. Source [34].
A recent report by Judith Curry [96] found a gradual creep in sea level rise in the last 150
years of about 18cm. It concluded that this gradual recent rise in sea level was within the
range of natural sea level variability seen over the past several thousand years. The study
found no convincing fingerprint relating this gradual rise to human‐caused global warming.
13‐ Latest Climate Science, Feb 2019
2.5. Recent “Extreme” Weather Events are generally not unprecedented, nor is
there a proven link to anthropogenic GHG emissions
IPCC AR5 [1] found little evidence that the frequency of extreme weather events is related to
gradual recent global warming. In almost every case of a reported “extreme event”, a careful
review of historic records shows that the data reported may be unrepresentative (for
example due to Urban Heat Island effect) and that it is not unprecedented [92].
IPCC in its 2012 Extreme Events Report [93] indicated that any signal in climate variability
will be small compared with natural weather variability for decades to come. It is notable
that HH Lamb [21,90] documented extreme weather events in the global cooling period of
the 1960s and 1970s. A recent paper by Kelly [43] found strong evidence that the first half
of the 20th century had more extreme weather than the second half, despite the claim that
anthropogenic global warming leads to more weather extremes. Taking some specific areas:
2.5.1 Wild Fires
Media reports linked the incidence of summer wild fires in Europe in 2017/18 to global
warming, but the historical record [45] shows that there were more wild fires in the 1990s,
while the trend in burnt area is actually declining, see Figure 16.
Figure 16: The number of forest fires in Europe since 1980 peaked in the 1990s, and have been
relatively low in the last few years (left); the trend on burnt acreage is even more stark (right),
showing consistent decline since the 1980s. Source [45].
Parallel historical data for California indicates that the number of wild fires in California has
actually declined since the decade of the 1970s to 1990s, see Figure 17.
The recent fires in California, when objectively analysed, were not attributable to climate
change, see http://cliffmass.blogspot.com/2018/11/was‐global‐warming‐significant‐
factor.html [101].
14‐ Latest Climate Science, Feb 2019
Figure 17: Graphic showing declines in wild fires in California, which peaked in the 1970s to 1990s.
Source: “Different historical fire‐climate patterns in California” by JE Keeley and AD Syphard, 2018.
2.5.2 Droughts
As another example, the recent water shortage in Cape Town was alleged to be due to
climate change. In fact, the recent rainfall pattern is not unprecedented except for 2015
(Figure 18), the main difference being the 10‐fold increase in the city’s population since 1900
and lack of system investment and maintenance [48]. HH Lamb [21,90] and others [22]
document a long history of droughts in Africa.
Figure 18: South Africa annual rainfall data from 1904 to 2017, indicating that despite the
exceptionally low rainfall in 2015, the longest drought periods were in fact from 1930 to 1933 and
from 1944 to 1949. Source [48].
15‐ Latest Climate Science, Feb 2019
A recent study by Heim [85], confirms that 21st century droughts in the US were less severe
than those of the 1930s and similar to those of the 1950s, see Figure 19.
Figure 19: Percent area of the contiguous US experiencing moderate to extreme drought conditions
from Jan 1900‐Dec 2014, where the black curve is the 10‐year moving‐mean filter. Source [85].
Recent analysis confirms a long history of drought in Australia, see Figure 20.
Figure 20: Rainfall Anomaly 1900‐2017 for New South Wales indicating high prevalence of droughts,
http://www.bom.gov.au/climate/change/index.shtml#tabs=Tracker&tracker=timeseries&tQ=graph%3
Drranom%26area%3Dnsw%26season%3D0706%26ave_yr%3D0
16‐ Latest Climate Science, Feb 2019
2.5.3 Hurricanes and Tornados:
As yet another example, it is alleged that the number of North Atlantic hurricanes, including
Hurricane Ophelia, is evidence of climate change. As Figure 21 shows [49], there were 10
hurricanes in 2017, equalled or beaten on 14 previous occasions. There were 6 major
hurricanes of Category 3 and over in 2017, well below the record of 8 set in 1950. There
were 2 Category 5 hurricanes in 2017 (Irma and Maria), but with similar occurrences in 1932,
1933, 1961, 2005 and 2007. In terms of accumulated cyclone energy, 1933 was the highest.
Figure 21: Numbers of Atlantic Hurricanes 1852‐2017 (though data prior to 1966 is very likely to have
been underestimated number and strength of earlier cyclones). Source [49].
On a global level, Figure 22 shows that hurricane activity peaked in the 1990s.
Figure 22: Trend of global accumulated cyclone energy peaked in the 1990s, source:
http://www.policlimate.com/tropical/
17‐ Latest Climate Science, Feb 2019
In terms of tornados, 2018 was the first year since records began in 1950 that there were no
violent tornadoes in the USA, see Figure 23.
Figure 23: Trend in US violent tornados (those ranked in category 4 and 5), showing none in 2018, for
the first time since systematic records began in 1950, with a generally declining trend.
2.5.4 Floods:
According to IPCC AR5 [1], “there continues to be a lack of evidence and thus low confidence
regarding the sign of trend in the magnitude and/or frequency of floods on a global scale
over the instrumental record.” A recent paper [44] (Hodgkins et al., 2017) concluded that,
over the past 80 years, “the number of significant trends in major‐flood occurrence across
North America and Europe was approximately the number expected due to chance alone.
Changes over time in the occurrence of major floods were dominated by multi‐decadal
variability rather than by long‐term trends.” Other studies broadly concur [29,46,47]. The
long‐term UK rainfall trends would seem to be in agreement, see Figure 24.
Figure 24: December rainfall trends in the UK since 1766, where the driest was December 2012 and
the wettest was December 1876.
18‐ Latest Climate Science, Feb 2019
2.5.5 Coral Bleaching:
A recent reconstruction [95] of four centuries of temperature‐induced coral bleaching in the
Great Barrier Reef found that the frequency of bleaching was significantly higher in the
1890s and 1750s, see Figure 25, confirming that coral bleaching recovers naturally.
Figure 25: Reconstruction of pattern of coral reef bleaching over the last 400 years. Source [95].
2.5.6 Heatwaves
In particular, in summer 2018, a persistent high pressure anomaly over Scandinavia caused
high temperature and drought anomalies in Northern Europe from May to July, while
Southern Europe was unusually wet.
The 2018 summer’s 32.1C in Sodankyla, northern Finland (inside the Arctic Circle), is not
totally unprecedented in that it compares with 31.7C in 1914 and 31.5C in 1934 (see Figure
26).
19‐ Latest Climate Science, Feb 2019
Figure 26: Maximum temperature trends in Sodankyla in Northern Finland , which is inside the Arctic
Circle, illustrating that above 30°C is not uncommon as these northerly altitudes, see
http://climexp.knmi.nl/gdcntmax.cgi?id=someone@somewhere&WMO=FI000007501&STATION=SOD
ANKYLA_AWS&extraargs=.
Media frequently report “hottest ever” summers, citing climate change as the cause.
Satellite data indicates a slightly increasing trend, but that these temperature anomalies can
be linked to the El Niño/La Niña cycles, as in Figure 27 below:
Figure 27: demonstrating that hot summers in the northern hemisphere are closely linked with El Niño
and La Niña activity, sources: https://www.nsstc.uah.edu/data/msu/v6.0/tlt/uahncdc_lt_6.0.txt and
https://www.esrl.noaa.gov/psd/enso/mei/.
20‐ Latest Climate Science, Feb 2019
2.5.7 Some Further Observations on Weather Events in the Irish Context
According to Met Eireann records [39], the highest air temperature ever recorded in Ireland
was 33.3°C, recorded at Kilkenny Castle on June 26, 1887, with the lowest air temperature
recorded as ‐19.1°C at Markree Castle on January 16, 1881.
National temperature records indicate an average increase of 0.8°C in the last 110 years,
however if only rural station data is used (eliminating the urban heat island effect), this
reduces to only 0.4°C [17,41].
Over the period January 1942 to December 2018, the measured maximum daily
temperature increase at Valentia was only 0.28°C, while that at Dublin Airport was 0.84°C,
three times higher [40]. An analysis of cold days at Dublin Airport with temperatures of less
than or equal to 0°C over the same time period indicated slightly more frost days in 1980‐
2018 than in 1942‐1980, though the opposite was true of Valentia.
The national temperature records indicate cooling 1869‐1892, warming 1892‐1945, cooling
1945‐1973 and warming 1975‐2013. The warming and cooling episodes do not correlate
with linearly‐increasing GHG levels.
Ocean temperatures have been found to influence the Irish climate [42], particularly the
Atlantic Multi‐decadal Oscillation (AMO), with a frequency of about 60 years in the 20th
century; it can explain the warmer period of the 1930‐1940s and of the 1990s. The AMO is
now entering a cooling period.
Figure 28A, Standard precipitation Index for the Island of Ireland, 1850‐2015, where the red areas
represent drought severity (for example ‐2 being severe drought), source [102, its Figure 2]
On rainfall, a recent paper by Murphy et al [91], found inter‐decadal and centennial natural
variability of precipitation in Ireland was much larger than previously thought. National
records also show droughts as far back as 1820. A paper by Noone et al [61] describes
Ireland as drought‐prone, but that recent decades were unrepresentative of the longer‐term
drought climatology (Figure 28A). Seven major drought periods were identified, which
caused agricultural hardship, water resource crises, with some leading to major famines, the
most severe being in 1800‐1809 and 1854‐1860. The drought of 2018 was not exceptional.
21‐ Latest Climate Science, Feb 2019
There is insufficient data to come to any conclusion about flooding frequency or severity
(the latter depending on drainage, land use, etc). Met Eireann records show flooding
episodes as far back as 1802.
The Met Eireann records also note significant snowfall in January‐April 1917, January‐March
1947, January 1982 and January 1987, prior to the snowfalls of February‐March 2018.
Independent analysis [40] of the Met Eireann wind speed data indicates slightly reducing
gust wind speeds over recent decades at Malin Head, Mullingar and Cork and Dublin
Airports (see Figure 28B). This agrees with a prior RIA analysis of 2017.
Figure 28B: Trends showing slightly declining air gust wind speeds (in knots) at Malin Head since 1955
and at Dublin Airport since 1944, source [40].
Overall, Irish weather records, despite some warming, appear not to indicate any increased
incidence of “extreme” weather events in recent times, in fact, the opposite.
22‐ Latest Climate Science, Feb 2019
3. Solar and other Natural Influences
3.1. Influence of the Sun, Cosmic Rays and Clouds on Climate
The Solar influence on climate change has received only modest scientific research funding
compared to that provided for studying of the GHG influence, yet the Solar influence is in
many ways plausibly linked to past and current climate observations. The Solar influence has
hitherto been largely discounted by IPCC as insignificant compared to the GHG influence, a
thesis which is now questioned by many scientists [56,57,58,59,80,81,82].
Thanks to pioneering work by Henrik Svensmark and Nir Shaviv, it is now proven that an
increase in solar activity, as measured by the number of sunspots, causes a small increase in
solar magnetic fields allowing fewer cosmic rays to enter the Earth’s atmosphere, so
reducing the ionisation of air molecules, thereby creating fewer or smaller cloud nuclei. This
produces more transparent clouds and so less reflection of solar radiation back into space
[60,62,63,64]. Hence more and stronger solar radiation then reaches the Earth’s surface,
increasing surface temperatures. The opposite happens when fewer sunspots and hence a
lower solar magnetic field produces whiter clouds, reflecting more solar radiation back into
space. In other words, solar radiation variability is amplified into climate variability through
the influence of cosmic rays, see Figure 29. IPCC does not recognise this amplification factor.
Figure 29: The correlation of cosmic rays with global temperature over a 1,000 year period, where a
stronger solar radiation leads to less cosmic rays and a warmer earth, and vice versa. Source [63].
23‐ Latest Climate Science, Feb 2019
Nir Naviv has also demonstrated that the sun plays a major role in climate change over
geologically long time periods. His research also reviews the evidence which proves the
existence of and quantifies the physical mechanism linking solar activity and climate, namely
through modulation of the galactic cosmic ray ionization of the atmosphere and its effect on
cloud cover. In particular, he shows that the link has operated on geological time scales,
linking our galactic motion to long term climate variations [73,74,75,76,79].
In accounting for the cosmic ray effect on climate projections, and Nir Shaviv thereby infers
that the GHG influence is significantly smaller than IPCC predicts. According he predicts a
maximum temperature rise of probably about only 1°C, as in Figure 30 below. IPCC has
unfortunately disregarded the multiplicative effect of changes in solar radiation on earth’s
climate.
Figure 30: Climate projection by Nir Shaviv compared to IPCC Models. Source [83].
3.2. The Possible Influence of Interplanetary Oscillations on Climate
Nicola Scafetta has recently advanced research into natural climate oscillations and the
interpretation of the post‐2000 temperature standstill [70,71,72] . The period from 2000 to
2017 shows a modest warming trend that clearly diverges from the general circulation
model (GCM) simulations after the ENSO effect (e.g. the strong 2015‐2016 El Niño peak) is
statistically removed from the data [77,78].
The observed pattern is the result of specific natural climatic oscillations plus an
anthropogenic contribution. The climate system is characterized by specific oscillations (e.g.
with periods of about 9.1, 10.5, 20 and 60‐year plus other centennial to millennial
oscillations) that are synchronized to specific solar and astronomical oscillations. These
oscillations are not reproduced by the IPCC models and imply that astronomical forcing of
the climate system have been underestimated or even ignored, and therefore that
anthropogenic warming has arguably been significantly overestimated.
24‐ Latest Climate Science, Feb 2019
The semi‐empirical climate models proposed in 2011 and 2013 by Scafetta (Figure 31) agree
far better with the observations and project that the 21st century climate could be
characterized only by a modest warming using the same IPCC emission scenarios. Overall, he
predicts a likely temperature anomaly of about 1°C, with only the extreme highly unlikely
IPCC RCP8.5 scenario possibly reaching only 2°C.
Figure 31: Comparison of the climate projection by Nicola Scafetta versus IPCC Models. Source [77].
Once this thesis is taken into account, a much more consistent picture for the 20th century
global warming is obtained (as in Figure 31); in it, overall climate sensitivity is probably only
of the order of 1°C and future climate change is predicted to be benign [83]. It is notable
that both the cosmic ray influence of Svensmark/Shaviv and the interplanetary oscillation
influence of Scafetta point to a GHG influence sensitivity of about 1°C, which in turn agree
with the more recent GHG sensitivity analyses.
3.3. Projections based on Solar Influences including a possible Global Cooling
The sunspot cycle trend since 1600 clearly indicated their influence through the Maunder
Minimum, Dalton Minimum and Modern Maximum (Figure 32).
Figure 32: A 400‐year graph of Solar Cycles 1‐24, illustrating Maunder/Dalton Minima, Source [NASA].
25‐ Latest Climate Science, Feb 2019
Current indications are that the Sun is entering a low activity phase (that is with less
sunspots) after the Grand Maximum of solar cycles 19‐23 spanning the latter half of the 20th
century (Figures 33 and 34), which might in itself be the main, if yet unproven, cause of
observed global warming in that time period. There has been a marked decline in sunspot
numbers through cycles 23 and 24 so far, which has been compared to the trend in cycles 4
to 6 in 1800 to 1835 which caused the Dalton Minimum and consequently the Little Ice Age.
Figure: 33: Recent solar cycles may be tending towards a Grand Minimum, Source: [65]
Figure 34: illustrating that the current solar cycle 24 sunspot anomaly is similar to that of cycle 5,
which preceded the Maunder Minimum. Source F Bosse and F Vahrenholt
Others [68,69] predict, postulating a week solar cycle 25, that the Gleissberg and Suess/de
Vries cycles will reach low points in 2020‐2040, possibly approaching the situation prevailing
during the Dalton Minimum in 1790‐1820. In that case, the global mean temperature might
possibly decline by 0.4°C to 0.6°C by 2035, and then rise again in the 2060s [23]. An analysis
by Niroma shows the pattern of solar cycles between 1600 and 1820 to have a strong
similarity with those from 1821 to the present, thereby speculatively suggesting the onset of
another Little Ice Age. This research has been recently further extended by Zharkova and
Abdussamatov [65,66,67]. Zharkova [59,76] has predicted a major decrease in the solar
magnetic field in the next 10‐20 years when two of its three fields come into opposing
polarity thereby leading to a significant degree of solar and hence global cooling.
26‐ Latest Climate Science, Feb 2019
4. Lessons from Paleoclimate, recent Millennia and Centuries
4.1. Warming and Cooling Episodes in Paleoclimate
The Earth was formed some 4.5 billion years ago. Single‐cell life forms emerged 3.8 billion
years ago. Around 630 million years ago (Mya), the climate changed from a “snow‐ball
Earth” into the cold and glacial Cambrian and Ordovician Periods; since 500Mya, glacial
periods alternated with warm humid periods, with Carbon Dioxide (CO2) levels at up to 15
times that of current levels, fostering the evolution of today’s life forms (Figures 35 & 36).
The climate was particularly hot and humid through during the age of Dinosaurs some
250Mya.
Figure 35: Graphs showing little correlation between Phanerozoic CO2 levels and Global
Temperatures. Source [4].
The Early Eocene Interglacial (152‐48Mya) saw CO2 levels greater than 1000ppm and was a
warm period, possibly with sea levels up to 20m higher than today. The Mid‐Pliocene
Interglacial (3.3‐3Mya) saw CO2 levels of 350‐450ppm and was 1.9°C to 3.6°C warmer than
now. Over the last 2My, there have been successive Glacials or Ice Ages, the more recent
lasting 90‐100ky, alternating with warmer Interglacial periods lasting 10‐20ky (Figure 37).
Generally, the onset of the Interglacial periods appears to have been slow, but abrupt
warming changes have been inferred, with up to 10‐15°C warming in only 75y. Peak
temperatures in these Interglacials were warmer than today, with CO2 levels below 300ppm
during this period.
27‐ Latest Climate Science, Feb 2019
Figures 36: Further graphs showing lack of correlation between Paleoclimatic CO2 levels and
Temperatures. Source [12].
The Pleistocene/Eemian Interglacial was a notably warm period 129‐114ky ago with a sea
level some 6m higher than now. This was followed by the most recent Ice Age 110ky‐17ky
ago, where sea levels fell again to some 120m below those prevailing today. After the last
Glacial, sea level rose 120m in 20 thousand years (ky), the most rapid stage being a 20m rise
in 340 years, see Figure 38.
Figure 37: A 420ky history of the Earth’s near‐surface air Figure 38: Reconstructed global sea‐
temperature, extracted from Antarctic ice cores; level since the last Glacial Maximum
temperatures were up to 2°C higher in all four recent 20kya, based on worldwide peat and
Interglacials. Source [25]. coral deposits. Source [25].
28‐ Latest Climate Science, Feb 2019
4.2 Warming and Cooling Episodes in Recent Millennia
Some 14ky ago there was a sudden warming, and sea levels rose (Figure 36 and 38). Then
12.5kya, the short Younger Dryas cold period occurred. After that, 11.5kya, strong warming
occurred within 100y (half of this within 15y), leading to the Atlantic Meridional Overturning
Circulation (AMOC) being shut down temporarily because of an ice melt. Some 10ky ago, the
present Holocene Interglacial began, leading to a warmer wetter climate, with a further rise
in sea level. In particular, the climate during the Holocene Climate Optimum (7000‐3000BC)
was warmer than today. During that period sea level may have been higher than today.
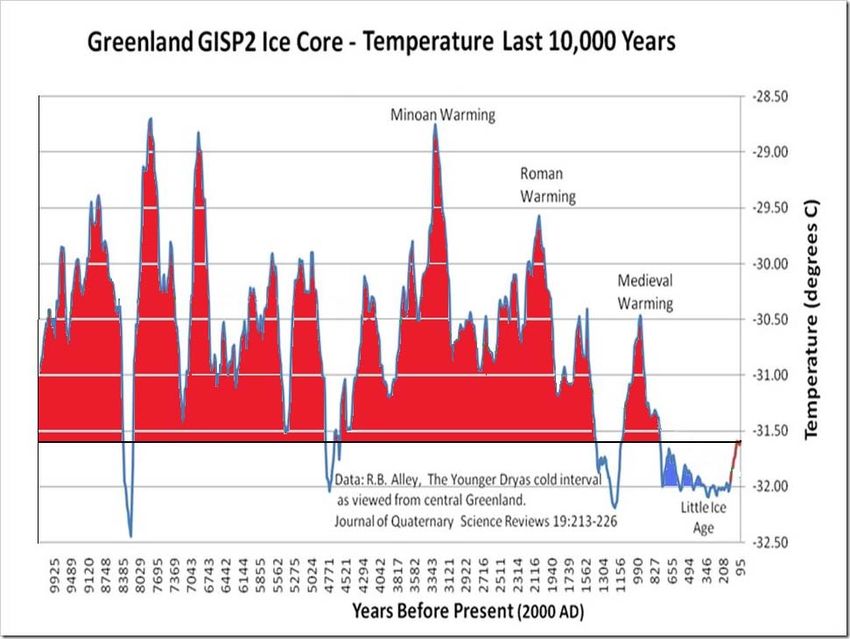
Figure 39: Not only have temperatures been higher than present for pretty much all of the last 10,000
years prior to the Little Ice Age, but the 19thC marked the coldest period of all since the Ice Age, as
acknowledged by Jørgen Peder Steffensen. Source:
https://notalotofpeopleknowthat.wordpress.com/2017/07/31/shukman‐peddles‐more‐greenland‐
nonsense/
Around 800BC saw the transition from the Bronze Age to the warmer Iron Age. In 600‐
200BC, there was an unnamed cool period (with reports of a frozen river Tiber and silting of
the Egyptian Sweetwater canal), where sea level may have again fallen. The period 200BC‐
500AD is distinguished as the Roman Warming [20,24] period (with grapes growing in
Northern Europe and widespread cereal crop production in North Africa), with sea level
similar to today.
This trend reversed in 500‐900AD with the onset of the Dark Ages, at least in Europe. The
worst time was the AD540 event, instigated by a comet or meteors, which led to plague in
542‐545. In 590, the Justinian Plague led to the final collapse of Roman Empire. In 800‐801,
the Black Sea froze and in 829 ice formed on the Nile.
29‐ Latest Climate Science, Feb 2019
This cold period then faded, and 950‐1300AD is known as the Medieval Warming or Little
Climate Optimum, with temperatures of 0.6°C to 0.9°C warmer than today. Norse settlers
went to a flourishing Greenland, and Europe’s population increased by 50%.
Over the period 1300‐1850, the Little Ice Age occurred, with the coldest temperatures of the
last 3,000 years. In 1300‐1315 there were very wet winters with no grain. In 1347, the Black
Death plague reached Europe, and its population fell by one‐third in the later 14th century.
There were successive epidemics in 1580‐1620. In 1645‐1715 there were very cold summers,
coinciding with the Maunder Sunspot Minimum. There were major food shortages in 1690‐
1700, with more famines in 1725 and 1816. In 1801, William Herschel related the price of
wheat to the number of sunspots. The winter of 1813/14 was the last time the Thames froze
over. The Irish Famine occurred in 1845‐1848.
4.3. Warming and Cooling Episodes in Recent Centuries
Figure 40: Global mean temperature anomalies with respect to the 1850‐1900 baseline for the five
global datasets, data source [UK met Office Hadley Centre]; it can be seen that surface temperatures
cooled between 1880 and 1910, warmed between then and 1945, cooled again between then and
about 1975 and warmed thereafter up to the 2015/16 El Niño peak, and have since declined.
The cool period continued up to 1890, followed by rapid warming from 1910 to 1945. In the
USA, there were exceptionally warm years in 1921, 1931 and 1934. Then 1945 to 1975 saw
irregular cooling, followed by rapid warming again from 1975 up to 1998. Since then, as
recognised also by IPCC, then there has essentially been a 20‐year climate hiatus (Figure 40).
Parallel studies have been carried out for China [88].
In summary, climate history in the paleoclimate, in recent millennia and centuries, does not
indicate that GHG levels have driven global temperatures; if anything, temperatures
followed GHG level changes.
30‐ Latest Climate Science, Feb 2019
5. Increasing CO2 levels are beneficial to Greening of the Planet
It is little appreciated that the increasing CO2 level is actually beneficial to the greening
through photosynthesis of the planet, and therefore may be beneficial to feeding the global
population as it heads towards 9‐10 billion.
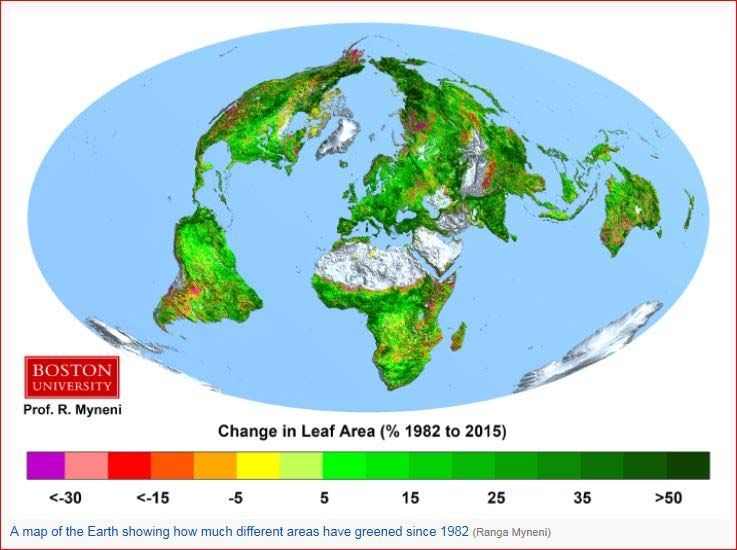
This has been verified by several researchers, the first being Myneni, who established from
satellite observations that there had been a very significant greening of the planet between
1982 and 2015 (see Figure 41). Further studies [50,51,52,53,54,55] have shown that the
increased CO2 level also reduces water requirements of agriculture.
Figure 41: Pictorial representation of greening of the planet between 1982 and 2015, 70% of which is
attributed to higher CO2 levels. Sources [52].
Hence, far from being the “villain”, the increasing CO2 level (which it should be noted,
constitutes only 0.04% of the atmosphere) may actually be beneficial to the planet food
chain in feeding 9‐10 billion people in 2050.
Recent years have seen record global harvests, see for example for soya beans at
https://www.thegwpf.com/benefits‐of‐global‐warming‐us‐forecasts‐record‐soyabean‐crop/.
Wheat yields have more than doubled since 1970 in Europe, USA and China, see
http://www.fao.org/faostat/en/#compare. However to these increased yields must also be
ascribed more sophisticated plant breeding, optimization of plant nutrition and the general
improvement in agronomic practice, though it can be shown that CO2 enrichment has also
contributed in latter years. Campbell et al [102] estimated the total increase in terrestrial
gross primary production through increased photosynthesis at about 30% during the 20th
century.
31‐ Latest Climate Science, Feb 2019
Appendix: List of References
1. “Climate Change 2013: The Physical Science Basis”, Working Group 1 contribution to
the Fifth Assessment Report (AR5) of the IPCC.
2. Testimony of John R Christy, Professor of Atmospheric Science, UAH, to the US
House Committee on Science, Space and Technology, Mar 29, 2017.
3. “Satellite Bulk Tropospheric Temperatures as a Metric for Climate Sensitivity, John R
Christy and Richard T McNider, Asia‐Pacific J Atmos Science, 53(4), 511‐518, 2017.
4. “The Science and Politics of Global Warming”, a lecture by Prof Richard Lindzen,
Alfred P Sloan Prof of Atmospheric Sciences, Emeritus, MIT, to the ICSF on May 4,
2017.
5. “Estimating Climate Sensitivity using Two‐Zone Energy Balance Moels”, JR Bates,
Earth and Space Science, 3, 207‐225, doi:10.1002/2015EA000154, 2016.
6. “The impact of recent forcing and ocean heat uptake data on estimates of climate
sensitivity”, by N Lewis & J Curry, J. Climate, doi:10.1175/JCLI‐D‐17‐0667.1, in press.
7. “On the Observational Determination of Climate Sensitivity and its Implications”, R
Lindzen and Y‐S Choi, Asia‐Pacific J Atmos Sci, 47(4), 377‐390, doi:10.1007/s13143‐
011‐0023‐x, 2011.
8. “Climate Models for the Layman”, Judith Curry, GWPF Briefing 24, 2017.
9. See also: https://principia‐scientific.org/recent‐co2‐climate‐sensitivity‐estimates‐
headed‐towards‐zero/.
10. Hourdin, F. et al (2017). The art and science of climate model tuning. Bulletin of the
American Meteorological Society, March 2017. https://doi.org/10.1175/BAMS‐D‐15‐
00135.1
11. P. Voosen, 27 Oct 2016. Climate scientists open up their black boxes to scrutiny,
Science 354 (6311), 401‐402. [doi: 10.1126/science.354.6311.401].
12. “Irish Agriculture – A New Look at the Influences of Methane, Nitrous Oxide and
Carbon Dioxide”, a lecture by Prof William Happer, Prof of Physics, Emeritus,
Princeton University, to the ICSF on June 1, 2017.
13. “Methane: The Irrelevant Greenhouse Gas”, by Prof Tom Sheahan, MIT.
14. “A Guide to Understanding Global Temperature Data” by Roy W Spencer, University
of Alabama in Huntsville (UAH), July 2016.
15. Satellite‐based Temperatures of the Global Lower Atmosphere, University of
Alabama in Huntsville (UAH), downloadable from www.drroyspencer.com.
16. “State of the Climate 2017”, Prof Ole Humlum, GWPF Report 30, March 2018.
17. “Urbanization Bias I: Is it a negligible problem for global temperature estimates?”,
Ronan & Michael Connolly, Open Peer Review Journal.
18. “On the Validity of NOAA, NASA and Hadley CRU Global Average Surface
Temperature Data and the Validity of the (US) EPA’s CO2 Endangerment Finding”,
Wallace, D’Aleo and Idso, June 2017.
19. “Towards better Monitoring and Understanding of Climate Change – Estimates of
Variability and Change in Atmospheric Temperature and Humidity” a lecture by Prof
Adrian Simmons to the ICSF on July 12, 2017.
20. “European Summer Temperatures since Roman Times”, Environmental Research
Letters, 11 (2016) 024001, doi:10.1088/1748‐9326/11/2/024001.
21. “Climate, History and the Modern World”, HH Lamb, 1982 and 1995.
22. “The Little Ice Age and Medieval Warming in South Africa”, by Tyson, Karlén,
Holmgren, South African Journal of Science, 96, March 2000.
32‐ Latest Climate Science, Feb 2019
23. “Are cold winters in Europe associated with low solar activity?”, by Lockwood et al,
Env Res Lttrs, 2010, DOI:10.1088/1748‐9326/5/2/024001.
24. “North Atlantic variability and its links to European climate over the last 3000 years”,
Paola Moffa‐Sánchez & Ian R. Hall, Nature Communications, volume 8,
article number: 1726 (2017), doi: 10.1038/s41467‐017‐01884‐8.
25. “Climate Change Reconsidered II, Physical Science”, NIPCC, 2013.
26. “Tutorial Overview of Climate Science”, submitted by Profs Lindzen, Koonin and
Happer to the District Court of Northern California, March 2018.
27. “ERA‐CLIM2 outcomes boost NWP and climate work”, ECMWF Newsletter, No 155.
Spring 2018, pp 6‐7.
28. “CERA 20‐C: A coupled reanalysis of the 20th century”, Laloyaux P, et al, Journal of
Advances in Modeling Earth Systems, 2018, 10, pp 1172‐1195.
29. “Recent UK Flooding is not unprecedented”, by Neil McDonald and Heather
Sangster, Hydrology and Earth System Sciences, 21:1631‐1650, June 2017.
30. “The Arctic Fallacy – Sea Ice Stability and the Polar Bear”, Susan Crockford, GWPF,
2015.
31. “State of the Polar Bear Report 2017”, Susan Crockford, GWPF Report 29.
32. “Arctic Sea Ice at its lowest extent for at least 1500 years” debunked by three recent
scientific papers, see:
https://notalotofpeopleknowthat.wordpress.com/2018/02/21/arctic‐sea‐ice‐extent‐
at‐its‐lowest‐for‐at‐least‐1500‐years‐debunked‐by‐three‐scientific‐papers/.
33. Antarctic climate variability on regional and continental scales over the last
2000 years, Barbara Stenni et al, Clim. Past, 13, 1609‐1634, 2017
https://doi.org/10.5194/cp‐13‐1609‐2017.
34. “Global Sea Level Reconstruction 1807‐2010”, by Jevrejeva, Moore, Grinsted,
Matthews and Spada, Global and Planetary Change, Vol 113,
doi:10.1016/j.gloplacha.2013.12.004.
35. “A 500‐Year Record of Sea Level from Goa, India”, Mörner N‐A, Journal of Coastal
Research 33: 421‐434, 2017.
36. “Short‐Term Tide Gauge Records from One Location are Inadequate to Infer Global
Sea‐Level Acceleration”, by Albert Parker and Clifford D. Ollier, Earth Systems and
Environment, October 2017.
37. “Acceleration of European Mean Sea Level? A new insight using improved tools”, by
Phil J Watson, Journal of Coastal Research, 2016.
38. “Twentieth Century Global Mean Sea Level Rise: Is the Whole Greater Than the sum
of the Parts?”, Gregory, JM, et al, J. Climate, 26, 4476‐4499, 2013, DOI: 10.1175/JCLI‐
D‐12‐00319.1
39. Irish Major Weather Events and Extremes as on Met Eireann website www.met.ie.
40. “A Brief Analysis of Extreme Weather Trends in Ireland in Recent Times”, Fintan
Ryan submission to the Citizens’ Assembly, 2017.
41. “Urbanization Bias III, Estimating the Extent of Bias in the Historical Climatology
Network Datasets” by Ronan and Michael Connolly, 2014, ref: http://oprj.net/oprj‐
archive/climate‐science/34/oprj‐article‐climate‐science‐34.pdf.
42. “The Influence of Ocean Variations on the Climate of Ireland”, by GD McCarthy, E
Gleeson and S Walsh, 2015, Royal Meteorological Society, DOI 10.1002/wea.2543.
43. “Trends in Extreme Weather Events since 1900 – An enduring Conundrum for Wise
Policy Advice”, Kelly MJ, Journal of Geography and Natural Disasters, Vol 6, Issue 1,
http://dx.doi.org/10.4172/2167‐0587.1000155.
33‐ Latest Climate Science, Feb 2019
44. “Climate‐driven variability in the occurrence of major floods across North America
and Europe”. Hodgkins, G.A. et al. (2017), Journal of Hydrology 552, 704–717,
http://dx.doi.org/10.1016/j.jhydrol.2017.07.027.
45. EU data trend in forest fires: https://www.eea.europa.eu/data‐and‐
maps/daviz/burnt‐forest‐area‐in‐five‐1#tab‐dashboard‐01.
46. “A revival of Indian summer monsoon rainfall since 2002”, by Qinjian Jin & Chien
Wang, Nature Climate Change 7, 587–594 (July 2017), doi:10.1038/nclimate3348
47. “Characteristics of temperature change in China over the last 2000 years and spatial
patterns of dryness/wetness during cold and warm periods”, by Quansheng Ge,
Haolong Liu, Xiang Ma, Jingyun Zheng & Zhixin Hao, Chinese Academy of Sciences,
Beijing, June 2017.
48. Note on Drought in Cape Town:
https://notalotofpeopleknowthat.wordpress.com/2018/02/13/cape‐towns‐
drought/.
49. Note on Atlantic Hurricanes:
https://notalotofpeopleknowthat.wordpress.com/2017/11/12/review‐of‐2017‐
atlantic‐season/#more‐30777.
50. “Climate Change Reconsidered II, Biological Impacts”, NIPCC, 2014.
51. “Global Warming Versus Global Greening”, Dr Matt Ridley, GWPF, October 2016.
52. “The Greening Earth”, Prof Ranga B Myneni, Dept of Earth & Environment, Boston
University, 2013.
53. Conclusion of letter to Nature of 6th April 2017 by J. E. Campbell et al
54. “Large historical growth in global terrestrial gross primary production”, by Campbell
et al, Nature, Vol 544, April 2017, DOI: 10.1038/nature22030.
55. Multiple references available on: www.co2science.org.
56. Butler, C.J. "Global Warming ‐ Man or Nature." Weather and Agro‐Environmental
Management', Proc. of AgMet Millennium Conference, Feb 2000, Dublin, Met.
Eireann 68‐77 http://climate.arm.ac.uk/publications/global‐warming‐man‐or‐
nature.pdf.
57. “Harmonic Analysis of Worldwide Temperature Proxies for 2000 Years” by Horst‐
Joachim Lűdecke and Carl‐Otto Weiss, The Open Atmospheric Science Journal, April
2017.
58. “Re‐evaluating the Role of Solar Variability on Northern Hemisphere Temperature
Trends since the 19th Century, Willie Soon, Ronan and Michael Connolly, Earth
Science Reviews, 150, 409‐452, 2015.
59. “Prediction of Solar Activity from Solar Background Magnetic Field Variations in
Cycles 21‐13”, by Shepherd, Zharkov and Zharkova, The Astrophysical Journal,
November 2014, doi:10.1088/0004‐637X/795/1/46.
60. “Increased Ionisation supports growth of aerosols into cloud condensation nuclei”
by H Svensmark et al. in Nature Communications, December 2017.
61. “A 250‐year Drought Catalogue for the Island of Ireland (1765‐2015)” by Noone et al,
International Journal of Climatology, 37, (Supplement 1), pp 239‐254, 2017, DOI:
10.1002/joc.4999.
62. “Cosmic rays, solar activity and changes in the Earth’s Climate” by Stozhkov et al,
Bulletin of the Russian Academy of Sciences, 2017, DOI:
10.3103/S1062873817020411.
63. “Another Perspective on Climate Change – Solar Influence, Cosmic Rays and Clouds”,
a lecture by Prof Henrik Svensmark to the ICSF on December 6, 2017.
64. Also see: www.climateclips.com.
34You can also read