PORTRAIT AND KNOWN ENVIRONMENTAL IMPACTS OF CLIMATE CHANGE ON THE JAMES BAY TERRITORY - James Bay Advisory Committee on the Environment
←
→
Page content transcription
If your browser does not render page correctly, please read the page content below
James Bay Advisory Committee on the Environment
Comité consultatif pour lʼenvironnement de la Baie James
���� ��� � ������� �������� �� ��� ����������� �����

                                                 PORTRAIT
                                                 AND KNOWN
                                                 ENVIRONMENTAL
                                                 IMPACTS OF
                                                 CLIMATE CHANGE
                                                 ON THE JAMES BAY
                                                 TERRITORY

                                                           June 2007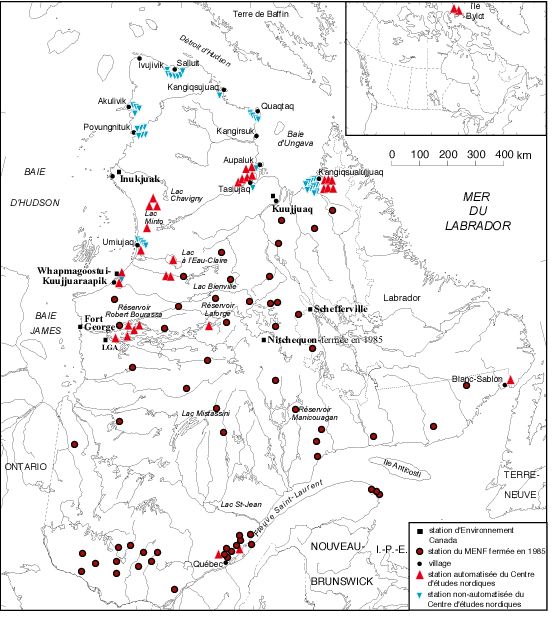
Table of contents

Table of contents ................................................................................................................. i
List of tables ...................................................................................................................... iii
List of figures .....................................................................................................................iv
Acknowledgments................................................................................................................v
1.      Introduction................................................................................................................ 1
2.      The science of climate change................................................................................... 2
     2.1        Temperature...................................................................................................... 3
     2.2        Precipitation ...................................................................................................... 5
     2.3        Expected climate change .................................................................................. 6
     2.4        Acceleration and slowdown factors (carbon sources and carbon sinks) ..... 8
     2.5        Impacts specific to northern environments .................................................. 12
     2.6     The James Bay Territory and its climate ..................................................... 12
        2.6.1    Available climate data............................................................................... 13
        2.6.2    Spatial climate variations in the James Bay Territory .............................. 15
        2.6.3    Main climate trends................................................................................... 16
3.      Consequences of climate change............................................................................. 17
     3.1        Water resources .............................................................................................. 17
     3.2        Coastal areas.................................................................................................... 18
     3.3     Forests .............................................................................................................. 18
        3.3.1    Impacts of climate change on forest physiology....................................... 18
          3.3.1.1 CO2 concentrations................................................................................ 19
          3.3.1.2 Temperature .......................................................................................... 20
          3.3.1.3 Precipitation .......................................................................................... 20
        3.3.2    Migration of species and relocation of ecosystems .................................. 22
        3.3.3    Natural disturbances.................................................................................. 24
          3.3.3.1 Forest fires ............................................................................................ 25
          3.3.3.2 Epidemics.............................................................................................. 26
        3.3.4    Socio-economic impacts ........................................................................... 27
     3.4        Peat bogs .......................................................................................................... 27
     3.5      Wildlife............................................................................................................. 28
        3.5.1     Indirect effects of the climate ................................................................... 29
        3.5.2     Direct effects............................................................................................. 30
        3.5.3     Studies of the James Bay Territory........................................................... 30
     3.6        Energy and the James Bay Territory............................................................ 31
4.      Research to address knowledge gaps regarding the James Bay Territory ............ 32
ii

5.   Conclusion................................................................................................................ 34
6.   Bibliography ............................................................................................................. 36
7.   Appendices................................................................................................................ 41
iii

                                                      List of tables

Table 2-1: Summary of forecast climate change compared with 1961-1990 ..................... 8
Table 2-2: Average annual estimate of carbon dioxide sources, sinks and reservoirs
    derived from anthropogenic carbon dioxide emissions 1980–1989 (Environment
    Canada 2006a) ............................................................................................................ 9
Table 2-3: Environment Canada weather stations in the James Bay Territory................. 15
Table 3-1: Effect of an increase in the concentration of CO2 and of the temperature on the
    various physiological processes (from Colombo 1998)............................................ 22
Table 3-2: A few examples of the socio-economic impacts of climate change
    (Environment Canada 2006b) ................................................................................... 27
Table 4-1: Themes of research conducted in the James Bay Territory............................. 33
Table 5-1: Main impacts for the James Bay Territory ...................................................... 35
Table 7-1: Co-ordinates of Hydro-Québec’s weather stations active between 1990 and
    2004 and the parameters measured (section 1) ......................................................... 42
Table 7-2: Co-ordinates of Hydro-Québec’s weather stations active between 1990 and
    2004 and the parameters measured (section 2) ......................................................... 43
Table 7-3: Co-ordinates of Hydro-Québec’s weather stations installed since 2005 and the
    parameters measured (section 1)............................................................................... 44
Table 7-4: Co-ordinates of Hydro-Québec’s weather stations installed since 2005 and the
    parameters measured (section 2)............................................................................... 45
Table 7-5: Co-ordinates of Hydro-Québec’s weather stations installed since 2005 and the
    parameters measured (section 3)............................................................................... 46
Table 7-6: Explanation of parameters measured for the network of weather stations
    installed in 2005........................................................................................................ 47
Table 7-7: El Niño and La Niña years, 1950-2004 ........................................................... 48
Table 7-8: El Niño and La Niña years, 1900-1950 ........................................................... 49
iv
List of figures
Figure 2-1: Variations in the Earth’s surface temperature over the past 140 years and the
past 1,000 years (from IPCC 2001). ........................................................................... 4
Figure 2-2: Temperature anomalies for 2050 in comparison with the period from 1961 to
1990 according to a ECHAM4 gg1 scenario (CCIS 2006)......................................... 6
Figure 2-3: Precipitation anomalies for 2050 in comparison with the period from 1961 to
1990 according to a ECHAM4 gg1 scenario (CCIS 2006)......................................... 7
Figure 2-4: Breakdown of greenhouse gases in Quebec by sector of activity in 2003
(MDDEP 2003)......................................................................................................... 11
Figure 2-5: Map of the weather stations of the Centre d’études nordiques (triangles) and
the MDDEP (then known as the Ministère de l’Environnement et de la Faune
(MENF)) from 1970 to 1995 (circles) ...................................................................... 14
Figure 2-6: Climatograms for Matagami (southern portion of the Territory),
Kuujjuarapik-Whapmagoostui (northern portion), Radisson (western portion) and
Schefferville (to the east and outside the Territory). Source of data: Environment
Canada stations ......................................................................................................... 16
Figure 3-1: Breakdown of Quebec’s ecoclimatic regions a) now and b) under a climate
where CO2 concentrations would be twice the level measured in the pre-industrial
era (2 x 280 ppm)...................................................................................................... 23
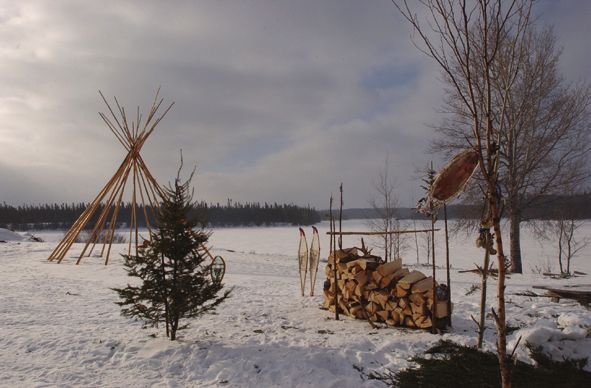
Figure 3-2: Phenological synchronization between the needs of consumers (vertebrates)
and the abundance peak of producers (vegetation or related herbivores) during
reproduction (adapted from Durant et al. 2005). ...................................................... 29v
Acknowledgments
I would like to thank Marc Jetten for our useful discussions as well as Ginette Lajoie,
Guy Demers, Claude Saint-Charles and Annie Déziel for the constructive remarks that
enabled me to enhance this document.
RESEARCH AND WRITING: CÉLINE MEUNIER
COVER PAGE GRAPHICS: CAROLINE C. DE LÉRY
COVER PAGE PHOTOS: COOPER DIGITAL PRODUCTIONS1. Introduction Concern about global warming has become widespread since 1992, the year the Kyoto Protocol (Japan) was signed. The relationship between the planet’s average temperature and carbon dioxide was first stated in 1894 by Svante Arrhenius (Nobel Prize in Chemistry in 1903). The hypothesis regarding the impact of human activity on the climate was advanced during the world’s first climate conference in 1979. The scientific consensus on the issue is recent, however. Controversy over the reality and causes of global warming comes more from the media than the scientific community. Most opponents of the hypothesis that human activity affects the climate are connected to the major oil companies. The role of the James Bay Advisory Committee on the Environment (JBACE) includes counselling governments (federal, provincial, regional and local) on the environmental and social protection regime (Section 22 of the James Bay and Northern Quebec Agreement). In this respect, the JBACE comments on proposed laws, regulations and policies affecting the regime. In addition, the Committee oversees application of the environmental and social impact assessment and review procedure; under this procedure, development projects are the subject of an evaluation and, occasionally, of an impact assessment, to “minimize the negative impact of development (…) upon the Native people and the wildlife resources…” (JBNQA; para. 22.2.2a). To the extent that climate change has an impact on the Cree environment and social milieu, the JBACE would like to gain a better understanding of this phenomenon and, if need be, recommend a course of action to governments. This summary document, which describes the current understanding of climate change in general and of the James Bay Territory in particular, should help the JBACE fulfill its role. This document comprises three sections. The first aims to describe the key scientific elements relating to global warming. These elements concern the global climate as well as the climate in Canada and in Quebec. This first section on the climate ends with some data pertaining to the James Bay Territory. The second section of the document deals
2

with the consequences of global warming on water, forest and wildlife resources. An
understanding of the impacts on these various resources involves a context that goes
beyond the James Bay Territory. Finally, the last section of the document presents
various avenues that can be explored to further define the impact of global warming on
the populations in the James Bay Territory.

2.   The science of climate change

The benchmark for an understanding of climate change is undoubtedly the
Intergovernmental Panel on Climate Change (IPCC). This organization was established in
1988 by the World Meteorological Organization (WMO) and the United Nations
Environment Programme (UNEP). The IPCC’s mission is to “assess the scientific,
technical and socio-economic information” in order to gain a better understanding of the
risks related to human-induced climate change. The IPCC does not conduct research but
its publications are based on scientific and technical publications whose scientific value is
widely recognized (IPCC 2007). The IPCC is comprised of hundreds of experts from
universities, research centers, companies and environmental protection associations. Each
IPCC member is accredited by his or her own government.

At regular intervals (every five to six years), the IPCC does an assessment of the state of
knowledge relative to climate warming. The most recent reports were published in 2007.
These reports contribute, among other things, to the “implementation of the UN
Framework Convention on Climate Change (UNFCCC)”.

In Quebec, the Ouranos Consortium, an organization that is international in scope, was
established in 2002 to pool and develop expertise on global warming. This organization
aims to “advance the understanding of the issues and the associated requirements for
adaptation resulting from climate change on the scale of the North American continent”.
The Government of Quebec, the Meteorological Service of Canada, Hydro-Québec,
research groups and centres as well as universities work in partnership with the Ouranos
Consortium. The ArcticNet Group is also spearheading research into the Arctic climate.
3

Although temperature and precipitation are now being recorded precisely in many
locations, that was not always the case. Data series from thermometers and pluviometers
are relatively recent (the oldest series go back 300 years). Climate studies often require
knowledge of the climate hundreds or even thousands of years ago. The data used are
based on temperature estimates established from tree growth rings, air bubbles trapped in
ice cores or marine fossil sediments.

2.1   Temperature

The Earth’s surface temperature has increased by an average of 0.6°C from the end of the
19th century to the present day (Folland et al. 2001) (Figure 2-1a). Global warming has
been the most rapid over the past 1,000 years (Figure 2-1b). The warming of the climate
has not been constant over time. Since 1861 (the earliest date from which reliable trends
can be established), two periods have been marked by global warming. These two periods
are from 1910 to 1945 and from 1976 to the present. The 1990s is the warmest decade on
record since 1861. The greatest surface temperature increase was observed north of the
60th parallel with a rise of 1.3°C since 1880. The degree of warming also varies
according to the season. Winter warming exceeds summer warming (2.2°C and 0.6°C,
respectively).
4

Figure 2-1: Variations in the Earth’s surface temperature over the past 140 years and the
past 1,000 years (from IPCC 2001): a) annual temperature data (grey bars), uncertainty of
annual data (uncertainty bars in black), moving average with a window of 10 years (blue
line); b) annual temperature variations (dark grey and black), data uncertainty (light
grey), averages over 50 years (in blue).

For Canada, the average annual temperature increase has been 0.9°C in the past century
(Bonsal et al. 2001), with most of this warming occurring during the winter and spring. In
Southern Quebec, the studies conducted in connection with the Ouranos Consortium
established climate trends relying on 60 weather stations. Between 1960 and 2003, the
increases in temperature have been the greatest in winter and more variable during the
summer. The warming is greater for minimum temperatures than for maximum
temperatures. In Southern Quebec, winters are not as cold with an increase in frost/thaw
5

episodes. The warm season is of the same duration but is becoming hotter. Finally, the
results of the interpolation of these data lead one to believe that warming trends are even
more pronounced in the north (Yagouti et al. 2006).

2.2   Precipitation

The main global trends point to an increase in nebulosity, rainfall intensity and total
concentration of water vapour (IPCC 2001). A 5% to 10% increase in precipitation has
been observed since 1900 in the middle and high latitudes of the Northern Hemisphere. A
decrease in the snow cover and shortening of the frost period correspond to a warming of
the Earth’s surface in the Northern Hemisphere.

In Canada, an increase in total annual precipitation is observed for the period from 1960
to 2000 (Zhang et al. 2000). In Eastern Canada, precipitation has increased during the
spring and in the north. Abundant snowfalls are more prevalent in the fall and winter. The
increase in precipitation is estimated at 1.7% of the average per decade for Canada as a
whole between 1948 and 1995. North of the 55th parallel, the increase in precipitation is
noticeably greater with an increase of 2.3% over the average per decade (Mekis and Hogg
1999).

In Quebec, rainfall was abundant during the period 1869-1912, but less abundant than
that observed in the more recent periods (Gosselin and Perrier 2001). It is not possible to
conclude, however, that there has been an increase in extreme events, because the
distribution of pluviometers has changed too much since that time.
6

 2.3 Expected climate change

The scenarios derived from climate projections forecast an increase in sea levels of 21
cm to 70 cm by 2100 according to the models (IPCC 2001). The climate change expected
for North America and Quebec can be seen on the website of the Canadian Climate
Impacts Scenarios Project (CCIS 2006). The many scenarios available give the anomalies
in temperature and precipitation between the 2050 horizon and the reference period from
1961 to 1990 (Figure 2-2 and Figure 2-3). With the ECHAM4 gg1 model, the climate
change in Quebec consists of a 4°C increase compared with the period from 1961 to 1990
(Figure 2-2). The forecast changes in precipitation are less pronounced. In the southern
part of the province, a slight increase in precipitation is forecast, and a larger increase, of
up to 30% a day, is expected in the northern part of the province by 2050. The increase in
precipitation is expected to be greater between 2050 and 2080 (Figure 2-3).

Figure 2-2: Temperature anomalies for 2050 in comparison with the period from 1961 to
1990 according to a ECHAM4 gg1 scenario (CCIS 2006)
7

Figure 2-3: Precipitation anomalies for 2050 in comparison with the period from 1961 to
1990 according to a ECHAM4 gg1 scenario (CCIS 2006)

Global warming:

- The global climate has warmed by about 0.6°C since the end of the 19th century.
- The 1990s was the warmest decade of the past century.
- The models predict warming of 1.8°C to 4°C for the central values by the end of the
21st century. The extreme values range from 1.1°C to 6.4°C.

- Mountain glaciers are shrinking as are those of Greenland and the Antarctic, and sea
levels are rising faster than before, by more than 3 mm a year.

In Canada and Quebec:

- The climate has warmed by about 1°C over the past century.
- Warming will continue to be more pronounced in the northern regions.
- The models predict a warmer and wetter climate for Northern Quebec.

                                                                          (Ouranos 2007)
8
Table 2-1: Summary of forecast climate change compared with 1961-1990
Northern Quebec
2020 2050 2080
Winter Temperature 2.5 to 3.5°C 4 to 7°C 6 to 12.5°C
Precipitation 1 to 18% 2 to 32% 5 to 53%
Summer Temperature 1 to 2.5°C 1.5 to 4°C 2 to 6°C
Precipitation 1 to 12% 3 to 19% 5 to 30%
Southern Quebec
2020 2050 2080
Winter Temperature 1 to 2.5°C 2 to 5°C 3.5 to 8°C
Precipitation -5 to 19% 0 to 32% 1 to 43%
Summer Temperature 1 to 2°C 2.5 to 4°C 2.5 to 6°C
Precipitation -5 to 10% -7 to 14% -11 to 150%
Source: http://www.ouranos.ca/intro/IPCC2007_f.html
2.4 Acceleration and slowdown factors (carbon sources and carbon sinks)
The increase in greenhouse gases as a result of human activity is the main factor
accelerating climate warming (IPCC 2007). Greenhouse gases trap heat on the Earth’s
surface. The main greenhouse gases are carbon dioxide (CO2), methane (CH4), ozone
(O3), nitrous oxide (N2O) and water vapour (gaseous H2O). These gases are naturally
present in the atmosphere and allow for an average Earth surface temperature of 15°C.
Without these gases, it is estimated that the temperature would be -18°C (IPCC 2001).
Industrialization, the use of fossil fuels and deforestation have, however, contributed to
an increase in the concentration of greenhouse gases from 280 parts per million (ppm) in
the mid-19th century to 380 ppm today (IPCC 2001). The increase in greenhouse gases
has been exponential since industrialization began (IPCC 2001).
The main carbon dioxide sources and sinks are factors that, respectively, accelerate and
slow climate change (Table 2-2).9
Table 2-2: Average annual estimate of carbon dioxide sources, sinks and reservoirs
derived from anthropogenic carbon dioxide emissions 1980–1989 (Environment Canada
2006a)
A. Sources
Estimate (range)
(gigatonnes/year)
Emissions from the combustion of fossil fuels and cement production 5.5 (5.0 – 6.0)
Net emissions from changes in the use of tropical lands 1.6 (0.6 – 2.6)
Total 7.1 (6.0 – 8.2)
B. Sinks
Estimate (range)
(gigatonnes/year)
Storage in the atmosphere 3.2 (3.0 – 3.4)
Absorption by oceans 2.0 (1.2 – 2.8)
Absorption by second-growth forests in the Northern Hemisphere 0.5 (0.0 – 1.0)
Additional terrestrial sinks (fertilization with carbon dioxide, fertilization with
nitrogen, climate effects) 1.4 (0.0 – 2.9)
Total 7.1
*The upper and lower limits correspond to an estimated confidence interval of 90%.
** Fertilization with carbon dioxide and nitrogen constitutes additional sinks where
increases in atmospheric concentrations of carbon dioxide and nitrogen oxides from
anthropogenic emissions provide additional nutrients necessary for plants in the
ecosystems concerned. Climate feedback occurs when changes in temperature,
precipitation or other climate variables enhance the growth conditions of plants and,
consequently, favour the accumulation of biomass.
Source: IPCC, 199510 In addition to greenhouse gases, aerosols (suspended particles in the atmosphere) have an impact on solar radiation. Aerosols include soot and sulphates. These particles reduce surface temperatures by absorbing the incident solar radiation (soot) in the lower atmosphere or by dispersing and reflecting the incident light (sulphate aerosols) and favouring the formation of clouds. The presence of aerosols reduces the effect of greenhouse gases but cannot offset them. In Canada, greenhouse gas emissions totalled 740 megatonnes (Mt) of CO2 equivalent in 2003. Quebec accounts for 12.3% of these emissions, or the equivalent of 91.0 MT of CO2 (in 2003), which corresponds to an average of 12.1 tonnes per person. The transportation sector alone accounts for 34 Mt CO2 eq., or 37.4% of emissions (Figure 2-4). To calculate the emissions for a given territory, there are formulas that take into account the vehicle types and the number of kilometres travelled in the city or over longer distances. The average emissions for light vehicles are 2,400 kg of CO2 for 10,000 km (Energuide 2006). Heavier vehicles consume more. In the James Bay Territory, more than 20,000 vehicles of all types are in use. A rough approximation (based on these numbers) yields 0.5 Mt of CO2 emissions due to road transportation in the Territory. A more precise calculation of CO2 emissions in the James Bay Territory would, however, take into account the types of vehicle and the distance travelled by these vehicles.
11

Comparison of average CO2 emissions by type of transport:

- Air transport: 0.85 kg of CO2 per kilometre and per passenger (if the plane is full);

- Road transport: 0.20 kg of CO2 per kilometre and per passenger (for one occupant per
vehicle); and

- Bus transport: 0.07 kg per kilometre and per passenger (if the bus is full).

                                                               (Environment Canada 2005)

                                     Electricity
                                       1.7%

                             Waste
                             6.9%
               Agriculture
                 9.4%

                                                   Transport
                                                    37.4%
   Residential,
 commercial and
   institutional
      14.5%

                                 Industrial
                                   31.1%

Figure 2-4: Breakdown of greenhouse gases in Quebec by sector of activity in 2003
(MDDEP 2003)
12
The main cause: greenhouse gases (GHG)
- “Most of the observed increase in globally averaged temperatures since the mid-20th
century is very likely due to the observed increase in anthropogenic greenhouse gas
concentrations” with a probability greater than 90%
- Carbon dioxide concentrations in the atmosphere “exceed by far” what has been
observed for the past 650,000 years. The same is true of methane.
(IPCC 2007)
2.5 Impacts specific to northern environments
Climate scenarios suggest that global warming may be even more pronounced in northern
regions. In the Canadian north, this phenomenon has already caused melting of the
permafrost, a shorter snow cover and a shorter icy period. The impacts on infrastructures,
such as residential buildings and airports, are being studied by teams from Environment
Canada, Transport Canada, Transport Quebec, Ouranos and the Centre d’études
nordiques at Université Laval. This warming also tends to reduce the duration and
thickness of the ice cover on lakes and rivers. This phenomenon makes river crossing a
high-risk activity during strategic periods of the year when wildlife is available for
hunting and trapping. A study is being made in Nunavik under the stewardship of the
Kativik Regional Government with the support of Environment Canada through the
Northern Ecosystem Initiative, Ouranos and ArcticNet.
2.6 The James Bay Territory and its climate
The James Bay Territory is a vast area covering more than 350,000 km², or one-fifth of
the Province of Quebec. This territory lies approximately between the 49th and 55th
parallels. It is bounded on the west by James Bay and Hudson Bay and on the east by the
watershed of the Otish Mountains toward the basins of the St. Lawrence and of James
Bay. The James Bay Territory is in the boreal ecoclimate zone (MRN 2005). The territory
has a population of about 30,000. It is home to nine Cree villages: Whapmagoostui,
Chisasibi, Wemindji, Eastmain, Waskaganish, Nemaska, Waswanipi, Ouje-Bougoumou
and Mistissini. The other villages are mainly in the southern portion of the territory13
(Chibougamau, Chapais, Lebel-sur-Quévillon, Matagami, Radisson, Val Canton and
Villebois). In the Nord-du-Québec administrative region, more than 50% of the
population is less than 30 years old (2004 data).
2.6.1 Available climate data
Many weather stations are located in the James Bay Territory. The Centre d’études
nordiques has had its own weather stations since 1995, Hydro-Québec since the 1980s,
Quebec’s Department of Sustainable Development, Environment and Parks (MDDEP)
during various periods from 1970 to 1995 and Environment Canada since the 1920s.
These stations have been mapped (Figure 2-5) with the exception of Hydro-Québec’s
stations. 1 Hydro-Québec had a network of weather stations in the James Bay Territory.
These stations were active from 1995 to 2004 (Marie-Josée Doray, Hydro-Québec,
personal communication). The quality of the historical weather observations of this
network ranges from fair to unusable (Enviromet International Inc. 2003). Hydro-Québec
therefore installed a new network in 2005 to meet the international standards of the
World Meteorological Organization. The co-ordinates of the network active from 1990 to
2004 and the measured meteorological parameters are presented in the appendix in
Tables 7-1 and 7-2. The co-ordinates of the new network’s stations and the parameters
measured are shown in Tables 7-3 to 7-6.
A list of data available by station in the James Bay Territory will be compiled by the
Centre d’études nordiques. The map below does not show all the Environment Canada
stations in the James Bay Territory but most are indicated elsewhere in this report (Table
2-3).
1
See the appendix for a list of Hydro-Québec weather stations.14
Legend:
■ Environment Canada station MENF station closed in 1985
● Village Automated station of the Centre d’études nordiques
Non-automated station of the Centre d’études nordiques
Figure 2-5: Map of the weather stations of the Centre d’études nordiques (triangles) and
the MDDEP (then known as the Ministère de l’Environnement et de la Faune (MENF))
from 1970 to 1995 (circles)15
Table 2-3: Environment Canada weather stations in the James Bay Territory
Name of station Latitude Longitude Altitude
* BONNARD 50°44' N 71°03' O 506 m
* CHAPAIS 2 49°47' N 74°51' O 396 m
HEMON 49°04' N 72°36' O 183 m
JOUTEL 49°28' N 78°18' O 290 m
* KUUJJUARAPIK A 55°17' N 77°45' O 10 m
LA GRANDE RIVIERE A 53°38' N 77°42' O 195 m
MATAGAMI A 49°46' N 77°49' O 281 m
Note: An * indicates stations that meet World Meteorological Organization standards.
2.6.2 Spatial climate variations in the James Bay Territory
The main spatial climate differences in the James Bay Territory can be summarized as
follows (Figure 2-6):
- The southern part of the Territory is warmer and wetter than the north;
- The southern and eastern regions of the Territory get more solid and liquid
precipitation than do the west and north.16 Figure 2-6: Climatograms for Matagami (southern portion of the Territory), Kuujjuarapik-Whapmagoostui (northern portion), Radisson (western portion) and Schefferville (to the east and outside the Territory). Source of data: Environment Canada stations 2.6.3 Main climate trends The climate trends observed during the period from 1970 to 2002 show that the average annual temperature increased by 1 to 1.5°C. The thermal sum (degrees-days above 5°C) increased from 100 to 140 degrees-days during this period in the boreal forest zone (Meunier 2006). The warming has been especially pronounced since the mid-1990s. The climate models suggest an increase in temperature of about 4°C for the James Bay Territory and an increase in precipitation of 2 to 32% a day by 2050 (CCIS 2006)
17

3.    Consequences of climate change

3.1    Water resources

The expected climate change should affect the frequency of El Niño and La Niña events.
El Niño events, which are responsible for dryer winter conditions in Canada, should be
longer and more frequent. El Niño years should be punctuated by years of heavy rainfalls
because of the effects of La Niña. Indeed, the frequency of El Niño and La Niña events
increased during the 20th century, and it appears that their intensity rose in the 1980s and
1990s compared with the 1950s (Table 7-7 and Table 7-8) (Environment Canada 2007).

For instance, studies conducted in the Canada-U.S. Great Lakes region show the effects
of global warming on river flow, groundwater, the water supply in the Great Plains region
and the level of the Great Lakes. Many of the lake and river systems whose levels and
rates of flow are expected to decrease, on average, are among the most heavily used in
Canada and are also shared with the United States. It has already been observed that the
minimum flow rates and low-water levels have decreased in the summer and early fall in
south-central British Columbia since 1995 (Leith and Whitfield 1998) and on the
southern Prairies since 1993 (Yulianti and Burn 1998). Consequently, it appears that
water-conservation measures will be important, especially in cases of high consumption,
such as for irrigation. There is also the risk of a reduction, over the long term, in the
groundwater replenishment rate in southern Canada.

As for Quebec’s northern rivers, which are generally covered with ice in the winter, ice
breakup and the flooding it causes could occur in the wintertime rather than in the spring
(Clair et al. 1997).

Climate change could increase river flows and groundwater levels in the James Bay
Territory. The risk of ice jams could be greater in the winter.
18

3.2     Coastal areas

Sea-level rise caused by partial melting of glaciers and polar ice caps increases the
sensitivity of coastlines. Coastal areas will be more prone to flooding, erosion, beach
migration and coastal-dune destabilization (Natural Resources Canada 2006c). Two areas
of Canada are particularly at risk: Atlantic Canada and parts of the Beaufort Sea coast.
The James Bay and Hudson Bay coastlines present a low to average sensitivity
(Environment Canada – Canada Atlas). They are gradually being spared these effects
because of an even more rapid isostatic rebound in the region.

The James Bay coastal areas present a low sensitivity to climate change, in part
because the isostatic rebound is still rapid in this region.

3.3     Forests

Forests absorb and release large quantities of CO2. A growing forest is a carbon sink,
whereas a mature forest is in equilibrium with the atmosphere in terms of carbon
exchanges. Photosynthesis allows the absorption of CO2. The climate factors that affect
the rate of photosynthesis are light intensity, air temperature, water availability,
atmospheric concentration of CO2, atmospheric pollutants and soil conditions (Kozlowski
and Pallardy 1997). In the next few paragraphs, we will examine the main elements
modified by the expected climate warming.

3.3.1    Impacts of climate change on forest physiology

The increase in greenhouse gases, especially CO2, over the past 150 years, warming and
increased precipitation should affect the physiological processes of plants. The combined
action of these various factors is difficult to predict, however (Forget et al. 2003).
19

3.3.1.1 CO2 concentrations

Certain physiological processes appear to be favoured by an increased concentration of
CO2 (Table 3-1). Plants are expected to make more efficient use of light, water and
nutrients. Photorespiration should be less efficient, however. Given that the growth of
tree species is often limited by the availability of CO2, an increase in greenhouse gas
concentrations should have a positive effect (Kirshchbaum 2000). Still, the positive
impact of CO2 on growth is highly dependent on the availability of soil nutrients (Drake
et al. 1997, Kirshchbaum 2000). The positive impact of CO2 on growth will also depend
on the species considered and the development stages. The species benefiting the most
from an increase in CO2 are annual and perennial herbaceous species. Those benefiting
the least are conifers and late-succession tree species (maple, yellow birch, white spruce
and white pine). Younger trees will benefit more from CO2 fertilization than will older
trees (Papadocol 2000).

It is important to note that the positive effects of CO2 on tree growth could be cancelled
out by the negative effects of certain gases, such as ozone (O3) and sulphur dioxide (SO2)
(Isebrands et al. 2001). Studies of the quaking aspen show that the tree’s productivity has
already decreased because of the current levels of ozone in the air (Percy et al. 2002).

For the black spruce, the dominant species in Quebec’s boreal forest, the
consequences of a doubling of CO2 are:
- A quicker budbreak in the spring;
- Greater tolerance to frost by young buds in early fall;
- Regulation of photosynthetic activity.
                                                                     (Bertrand and Bigras 2006)
20 3.3.1.2 Temperature Physiological processes are affected by an increase in temperature (Table 3-1). In general, temperature increases benefit both photosynthetic activity and respiration. The net carbon balance will, however, plateau and then diminish with a continued increase in temperature (Kirshchbaum 2000). The effects of temperature on growth vary according to the species. Growth of the sugar maple (Courchesne et al. 2001) and the grey pine (Brooks et al. 1998) is favoured, but an increase in temperature can reduce the length of the terminal shoot of the Douglas fir (Olszyk et al. 1998). - In general and for Quebec, an increase in temperature should favour tree growth. - For black spruce and grey pine, the dominant species in the James Bay Territory, radial growth is positively correlated with an early start to the season (Hofgaard et al. 1999). 3.3.1.3 Precipitation The impact of water stress depends on the physiological process considered. For instance, where photosynthetic activity is concerned, efficient use of light diminishes with drought, whereas photorespiration, respiration, efficient use of water and tree sensitivity to insects and disease increase under the same conditions of water stress.
21

- For the black spruce, a study of Western Quebec showed that an increase in
precipitation in June appeared to have a beneficial effect on radial growth (Hofgaard et al.
1999).

- In Northern Quebec (north of 50°N), an increase in precipitation could compensate
for a potential increase in evaporation caused by higher temperatures (Forget et al.
2003).
22

Table 3-1: Effect of an increase in the concentration of CO2 and of the temperature on the
various physiological processes (from Colombo 1998)

    Physiological process            Increase in CO2 concentration            Increase in temperature
                                   Increase subject to feedback        Increase subject to feedback related
Photosynthesis
                                   related to available resources      to available resources
Photorespiration                   Decrease (in general)               Increase
Night respiration                  Slight decrease                     Increase
                                                                       Increase up to temperatures of 30-
Stoma conductivity                 Decrease
                                                                       35°C
Light-use efficiency               Increase                            No change
Water-use efficiency               Increase                            Decrease
Nutrition-use efficiency           Increase                            No effect
                                   Shorter growing season because of • Earlier budbreak in the spring
Phenology                          later budbreak and/or earlier bud   • Hardening of buds later in the
                                   formation                             season
                                   • Increase in growth rates
Allocation of carbon / structure                                       • Increase in growth rates
                                   • Reduction in stoma density
of tree                                                                • Earlier budbreak and flowering
                                   • Increase in root growth
Sensitivity to stress              Increase in tolerance to drought Increase in potential damage from
                                   with closing of stomata             winter and spring frosts

The effects of increases in CO2 concentrations and temperatures on the physiological
processes of plants can be positive or negative depending on the process considered.
Generally speaking, the most recent IPCC reports consider that the boreal forest would be
favoured by an increase of 2 to 3°C, but the boreal ecosystem would be greatly harmed
by increases greater than 3°C.

3.3.2     Migration of species and relocation of ecosystems

Paleoecological studies have shown that the distribution of ecosystems was linked to the
climate (Delcourt and Delcourt 1988). In line with the studies of climate and vegetation
changes that occurred thousands of years ago, one can consider the impact of the present
23
climate warming on the composition and distribution of the current ecosystems. In this
sense, the studies of Rizzo and Wilken (1992) and Luckman and Kavanagh (2000) lead
us to believe that the habitats of species move northward and to higher altitudes.
Paleoecological studies have shown that it is not ecosystems that migrate but rather
individual species. Still, the speed of the current climate warming is unprecedented, so it
is difficult to establish projections respecting the migration of species. Statistical models
describing landscapes seem to perform best in predicting changes. An example that is
frequently quoted in government documents is presented below:
A) Distribution of ecoclimatic regions in B) Projection of the migration of regions
Quebec under a 2X CO2 climate
Arctic
Subarctic
Boreal
Temperate
Thermophile
Plain with
mixed forest
Environment Canada From Rizzo and Wiken, 1992
The two pictures show
A) the distribution of ecoclimaticregions in Quebec(Environment Canada) and
B) the projection of the migration of these regions under a 2 X CO2 climate
(according to Rizzo and Wiken, 1992)
Figure 3-1: Breakdown of Quebec’s ecoclimatic regions a) now and b) under a climate
where CO2 concentrations would be twice the level measured in the pre-industrial era (2
x 280 ppm)24
Still, we can question the merits of a map that is based solely on climate projections. The
dynamics of forest ecosystems are more complex and do not react only to temperature but
also to precipitation and frequency of disturbances. One must also consider the various
phases of the forest dynamics, namely seed production, the installation of seedlings and
individual growth.
Consequences for forest ecosystems:
- Significant changes in habitat potential for tree species are expected and could lead to a
new composition of vegetation communities in Quebec (Rizzo and Wilken 1992)
- The speed of climate change is unprecedented and could lead to local loss or extinction
of species with a weak dispersion capacity or a limited dispersion area (Thompson et al.
1998)
- The ability of species to migrate in response to climate change will be strongly
influenced by auto-ecological species constraints, such as seed dispersion, and by factors
such as forest fragmentation, regeneration practices and disturbance regime (Flannigan et
al. 2001)
From Forget et al. 2003
3.3.3 Natural disturbances
Natural disturbances, such as epidemics and forest fires, have considerable influence on
the forest dynamics of boreal forests. An impact assessment of climate change on
Quebec’s boreal forest requires an understanding of how climate change can affect the
frequency and intensity of natural disturbances.25 3.3.3.1 Forest fires The impact of higher temperatures on forest fires is difficult to forecast. In the early 1990s, it was recognized that an increase in temperatures could increase the occurrence of forest fires (Overpeck et al. 1990, Flannigan and Van Wagner 1991, Clark 1998). Still, opinions voiced by an expert in that area (Dr. Mike Flannigan), and reproduced on the website of Natural Resources Canada, show that it is difficult to draw such a conclusion: “My best guess is a 50 percent increase in Canadian forest fires by the year 2050, but that figure could be completely incorrect ” (Information Forestry 2001). In Quebec, most of the studies done on the subject have been carried out in the Lake Duparquet area of the Abitibi region by the team of Dr. Yves Bergeron. These studies show that an increase in temperature could be more than offset by an increase in abundance and a better temporal distribution of precipitation (Bergeron 1998). The work now being done by Dr. Bergeron’s team aims to assess the impact of climate change on forest yields to help forest stakeholders adapt more effectively to the possible consequences. The five key objectives are: (i) to quantify the relationship between climate and radial growth for two major commercial species, namely the quaking aspen and the black spruce, and to project their expected growth as a result of forecast climate change; (ii) to determine the relationship between climate and forest-fire frequency, and to make frequency projections, again based on forecast climate change; (iii) to evaluate how climate change will affect the growth and distribution of the two species in relation to a topographical drainage gradient and to use these results to factor climate into the growth equations of yield tables; (iv) to simulate various scenarios for a forest management unit, taking into account the effects of climate change on growth and forest fires; and (v) to assist stakeholders in order to maximize adaptation of silvicultural practices to climate change.
26

In a scenario where the CO2 rate is doubled, studies forecast that Quebec’s forest-fire
season will be 27 days longer (Wotton and Flannigan 1993) and that it will start earlier
(Stocks et al. 1998).

The global models that form the basis for climate simulations used to determine the risks
of forest fire show an increased risk for the James Bay Territory. The map produced by
Brian Stocks and his colleagues at the Canadian Forest Service (Natural Resources
Canada 2006a) shows that the risk of forest fires will increase in the 21st century for the
James Bay Territory. Thus the forest-fire risk index, which was 1 to 2 (on a scale of 0 to
6) for the period from 1980 to 1989, is now estimated at 2 to 4 for the period from 2090
to 2099, depending on the location in the James Bay Territory (Environment Canada –
Canada Atlas).

It is very difficult to predict the impact of climate change on the risk of forest fires.
The increase in precipitation could reduce the risk of forest fires but the models
established by Natural Resources Canada indicate an increased risk for the James Bay
Territory.

3.3.3.2 Epidemics

In the boreal forest, the most damaging epidemics for the forest cover are caused by the
spruce budworm (Choristoneura fumiferana (Clem.). The forecast climate warming
could have a positive effect on the reproduction of insects and their development (Lysyk
1989). Milder winters could also be beneficial to the survival of certain pest insects
(Williams 1995). Given the more rapid migration of insects, one of the risks of climate
warming is an invasion of exotic pest insects in the temperate and boreal forest
distribution area (Dale et al. 2001). Still, it is difficult to forecast the incidence of
epidemics on the forest landscape. Changes in the composition of the vegetation cover
vary depending on whether the models consider the effects of pest insects (Niemela et al.
2001). Finally, fibre loss due to the herbivorous nature of pest insects results in a flow of
27

carbon to the atmosphere, which could aggravate global warming (Volney and Fleming
2000).

Climate warming should favour insect epidemics and the invasion of ecosystems by
exotic pest insects.

3.3.4    Socio-economic impacts

Phenologic changes in forest ecosystems as a result of climate change could have
consequences for the social milieu as regards forest use (Table 3-2).

Table 3-2: A few examples of the socio-economic impacts of climate change
(Environment Canada 2006b)
         Physical impacts                           Socio-economic impacts
Changes in forest productivity    Changes in the production of timber and rental value
Increase in greenhouse gases in   Introduction of mitigation policies and carbon credit-permits
the atmosphere                    creating a carbon sequestration market
Increase in disturbances          Loss of forest products and non-commercial goods
Migration of ecozones northward   Changes in land values and land-use options
Climatic and ecosystemic          Economic restructuring leading to social and individual
changes                           tensions and other social pathologies
Changes in ecosystems and
                                  Changes in non-commercial values
specialized species
                                  Deterioration of parks and natural reserves, and increase in
Changes in ecosystems
                                  conflicts over land use

3.4     Peat bogs

Peat bogs are an essential feature of the Canadian landscape as they cover 14% of
Canada’s land mass (Natural Resources Canada 2006b). Peat bogs are areas where
decomposing vegetation has accumulated on the surface to depths that may exceed 40
cm. Peat bogs have an important ecological role to play in the regulation of drainage
28 networks. Water is stored in these wet environments and slowly replenishes aquifers. These processes help reduce river flows during flooding and maintain them during drought. Peat bogs are also a habitat for many wildlife species, in particular waterfowl. Finally, wet environments retain contaminants. With respect to climate change, peat bogs are now huge carbon sinks, but in a warmer climate the captured carbon could be freed and thus accentuate global warming (Natural Resources Canada 2006b). At present, peat bogs constitute sites that reduce atmospheric CO2 (carbon sinks) but they could become sources of greenhouse gases with the forecast warming. Studies are now being made in the James Bay Territory to assess the impact of climate change on these complex ecosystems. Three 150-km2 areas have been retained in the LG1, LG2 and LG3 regions, all of which include various types of peat bog. The findings will help identify the relationship, over the past four decades, between changes in the surface characteristics of peat bogs and the climate in this boreal region, where climate- prediction models forecast a more pronounced increase in temperatures. These studies are being made under the direction of Michelle Garneau (of the Université du Québec à Montréal) and Serge Payette (of Université Laval in Quebec City). 3.5 Wildlife Most studies aiming to better understand the impact of climate change on wildlife are concerned with changes in the phenology of organisms (the timing of recurring life-cycle events, such as reproduction, and organisms’ response to their environment). The climate can have a direct impact on wildlife phenology or indirect effects through changes in wildlife habitats. Thus the survival of certain vertebrates may depend on a proper fit between the phenology of plant species and reproduction (Einum and Fleming 2000, Thomas et al. 2001).
29

3.5.1   Indirect effects of the climate

Experimental studies in controlled environments show that increased warming accelerates
plant growth and hastens the beginning of the next phenological stage (Saxe et al. 2001,
Badeck et al. 2004). One of the consequences of climate change could be
desynchronization between the availability of plants and the wildlife that eats them.
Herbivores usually raise their offspring during the peak availability of the plants that they
consume (Perrins 1970, Nilsson 1994). Consequently, animals may have to reproduce
earlier to stay in tune with the phenology of their food.

 Abundance
Abunbance
   of food
  of food
                 Producers       Consumers

                 T’’            T’   T            Time
       Synchronization
Desynchronization

Figure 3-2: Phenological synchronization between the needs of consumers (vertebrates)
and the abundance peak of producers (vegetation or related herbivores) during
reproduction (adapted from Durant et al. 2005).

A study made in the Yukon shows the indirect effect of climate warming on red squirrels
(Tamasciurus hudsonicus). Climate warming and an increase in the abundance of spruce
cones are correlated with earlier reproduction dates for the red squirrel population studied
(Réale et al. 2003, Berteaux et al. 2004).

The indirect effects of global warming on wildlife include thawing and reduction of the
ice cover in Arctic regions. This has a major effect on polar bears, which must swim far
more and have difficulty obtaining food (Envirozine 2005).
30 3.5.2 Direct effects Many studies have shown a correlation between climate warming and the reproduction dates of certain vertebrates (Crick and Sparks 1999, Sanz 2002). In North America, the average egg-laying date occurred 10.1 days earlier in 1998 than in 1971. Meta-analysis of 675 species in many locations has shown an overall advance in spring phenologies (plants and animals) of 2.3 days per decade (Parmesan and Yohe 2003). Not all species react in the same fashion, however. In birds, for instance, 47% of the 168 species studied brought forward their reproduction date, whereas 8% delayed it and 45% did not change it (Parmesan and Yohe 2003, Visser et al. 2004). 3.5.3 Studies of the James Bay Territory Research is taking place at the Université du Québec à Rimouski under the direction of Dominique Berteaux under the auspices of the Canada Research Chair in Northern Ecosystem Conservation (Berteaux et al. 2006). A research theme developed by Dominique Berteaux in partnership with ArcticNet focuses on the response of boreal forest mammals to climate change. Moreover, one of ArcticNet’s research themes is “food, water and resources in the shifting north-south geothermal gradient of the terrestrial Eastern Canadian Arctic” (ArcticNet 2006). This theme is an integrated regional impact assessment of climate warming and societal conditions along the north-south gradient of the Eastern Canadian Arctic and subarctic. Research will take place in the Northern RiSCC sector, an area that covers more than 30 degrees of latitude, from 53°N (James Bay) to 83°N (Quttinirpaaq National Park, Ellesmere Island, Nunavut) and has various ecoclimatic zones, such as boreal forest, shrubby tundra and High Arctic polar desert. The Canadian Wildlife Service conducted research on the James Bay goose (Canadian Wildlife Service 2006). The species studied were the brant, the Canada goose and the lesser snow goose. These species have an economic importance because they are hunted
31

by the Cree and Inuit populations of Northern Quebec. The purpose of the study was to
obtain information on the ecological needs of geese in those periods when they gather
and reproduce in the coastal wetlands of James Bay to assess, forecast and mitigate the
impact of the region’s activities. The study was made in partnership with Arctic Goose
Joint Venture (AGJV), James Bay Energy Corporation (SEBJ), GENIVAR consulting
group and Eeyou Corporation. The knowledge acquired during the study could allow for
an evaluation of the indirect effects of climate change on the avian populations observed
and, consequently, a better understanding of the impacts of climate change on this
resource.

Studies to be monitored:

- The studies by Dominique Berteaux of the Université du Québec à Rimouski
concerning the response of mammals living in the boreal forest to ongoing climate
change.

- The studies conducted by ArcticNet on “food, water and resources in the shifting north-
south geothermal gradient of the terrestrial Eastern Canadian Arctic.”

- The Canadian Wildlife Service studies on avian wildlife, including waterfowl.

3.6   Energy and the James Bay Territory

The watershed of the La Grande Hydroelectric Complex covers 177,000 km², or 12% of
Quebec’s total area. The annual electrical output of the La Grande Hydroelectric
Complex is about 83 terawatt hours (TWh) and represents more than 40% of the
electricity consumed in Quebec (193 TWh in 2003). The construction of three new
generating stations between 2003 and 2011 (Eastmain-1, Eastmain-1A and Sarcelle) and
the diversion of the headwater of the Rupert River toward the La Grande power stations
will raise the total output of the La Grande Hydroelectric Complex to about 94 TWh.
32

Studies conducted in the James Bay Territory have assessed the changes in runoff in three
drainage basins that are important for hydroelectricity production. Singh (1988 in Bruce
et al. 1999) foresees an increase in the runoff of the La Grande River (15.6% to 16.5%),
the Caniapiscau River (13.0% to 15.7%) and the Opinaca-Eastmain River (6.7% to
20.2%). These increases do not, however, exceed the annual variations in the net capacity
of the drainage basins (Bruce et al. 1999).

The expected increase in precipitation in the James Bay Territory should lead to an
increase in the generation of electricity.

In relation to climate change, it should be noted that hydroelectricity generates the least
amount of greenhouse gases (during the operations phase) and far less than generating
stations that use oil, coal or natural gas (Tremblay 2005). The first years after the priming
of reservoirs are marked by an increase in greenhouse gas emissions. These emissions are
due to the decomposition of the labile fraction of flooded organic materials. The
reservoirs’ emissions return to rates equivalent to those of lakes and rivers after a 10-year
period (SEBJ 2004). Indeed, the maximum flooded area of the Rupert reaches for the
Eastmain-1-A project is equivalent to 346 km.² The maximum greenhouse gas emissions
should be measured every two to four years after priming and reach 128,000 to 685,000
tonnes of CO2 equivalent per year. Thereafter, emissions should drop to 32,000 to 71,000
tonnes of CO2 equivalent per year whereas they are now –36,000 to 81,000 tonnes of CO2
equivalent per year (SEBJ 2004).

4.   Research to address knowledge gaps regarding the James Bay Territory

The research directly linked to climate change and carried out, at least in part, in the
James Bay Territory is listed in the table below (Table 4-1). These research themes
generally involve many projects and are the subject of ongoing work, which explains why
they do not have a precise timetable associated with them.
You can also read