Climate Impacts in Portugal
←
→
Page content transcription
If your browser does not render page correctly, please read the page content below
Climate Impacts in Portugal

Authors/Contributors

Carl-Friedrich Schleussner, Head of Climate Science and Impacts
Inga Menke, Research Associate
Emily Theokritoff, Research Analyst
Nicole van Maanen, Research Analyst
Alexandrine Lanson, Student Assistant

This scientific report is an independent product based on the most recent available science. The
authors are uninfluenced as to form or content by the exigencies of litigation. All sources used
in this report are stated in the annex.

Date: 11 December 2019
Updated: 31 July 2020
About Climate Analytics
Climate Analytics is a non-profit climate science and policy institute based in Berlin, Germany with offices in New
York, USA, Lomé, Togo and Perth, Australia, which brings together interdisciplinary expertise in the scientific and
policy aspects of climate change. Our mission is to synthesise and advance scientific knowledge in the area of
climate change and on this basis provide support and capacity building to stakeholders. By linking scientific and
policy analysis, we provide state-of-the-art solutions to global and national climate change policy challenges.
Climate Analytics was founded in 2008 in Potsdam, Germany by Dr. (h.c) Bill Hare, Dr. Malte Meinshausen and
Dr. Michiel Schaeffer to bring vanguard climate science and policy analysis to bear on one of the most pressing
global problems of our time: human induced climate change. We are motivated by the desire to empower those
most vulnerable – small island states and least developed countries – to use the best science and analysis
available in their efforts to secure a global agreement to limit global warming to levels that don’t threaten their
very survival.

Contact
contact@climateanalytics.org
PORTUGAL

Table of Contents
1. SUMMARY ................................................................................................................................................... 2
2. IPCC SUMMARY ON CLIMATE IMPACTS IN PORTUGAL ................................................................................. 3
3. TECHNICAL NOTE: REPRESENTATIVE CONCENTRATION PATHWAYS, CLIMATE IMPACTS ANALYSIS AND
PROJECTED TEMPERATURE WARMING ............................................................................................................ 5
4. TEMPERATURE INCREASE............................................................................................................................. 7
5. PRECIPITATION ............................................................................................................................................ 9
6. SEA LEVEL RISE ............................................................................................................................................11
7. EXTREME WEATHER EVENTS .......................................................................................................................14
    7.1 HEAT WAVES ............................................................................................................................................14
    7.2 WILD FIRES ...............................................................................................................................................17
    7.3 DROUGHTS ...............................................................................................................................................22
    7.4 STORMS ..................................................................................................................................................23
    7.5 HEAVY PRECIPITATION .................................................................................................................................24
    7.6 FLOODS ...................................................................................................................................................25
8. SECTORAL IMPACTS ....................................................................................................................................27
    8.1 AGRICULTURE ...........................................................................................................................................27
    8.2 ECONOMIC IMPACTS ...................................................................................................................................30
9. HEALTH .......................................................................................................................................................33
    9.1 HEAT ......................................................................................................................................................34
    9.2 AIR QUALITY AND RESPIRATORY DISEASES .........................................................................................................38
    9.3 VECTOR-BORNE DISEASES .............................................................................................................................42
10. REFERENCES ..............................................................................................................................................43

www.climateanalytics.org                                                                                                                                          1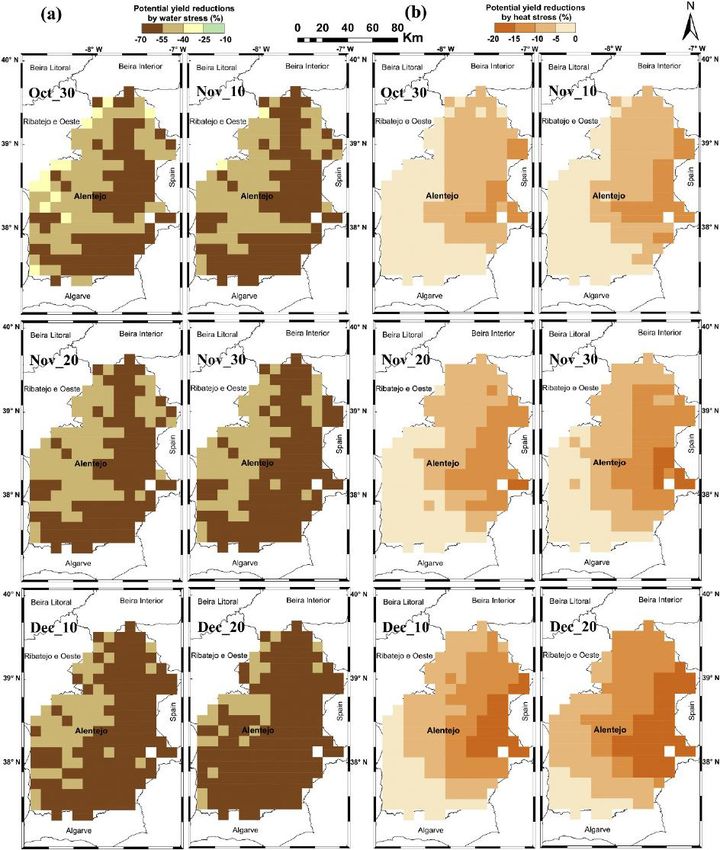
1. Summary
This report provides scientific evidence on observed and future impacts of climate change in
Portugal. Portugal is already experiencing increasing climate change today – with global
warming currently at approximately 1°C above pre-industrial levels – which manifests itself in
a range of impacts for humans and ecosystems.

Portugal’s vulnerability to climate impacts is increasingly recognized in policy circles. During
the European Council meeting in December 2019, President von der Leyen stated that “Portugal
is one of the countries most affected by climate change”. The Intergovernmental Panel on
Climate Change (IPCC) has reported that southern Europe has experienced increases in
temperature and decreases in precipitation as a result of climate change. In addition, in the
Mediterranean region, increases in drought frequency and magnitude are projected to be
substantially larger at 2°C than at 1.5°C of global warming. Sea level rise exacerbates risks in
coastal areas and stresses on land aggravate existing risks to livelihoods, biodiversity, human
and ecosystem health, infrastructure and food systems.

In Portugal, mean and extreme temperatures have increased in the past decades and are
projected to continue to do so. Under a scenario where global warming reaches about 4.3°C by
2100 (RCP8.5), maximum summer and autumn temperatures in Portugal increase by up to 8°C
and maximum spring and winter temperatures increase between 2°C and 4°C. Annual
precipitation has decreased and climate models project that this decrease will continue: under a
scenario where global warming reaches about 3°C by 2100 (RCP6.0), precipitation will
decrease by about 30% in the southern part and by about 15% in the northern part of the country.

Portugal is projected to be exposed to a more than 0.4m projected change in relative sea level
in the period 2081-2100 compared with 1986-2005 under a scenario where global warming
reaches about 2.5°C by 2100 (RCP4.5). This will result in flooding and coastal erosion. Severe
heatwaves, storms and droughts have already affected Portugal and will continue to do so, with
increasing frequency and intensity. Increases in extreme precipitation are expected mainly over
north-eastern Portugal in winter and spring. Wildfires are, furthermore, occurring more
frequently and on a greater scale than originally expected. Relative to other Mediterranean
countries, Portugal is the country which has suffered by far the most from forest fires: during
the last 30 years, 35% of the region’s fire incidents and 39% of the area affected each year were
located in Portugal.

These impacts will have sectoral consequences. In the agricultural sector, drought stress is
largely responsible for yield gaps. A reduction in crop productivity together with increasing
water demand for irrigation are projected. Forest ecosystems will move towards higher altitudes
and latitudes and will be exposed to higher fire risks. The Portuguese economy will also be
affected as flows in tourism shift and climate-related hazards increase. The Portuguese wine
industry is and will continue to be affected by climate change and olive trees are also at great
risk. Negative economic impacts from climate change will also be felt in the fishing sector.
Labour productivity will also be affected by heat stress as many work hours are lost due to
rising temperatures. Under a scenario where global warming increases by about 4.3°C by 2100
(RCP8.5), southern Europe, including Portugal, will experience a widespread loss of working
hours by at least 15% by the end of the century. Southern Europe’s Gross Domestic Product
(GDP) is also predicted to decrease by about 2.78% if global warming rises to 3°C. Under a
scenario where global warming increases by about 4.3°C by 2100 the GDP per capita of
Portugal is projected to decrease by up to 7.75%.

www.climateanalytics.org                                                                       2
Climate change impacts also affect human health and lead to fatal illnesses: increasing
temperatures cause heat stress and increasing death rates from respiratory diseases. Young
children and ageing populations are particularly vulnerable to heat waves and the mortality rates
from these extremes will likely increase. Climate change also has a detrimental impact on air
quality which in turn has consequences for human health. Long-term exposure to reduced air
quality increases premature mortality rates by causing greater instances of illnesses such as lung
cancer and cardiopulmonary disease. Ozone (O3) is a harmful air pollutant which is sensitive to
changes in weather conditions such as those caused by climate change; climate change will lead
to an increase in human exposure to ozone. Climate change also increase the risk of spread of
vector-borne diseases, which have decreased over recent decades. For example, climate change
stands to significantly increase the number of days in Portugal with temperatures suitable for
the survival of malaria vectors. Globally 88% of the existing burden of diseases caused by
climate change is, furthermore, carried by children under the age of five.

Table 1 shows some projected impacts of climate change in key sectors in Portugal.

Table 1: Projected impacts of climate change in key sectors in Portugal. The data refers to the impacts which are
projected to materialize under various global warming scenarios by the end of the century (for example, sea level
rise in Cascais will reach 0.9m under a scenario where global warming reaches about 4.3°C by 2100), except for
the data on water deficits in southern Portugal in April-June and on the annual maize yield reduction rate, which
refers to impacts projected to materialize during the period 2061-2080 (under a scenario where warming reaches
about 2.5°C in 2100 (RCP4.5), the maize yield will reduce by 10% in the period 2061-2080 compared to the baseline
period of 1986-2005). All the data and sources can be found in this report.

Under current emission trajectories, Portuguese children will spend more than half their lives
in a world warmer than 1.5°C above pre-industrial levels.

2. IPCC summary on climate impacts in Portugal
The Fifth Assessment Report (AR5) of the IPCC (2014) states that projected increases in
temperature throughout Europe and decreasing precipitation in southern Europe are to be

www.climateanalytics.org                                                                                       3
expected with increasing global warming. Climate projections show a marked increase in high
temperature extremes (high confidence), meteorological droughts (medium confidence), and
heavy precipitation events (high confidence). Climate change is very likely to increase the
frequency and intensity of heat waves, particularly in southern Europe (high confidence). This
region is particularly vulnerable to climate change (high confidence), as multiple sectors will
be adversely affected (tourism, agriculture, forestry, infrastructure, energy, population health)
(high confidence). Climate change and sea level rise may damage European cultural heritage,
including buildings, local industries, landscapes, archaeological sites, and iconic places
(medium confidence), and some cultural landscapes may be lost forever (low confidence).
Climate change has affected both human health (from increased heat waves) (medium
confidence) and animal health (changes in infectious diseases) (high confidence). Climate
change will increase the likelihood of systemic failures across European countries caused by
extreme climate events affecting multiple sectors (medium confidence). Climate change is
expected to impede economic activity in southern Europe more than in other sub-regions
(medium confidence).

The IPCC special report on the impacts of global warming of 1.5°C (Ove Hoegh-Guldberg et
al., 2018) emphasizes that limiting global warming to 1.5°C is expected to substantially reduce
the probability of extreme drought, precipitation deficits, and risks associated with water
availability (i.e. water stress) in some regions (medium confidence). In particular, risks
associated with increases in drought frequency and magnitude are projected to be substantially
larger at 2°C than at 1.5°C in the Mediterranean region (including southern Europe, northern
Africa and the Middle East) and southern Africa (medium confidence).

In its special report on the ocean and cryosphere in a changing climate (IPCC, 2019a), the IPCC
states that global mean sea level is rising, with acceleration in recent decades due to increasing
rates of ice loss from the Greenland and Antarctic ice sheets (very high confidence), as well as
continued glacier mass loss and ocean thermal expansion. Sea level continues to rise at an
increasing rate (very high confidence), exacerbating risks in coastal areas. It also finds that since
about 1950, many marine species have undergone shifts in geographical range and seasonal
activities (high confidence), and that warming-induced species range expansions have led to
altered ecosystem structure and functioning such as in the North Atlantic, Northeast Pacific and
Arctic (medium confidence). A decrease in global biomass of marine animal communities, their
production, and fisheries catch potential, and a shift in species composition are projected over
the 21st century in ocean ecosystems from the surface to the deep seafloor under all emission
scenarios (medium confidence).

The IPCC’s special report on climate change and land (IPCC, 2019b) explains that climate
change creates additional stresses on land, exacerbating existing risks to livelihoods,
biodiversity, human and ecosystem health, infrastructure, and food systems (high confidence).
In addition, with increasing warming, the frequency, intensity and duration of heat-related
events including heatwaves are projected to continue to increase throughout the 21st century
(high confidence). Frequency and intensity of droughts has increased in some regions including
the Mediterranean (medium confidence) and there has been an increase in the intensity of heavy
precipitation events at a global scale (medium confidence), impacting food security and
terrestrial ecosystems as well as contributing to desertification and land degradation (high
confidence). Furthermore, the Mediterranean, among other regions, may be increasingly
affected by wildfire (very high confidence).

www.climateanalytics.org                                                                           4
3. Technical note: Representative Concentration Pathways, climate
impacts analysis and projected temperature warming

Representative Concentration Pathways

A scenario is a plausible description of how the future may develop, based on assumptions
about key forces which drive climate change and the relationships between them (IPCC,
2014b). A Representative Concentration Pathway (RCP) is a suite of scenarios based on
possible future emissions trajectories and concentrations of greenhouse gases, aerosols and land
use (Moss et al., 2008).

The IPCC and the climate modelling community use four different RCPs (RCP 2.6, 4.5, 6.0,
8.5) (Moss et al., 2010), including when assessing the likely impacts of climate change under
different scenarios. An approximation of the range of increases in the global average
temperature by 2100 (in comparison to pre-industrial times) is associated with each of these
RCPs. These ranges reflect the considerable uncertainty surrounding the response of the climate
system to anthropogenic greenhouse gas emissions (which in turn stems from uncertainties
relating to feedback processes in the earth system). The IPCC AR5 report estimates the transient
climate response to cumulative CO2 emissions to be between 0.2-0.7°C per 1000 Gt CO2.

Table 2 shows (in square brackets) the “likely” range of temperature increases associated with
each RCP, as assessed in the IPCC AR5. This means that, for each RCP, there is a 66%
probability of warming falling within the range associated with that RCP. This leaves a non-
negligible 17% chance of warming exceeding that range. The median (best estimate) projected
temperature increase associated with each RCP, again as assessed in the IPCC’s AR5, is also
provided in Table 2.

 Name                                                 Expected temperature increase over the
                                                      2081-2100 period (median and [66%
                                                      range])
 RCP2.6                                                          1.6°C [0.9-2.3°C]
 RCP4.5                                                          2.4°C [1.7-3.2°C]
 RCP6.0                                                          2.8°C [2.0-3.7°C]

 RCP8.5                                                              4.3°C [3.2-5.6°C]
Table 2: Warming under different Representative Concentration Pathways scenarios. The expected temperature
increases given for the period 2081-2100 assumes that 0.61°C of warming has occurred between 1986–2005.
Source: (Stocker et al., 2013)

www.climateanalytics.org                                                                                5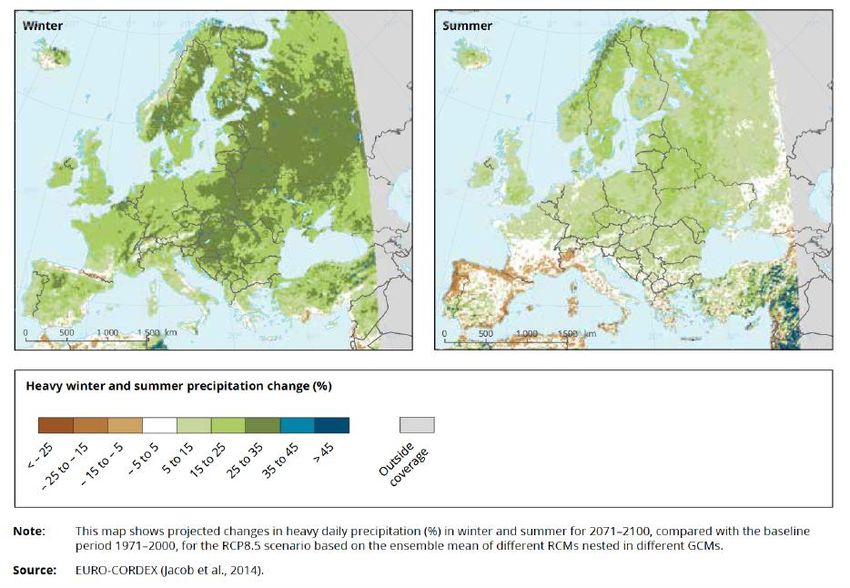
Climate change impacts analysis and RCPs

Substantial effort is required to provide climate and climate impact simulations. For this reason,
not all of the above RCPs are relied upon in equal measure in the scientific studies which seek
to generate different types of climate impact simulations. Many studies in climate research use
a subset of the RCPs (deploying either RCP8.5, RCP4.5 or RCP2.6 or several scenarios) and
hence do not provide estimates of impacts under all warming levels. The analysis which follows
draws on the available studies which analyse the impacts anticipated to result from climate
change in Portugal under various RCPs. The relevant RCPs will be referred to by reference to
the expected median temperature increase by 2100 associated with them (for example, RCP8.5
will be referred to as “a global warming scenario of about 4.3°C by 2100 (RCP8.5)”). For high
emission scenarios either RCP8.5 and RCP6.0 are used, while RCP2.6 is consistently used for
a low emission scenario.

Climate Action Tracker projections

The Climate Action Tracker provides best estimates of the emissions pathways and associated
warming trajectories throughout the 21st century which will result from both countries’
combined Nationally Determined Contributions under the Paris Agreement and their national
climate change mitigation policies if the same level of ambition was displayed over the course
of the 21st century. These are shown in Figure 1 below. In the case of “Pledges & Targets”
which have been adopted by governments to date, the temperature range provided reflects the
climate response uncertainty referred to above. In the case of “Current Policies,” the
temperature range provided reflects both climate response uncertainty as well as uncertainty
related to emissions pathways associated with government policies. Specifically, the Climate
Action Tracker evaluates two current policy pathways, high and low, to account for
uncertainties relating to the quantification of emissions reductions associated with current
government policies. For each of these high and low pathways, the climate response uncertainty
is reflected in the 66% likely temperature range which it produces, from which a median figure
is then derived. The median figure of 3.0°C provided for “Current Policies” is therefore the
average of the median temperatures of both the high and low current policy pathways. The
higher (4.1°C) and lower (2.3°C) end figures listed in relation to current policies range from
the 17% probability percentile of the lower pathway to the 83% probability percentile of the
high current policy pathway.

As Figure 1 makes clear, current policies are projected to lead to a median warming of about
3°C by 2100, while warming of 4°C by the end of the century is within the uncertainty range
under current policy projections. Furthermore, there is a non-negligible 17% probability of
warming exceeding 4.1°C by the end of the century under emissions projections derived from
current policies (high estimate). There is therefore a significant overlap between the warming
range projected to result from current policies and the warming range of 3.2-5.6°C associated
with the RCP8.5 scenario. Accordingly, based on current mitigation policies globally, climate
impacts occurring under a RCP8.5 scenario cannot be excluded as a distinct possibility. It is
important to note in this context that recent studies which indicate a refined range of warming
estimates with lower probabilities for extreme warming outcomes (Sherwood et al., 2020) do
not fundamentally affect this assessment.

Finally, following the best estimate of the future temperature trajectory based on the Climate
Action Tracker, the global mean temperature will exceed 1.5°C around the year 2035 (model

www.climateanalytics.org                                                                        6
median) and 2°C around the year 2055; by 2100 it will have exceeded 3°C in 2100 (Climate
Action Tracker, 2018). Today’s average Portuguese 14-year old is expected to live until the age
of 91 and has a 99% probability of being alive in 2035, 98% in 2055 and 16% in 2100 (World
Data Lab, 2019).

Figure 1: Climate Action Tracker warming projections. Warming is shown for three different assumptions about
future warming differentiating between targets of countries and actual policies in place to meet those targets.
Source: (Climate Action Tracker , 2019)

4. Temperature increase
Portugal has a Mediterranean climate characterized by warm and dry summers and cool and
wet winters (Carvalho et al., 2014). The vulnerability of Portugal to present day climate
variability is well established (Gomes et al., 2018). Portugal has experienced a rise in mean
temperatures accompanied by intensifying extremely high temperatures (Cardoso et al., 2019).
Furthermore, eight of Portugal’s 10 warmest years on record have been recorded in the last 20
years (Carvalho et al., 2014). Figure 2 shows the historical mean annual temperature for
Portugal between 1971-2000.

www.climateanalytics.org                                                                                      7
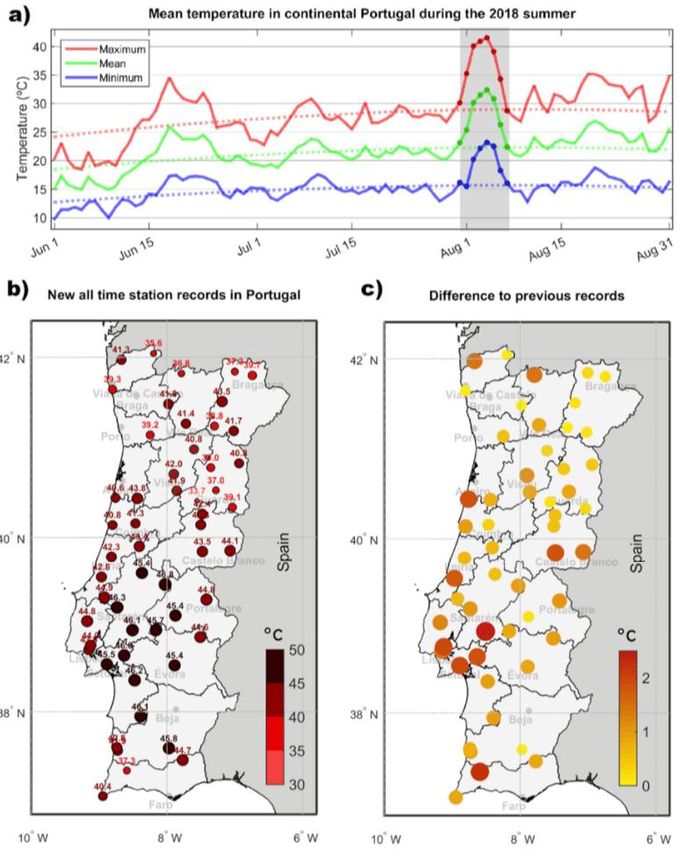
Figure 2: Modelled historical mean annual temperature for mainland Portugal (1971-2000) (derived from:
http://portaldoclima.pt/en/)

Multi-model ensembles project a “significant increase of the maximum and minimum
temperatures in all seasons and scenarios” (Cardoso et al., 2019). Under a global warming
scenario of 4.3°C by 2100 (RCP8.5), maximum summer and autumn temperatures in Portugal
increase by up to 8°C and maximum spring and winter temperatures increase between 2°C and
4°C (Cardoso et al., 2019). The same scenario projects that the mean daily maximum
temperature increase by up to 4.5°C in some inland regions, and between 3 and 4°C near the
coasts (Cardoso et al., 2019). For summer specifically, the mean daily maximum temperatures
could increase by 3°C near the coast and by up to more than 8°C in large areas inland. Moreover,
half of the extended summer months (May, June, July, August, September) will experience
maximum temperatures exceeding the historical 90th percentile. These months are also
projected to experience 60 tropical nights per year in contrast with the 7 tropical nights per year
which would have been typical in the historical period (Cardoso et al., 2019). In general, under
a global warming scenario of about 4.3°C by 2100 (RCP8.5), temperatures in Portugal will
almost never drop below 2°C, whereas temperatures above 40°C will be much more common
(Cardoso et al., 2019).

www.climateanalytics.org                                                                                 8
Figure 3: Climate change signal for daily temperatures (a) maximum, and (b) minimum, (2071-2100 minus
1971-2000) for a global warming scenario of 2.5°C (RCP4.5) and 4.3°C by 2100 (RCP8.5) (Cardoso et al., 2019).

5. Precipitation
Portugal is one of the countries with the largest spatial precipitation gradients, from the north-
western region, which is directly affected by the passage of Atlantic storms, to the drier southern
regions (Soares et al., 2015). Migratory storms are responsible for most of the annual
precipitation between November and April. According to Carvalho et al., “In the period 1902–
2010, the region has experienced 10 of the 12 driest winter seasons in the last 20 years“
(Carvalho et al., 2014). In total, annual precipitation has decreased by 90mm per decade in
Portugal (Füssel et al., 2017).

www.climateanalytics.org                                                                                        9
Figure 4: Present (blue) and future (light blue) monthly mean precipitation for the six basins of Portugal
(Ensemble of 5 regional climate models for a A1B-scenario (RCP6.0 – global warming of 2.8°C by 2100)) (Soares
et al., 2015).

A future global warming scenario of 2.8°C by 2100 (RCP6.0), would lead to an annual
precipitation decrease of 15% in the northern part of the country, and 30% in the south (Soares
et al., 2015). These precipitation decreases have a sharp seasonal dependency, as values above
50% occur in some places in summer, while they are only at 20-30% in autumn and spring and
there is only a very small decrease or even a slight increase in winter (Soares et al., 2015).
Expected precipitation changes for 6 water basins in Portugal can be seen in more detail in
Figure 4, where the light blue bars indicate the future monthly mean precipitation under a global
warming scenario of 2.8°C (RCP6.0).

In general, southern Europe is expected to experience an overall decrease in total precipitation,
an increase in heavy precipitation events and a significant increase in the length of dry spells
(Hov et al., 2013). The projected increase in heavy precipitation in winter over Portugal and
Europe is illustrated in Figure 5. The decrease in overall precipitation leads to a reduction in
soil moisture; this leads to greater availability of sensible heat flux which in turn heats the
atmosphere (Cardoso et al., 2019).

www.climateanalytics.org                                                                                   10
Figure 5: Projected changes in heavy precipitation in winter and summer (Füssel et al., 2017).

6. Sea level rise
Mean and extreme sea levels have increased globally and along most coasts in Europe (Füssel
et al., 2017). Currently, the global mean sea level is about 20 cm higher than at the beginning
of the 20th century (European Environment Agency, 2017). In Portugal, estuaries and coastal
lagoons will be the coastal areas most affected by sea-level rise (Ferreira et al., 2008). Amongst
these, the Sado and Tagus estuaries, and the Ria de Aveiro and the Ria Formosa coastal lagoons
are the ones where socio-economic impacts resulting from sea-level rise will likely be greater
(Ferreira et al., 2008).

Figure 6 shows the projected change in relative sea level in Europe.

www.climateanalytics.org                                                                         11
Figure 6: Projected change in relative sea level in Europe in the period 2081-2100 compared with 1986-2005 for
a scenario of 2.5°C expected temperature rise by 2100 (RCP4.5) from (Füssel et al., 2017)

Figure 7 shows the projections for the tide gauge station of Cascais, around 40 kms west of
Lisbon.

Figure 7: Local sea level projections for Cascais (located in south central Portugal close to Lisbon) for a scenario
compatible with the Paris Agreement (green), a scenario leading to +2.5°C global mean temperature (orange)
and a scenario exceeding +4°C (red). The solid lines represent multi-model medians, the shaded areas include
66% of the models (retrieved from http://localslr.climateanalytics.org/location/Cascais)

www.climateanalytics.org                                                                                          12
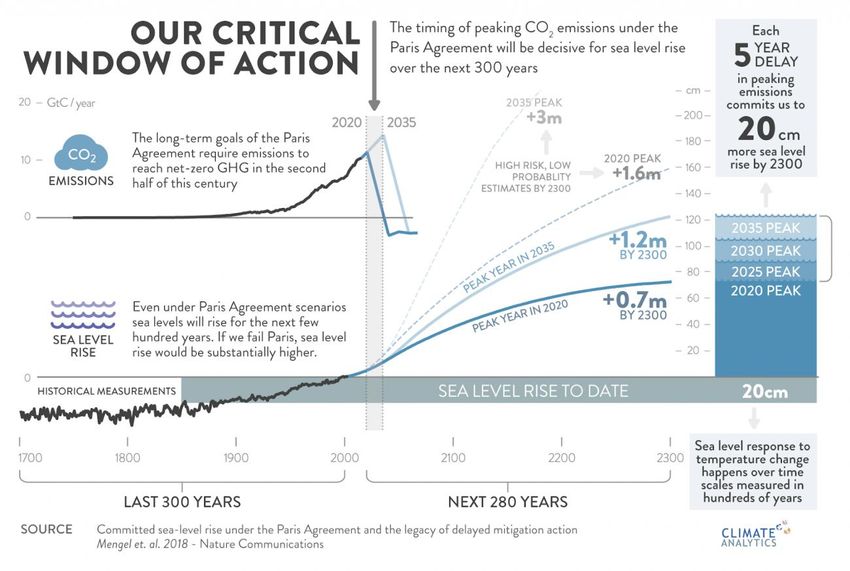
A recent study by Mengel et al. (2018) analyses the relationship between near term emissions
reduction compatible with the Paris Agreement and sea level rise. As illustrated in Figure 8, the
timing of mitigation actions matters for long-term sea level rise. Every 5 year delay in peaking
global CO2 emissions will lead to an additional 20 cm sea level rise by 2300, about as much as
observed sea level rise since the pre-industrial times. This represents a long-term commitment
that cannot be reversed.
Future generations well beyond today’s children will therefore be affected by short-term actions
and decisions taken today (Mengel et al. 2018). For higher emission scenarios, reaching 2°C,
3°C or even >4°C, much higher levels of sea level rise, up to many meters, can be expected
over the coming centuries. The emissions implied by the current combined Nationally
Determined Contributions of States under the Paris Agreement are projected to lead a long-
term sea-level rise of well above 5m within this millennium (Clark et al., 2018)

Figure 8: Critical window of action for sea level rise over the next 300 years

In addition to sea level rise, coastal conditions are already endangered by flooding and erosion,
both of which are likely to increase as a result of climate change (Coelho et al., 2009; Hov et
al., 2013). The increase in the occurrence of extreme weather events, the weakening of river-
sediment supplies and the acceleration of sea level rise aggravate coastal erosion (Coelho et al.,
2009). This puts the Portuguese continental coast (where erosion is already significant along
about 67% of its length) at greater risk of inundation and land loss due to sea level rise (Carvalho
et al., 2014). Currently, the shoreline of Portugal is retreating at an annual average of 9 meters
in some locations as a result of weakening river sediment supplies because of dams and
embankments (Hov et al., 2013). Based on the current state of coastal erosion along the
northwest Portuguese coast, the anticipated sea level rise resulting from climate change should

www.climateanalytics.org                                                                         13
have a significant effect in 2050-2100 on the already high sedimentary deficit (Silva et al.,
2007).

7. Extreme weather events
The observations show a tendency towards more frequent and intense extreme weather events,
in particular heat waves, droughts and extreme precipitation (Carvalho et al., 2014). The
Mediterranean region, and specifically Portugal, is regarded as a climate hotspot, which is,
among other impacts, projected to experience the greatest drying among 26 regions across the
globe (Carvalho et al., 2014).

7.1 Heat waves

Portugal and the wider Mediterranean region have experienced an increase in the frequency of
heatwaves (Hov et al., 2013). Between 1981-2010 a total of 130 heat waves occurred in the
mainland of Portugal during the dryer and hotter periods (between May and October) (Parente
et al., 2018). 60% of the total number of these heat waves occurred in July and August (Parente
et al., 2018). The areas with the most heatwaves were the north-east quarter and the
southernmost region of Portugal (Parente et al., 2018). Also affected, but to a lesser extent and
magnitude, were the central western coastal region and the metropolitan areas of Porto and
Lisbon (Parente et al., 2018).

A study from 2011 on Portugal shows that there has been a significant positive trend in heat
waves, tropical nights, summer days, warm spells and warm nights and days since 1976 (Ramos
et al., 2011). This study observed a simultaneous negative trend in cold extremes, particularly
in winter (Ramos et al., 2011). In 2017, a European heat wave and heat stress led to extreme
forest fires across Europe including Portugal leading to the evacuation of thousands of people
(Vitolo et al., 2019). During the following summer of 2018, all-time records were broken in
Portugal, where unprecedented absolute temperatures were recorded. In August 2018, western
Iberia (including Portugal) reached values beyond 45°C (Sousa et al., 2019). Figure 9 displays
the temperatures during the summer of 2018, the new all-time temperature records and the
difference between the observed maximum temperatures and the previous all-time temperature
records. For example, in the area of Lisbon, it can be observed that the previous record of 42°C
(established during August 2003) was surpassed by 2°C, setting a new absolute value of 44°C
(Sousa et al., 2019). This heat event was followed by another major heat wave in June 2019,
where in regions of eastern Iberia (including Spain and parts of Portugal) absolute temperature
records were broken again (Sousa et al., 2019). These increasing trends are directly attributable
to general mean warming trends (Parente et al., 2018)

www.climateanalytics.org                                                                      14
Figure 9: (a) Evolution of mean temperature in Portugal throughout the 2018 summer (thick lines), compared
with the climatological mean (stippled lines), (b) New all-time temperature records established during early
August 2018, (c) Difference between the observed maximum temperatures during the event and the previous
all-time records (Sousa et al., 2019).

www.climateanalytics.org                                                                                       15
Figure 10: Monthly distribution of heat wave number (HWN90) and mean heat wave amplitude (MeanHWA90)
for control period (1981-2010) (Parente et al., 2018).

The two-week heat wave event in August 2003 counts as the warmest August on record for the
country in terms of mean air temperature (Sousa et al., 2019). Moreover, it is counted as one of
the 10 costliest natural catastrophes in Europe between 1980 and 2010 (Hov et al., 2013).
During this event, a total of 12,300 million Euro was lost and 70,000 fatalities were recorded
(Hov et al., 2013).

Figure 11: Number of hot days per year with maximum temperature above 35°C (summer days) for the (a)
1961-1990 climatology; (b) HadRM2 control simulations (model simulations aiming to reproduce the
climatology of 1961-1990. A control run shows how well a model performs and how reliable the information is
for future projections); (c) HadRM2 simulation (2081-2100) (Carvalho et al., 2014).

The frequency and severity of heat waves will progressively increase with global warming,
accompanied by a gradual decline in the intensity and frequency of extreme cold spells. Multi-
model ensembles project that the yearly average number of heat waves increases by 7 to 9-fold
by 2100 under a global warming scenario of 4.3°C (RCP8.5) (Cardoso et al., 2019). Under the
same scenario, the average length of such heat waves increases from 5 to 22 days throughout

www.climateanalytics.org                                                                                  16
the 21st century, with 5% of the longest events being more than 30 days in duration; it is also
projected that in the time period 2071-2100, heat waves will cover the entire country at least 3
times per year (Cardoso et al., 2019). According to another study, in a 3°C warmer climate
compared to pre-industrial times, a current 1-in-50-year heatwave may occur almost annually
in parts of Portugal. On the other hand, the strongest absolute reductions in exposure to cold
extremes are projected for southern and northern European countries, including Portugal, which
is projected to experience the fourth largest reduction in Europe (-93% of exposure) under a
3°C warming (Naumann et al., 2020)

This increase in heat will lead to dangerous conditions which are more conducive to the
outbreak of wild fires, as outlined in the following section.

Figure 12: Projected (a) average number of heat waves and (b) average length of heat waves for end of the 21st
century under a global warming scenarios of 2.5°C (RCP4.5) and 4.3°C (RCP8.5) (Cardoso et al., 2019).

7.2 Wild fires

Extensive forest fires have already taken a very high toll in Portugal (European Commission,
2019). Between 1966 and 2017 around 160 major wildfires and heat waves occurred in Europe,
which together caused 140,000 deaths (Vitolo et al., 2019). Wildfires are also extremely
financially costly. The 6 largest wildfires in Europe (Spain, Portugal, Croatia and Montenegro)
resulted in damage costing up to 732 Million US Dollars (Vitolo et al., 2019). Portugal is the
Mediterranean country which has suffered by far the most from forest fires: during the last 30
years, 35% of the region’s fire incidents and 39% of the area affected each year were located
in Portugal. On average, 3% of Portugal’s forests burn annually (Hernández, 2019).

The factors that favour the occurrence of heat waves, namely, reduced precipitation, drought
and intense hot spells, are also the main drivers of wildfires (Parente et al., 2018). The regions
which have experienced the most heatwaves in Portugal in modern times, namely the southwest
and northeast, are precisely those regions where most of the wildfires have occurred (Parente
et al., 2018). It has been shown that all of the wildfires which occurred in these regions did so
during (96.8%) or immediately after (3.2%) long heatwaves (Parente et al., 2018). During the
heat wave in 2003, about 390,000 hectares of forests in Portugal were destroyed by fire, which

www.climateanalytics.org                                                                                   17
amounts to 60% of the total area burnt throughout Europe during that heatwave (Parente et al.,
2018).

Figure 13: Spatial and temporal distribution of extreme wildfires (burnt area > 5,000 ha) between 1981 and
2010 (Parente et al., 2018).

During the extreme wildfires of 2017, a record 500,000 hectares were burned in Portugal and
120 human lives were lost (Turco et al., 2019). The prior heat wave event was started by an
intrusion of warm air, resulting from the subtropical ridge, of a kind which had never previously
been seen as early as June (Turco et al., 2019). The circumstances of anomalous high
temperatures and relatively low humidity strengthened the local fires (Turco et al., 2019). The
fires that happened later that year in October, however, were exacerbated by strong and
persistent southerly winds caused by hurricane Ophelia moving northward. These winds,
together with the dry soil and vegetation resulting from extremely high temperatures in 2017,
exacerbated the extreme fires (Turco et al., 2019).

The total area affected by forest fires has decreased in recent years in almost all Mediterranean
countries due to a general increase in the effectiveness of firefighting mechanisms and a
reduction in the total number of incidents. The opposite is true in Portugal, however, where the
burnt area has continued to grow, as Figure 14 demonstrates (Hernández, 2019).

www.climateanalytics.org                                                                                     18
Figure 14: Trends in the total area affected (ha) per decade and per country (Hernández, 2019).

Increasing temperatures and reduced precipitation leads to a significant decrease in the amount
of soil moisture (Nunes et al., 2019), causing an increased fire risk (Turco et al., 2019). Future
warming will therefore increase the number, duration and amplitude of heat waves and thus
wildfires (especially in the north-east region) (Parente et al., 2018). Indeed, according to a
World Wildlife Fund report on Mediterranean fires, climate change is accelerating and
intensifying the occurrence of large fires at a faster pace than originally expected (Hernández,
2019). The IPCC’s special report on climate change and land further indicates that the risk of
wildfires in future is expected to increase significantly in some regions including Southern
Europe (Jia et al., 2019). Figure 15, which is drawn from that report, demonstrates how Portugal
is projected to remain a particularly fire prone region under both of the scenarios on which that
figure is based.

www.climateanalytics.org                                                                          19
Figure 15: The probability of low-fire regions becoming fire prone (positive values), or of fire-prone areas
changing to a low fire state (negative values) between 1971-2000 and 2071-2100. The data is based on eight-
Earth system model ensembles, two Shared Socio-economic Pathways (SSPs) and two Representative
Concentration Pathways (RCPs). Light grey: area where at least one ensemble simulation predicts a positive
and one negative change (lack of agreement). Dark grey: area with >50% past or future cropland. Fire-prone
areas are defined as having a fire frequency of >0.01 yr-1, (a) RCP4.5 emissions with SSP3 demographics, and
(b) RCP8.5 emissions with SSP5 demographics. (Jia et al., 2019)

Figures 16, 17 and 18 illustrate the projected rise, over the period 2071-2100, in the number of
days on which there will be an extreme risk of wildfire in the Lisbon metropolitan area, the
Centro region and the Alentejo region, under a global warming scenario of 4.3°C by 2100
(RCP8.5). The mean number of such days rises to 50 per year by 2100 in the Lisbon
metropolitan area, up from 20 in 2000.

Figure 16: Annual evolution of extreme risk to wildfires in the metropolitan area of Lisbon for a global warming
scenario of 4.3°C by 2100 (RCP8.5) for 2071-2100 (derived from http://portaxldoclima.pt/en/).

www.climateanalytics.org                                                                                      20
In the Centro region, that number rises to nearly 40 days per year by 2100 up from 6 in 2000.

Figure 17: Extreme fire risk projections for the Centro region of Portugal for scenarios of 4.3°C of expected
temperature increase by 2100 (RCP8.5) (retrieved from: http://portaldoclima.pt/en/)

For the Alentejo region, the mean number of days on which there is an extreme risk of wildfire
will rise to 80 days per year in 2100 compared to 20 days per year in 2000.

Figure 18: Annual evolution of extreme risk to wildfires in the area of Alentejo for a global warming scenario of
4.3°C by 2100 (RCP8.5) for 2071-2100 (derived from http://portaldoclima.pt/en/).

Figure19 further demonstrates that in the part of the Alentejo region which is closest to the
Spanish border, the number of such days rises to 90 days per year (compared to 22 days in
2000), again under a global warming scenario of 4.3°C by 2100 (RCP8.5).

www.climateanalytics.org                                                                                        21
Figure 19: Days (0-90) of extreme risk to wildfires per year in the area of Alentejo for a global warming scenario
of 4.3°C by 2100 (RCP8.5) as a mean for the time period 2071-2100 (derived from http://portaldoclima.pt/en/).

7.3 Droughts

The south of Portugal, in particular, is prone to the occurrence of regular drought episodes (Dias
et al., 2018).

www.climateanalytics.org                                                                                       22
Figure 20: Six decades of annual precipitation anomalies estimated by the standardised precipitation index (SPI)
for mainland Portugal, regarding the reference period of 1970-2000. Major drought events are highlighted: red
– extreme; yellow – moderate or severe (Dias et al., 2018).

The mainland of Portugal has experienced severe droughts over the past 30 years – especially
in the years 2004-2005, 2011-2012 and 2017-2019 (Carvalho et al., 2014; Sousa et al., 2019).
2005 was the driest year in the last 78 years, followed by 2007 and 2004 (Carvalho et al., 2014).
The 2005 droughts affected 100% of mainland Portugal, and had strong impacts on different
socioeconomic and environmental sectors (Dias et al., 2018). By the end of the hydrological
year of 2005, 97% of Portugal was still in severe or extreme drought (Dias et al., 2018). Already
36% of the Portuguese continental territory is affected by desertification (Carvalho et al., 2014).

As climate change models predict a drier climate in Portugal with longer summers and shorter
rainy seasons, increasing temperatures and decreasing precipitation, droughts will be a more
common problem (Dias et al., 2018). Moreover, drought can lead to seawater intrusion in the
south due to lower recharge (Dias et al., 2018).

7.4 Storms

The Atlantic coast of Portugal is exposed to very energetic waves generated along the north
Atlantic, which also constitute the dominant coastal hazard component (Vousdoukas et al.,
2016). Extreme short-term events like coastal storms have become more intense and frequent
and constitute a threat for coastal environments in Portugal, mostly during winter periods
(Gomes et al., 2018).

During such storms, wave heights reach up to 9 metres and these conditions persist for as long
as five days (Carmo, 2017). Significant storms include Rafael in 2012, Hercules and Stephanie
in 2014, and Joaquin in 2015. Due to the increasing urbanization in coastal areas, there has been
considerable degradation of natural protection systems (Carmo, 2017). Figure 21 shows a
significant increase in the number of storms since 1930 and a linear growth starting in the mid-
1990s (Carmo, 2017).

www.climateanalytics.org                                                                                     23
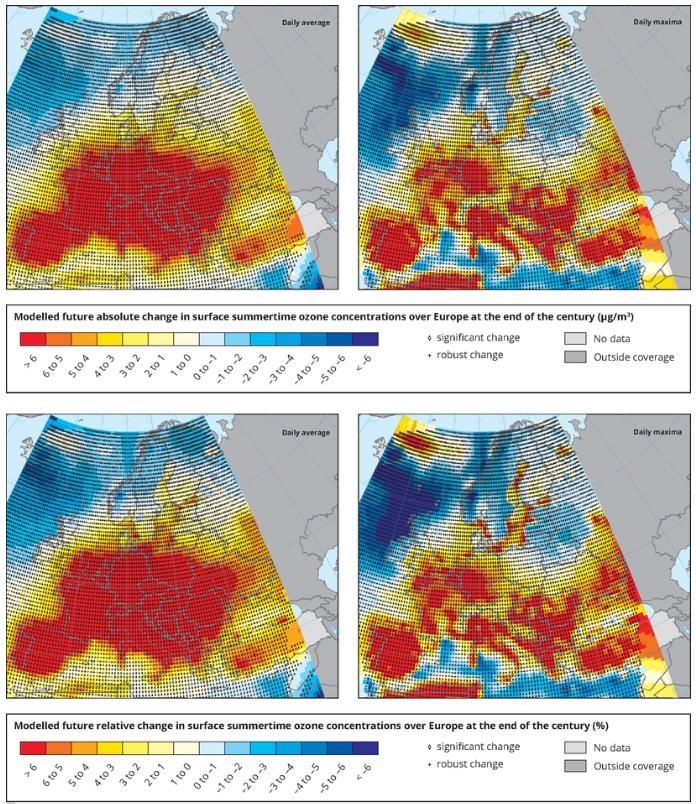
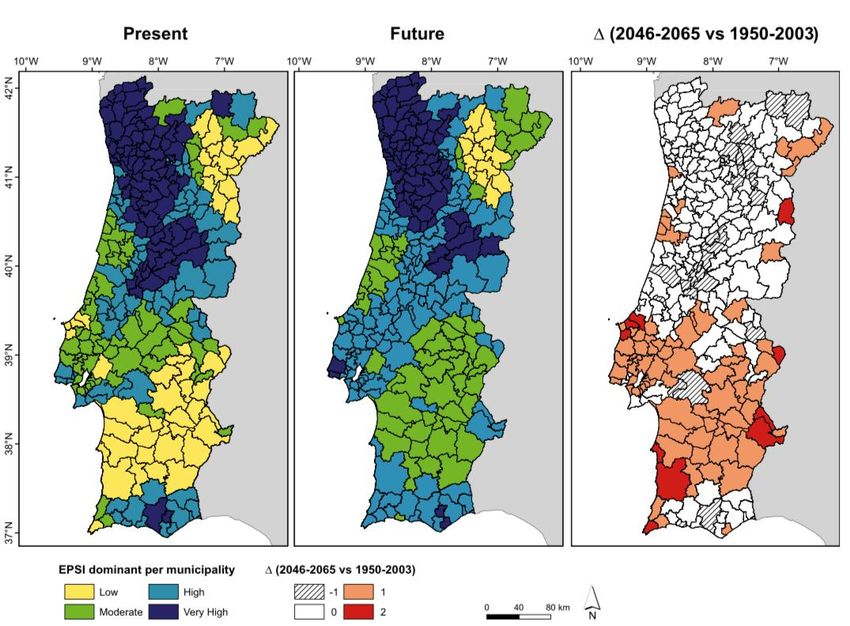
Figure 21: Number of named storms and hurricanes in the Atlantic Ocean per year between 1851 and 2010
(Carmo, 2017).

On the north-western coast of Portugal, the Minho, Lima, Cávado, and Douro estuaries are
vulnerable to the impacts of climate change, such as coastal storms and sea level rise (Gomes
et al., 2018). Very low-lying coastal areas, where river deltas and estuaries coincide are among
the most vulnerable areas. Other coastal locations are also vulnerable to extreme weather events
and in particular coastal storms which can induce significant storm surges that lead to coastal
erosion (Gomes et al., 2018). During winter months, the coast is affected by heavy swells
approximately 30% of the time (Gomes et al., 2018). As the temperatures of the sea surface are
projected to increase, the frequency of severe winds and a shift in the projected season of storm
occurrences could be observed (Gomes et al., 2018).

7.5 Heavy precipitation

The projected reduction in mean annual precipitation that was described in section 5 is
accompanied by a significant increase in precipitation extremes (Soares et al., 2015). Extreme
precipitation is one of the main triggers of natural disasters, such as urban inundations, soil
erosion, crop destruction and flash floods (Santos et al., 2019). Figure 22 shows an index of
extreme precipitation susceptibility (EPSI) over Portugal (susceptibility refers to the probability
of any given region being affected by a precipitation-driven disaster given a set of conditions).
For the current time span it is clear that more than 60% of Portuguese municipalities have a
very high or high EPSI ranking (Santos et al., 2019).

Increases in extreme precipitation are expected mainly over north-eastern Portugal in winter
and spring (Santos et al., 2019). For the time period 2046-2065 there is a projected increase in
susceptibility for 29% of the municipalities – meaning that 74% of them are classified with high
or very high extreme precipitation susceptibility under a global warming scenario of 4.3°C by
2100 (RCP8.5).

www.climateanalytics.org                                                                                24
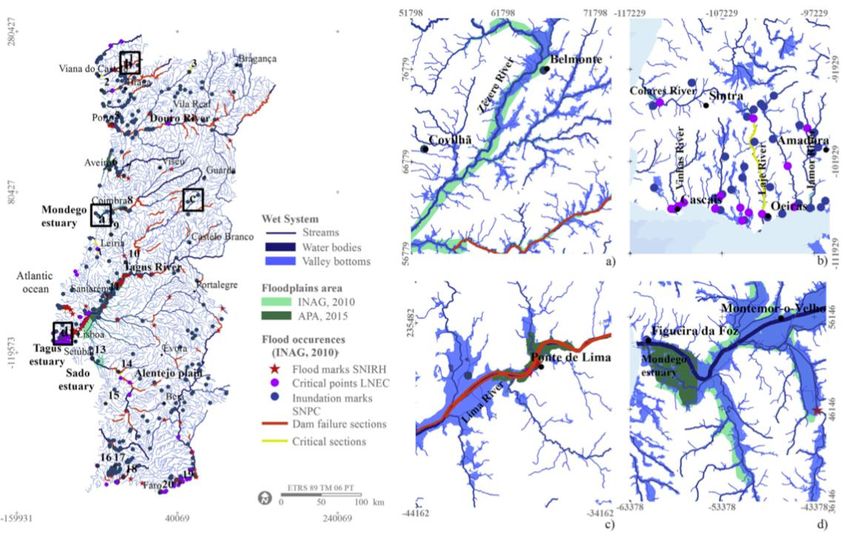
Figure 22: Present (1950-2003), future (2046-2065) and the difference between the two time periods of the
dominant extreme susceptibility index (EPSI) in mainland Portugal, aggregated by municipality. The
corresponding climate change signal (seven-member ensemble mean for 2046-2065 minus 1950-2003) is
measured by the difference in the class rank (under a global warming scenario of 4.3°C by 2100 (RCP8.5))
(Santos et al., 2019).

7.6 Floods

Between 1865 and 2010, floods in Portugal caused 1012 deaths, 478 injuries, the displacement
of 13,372 people and rendered 40,283 people homeless (Santos et al., 2017). 65% of these
fatalities were caused by flash floods, which for example occurred in 2012 on the Madeira
island or in 1967 in Lisbon (Santos et al., 2017). In Portugal, the cyclonic circulation weather
type is the weather type which is most like to give rise to flood occurrences, owing to the
transport of Atlantic air masses over the country. Floods are one of the major natural hazards
caused by climate change, that have implications over a broad range of socio-economic
activities.

Between 1900 and 2008, 82% of the hydro-geomorphological events were floods and 75.6% of
total flood cases took place between November and February (Cunha et al., 2017). “According
to the social consequences of floods, during the same period, from 1900 to 2008, the Tagus
hydrographic region registered 60% of the total of people made homeless or displaced by flash
floods in the Lisbon region” (Cunha et al., 2017). Douro, Mondego and Bouga river regions are
also affected by these consequences (Cunha et al., 2017). Figure 23 indicates the flood risk
areas and occurrences in mainland Portugal. An increase in the frequency and severity of
extreme precipitation could lead to increased flood risks, leading to monetary damages from
flooding. As described in section 7.5, heavy precipitation over the winter months is expected to
www.climateanalytics.org                                                                                    25
increase. The growing number of flood events worldwide have been considered by the IPCC as
a likely manifestation of climate change (Santos et al., 2017).

Figure 23: Flood risk areas and occurrences in mainland Portugal. A) Zezere River; b) Colares, Vinhas, Lage and
Jamor rivers in the north of Lisbon metropolitan area; c) Ponte de Lima urban area; d) Mondego Estuary (Cunha
et al., 2017).

Apart from river flooding, coastal ecosystems are also among the most threatened by marine
hazards. Two-thirds of the population is still living in coastal floodplains with an increasing
trend, as 50% of the new urbanized areas are located within 20km of the coast (Cunha et al.,
2017). These regions are even more vulnerable to damages from flooding and storms,
aggravated by climate-induced sea level rise. A study by Roudier et al. (2015) showed that
Portugal will be one of the few European countries which will be most affected by extreme
coastal floods under a 2°C global warming scenario (Roudier et al., 2016).

Due to its coastal location at the mouth of the river Tagus, Lisbon is particularly vulnerable to
the impacts of climate change (Silva and Costa, 2017). Having land morphology which is
strongly impacted by the Tagus estuary dynamics (tides, storm surges, winds and undulation)
and fragile drainage infrastructure, Lisbon is often impacted by flooding (Silva and Costa,
2017). Such flooding is exacerbated by the increase in the average sea level, increased
precipitation as well as variations in atmospheric pressure and the consequent increase of storm
surge magnitudes (Silva and Costa, 2017). The increase in storm surges which Portugal is
projected to experience will threaten the Lisbon metropolitan area (Silva and Costa, 2017).
There is, furthermore, a high degree of confidence that flooding will increase and bring stronger
impacts and more severe damage to Lisbon by 2100 (Silva and Costa, 2017).

www.climateanalytics.org                                                                                    26
8. Sectoral impacts
Projections show that the increasing average temperature, the more frequent heat waves and the
very likely decrease in mean annual precipitation and intensification of droughts will have
significant adverse effects in various socioeconomic sectors in Portugal, such as water
resources, agriculture, forests, biodiversity, health, and tourism in Portugal (Carvalho et al.,
2014).

8.1 Agriculture

Climate change is projected to reduce crop productivity in large parts of southern Europe
(Füssel et al., 2017). Recent heat waves, droughts and floods have greatly reduced the yield of
some crops and the projected increase in the occurrence and intensity of such events will be
detrimental for crop production in southern Europe, especially, typical Mediterranean crops,
e.g. grapevine, durum wheat and olive; animals will also be exposed to increased heat stress
during summer (Füssel et al., 2017).

The changing climate condition over Portugal may reduce food production which would
increase pressure on water resources and cause food security risk (Rolim et al., 2017). There
will be increasing water demand for irrigation to maintain crop yield levels and several studies
indicate that water resources will become less available in southern Portugal (Rolim et al.,
2017). For example, the predicted maize yields show a continuous decrease from
10,081.3 kg ha−1 in the baseline to 9,029.9 kg ha−1 (−10%, for scenario of 2.5°C expected
temperature increase by 2100, RCP4.5, annual reduction rate of -20kg/ha/yr) and
8,410.6 kg ha−1 (−17%, for scenario of 4.3°C expected temperature increase by 2100, RCP8.5,
annual reduction rate of -28.9kg/ha/yr) for 2061–2080 (Yang et al., 2017). With regards to
wheat, projected climate change is likely to have an overall negative impact in Portugal on
mean wheat yield (−27% to −14%), primarily driven by intensified drought and heat stresses
during anthesis and grain-filling periods (Yang et al., 2019).

According to the IPCC’s special report on climate change and land, “Europe is increasingly
affected by desertification leading to significant consequences on land use, particularly in
Portugal, Spain, Italy, Greece, Malta, Cyprus, Bulgaria and Romania” (Mirzabaev et al., 2019,
p. 264).

A recent study by Yang et al. conducted in the Alentejo region found that drought stress is the
main limiting factor for potentially attainable wheat yields, representing a major source of yield
gaps in the region, i.e. 40–70% mean potential yield losses covering most of the area for all
sowing dates (Figure 24) (Yang et al., 2020). Several studies confirm that in southern Portugal,
water stress can occur with varying degrees of severity throughout the growing season (Rocha
et al., 2020; Yang et al., 2020, 2019). In April–June, in southern Portugal, water deficits are
projected to increase by 38mm (for scenarios of 2.5°C expected temperature increase by 2100,
RCP4.5) or 51mm (for scenarios of 4.3°C expected temperature increase by 2100, RCP8.5) for
2021–2050 and by 59mm (RCP4.5) or 90mm (RCP8.5) for 2051–2080, in addition to the mean
baseline climatic water deficit of 324 mm for April–June (Yang et al., 2019). Moreover, central
littoral and western coastal areas of Portugal are currently suffering particular pressure on green
freshwater resources. This is partly due to the decrease of evapotranspiration, which leads to
less green water available for land use (Quinteiro et al., 2019).

www.climateanalytics.org                                                                        27
Figure 24: Quantified and isolated impacts of main abiotic (drought and heat) stresses on potentially attainable
yields over 1986—2015 in Alentejo region without adaptations (simulations are performed under different
sowing dates: _10 means from the first to the tenth, _20 means from the eleventh to the twentieth, _30 means
from the twenty-first to the thirtieth). Quantified mean potential yield losses (%) for individual grids are the
average of yearly values over 1986—2015, resulting from either (a) seasonal water stress only (b) or solely from
extreme high temperature (≥38 °C) during grain-filling phase (Yang et al., 2020)

The Portuguese wine industry is and will continue to be affected by climate change, since grapes
are one of the most sensitive crops to small changes in climatic conditions. The proliferation of
microorganisms, the high pH and low acidity, the proliferation of new mycotoxins and increase
in biogenic amines content are some of the consequences of climate change that have a high
impact on wine development and fruit composition. Thus, some European regions, including

www.climateanalytics.org                                                                                     28
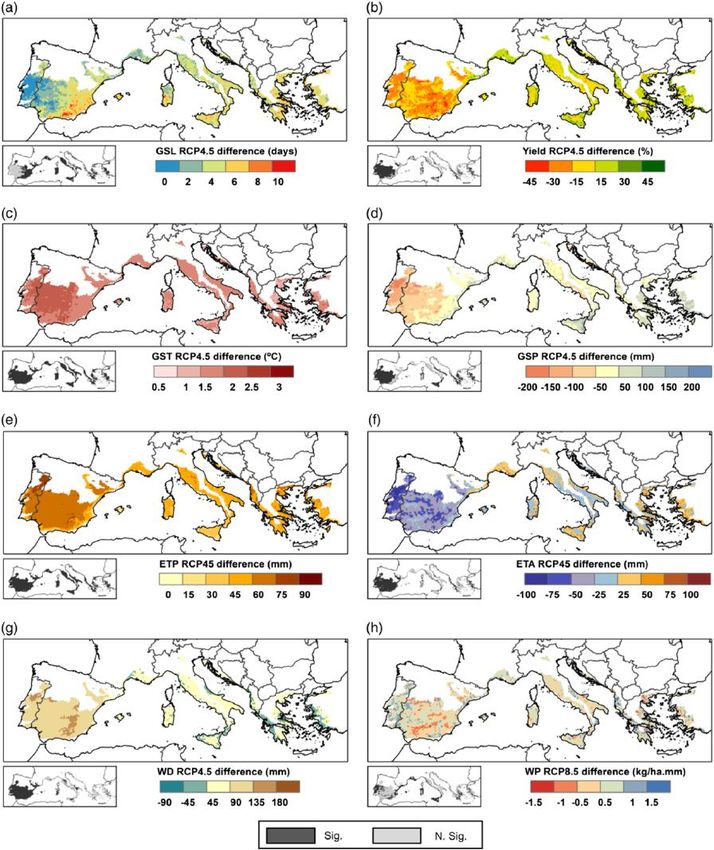
Portugal, will be required to adjust current approaches to terroir relating to cultivation selection
and winemaking technology (Ubeda et al., 2020).

Furthermore, olive trees, one of the oldest permanent crops grown in the Mediterranean basin,
are also subject to a great risk from temperature increase due to climate change (European
Environment Agency, 2019), mostly because higher water demand and lower water availability
will enhance the water stress for olive trees in the future (Fraga et al., 2020). As can be seen in
Figure 25 below, olive yields are expected to decrease in some parts of Portugal down to -30%
(Fraga et al., 2020).

Figure 25: Patterns for Olives for the differences between global warming of 2.5°C in 2100 and recent past
(1989-2005) for the variables: (a) growing season length (days), (b) yield (kg ha-1), (c) growing season mean
temperature (°C), (d) growing season precipitation sum (mm), (e) potential evapotranspiration in the growing
season (mm), (f) actual evapotranspiration in the growing season (mm), (g) water deficit (ETP minus ETA; mm)
in the growing season, (h) water productivity (kg ha-1 mm; yield divided by ETA) in the growing season (Fraga et
al., 2020)

www.climateanalytics.org                                                                                     29
You can also read