Reaching climate objectives: the role of carbon dioxide removals - May 2021 ETC Consultation Paper
←
→
Page content transcription
If your browser does not render page correctly, please read the page content below
Reaching climate objectives:
the role of carbon dioxide removals
May 2021

ETC Consultation Paper

                                 Supported by

                                 COALITION
What is this Energy Transitions Commission
Consultation Paper?
About the ETC
The Energy Transitions Commission (ETC) is a global        The paper assesses the need for carbon removals,
coalition of leaders from across the energy landscape       the technologies which can provide them, and
committed to achieving net zero emissions by mid-          alternative options for financing them. Illustrative
century, in line with the Paris climate objective          scenarios are used to provide indicative orders of
of limiting global warming to well below 2°C and           magnitude; estimates will be refined through more
ideally to 1.5°C. Our Commissioners come from a            detailed sectoral work (undertaken in partnership
range of organisations – energy producers, energy-         with the Mission Possible Partnership) over the
intensive industries, technology providers, finance        coming months.
players and environmental NGOs – which operate
across developed and developing countries and              What are the key consultation questions?
play different roles in the energy transition.
                                                           •	What is the overall scale of need for carbon
This consultation paper is based upon analyses                dioxide removal prior to mid-century and
carried out by ETC knowledge partner SYSTEMIQ,                beyond, in order to stay within a 1.5 degree
with the financial support from We Mean Business.             global warming carbon budget within the
It was discussed and refined with ETC members                 context of relatively ambitious assumptions on
but has not been endorsed by them at this stage.              within-sector emissions reduction pathways?
It builds upon prior ETC reports, especially Making
                                                           •	What types of carbon dioxide removal methods are
Mission Possible (2020), Making Clean Electrification
                                                              available, and what are the relevant timescales,
Possible (2021) and Making the Hydrogen Economy
                                                              technical and practical volumes, permanence
Possible (2021), and draws upon analyses carried out
                                                              of capturing and storage and costs? More
by ETC knowledge partners BloombergNEF, alongside
                                                              specifically, in the coming three decades, what
analyses developed by Climate Policy Initiative,
                                                              is the role of nature-based climate solutions vs
Material Economics, McKinsey & Company, Rocky
                                                              BECCS, DACCS and other hybrid or technological
Mountain Institute, The Energy and Resources Institute,
                                                              solutions? Are there other options not described
and Vivid Economics for and in partnership with the
                                                              in this paper which should be considered?
ETC in the past. We also reference analyses from the
International Energy Agency and IRENA. We warmly           •	Who should purchase these carbon removals
thank We Mean Business, our knowledge partners                and how much? How should public and private
and contributors for their inputs and look forward to         responsibility be allocated, such that removals
carrying the conversation further during consultation.        will complement and not replace within-sector
                                                              decarbonisation efforts, while unlocking investments
What is the objective of this paper?                          to deliver removals with speed and at scale?

This ETC Consultation Paper aims to provide a
                                                           How can input be provided?
conceptual framework for assessing the role of
carbon dioxide removals in meeting emissions               The ETC welcomes responses to this Consultation
reduction and climate objectives. The goal is to           Paper. Comments can be provided via a dedicated
gather perspectives and insights from stakeholders         online form which can be found on the ETC
in industry and the climate science community to           Website until June 30th, 2021. The ETC will also
consult on the appropriate and feasible role of carbon     consult via virtual fora during the second and
dioxide removal in ‘net zero’ pathways to limit warming    third quarters of 2021, please indicate interest in
to 1.5°C. Ultimately, it aims to inform the way net-zero   joining such conversations via the consultation
targets are set by countries and corporates. One of        form. Responses received will inform an
the underlying assumptions is that emission reduction      updated report to be published later in 2021.
targets are essential to get to net-zero in 2050, and      Further information can be found at the ETC
that carbon dioxide removals should complement,            website, https://www.energy-transitions.org/.
not replace, emission reduction measures.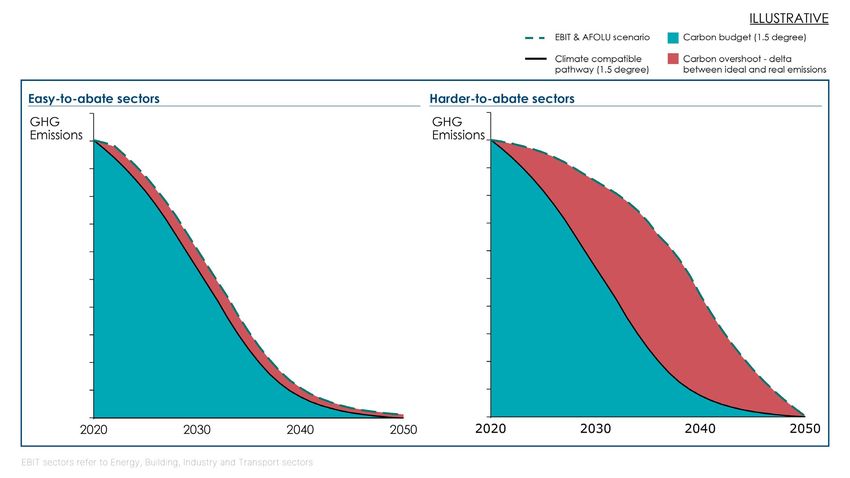
Reaching climate objectives: the role of carbon dioxide removals | ETC Consultation paper

    Introduction
    This ETC Consultation Paper aims to provide a                                                    Gt CO2 to about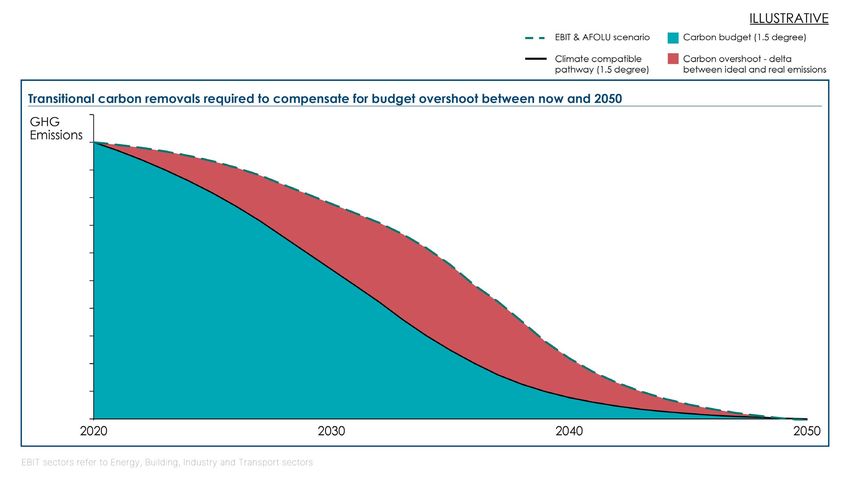
A crucial issue is therefore how to finance and      might be for governments to take the primary
implement these carbon removals. One option          responsibility for purchasing carbon removals,
would be for companies in the EBIT, waste, and       potentially using carbon tax revenues to finance
AFOLU sectors to purchase carbon removal offsets     the required expenditures, while still leaving an
on top of achieving ambitious reduction pathways     important role for voluntary company action.
for their own emissions “within the company”.
Some companies will and should choose to do          This report therefore sets out for consultation a
this voluntarily, and company purchases of offsets   range of possible approaches to the financing
could be encouraged by setting “offset targets” in   of required carbon dioxide removals, together
complement to existing “science-based targets”,      with key principles required to ensure permanent
or via carbon taxation incentives/regulation. An     and efficient carbon removal. It covers in turn:
alternative and possibly more efficient option

  1. Climate objectives and remaining GHG budgets

  2. C
      urrent emissions and illustrative scenarios for EBIT, waste and AFOLU
     emissions reductions

  3. Emissions
             reduction scenarios compared with the GHG budget
     – the size of the overshoot gap

  4. Options, potential scale, and costs of CO2 removals

  5. How to finance carbon removals – options for consultation

                                                                                                         4
Reaching climate objectives: the role of carbon dioxide removals | ETC Consultation paper

    Contents
    What is this Energy Transitions Commission Consultation Paper? _________________                           2
    Introduction ___________________________________________________________________________________________   3
    Table of Exhibits ______________________________________________________________________________________   6
    Box: Objective, methodology and definition of terms ________________________________                       7
    Chapter 1: Climate objectives and climate budgets ___________________________________                      9
       GHG impacts on global warming: stocks and flows __________________________________                      9
       Feedback loops, tipping points and implications ____________________________________                    10
       Climate objectives and IPCC carbon budgets ________________________________________                     10
    Chapter 2: Current emissions and emissions reduction scenarios _________________                           12
       The starting point – current emissions ________________________________________________                 12
       EBIT emissions reduction scenarios ___________________________________________________                  13
       Waste emissions reduction scenarios _________________________________________________                   16
       AFOLU emissions reduction scenarios ________________________________________________                    16
    Chapter 3: The size of the gap:
    resulting emissions scenarios and the carbon budget _______________________________                        20
    Chapter 4: Carbon Dioxide Removals ___________________________________________________                     22
       Natural Climate Solutions (NCS) _______________________________________________________                 22
       Bio-Energy with Carbon Capture and Storage (BECCS) _____________________________                        24
       Direct Air Capture and Carbon Storage (DACCS) ____________________________________                      25
       Other, more speculative carbon removals options ___________________________________                     25
       Storage options and permanence _____________________________________________________                    26
       Total quantities and costs ______________________________________________________________               27
    Chapter 5: How to finance carbon removals – options for consultation ______________                        30
       Accelerating within sector/company decarbonisation _______________________________                      30
       Principles and standards for carbon removals _______________________________________                    30
       Who should purchase carbon removals and how much?
       Options for private and public responsibilities _______________________________________                 31

5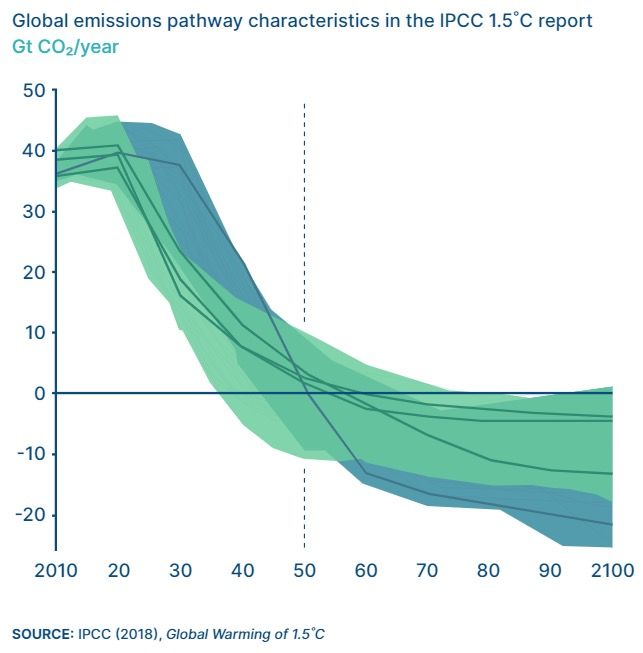
Table of Exhibits

Exhibit 1: Schematic illustration of role of carbon removals with and              8
without overshoot.
Exhibit 2: To have a 50% chance to remain 100 Mt CH4 per annum in 2050.
Exhibit 8: Applying a mix of reductions to land-use change and agricultural        19
emissions leads to a decline in annual CO2 emissions from 5.8 Gt to
Reaching climate objectives: the role of carbon dioxide removals | ETC Consultation paper
Objective, methodology and definition of terms
The objective of this consultation paper is to • The pathway for the AFOLU sectors builds
assess the role of “carbon removals” in achieving on the analysis of the Food and Land Use
climate objectives. We estimate how large the need Coalition,6 along with recent academic analysis
for such removals might be, what form they could of emission levels and mitigation potential.
take, and present options for who should pay to Estimates of current and future AFOLU
achieve them. This requires the following elements: emissions are inherently less certain than
EBIT emissions.
Defining a climate objective and a “carbon
budget”. The IPCC has estimated the stream • Our estimates for possible waste sector
of future GHG emissions and the resulting emissions reductions (which are dominated
concentrations of different GHGs in the by CH4) are derived from estimates by the
atmosphere that would be consistent with different World Bank, International Water Association,
probabilities of limiting global temperature and the UK Climate Change Commission’s
rise to either 1.5°C, or 2°C, or higher. In this waste decarbonisation pathway.7
paper, we focus on a GHG budget which gives
a 50% probability of staying below 1.5°C and Estimating the overshoot gap between
a 90% probability of staying below 2°C. the carbon budget and the illustrative
emissions reduction pathways which must
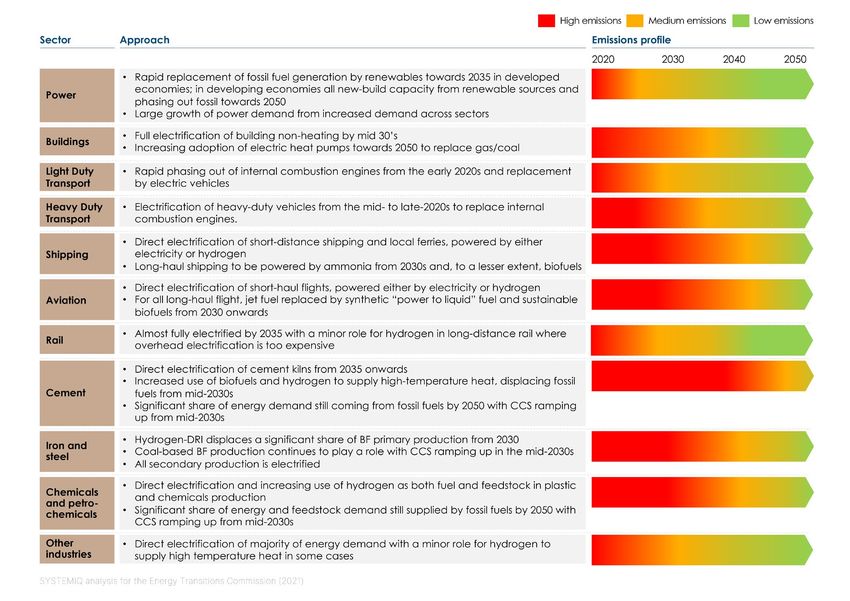
Future temperatures will be determined by be closed by some category of “carbon
emissions of both CH4 (a short-lived gas) and removal” in order to either (See Exhibit 1):
CO2 and N2O (long-lived gases). To generate a
“carbon budget”, the IPCC first estimates feasible • Offset the ongoing residual emissions which
reductions in annual CH4 and other non-CO2 GHG will still be produced by the EBIT, AFOLU,
emissions and then defines the maximum amount and waste sectors beyond mid-century.
of CO2 which could be emitted while staying within
the climate objective. We use the IPCC’s estimate • Offset the fact that emissions from the EBIT,
of this carbon budget to compare with our own AFOLU or Waste sectors cannot be reduced
scenarios for feasible emissions reductions. fast enough in the 2020s and 2030s to stay
within the cumulative carbon budget; or
Estimating feasible emissions reduction
pathways for the EBIT, AFOLU, and waste sectors: • Potentially, to generate “absolute negative
emissions” in the second half of the
• The pathway for the EBIT sectors draws on century if these are needed to compensate
the ETC’s Making Mission Possible report,4 for an overshoot of the carbon budget
and our recent reports on clean electrification between now and mid-century.
and hydrogen.5 Past ETC work has shown that
the EBIT sectors could get close to net-zero Identifying the options to achieve “carbon
emissions by mid-century: here we describe a removals”, including NCS, BECCS, and DACCS.
possible reduction pathway decade by decade. Here two methodological details should be noted:
These estimates will be refined during this
year, both through more granular sectoral • When CCS is applied to fossil fuel-based energy
decarbonisation roadmaps (especially in the production or an industrial process, this is
harder-to-abate sectors of the economy) already included in the “net emissions” of the
and through a deep-dive analysis of how fast EBIT sectors and so is not counted as a
emissions reductions could be accelerated in the “carbon removal”.
2020s (especially in the easier-to-abate sectors).
4 ETC (2018), Mission Possible; ETC (2020), Making Mission Possible.
5 E TC (2021), Making Clean Electrification Possible: 30 years to electrify the global economy; ETC (2021), Making the Hydrogen Economy Possible:
Accelerating clean hydrogen in an electrified economy.
6 FOLU (2019), Growing Better: Ten Critical Transitions to Transform Food and Land Use.
7 U K CCC (2020), Balanced Net Zero Pathway Assumptions; International Water Association, “How can more water treatment cut CO2 emissions,”
accessed February 2021; World Bank (2018), What a Waste 2.0
7• Natural climate solutions such as a reforestation accumulation of greenhouse gases (GHGs) in
and other restoration of nature will be among the atmosphere. “Natural Climate Solutions"
the actions by which the AFOLU sector achieves (NCS) can be considered as a subset of
abatement; so, only additional NCS above this NBS with a specific focus on addressing
level counts towards closing the overshoot gap. climate change. NCS has been defined as
‘conservation, restoration, and/or improved
Identifying options for who should pay land management actions to increase carbon
to achieve “carbon removals”. storage and/or avoid greenhouse gas emissions
across global forests, wetlands, grasslands,
Definition of terms. There is no definitively agricultural lands, and oceans’.8 These can be
correct use of terms, but for the purposes coupled with climate smart technologies that
of this paper we use them as follows: increase long term storage of carbon dioxide.
• “Net emissions” for the EBIT sector means • “Negative emissions” is used for the case
emissions after the application of CCS in where the combination of all sector CO2
energy production and industry, but before the emissions plus carbon removals results in
purchase of offsets to achieve carbon removals. an absolute negative (and thus a reduction
in the stock of atmospheric CO2).
• “Carbon dioxide removals” (CDR), sometimes
shortened to “carbon removals” refers to • “Carbon removal offset” or “carbon removal
actions such as NCS or DACCS that can result purchase” refers to the process by which
in a net removal of CO2 from the atmosphere. either a government or company purchases/
finances carbon removal. A “carbon removal
• “Nature-based Solutions" (NBS) are activities offset” indicates a company purchasing
that harness the power of nature to deliver carbon removals for the purpose of offsetting
services for adaptation, resilience, biodiversity, their existing emissions, instead of direct
and human well-being, including reducing the emissions reduction interventions.
Exhibit 1: Schematic illustration of role of carbon removals with and without overshoot.
8 Griscom et al., (2017), Natural Climate Solutions.
8Reaching climate objectives: the role of carbon dioxide removals | ETC Consultation paper
Chapter 1: Climate objectives and climate budgets
To avoid severe harm to human welfare, global warming should ideally be limited to
1.5°C and the probablity of exceeding 2°C should be small. In this paper, we therefore
propose to focus on a climate objective of ensuring a 50% chance of staying below
1.5°C and a 90% chance of staying below 2°C. IPCC estimates suggest that this could
be achieved if annual CH4 emissions were reduced by ~50% and N2O emissions by
~30% towards mid-century and if net cumulative CO2 emissions during 21st-century
stayed within a “carbon budget” of 500 Gt CO2.
GHG impacts on global warming: •
CO2 and N2O are both long-lived gases, which
stocks and flows once accumulated in the atmosphere take many
decades or indeed centuries to dissipate. As a
Human-induced emissions of greenhouse gases result, annual flows must be reduced to zero
are causing significant global warming. Currently, to prevent further increases in atmospheric
the concentration of CO2 in the atmosphere is concentrations and thus temperature. The
approximately 417 ppm,9 indicating a 50% rise in appropriate objective for these long-lived
the concentration of atmospheric carbon dioxide gases is therefore to ensure that cumulative
relative to the pre-industrial age,10 while CH4 emissions from now on do not exceed defined
concentrations have increased from 770 ppb to 1890 maximum quantities. It is possible to express N2O
ppb.11 To-date this has resulted in an average global emissions on a carbon equivalent basis (with one
warming of ~1.0ºC above preindustrial levels.12 ton of N2O having an equivalent forcing effect of
~265 tonnes of CO2) and it would therefore be
Time is running out yet ambition to decarbonise possible to define a “carbon equivalent budget”
must remain high. As described by the IPCC, which covers both CO2 and N2O emissions.
missing the 1.5°C target and instead aiming for However, the IPCC first develops estimates of
2°C of warming will have significant adverse the likely evolution of N2O emissions, and then
consequences for unique and threatened calculates a “carbon budget” for cumulative
natural ecosystems such as the Arctic region, acceptable emissions of CO2 alone, an approach
extreme weather events such as coastal which we follow in the rest of this document.
flooding and other climate-risks such as low
crop yields and heat-related deaths.13 • By comparison, CH4 is a relatively short-lived
gas with a half-life in the atmosphere of about
The main gases responsible for global warming 10-12 years,15 indicating that the concentration
are CO2, N2O, CH4 and fluorinated gases, the latter of methane produced by a one-off pulse takes
we exclude in the remainder of our analyses.14 10 years to halve, as methane is converted (via
In each case the “forcing effect” which induces a complex set of oxidization reactions), into
global warming is a function of the atmospheric CO2 and H2O, eventually leaving 2.75 tonnes of
concentration of the given greenhouse gas at CO2 per tonne of methane emitted. Estimates
any time. Differences in the average lifetime of suggest that increasing concentrations of CH4
the gases have implications for whether emission have been responsible for about 0.2°C out of
objectives should focus on the stocks or flows: the ~1.0°C of global warming so far.16 Given
the short-lived nature of methane, methane
9 Betts, R. (2021), “Met Office: Atmospheric CO2 now hitting 50% higher than pre-industrial levels,” Carbon Brief.
10 Pre-industrial atmospheric concentrations assumed to be 278ppm; Betts, R. (2021), “Met Office: Atmospheric CO2 now hitting 50% higher than pre-industrial levels,” Carbon Brief.
11 Methanelevels.org, visited 19th April 2021; assuming pre-industrial era began 1850.
12 IPCC (2018), Global warming of 1.5°C. An IPCC Special Report: Chapter 2; based on 2006-2015 reference period; There are, however, uncertainties about historical emissions
since the pre-industrial era, as well as geographical variations in the degree of warming, particularly as a result of non-CO2 climate forces which exhibit greater variation by region
compared to CO2 which, in turn, has lead to important uncertainties in the global temperature response to greenhouse gases.: Myhre, G. et al., (2013), Anthropogenic and Natural
Radiative Forcing.
13 IPCC (2018), Global warming of 1.5°C. An IPCC Special Report: Summary for Policy Makers.
14 For simplicity, fluorinated gasses are not discussed in this consultation paper. IPCC Integrated Assessment pathways consistent with 1.5°C reduce emissions of fluorinated gases in
by roughly 75–80% relative to 2010 levels in 2050. IPCC (2018), Global warming of 1.5°C An IPCC Special Report with no clear differences between the classes.
15 Saunois, M. et al., (2020), The Global Carbon Budget 2000-2017.
16 Economist “Those who worry about CO2 should worry about CH4 too”, 3rd April 2021.
9concentrations and forcing effect would stabilise in a diminishing albedo effect); 21 or (ii) higher
if the flow of new methane emissions ceased to temperatures today generate increased local
rise. But this does not mean, as some interest emissions (e.g., via CH4 release from the thawing
groups suggest, that the appropriate objective of Arctic permafrost).
should be simply to stabilise rather than reduce
methane emissions for two reasons. First, (i) In addition, it is possible that, beyond some
because of the ongoing result of increased CO2 thresholds or “tipping points” – whether defined
concentrations (ii) and second, because the in terms of overall temperature, or of local climate
very fact that methane is short-lived means and physical effects, positive feedback loops
that reducing methane emissions is the most could become so strong as to trigger highly non-
powerful lever to reduce short-term temperature linear and irreversible climate change. How near
rises, and thus reduce the risk that feedback we are to such “tipping points” is debated, and
loops will take the climate beyond the tipping the IPCC carbon budgets indicated below do
points discussed below. Objectives for CH4 not explicitly model their potential impact.22
emissions are therefore expressed in terms of
how fast annual flows should fall over time.17,18 The implications of feedback loops and
possible tipping points are at least two-fold:
• Given the different nature of the long-lived gases
(CO2 and N2O) and CH4, estimates of the “carbon • There should be a strong focus on achieving
equivalent” effect of CH4 emissions depend on GHG emissions reductions as early as possible
the timescale assumed. Over a 100-year period, – and in particular reductions in CH4.
a tonne of CH4 emitted today has a forcing
effect (and therefore impact on temperature • It seems possible that the IPCC carbon budget
on average over the period) about 28 times referenced as a base case in this report
that of a tonne of CO2 emitted today. Viewed overstates acceptable cumulative emissions
over a 20-year period, though, CH4’s impact is and that new information about the power of
84 times greater per tonne emitted.19 Neither feedback loops and the potential for tipping
measure is in absolute terms the correct one, points may argue for a tighter budget.
but the impact of climate feedback loops means
that the 20-year calculation is arguably a better Climate objectives and IPCC carbon budgets
measure of the impact of CH4 in today’s specific
circumstances, as it might not take another The Paris Agreement committed the world to
century before feedback loops are triggered. limiting global warming to well below 2°C above
preindustrial levels while seeking to limit it to
Feedback loops, tipping points, 1.5°C. But since the relationship between GHG
and implications emissions and temperature is probabilistic,
climate objectives must be expressed in terms
Concentrations of greenhouse gases in the of probabilities.For the purposes of this paper,
atmosphere produce “radiative forcing effects” we propose a climate objective which achieves
which increase atmospheric temperature.20 But a 50% chance of limiting warming to 1.5°C and
the impact of atmospheric GHG concentrations on approximately 90% probability of limiting it to 2°C.
global temperatures can be magnified by feedback
loops which arise either because (i) higher The IPCC’s estimates the carbon budget
temperatures today generate higher temperatures compatible with different climate objectives
in future, and do so even if forcing effects cease by first assuming a feasible pace of CH4 and
to increase (e.g., the loss of Arctic sea ice resulting other non-CO2 GHG emission reductions and
17 Saunois, M. et al. (2020), The Global Methane Budget 2000-2017.
18 ssumed that IPCC carbon budgets take the long-lasting products of tropospheric oxidation of CH4 into account; “Collins, M. et al. (2018), applied a process-based approach to
A
assess the importance of CH4 reductions for the 1.5°C target. Their modelling approach included indirect effects of CH4 on tropospheric ozone, stratospheric water vapour and
the carbon cycle.” IPCC (2018), Global warming of 1.5°C. An IPCC Special Report.
19 US EPA, “Understanding Global Warming Potentials”, Accessed April 2021.
20 W hen the earth absorbs more energy from the sun than it emits to space it causes warming, this difference between incoming and outgoing radiation is known as ‘radiative
forcing’. Greenhouse gasses can exacerbate this warming effect, which is known as the ‘radiative forcing effect’.
21 The ‘albedo effect’ refers to how light surfaces reflect more heat than dark surfaces.
22 IPCC (2018), Global warming of 1.5°C. An IPCC Special Report.
10Reaching climate objectives: the role of carbon dioxide removals | ETC Consultation paper
then estimating the cumulative emissions of CO2 natural sinks got smaller over time, the overall
which are compatible with different probabilistic carbon budget would reduce; and (ii) that any
climate objectives.23 If those non-CO2 emissions carbon removals to close the gap between future
reductions are not achieved, then the carbon anthropogenic emissions and the carbon budget
budget would be reduced. Exhibit 2 shows the must be in excess of the natural sequestration
results: if CH4 emissions can be cut by around 50% already assumed in the IPCC carbon budget.
and N2O by around 30% by mid-century, then:
In Section 3 of this report, we assess how
• A 500 Gt “carbon budget” gives a 50% potential CO2 emissions from the EBIT, AFOLU
chance of limiting global warming to 1.5°C, and Waste sectors compare with the 500Gt
while only 330 Gt CO2 would be compatible of carbon budget and the size of the required
with a 66% probability of a 1.5°C limit. “carbon removals” to close the gap between
forecast emissions and the carbon budget.
• A 1420 Gt CO2 budget gives a 50% chance
of limiting warming to 2°C, while a 1080 Finally, it is important to consider the timing of
Gt CO2 would give a 66% chance of this emission reductions. The “carbon budgets “shown
limit. The underlying probability distribution on Exhibit 2 are expressed in Gt of total emissions
suggests that a 500 Gt budget would be independent of the shape of reduction between
broadly equivalent to a 90% chance of now and mid-century. This implies that a variety
keeping global warming below 2°C. of different reduction paths could result in the
same temperature effect if the “area under the
These budgets relate only to anthropogenic curve” is the same (see Exhibit 2). But if emission
emissions or emissions from natural sources arising reductions were significantly more delayed than
because of human activity (e.g., land use change), some of the IPCC scenarios assume, feedback
and already allow for the significant carbon loops could result in the cumulative carbon
sequestration which naturally occurs in forests budget being somewhat smaller. This reinforces
and oceans. This implies that (i) if these standing the importance of early emissions reduction.
Chosen carbon budget in this document
50%
66% chance ~90% chance
chance
500 Gt CO2 340 Gt CO2Chapter 2: Current emissions and emissions
reduction scenarios
Today’s annual anthropogenic emissions are approx. 37 Gt CO2, 4.0 Gt CO2e of N2O
and 402 Mt CH4. The key question is how fast these emissions can be reduced over
time. Our illustrative base case scenario – which would require implementation of
forceful policies beyond what has been committed so far – suggests that:
• EBIT CO2 emissions could be cut from 32 Gt CO2/Yr today to 27 Gt CO2/Yr in
2030, 17 Gt CO2/Yr in 2040 and 1.7 Gt CO2/Yr in 2050.
• Today’s 6 Gt of net CO2 emissions from the AFOLU sector could be reduced
to 1.5 Gt CO2/Yr by 2030, andReaching climate objectives: the role of carbon dioxide removals | ETC Consultation paper
Assumptions about gross removals from the close any GHG emissions overshoot gap. In the
forestry and land-use change sector, as well carbon budget these numbers are assumed to
as these terrestrial sinks are already taken be constant over time, in reality warming as well
into account in IPCC estimates of the available as ongoing land-use change might decrease the
carbon budget. Therefore, these carbon removals size of these gross removals and natural sinks.28
and cannot therefore be seen as an option to
Fuel Emissions Process emissions Other
Scope of emissions considered (2019)
Carbon Dioxide (Gt CO2) Nitrous Oxide (Gt CO2e) Methane (Mt CH4)
Buildings (heating) 5.1 0.1 0.0
Buildings (other) 4.5 0.1 0.0
Road Transport 6.5 0.1 0.0
Shipping 0.9 0.0 0.0
Aviation 1.0 0.0 0.0
Rail 0.3 0.0 0.0
Cement 2.6 0.0 0.0
Iron and steel 1 3.3 0.1 0.0
Chemicals and
2.3 0.3 0.0
petrochemicals
Other industries 4.8 0.1 0.0
Fuel production
0.3 0.0 126.5
(fugitive emissions)
Waste Management 0.0 0.1 79.5
AFOLU2 Deforestation, land-use change 5.8 3.1 Agriculture 196.0
Total 37.2 Gt CO2 4.0 Gt CO2e 402.1 Mt CH4
(1) Due to the production process, process emissions and fuel emissions are typically not separated for iron and steel; (2) AFOLU: Agriculture, Forestry, and Other Land Use change;
Note: Estimates of global greenhouse gas emissions in 2019 range widely as a result of varying assumptions, including different assumptions on GWP of methane. The IEA estimates
global GHG emissions in 2019 of 51 Gt CO2e.
Source: SYSTEMIQ analysis for the ETC based on: IEA (2017), Energy Technology Perspectives; EDGAR database; SSP database by IIASA; IEA (2020), Methane Tracker
Exhibit 3: Including CO2, CH4 and N2O emissions from EBIT sectors, waste and AFOLU, leads to a total of
37.2 Gt of CO2, 4.0 Gt CO2e from N2O and 402 Mt of CH4.
EBIT emissions reduction scenarios The ETC has previously shown that EBIT sector
CO2 emissions – including those from what
The EBIT sectors are currently responsible for have previously been seen as “harder-to-abate”
around 32 Gt of CO2 emissions and about 130 sectors – could be reduced close to zero by
Mt of CH4 emissions (see Exhibit 3).29 These mid-century – with net emissions after CCS as
derive from three main sources (i) energy- low as 1.6 Gt, and still lower if all opportunities
related emissions resulting from the burning of for energy productivity improvement could be
fossil fuels, whether used directly or to produce seized.31 We have now developed illustrative
electricity, (ii) process emissions arising from scenarios for the trajectory of emissions between
the chemical reactions involved in cement, steel, now and 2050. Exhibit 4 shows the resulting
petrochemical, and other production processes, profile over time. Scenario A shows what might
and (iii) emissions resulting from the extraction, occur if only supply-side decarbonisation and
processing and distribution of fossil fuels, which energy efficiency improvement measures were
account for almost all EBIT sector CH4 emissions.30 deployed; Scenario B shows the potential if all
opportunities for energy productivity, including
circular economy measures, were also seized.
28 Duffy et al., (2021), How close are we to the temperature tipping point of the terrestrial biosphere?
29 uropean Commission, Emissions Database for Global Atmospheric Research (EDGAR), release EDGAR v5.0 (1970 – 2015) of November 2019; IEA (2020), Energy Transitions Pathway;
E
IEA (2020), Cement Analysis.
30 All fossil-fuel related methane emissions covered by the IEAs methane tracker are included in fugitive emissions.
31 ETC (2018), Mission Possible; ETC (2020), Making Mission Possible
13PRELIMINARY
Industry Shipping & aviation Power
Gt CO2 , Global, annual Building Road transport
Before applying CCS After applying CCS
Scenario A 31.7 31.7
Underlying
Energy efficiency 26.8 26.8 assumption is
and supply side that CCS is
decarbonisation only applied
19.5
16.6 if still required
in 20502
6.7
1.6
2019 2030 2040 2050 2019 2030 2040 2050
Scenario B 31.7 31.7
Energy efficiency and
supply side decarbonisation 23.8 23.6
+ material efficiency
15.3
13.2
4.2
1.1
2019 2030 2040 2050 2019 2030 2040 2050
To be refined based on MPP road maps and ETC CCS deep dives
Note: (1) In 2019, ‘biofuels’ includes both biomass and waste, generating emissions but the decarbonization pathways assume no further use of waste as an energy source. Emissions from
biofuels from 2021 onwards are assumed to only be generated in the feedstock-to-fuel conversion process for biofuels used in transport; (2) We assume CCS to only be applied if still required
in 2050 based on the long lifetimes of CCS, the lead times of 5+ years and the limited CCS capacity to date.
Source: SYSTEMIQ analysis for the ETC based on: IEA (2017), Energy Technology Perspectives; IEA (2020), Energy Technology Perspectives; Previous analyses of the Energy Transitions
Commission, drawing on data from BloombergNEF.
Exhibit 4: EBIT sectors: Resulting in a ~30 Gt CO2 decline in emissions under our CCS assumptions by 2050.
These scenarios could be considered “reasonably existing long-term fixed price supply contracts
optimistic”; they assume ambitious policies and and regional employment challenges. Power-
private sector action to drive decarbonisation related emissions contract towards zero in
across all EBIT sectors based on robust bottom- the 2040s. Our detailed assumptions about
up analyses developed in close consultation with the power sector are set out in the ETC’s
industry stakeholders.32 They are illustrative and recent report on clean electrification.34
will be refined over the coming months. Still more
rapid reduction could be possible if society is • Building: In the infrastructure sector
willing to accept some higher costs (for instance already electrified activities will further
from scrapping existing capital assets before grow, including heating and cooling.
end of life or forcing the widespread use of new
technologies before costs have been reduced). The • Industry: Industrial decarbonisation, including
feasible pace of decarbonisation differs between the steel, chemicals, and cement sectors,
sectors, with the shape of the reduction curve is also possible by 2050, but with gradual
over time reflecting the following assumptions: progress only in the 2020s as key technologies
(such as the use of green hydrogen in steel
• Energy: In the power sector, the falling costs production) progress through pilot plants and
of renewables makes rapid decarbonisation initial commercial deployment stages. Moreover,
economic, with all developed economies some industrial decarbonisation – in particular
achieving almost complete decarbonisation the example of cement – will likely depend on the
by 2035 while developing countries meet all application of CCS, which in 2050 could account
growing demand for electricity from zero- for 5.2 Gt of emissions reductions (reducing
carbon sources.33 Some factors, however, may residual EBIT emissions from 6.7 Gt to 1.6 Gt),
delay this progress, particularly in developing but which is unlikely to be deployed on a large
countries such as China and India, including scale before 2030.35 As for shipping and aviation,
32 E TC (2018), Mission Possible; ETC (2020), Making Mission Possible.
33 ariable renewable energy generation costs are already falling below the marginal cost of running coal or gas plants in many locations, leading to declining fossil capacity
V
utilization over time.
34 ETC (2021), Making Clean Electrification Possible: 30 years to electrify the global economy
35 G iven the limited capacity of CCS to-date, the long lead times of 5+ years from planning to becoming operational and the use of CCS in only a limited number of applications
thus far, it is unlikely that CCS operations within these sectors will begin before 2030. In addition, given the long lifetime of capture and storage infrastructure we assume that
CCS is only built if it is still required in 2050 and is therefore not treated as a transition technology.
14Reaching climate objectives: the role of carbon dioxide removals | ETC Consultation paper
initial assumptions are set out in the ETC’s behaviour change, making the true opportunity
Mission Possible and Making Mission Possible inherently uncertain, but in principle large.
reports,36 but will be refined during this year.
Energy productivity measures primarily influence
• Transport: electricity consumption which will be almost
completely decarbonised by 2050, therefore
– Road transport can and should be electrified, achieving these measures would make little
with rapid growth in the share of new auto difference to residual emissions in 2050. Greater
sales accounted for by battery EVs, and energy productivity could significantly reduce total
some developed countries planning to ban energy demand by 2050 (and thus total costs)
ICE sales from 2030. However, it still takes but cut residual emissions by only another 0.5
time for this new flow effect to work through Gt. However, in principle, rapid improvements in
to the stock of vehicles on the road.37 energy productivity could be a lever to achieve
considerably more rapid emission reductions in
–S
hipping is eventually almost completely the 2020s. Thus, Scenario B shows a fall of 25%
decarbonised (most likely through use of between 2020 and 2030 as against Scenario A’s
fuels such as ammonia derived from ‘green’ 17%. This could significantly impact cumulative CO2
hydrogen) and so too is aviation (using either emissions over the next 30 years: from 686 Gt CO2
biofuels or synthetic fuels). In both sectors, emissions in scenario A to 614 Gt CO2 emissions
progress is initially slow in the 2020s due to in scenario B.
low technology readiness and high fuel switch
costs but accelerates thereafter. Key initial Finally, in the EBIT sectors, it is important to focus
assumptions here are set out in the ETC’s also on the major potential to reduce CH4 emissions
Mission Possible and Making Mission Possible from fossil fuel production and use. These will fall
reports,38 but will be refined during this year. naturally as fossil fuels account for a declining share
of total energy supply. But they can and must also
The difference between Scenario A and be reduced rapidly to eliminate CH4 leakage across
Scenario B reflects the potential impact the fossil fuels value chain. We estimate that EBIT
of theoretically feasible improvements in CH4 emissions could be cut from 108 Mt to 83 Mt
three forms of energy productivity: in 2030, 53 Mt in 2040 and 18 Mt in 2050, implying
a 100% reduction in flaring emissions and a 40%
• Greater technical energy efficiency across multiple reduction in leakage/venting. This approximately
applications such as buildings, for example corresponds to a leakage rate of 0.2% in line with
through better insulation, and in transport. OGCI targets.40 However, we believe there is further
potential to reduce leakage rates beyond this to
• Improved material efficiency which can reduce 0.05% by 2050 through a more ambitious effort
the need for primary production of energy- to limit leakage and halt venting.41 N2O emissions
intensive materials, such as steel and cement, generated by the EBIT sectors could also be
through product redesign, more efficient material reduced, primarily by the displacement of fossil
use, and greater materials recycling and reuse;39 fuels as well as by a greater adoption of abatement
technologies in the chemicals sectors, namely nitric
• Improved service efficiency, where, in theory, acid and adipic acid production. The ETC estimates
it is possible to deliver higher living standards that incremental capital investments needed to
while using less energy-intensive goods and achieve a zero emissions economy by around mid-
services, for example through shared use Century, while significant in absolute dollar terms
models in transport, changes in transport (US$1.6 trillion per annum on average over the next
mode and better urban design. Energy 30 years), are only about 1% to 2% of global GDP
savings here depend on some element of per annum.42
36 ETC (2018), Mission Possible; ETC (2020), Making Mission Possible.
37 espite improving economics leading to growing shares of EVs in new sales, it will take many years for the fleet to be largely electrified given typical vehicle turnovers of 12 years in
D
developed economies, but much longer in some developing countries; ETC (2021), Making Clean Electrification Possible: 30 years to electrify the global economy.
38 E TC (2018), Mission Possible; ETC (2020), Making Mission Possible.
39 A nalysis by Material Economics suggests that in theory, by 2050, such measures could reduce global demand for cement by 34%, steel by 64% and chemicals by 56% relative to BAU.
40 OGCI (2021), OGCI position on policies to reduce methane emissions.
41 ETC (2021), Making the Hydrogen Economy Possible.
42 ETC (2020), Making Mission Possible.
15PRELIMINARY
Industry Shipping & aviation Power
Global, annual Fuel production Building Road transport
Methane , Mt CH4 Nitrous Oxide, Gt CO2e
Scenario A 108.3 0.9
Energy efficiency 0.5
and supply side 82.9
decarbonisation
0.3
52.6
18.3
0.1
2019 2030 2040 2050 2019 2030 2040 2050
Scenario B 108.3 0.9
Energy efficiency and
supply side decarbonisation 0.6
+ material efficiency 73.0
0.4
40.6
11.1
0.1
2019 2030 2040 2050 2019 2030 2040 2050
To be refined based on MPP road maps and ETC CCS deep dives
Source: SYSTEMIQ analysis for the ETC based on: IEA (2017), Energy Technology Perspectives; IEA (2020), Energy Technology Perspectives; Previous analyses of the Energy Transitions
Commission, drawing on data from BloombergNEF.
Exhibit 5: EBIT sectors: Resulting in a ~90 Mt decline in CH4 and a 0.8 Gt CO2e decline in N2O under our CCS
assumptions by 2050.
Waste emissions reduction scenarios derived from the net effect of forestry and land-use
change), 3.1 Gt of CO2 equivalent N2O emissions
Multiple forms of waste management and disposal – and around 190 Mt of CH4.45 Compared with the
some applying advanced management techniques, EBIT sectors, it is far more difficult to define both
but others involving open dumping – produce the feasible endpoint in 2050 and the pathway from
large CH4 emissions. Estimates are inherently now till then. This reflects not only the inherent
uncertain but suggest around 80 Mt per annum uncertainty about today’s emissions already
(see Exhibit 7).43 These could grow to over 110 Mt discussed, but also the far more fragmented
by 2050 with population growth and only limited nature of agricultural production, and inherent
improvements in waste management practices. complexities arising from the overlap between
However, forceful action to bring all countries agriculture, land use changes deriving from
up to the waste management standards of high- agriculture, and the wider role of natural sinks
income nations could both reduce CH4 emissions and sources.
to 15 Mt per annum and help deliver several UN
Sustainable Development Goals in the process.44 Exhibit 8 sets out our illustrative scenario for
Development support for low-income nations to how emissions might evolve between now
invest in solid waste and wastewater infrastructure and 2050, with net CO2 emissions reducing to
will be critical to seizing this potential. almost zero, N2O emissions falling 36%, and
CH4 emissions down from 192 Mt to 110 Mt. The
AFOLU emissions reduction scenarios key actions required to achieve this would be:
The AFOLU sector currently accounts for about • A major change of direction in land-use,
6 Gt of annual CO2 emissions (of which ~5 Gt where the most important is to avoid further
43 TC Analysis, drawing on: UK CCC (2020), Balanced Net Zero Pathway Assumptions; International Water Association, “How can more water treatment cut CO2 emissions,” accessed
E
Febr uary 2021; World Bank (2018), What a Waste 2.0.
44 Presents an illustrative optimistic scenario which assumes that global per capita waste emissions converged with the EU, and that those emissions per capita reduce by a further
50% by 2050 in line with historical EU waste emissions (42% reduction 1995 and 2017, Eurostat). For context, the UK Climate Change Commission has a target for 75% reduction of
waste emissions by 2050.
45 SYSTEMIQ analysis for the Energy Transitions Commission, drawing on: Roe et al., (2019), Contribution of the land sector to a 1.5 °C world; IPCC (2019), Special Report on Climate
Change and Land; Global Forest Watch, “New Global Maps Estimate Forest Carbon Fluxes in Unprecedented Detail,” January 29th 2021.
16Reaching climate objectives: the role of carbon dioxide removals | ETC Consultation paper
SYSTEMIQ analysis for the Energy Transitions Commission (2021)
Exhibit 6: Decarbonisation pathway per sector.
Two primary sources of waste emissions: Annual emissions from solid waste and wastewater
Solid waste Wastewater
~2/3 of waste emissions from poor solid waste
management and incineration: Low Income Upper-Middle Income Global Wastewater Emissions
Low-Middle Income High Income
• Emissions from open dumping are
If Global Waste Emissions per Capita converged at the EU level
estimated to be ~20-fold of landfill and continued to decrease in line with EU historical reduction rates4
emissions.1 Mt CH4, global
120
• 93% of waste in low-income nations is
disposed of in open dumps.2 100
• Food and green waste and paper and 80
cardboard contribute the majority of solid
waste emissions.2 60
40
~1/3 of waste emissions from wastewater:
20
• Only about 20% of all wastewater globally
is treated.3 0
2020 2030 2040 2050
• Treating wastewater could cut its GHG
*Waste emissions are comprised of ~98% methane.
emission to about one-third.3
Note: Large uncertainty on emissions from waste due to undocumented volumes and impacts of
untreated waste
Source: SYSTEMIQ analysis for the ETC based on: (1) Manfredi et al., (2009), Landfilling of waste: accounting of greenhouse gases and global warming contributions; (2) World Bank, What a
Waste 2.0, 2018 ; (3) International Water Association (2020), “How can more water treatment cut CO 2 emissions?”; (4) European Environment Agency (2019). Note: assumes global per capita
waste emissions reduce to 50% of that of the EU today, based on past EU waste emissions mitigation trajectory.
Exhibit 7: If we only apply moderate efforts to mitigate, waste emissions could be responsible for >100
Mt CH4 per annum in 2050.
17deforestation. Our scenario, which builds on – Demand-side changes which reduce emissions
the Land Sector Roadmap developed by Roe et via shifting to plant-based diets and reducing
al., (2019), assumes that by 2040, annual net food loss and waste. Our scenario assumes
emissions from human-induced deforestation that, by 2050, 50% of the global population
and land degradation could be reduced adopts a plant-rich diets, significantly reducing
by around 5 Gt CO2 by 2050. This analysis demand for GHG-intensive and land-intensive
assumes policies which deliver a 70% reduction foods such as red meat.49 On top of that, by
in deforestation rates by 2030, achieving a 2050, food loss and waste could be reduced
near-total end to land conversion (90% down) by 50%. An estimated one-third of all food
by 2040.46 It is critical to highlight that halting produced today is wasted, either prior to
further deforestation is the most urgent and reaching the plate due to overproduction, lack
effective action which can be taken to address of cold storage and inefficient practices in the
AFOLU emissions. IPBES estimates that only food value chain (food loss) or ‘after the plate’
20% of tropical forests today are pristine and because of consumer behaviour (food waste).50
intact forests, yet these represent 40% of the These demand shift levers could deliver a 20%
carbon stored in tropical forests.47 Policies reduction in total agricultural CH4 emissions by
to achieve this challenging objective include 2050 even as the global population continues
establishment of protected areas, improved to grow.
land tenure, law enforcement, and supply
chain transparency, commodity certification The Food and Land Use Coalition estimated that
and payments for the protection of forest a global transition for the food system to achieve
through voluntary carbon markets or other similar targets would have an investment cost
result-based payment schemes. In addition, in 2030 less than 0.5% global GDP per annum
reducing peatland and coastal wetland draining ($300-$350 billion required each year for the
and conversion is a key lever. One study finds transformation of food and land use systems
the drainage of peatlands generates 32% of to 2030).51
emissions from land use conversion to cropland
yet only provide 1.1% of total crop calories.48
• Significant changes in agricultural production
processes and consumer behaviour. Key sources
of N2O emissions include fertiliser use, and
animal manure; while CH4 emissions are primarily
produced from enteric fermentation of ruminant
animals, rice cultivation and animal manure.
Reducing these will require the following:
– Improvements in agricultural technologies
and practices, including better fertiliser
management, improved water and residue
management of rice fields, and reducing
emissions from enteric fermentation by
changing livestock feed. These could
achieve an estimated 25% reduction
in direct agricultural emissions.
46 his could bring forestry and land use change emissions into balance, where ongoing emissions from forest decay and management practices would be offset by regrowth from
T
managed land. Roe et al., (2019), Contribution of the land sector to a 1.5 °C world; IPCC (2019), Special Report on Climate Change and Land.
47 IPBES (2019), Global Assessment Report on Biodiversity and Ecosystem Services.
48 Carlson K. M. et al., 2017, Greenhouse gas emissions intensity of global croplands.
49 W hile a greater shift towards plant-rich diets is feasible, it is important to consider that as global population shift signals a growth in middle-classes in developing nations, this also
typically drives an increased demand for ‘luxury’ food items such as dairy and meat. Meat consumption is not eliminated altogether but limited to ~60 grams/day. Source: Hawken, P.
(2017), Project Drawdown: The most comprehensive plan ever proposed to reverse global warming.
50 FOLU (2019), Growing Better: Ten Critical Transitions to Transform Food and Land Use.
51 FOLU (2019), Growing Better: Ten Critical Transitions to Transform Food and Land Use.
18Reaching climate objectives: the role of carbon dioxide removals | ETC Consultation paper
Over time the anthropogenic gross AFOLU emission reduction pathways, Net Emissions (anthropogenic)
PRELIMINARY
emissions from land use change
are increasing faster than gross 6 5.8
removals. While annual gross Carbon Dioxide,
removals have grown, primary Gt CO2/year 4
forest has declined dramatically.
1.8
2
0.7 0.3
Gross Land Use Change and
Forestry Emissions in Gt CO2e 0
2020 2030 2040 2050
Global Carbon Project, 1960-2019 6
Nitrous Oxide,
Decade Mean, Gt CO2/yr Gt CO2e/year 4
2.8 2.4
20 2.1 1.8
2
15
15 0
2020 2030 2040 2050
10 192.4
200
5 Methane, 159.6
5 Mt CH4/year 150 129.8
111.5
100
0 50
0
-5 2020 2030 2040 2050
-10 AFOLU Activities which emit emissions Emission reduction activities
-10
Land-use change Emissions from deforestation and other land use change Halt deforestation and other land-use change
emissions Emissions from energy Electrify equipment and decarbonize grid
-15
1960 2019
Emissions from Emissions from agriculture Change agriculture practices
agriculture Emissions from agriculture Change diets
net flux source sink
activities Emissions from food loss and waste Reduce losses and overproduction
Source: SYSTEMIQ analysis for the ETC based on: Roe et al,. (2019) and Global Carbon Budget (2020).
Note: Roe et al., (2019) levers for mitigation in 2050 were back-calculated based on policy assumptions stated in paper to show how the emissions for the AFOLU sector could shift over time as
the strategies take effect; Roe et al., (2019) indicates an additional max potential of 1.1 Gt CO2e/yr BECCS, which is excluded in this overview. Emissions from deforestation and degradation
adjusted to reflect estimates from Global Carbon Project (average 2001-2018). Farming practices which release emissions include enteric fermentation, rice cultivation, fertilizer use, manure.
Note: The carbon dioxide removal potential of natural climate solutions such as reforestation and natural landscape restoration is not depicted here.
Exhibit 8: Applying a mix of reductions to land-use change and agricultural emissions leads to a decline in
annual CO2 emissions from 5.8 Gt toChapter 3: The size of the overshoot gap: resulting
emissions scenarios and the carbon budget
Comparing our illustrative scenarios for EBIT, Waste and AFOLU sector emissions
with the IPCC carbon budget reveals both the need around for ~ 4 Gt per annum
of ongoing carbon removals beyond 2050 and at least a 200 Gt gap of excess
cumulative CO2 emissions over the next 30 years.
The combined result of the EBIT, Waste and for the emissions trajectory will be refined over
AFOLU scenarios is shown on Exhibit 9, with total time, but are unique in being developed from a
CO2 emissions cut from 37 Gt to 2 Gt per annum systematic, bottom-up, industry perspective of
in 2050, N2O from 3 to 2 Gt of CO2e and CH4 a transition which is ambitious yet feasible.
emissions reduced by around 40% in 2050. The
residual CO2 and N2O emissions of around 4 Gt As a result, significantly increased early
per annum imply a permanent ongoing need for an reductions, beyond our illustrative scenario,
equivalent level of “carbon removal” each year. would be needed to avoid the need for absolute
negative emissions in the 2050s and beyond.
In addition, however, as the right-hand side of
Exhibit 10 shows, cumulative CO2 emissions over There are three ways in which this
the next 30 years are estimated at 686 Gt versus overshoot gap could be bridged:
the estimated carbon budget 500 Gt discussed in
Section 1. This implies an overshoot gap of around • The first is cut CH4 emissions faster than shown
200 Gt which needs to be closed if the defined in Exhibit 9, achieving at very least the 51%
climate objective – a 50% chance of limiting to assumed in the IPCC scenarios, but ideally
1.5°C warming and 90% chance of limiting to considerably more. Our next steps will include
2°C – is to be met. Indeed, the gap is likely to be more detailed analysis of the potential to cut
higher still, since our estimated likely CH4 emission CH4 emissions, and in particular for achieving
reduction of 40% is less than the median 50% significant early reductions in the 2020s.
reduction which the IPCC assumes in its scenarios.
• The second is to accelerate the pace of CO2
The overshoot gap primarily arises because the and N2O reductions whether in the EBIT or
shape of the CO2 emissions trajectory described by AFOLU sectors. In EBIT, this would require
our illustrative base case scenario is significantly faster decarbonisation of power, transport,
“back-ended”. Thus, as the left-hand side of building and industry than we have assumed,
Exhibit 10 shows, emissions fall far more slowly in together with a strong focus on energy
the 2020s than in the illustrated IPCC scenarios productivity improvement. For instance, if
which are compatible with no / low overshoot of one could move to scenario B rather than A,
the 1.5°C climate objective. The P1 scenario makes this would reduce cumulative emissions by 72
ambitious assumptions for low energy demand Gt CO2. In the AFOLU sector, it would require
by 2050 to avoid reliance on negative emissions faster progress to cease deforestation and
technologies such as Bio-Energy with Carbon peatland conversion into agricultural land.
Capture and Storage (BECCS) whereas the P3
‘middle-of-the-road’ pathway utilises negative • The third is to actively remove CO2 from the
emissions technologies to a limited degree from atmosphere via “carbon dioxide removals”.
around mid-Century onwards. ETC estimates
20Reaching climate objectives: the role of carbon dioxide removals | ETC Consultation paper
PRELIMINARY
Global, Scenario A EBIT AFOLU Waste
Total annual gross emissions across sectors
Carbon Dioxide, Gt CO2/year Nitrous Oxide, Gt CO2e/year Methane, Mt CH4/year
60 50 400 Methane reduction roughly in line with
IPCC assumption (40-50% reduction)
55 45
350
2050 net
50
40 emissions =
45 300 232 Mt CH4
35
40
250
35 2050 net 30 2050 net
emissions = emissions =
30 2 Gt CO2 25 2 Gt CO2e 200
25 20
150
20
15
15 100
10
10
50
5 5
0 0 0
2020 2030 2040 2050 2020 2030 2040 2050 2020 2030 2040 2050
Source: SYSTEMIQ analysis for the ETC based on: IEA (2017), Energy Technology Perspectives; IEA (2020), Energy Technology Perspectives; Previous analyses of the Energy Transitions
Commission; IPCC (2018) Special Report for 1.5C
Exhibit 9: Total emissions show a decline towards 2050.
Global, Scenario A PRELIMINARY
Total annual gross emissions across sectors3, shown in contrast with IPCC
limited overshoot 1.5 C pathways for net emissions Cumulative emissions across sectors and compared with the carbon budget
Gt CO2/year Gt CO2
EBIT P1 IPCC Illustrative
AFOLU Model Pathway 1 686
45
Waste P3 IPCC Illustrative 57
Model Pathway 2 628
1
40
35
30
500
25
20
15
186
10
5
0
EBIT WASTE AFOLU Net Carbon Overshoot
emissions cumulative budget Gap
-5 emissions
2020 2030 2040 2050
Source: SYSTEMIQ analysis for the ETC based on: IEA (2017), Energy Technology Perspectives; IEA (2020), Energy Technology Perspectives; Previous analyses of the Energy Transitions
Commission; IPCC (2018) Special Report for 1.5C
Note: (1) P1= an ambitious scenario which assumes social and technical innovation drive rapid decarbonization through low energy demand assumptions and investment in afforestation. (2) P3
= A middle of the road scenario which assumes societal and technological development roughly follow historical patterns and drive net emissions reduction by changing the way energy and
products are produced. IPCC Integrated Assessment Models modelled 42 scenarios for >1.5C, typically draws on multiple data sources and forward projections, meaning that some variation in
starting points is expected (see exhibit 1). (3) Point-source CCS assumed as part of within-sector decarbonization for EBIT sectors.
Exhibit 10: Total CO2 emissions show a decline towards 2050; cumulative emissions are 186 Gt CO2 above the
carbon budget.
21You can also read