RETAIL AND EMPLOYMENT ASSESSMENT MARSDEN PARK NORTH
←
→
Page content transcription
If your browser does not render page correctly, please read the page content below
RETAIL AND
    EMPLOYMENT
    ASSESSMENT
    MARSDEN PARK NORTH

AUGUST 2018
PREPARED FOR ANGLISS PROPERTY GROUP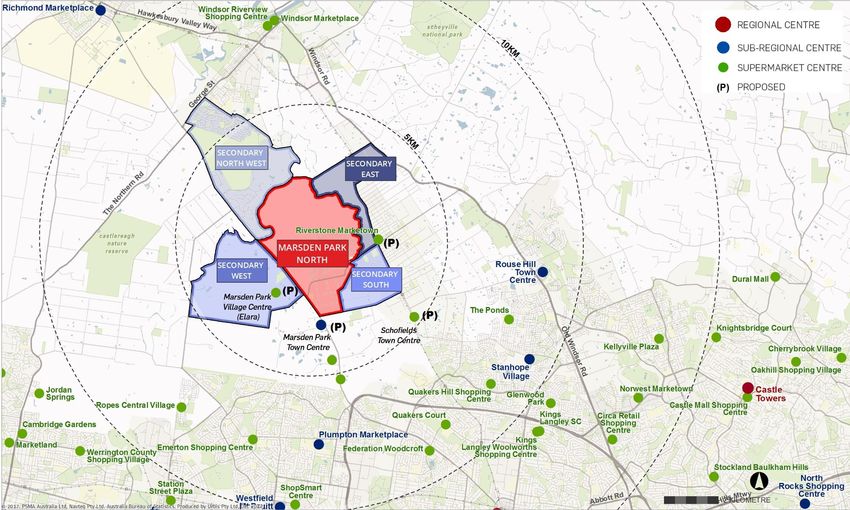
URBIS STAFF RESPONSIBLE FOR THIS REPORT WERE:
Director                    Princess Ventura, David Wilcox
Consultant                  Chinmay Chitale
Research Analyst            Geri Marks
Project Code                PER0689
Report Number               RP4 FINAL

© Urbis Pty Ltd
ABN 50 105 256 228

All Rights Reserved. No material may be reproduced without prior permission.

You must read the important disclaimer appearing within the body of this report.

urbis.com.au
CONTENTS

TABLE OF CONTENTS
Executive Summary ............................................................................................................................................. i
Introduction ........................................................................................................................................................ 1
1.      Marsden Park North Precinct ................................................................................................................ 2
2.      Population and demographic analysis .................................................................................................. 6
2.1.    Historical and Forecast Population Growth .......................................................................................... 6
2.2.    Demographic Analysis .......................................................................................................................... 6
3.      Retail Supportability Assessment ....................................................................................................... 13
3.1.    Trade Area Analysis............................................................................................................................ 13
3.2.    Trade Area Population ........................................................................................................................ 15
3.3.    Trade Area Spending .......................................................................................................................... 16
3.4.    Competitive Environment .................................................................................................................... 18
4.      Retail Demand Assessment ............................................................................................................... 23
4.1.    Market Shares and Supportable Floorspace at Capacity ................................................................... 23
4.2.    Supermarket Retailing At Capacity ..................................................................................................... 24
4.3.    Discount Department Store At Capacity ............................................................................................. 26
4.4.    Specialty Floorspace........................................................................................................................... 27
4.5.    Staging ................................................................................................................................................ 28
4.6.    Indicative Land Requirement .............................................................................................................. 29
4.7.    Richmond Road Commercial Precinct ................................................................................................ 29
4.8.    Employment Benefits .......................................................................................................................... 30
5.      Retail Success Factors ....................................................................................................................... 32
5.1.    Success Factors for Retail Development............................................................................................ 32
5.2.    Recommendations .............................................................................................................................. 33
6.      Non-Retail Employment Assessment ................................................................................................. 34
6.1.    North West Growth Area – Land Use and Infrastructure Implementation Plan .................................. 34
6.2.    Assessment of Employment Lands Drivers ........................................................................................ 37
6.3.    Local Population Driven Employment ................................................................................................. 40
6.4.    Regional Employment Uses ............................................................................................................... 44
6.5.    Employment Staging ........................................................................................................................... 56
7.      Economic Impacts on Surrounding Employment Precincts ................................................................ 58
8.      Conclusion .......................................................................................................................................... 61
Disclaimer ........................................................................................................................................................ 63

Appendix A                Eden Biosphere
Appendix B                Grounds of Alexandria F&B Precinct

URBIS
MARSDEN PARK NORTH RETAIL AND EMPLOYMENT
ASSESSMENT
EXECUTIVE SUMMARY
Urbis has been commissioned to undertake an update of a previous Retail and Employment Assessment
commissioned in 2015 to inform the planning of the Marsden Park North Precinct.
The findings of this assessment do not preclude the rezoning of the Marsden Park North precinct.
The key findings of this report are:
Population and Demographic Analysis
Marsden Park North is a 1,227-hectare release area, in Sydney’s North-West Growth Area (NWGA). Its
estimated dwelling and population capacity under the draft Indicative Layout Plan (ILP) are:
6,312 additional dwellings
20,198 new residents (based on an average household size of 3.2 persons per dwelling)
The future demographic profile of Marsden Park North is expected to mirror other urban fringe release areas.
To identify this profile, other recently completed release area case study in North West Sydney (includes
Kellyville Ridge, Stanhope Gardens and Parklea) was analysed looking at their changing demographic
profile between the 2006 and 2016 Census surveys, as they were developed.
The key findings show the following:
Between 2006 and 2016 consistently high average household income growth was observed in the
release area case study (over 10 years), with an average household income of $142,178 in 2016, 20%
above the Sydney benchmark
The substantial change to socio-demographic indicators seen in the release area case study between
2006 and 2016 reflects the migration of new residents who have incomes above the average in NWGA,
Blacktown LGA and the Hills Shire
The above average income profile is reflective of the high employment participation and couple families
amongst new residents in release areas
In addition, these areas typically attract fewer low income groups such as unemployed residents, renters,
students and retirees
The lower representation amongst lower income groups is due to the income required to service a
mortgage (and income / equity requirements by mortgage lenders)
The household income of the release area case study reflects the price point of its housing stock,
highlighting that average income households are less able to afford to purchase property in new release
areas (when compared to the average income of the Blacktown and Hill Shire LGAs) - with more
affordable product types potentially attracting a different profile
The release area case study also attracts a younger average age than the Sydney average
The lower average age driven by a high proportion of residents in early to middle stages of their careers
and younger families, illustrated by a high proportion of residents aged 25-39 years and 0-13 years
A high proportion of family households, forming approximately 88% of all households in 2016
A low unemployment rate, which increased marginally from 3.3% in 2006 to 4.0% by 2011 as the release
area was developed, and substantially below the unemployment rate across the North-West Growth
Area (NWGA)
Release areas typically attract residents with higher education attainment in all education categories
compared to the NWGA
The highest represented education category is Bachelor degree or higher, showing the ability of the
region to attract highly educated residents
The influx of new residents has shifted the workforce from blue collar to white collar / services industries,
which will have an impact on the type of job demand expected in the Marsden Park North Precinct
URBIS
MARSDEN PARK NORTH RETAIL AND EMPLOYMENT ASSESSMENT EXECUTIVE SUMMARY i
The most dominant industries of employment in the release area case study in 2016 were public and
health services, closely followed by the professional and administrative services.
Retail Demand Assessment
To assess the floorspace and turnover potential for a retail centre within Marsden Park, this report addresses
the demand for retail floorspace, specifically noting:
Population growth. The retail trade area has been defined to extend beyond Marsden Park North and
includes Marsden Park, Bligh Park, part of Riverstone West and Riverstone and part of West Schofield.
The retail assessment has regard to the underlying assumption of 6,312 new dwellings on completion at
Marsden Park North on the basis of reaching 400 dwellings completions per annum at capacity
The trade area is expected to contain 11,730 residents in 2017 and grow to 63,040 by 2041. The
primary trade area will account for 33% of the trade area population in 2041
Market growth. Total retail spending in 2017 is estimated at $165 million. By 2041, when Marsden Park
North and Marsden Park are expected to reach capacity, total retail spending is forecast to reach $1.2
billion ($2017)
Retail floorspace potential. In assessing the supportability of retail floorspace within Marsden Park
North, we have had regard to the location of the precinct, proposed dwelling capacity, population
forecasts attributed to this and the existing and proposed competitive retail environment. By assessing
capacity and other development factors, we recommend a sub-regional centre of approximately
17,900sq.m be delivered by 2031.
More specifically, the breakdown of floorspace is as follows:
7,000 sq.m discount department store (DDS)
3,500 sq.m full-line supermarket
1,400 sq.m mini-majors
4,300 sq.m of specialty shops
1,700 sq.m of non-retail floorspace.
The market assessment assumes that the majority of future retail floorspace will be built within a
single shopping precinct to the south of Garfield Road.
Average trading levels in the initial years of trade are expected to be below the Urbis Retail Averages.
The trading levels however, for the supermarket and DDS are expected to increase in response to
population growth and as they establish their presence within this market.
In practice, retail operators may seek to open early in the development phase in order to gain first-mover
advantage, as well as provide amenity and services for early residents. This in turn can assist in
increasing the take-up rate of residential development within the land release precincts. In these
precincts, retailers may be willing to accept lower productivity rates in initial years, with the prospect of
strong year on year growth.
Employment benefits. The 17,900 sq.m retail centre considered supportable on the site based on a
high case would generate direct employment of approximately 660 full time and part-time workers from
ongoing operations. Overall, the centre will generate employment benefits of 790 jobs per annum
throughout the economy (both direct and indirect) from ongoing operations and 62 annual equivalent
jobs during the retail construction phase.
Indicative land requirement. It is expected that the development of a 17,900 sq.m sub regional
shopping centre (at capacity) could require around 5.1 hectares of land based on the typical sub regional
centre car parking provision of 5.22 car parks per 100sq.m (total centre).
If additional local centres are provided within the precinct (consistent with the finalised ILP), the scale of
retail provided in each centre will impact on the performance of the others. We therefore expect that the
location that is eventually developed to accommodate a supermarket will be the focal point for retail
activity. In the absence of a supermarket anchor, we expect that smaller local centres would have
limited top-up retail provision and may instead be focused on non-retail community / leisure uses.
ii EXECUTIVE SUMMARY URBIS
MARSDEN PARK NORTH RETAIL AND EMPLOYMENT ASSESSMENT
Non-Retail Employment Assessment
The Non-Retail Employment Assessment considers the future demand for employment land from a range of
businesses. This provision of facilities is based on high-level benchmarking against population thresholds.
Urbis Social Advisory is undertaking more detailed analysis of supply and optimal delivery outcomes of
community facilities in the Marsden Park North Community Facility and Open Space (CFOS) Report.
Specifically, Urbis has undertaken analysis of the following:
Strategic planning policy relating to the provision of employment lands in the North-West Growth Area
(NWGA)
Jobs growth from businesses servicing the Marsden Park North (MPN) population
The capacity of the Marsden Park North precinct to attract businesses / services that have a regional
catchment servicing the broader NWGA, which will consider the following:
Commercial drivers for attracting potential employment uses / businesses serving a regional
catchment
MPN’s competitive position relative to other NWGA precincts
Analysis of the Strengths, Weaknesses, Opportunities and Threats (SWOT) of the Marsden Park
North precincts
Competing supply of regional businesses / services
Potential ‘out of the box’ business ideas that could be accommodated in the MPN not provided for
elsewhere.
Given the extent to which regional employment services are provided elsewhere, and the relative competitive
position of Marsden Park North discussed we do not think that there is market demand to support regional
employment uses in the Marsden Park North Precinct. The main reasons for this are:
Significant supply of surrounding employment lands (Industrial and Business Park precincts)
Marsden Park North lacks the competitive commercial drivers that typify successful employment land
precincts, such as infrastructure, access to main roads and outbound market
It is noted in previous employment and retail studies (MacroPlan Dimasi, Marsden Park and Hill PDA,
Box Hill) that there is sufficient capacity within the current undeveloped zoned land to accommodate
future industrial development
Many of the regional employment uses require either co-location with regional retail centres, business
parks and transport infrastructure or access to an outbound market.
In addition to retail, there are a number of potential uses that suit the existing rural character of the precinct,
and are compatible with the strong population growth forecast for the area:
An eco-biosphere that would be targeted at attracting tourism into the NWGA
A destinational café/restaurant venue, combining high quality indoor and outdoor areas (combined with
the Town Centre).
The combined ongoing employment impact of both is approximately 300 jobs.
Despite this, the majority of jobs in Marsden Park North will be driven by the local population. At full
development, Marsden Park North has potential to support the following uses:
Approximately 1,200 sq.m of commercial office space. This assumes that around 20% of population
driven demand for office space will be self-contained, with the balance of demand to be serviced by
higher order business locations.
Commercial space will be located within the centre, suitable for businesses servicing a local population
base, likely in the form of smaller strata office suites.
Early childhood (9 childcare centres) and primary schools (2 public primary schools)
URBIS
MARSDEN PARK NORTH RETAIL AND EMPLOYMENT ASSESSMENT EXECUTIVE SUMMARY iii
3 medical centres/practices and 2 retirement villages, which will consist of co-located independent living
unit and retirement aged care facilities.
1 district centre – to serve as a Community Resource Hub (CRH) (refer to Marsden Park North CFOS
report). This will integrate potential uses such as a branch library and youth centre.
An estimated 550 employed in home businesses.
Marsden Park North will support approximately 1,536 total direct full-time, part-time and casual jobs from
ongoing operations and provide up to 41,800 sq.m of employment generating floorspace.
In addition to this, there will be broader employment benefits associated with construction employment
generated during the development of Marsden Park North and indirect jobs created through suppliers
servicing businesses located in Marsden Park North.
iv EXECUTIVE SUMMARY URBIS
MARSDEN PARK NORTH RETAIL AND EMPLOYMENT ASSESSMENT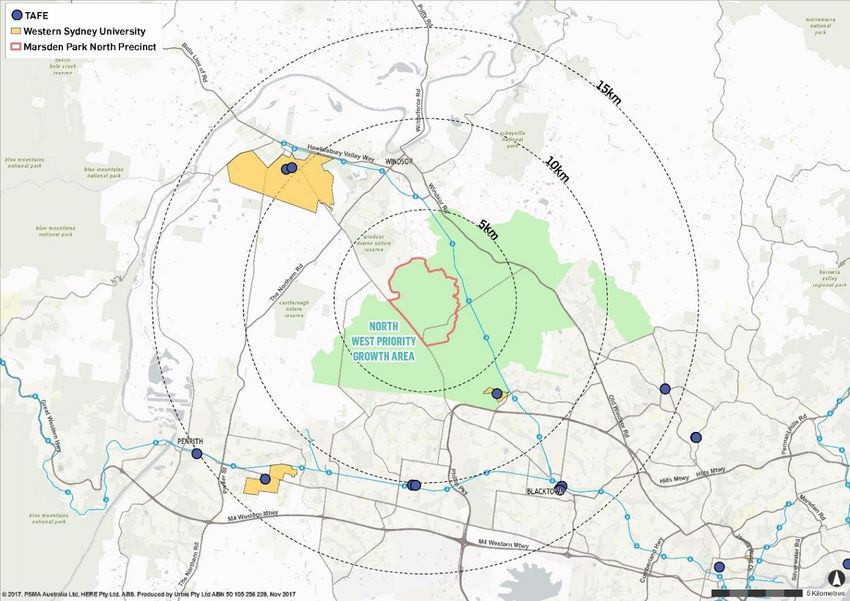
INTRODUCTION
Urbis has been appointed to undertake an update of a Retail and Employment Assessment previously
commissioned in 2015. This report will be packaged along with a number of new and existing technical
reports as part of the NSW Government Precinct Acceleration Protocol process used to accelerate
development across the precinct. The terms of reference are attached in Appendix A.
Marsden Park North is a 1,227-hectare release area, in Sydney’s North-West Growth Area (NWGA). As part
of this update, NSW Department of Planning and Environment have revised dwelling and population
assumptions for Marsden Park North, following a number of technical studies and consultations. The revised
assumptions at capacity are:
6,312 additional dwellings
20,198 new residents (based on an average household size of 3.2 persons per dwelling)
These revised assumptions take regard for the number of approximate dwellings outlined within the current
draft Indicative Layout Plan (ILP) for Marsden Park North. These estimates reflect the amount of available
developable land assessed through recent technical investigations under the Precinct Acceleration Protocol.
The previous 2015 Retail and Employment Assessment considered a range of dwelling yield scenarios given
the uncertainty surrounding the amount of non-flood affected land within the precinct. The revised
assumptions within this update now replace the initial dwelling yield scenarios.
The analysis and findings of the report are outlined in the following sections:
Section 1 provides an overview of the proposed precinct release
Section 2 analyses the historic, existing and future resident population in Marsden Park North,
considering the implications of the Precinct’s future workforce, resident population and demographic
profile
Section 3 considers the competitive environment for retail centres within the release area
Section 4 analyses the demand for retail services
Section 5 outlines the critical success factors for retail in Marsden Park North
Section 6 conducts an analysis of the key drivers for non-retail employment, including employment in
industrial, office / commercial and local services (e.g. health, education and community services) across
both a local Marsden Park North precinct catchment and broader regional market catchment
Section 7 considers the economic impact of Marsden Park North on surrounding precincts
Section 8 provides a summary of conclusions and recommendations.
URBIS
MARSDEN PARK NORTH RETAIL AND EMPLOYMENT ASSESSMENT INTRODUCTION 1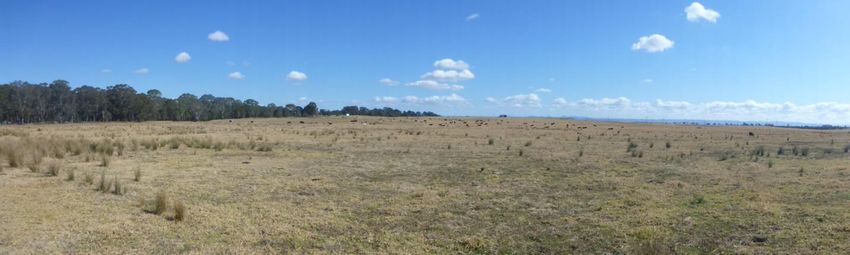
1. MARSDEN PARK NORTH PRECINCT
The Marsden Park North Precinct is a part of the North-West Growth Area (NWGA), which was created in
2005 to manage future land releases and associated population growth Sydney’s North West urban fringe.
The NWGA is expected to yield a total of 90,000 new dwellings resulting in a population of approximately
250,000 new residents (Source: NSW Department of Planning & Environment).
The NWGA is broken into 16 precincts, which are being released progressively. To date the following
precincts have been released, and are expected to collectively accommodate 50,000 new dwellings:
Alex Avenue
Box Hill
Box Hill Industrial.
Colebee
Cudgegong Road Station (Area 20)
Marsden Park
Marsden Park Industrial
North Kellyville
Riverstone
Riverstone West
Schofields
Townson Road
West Schofields
Vineyard
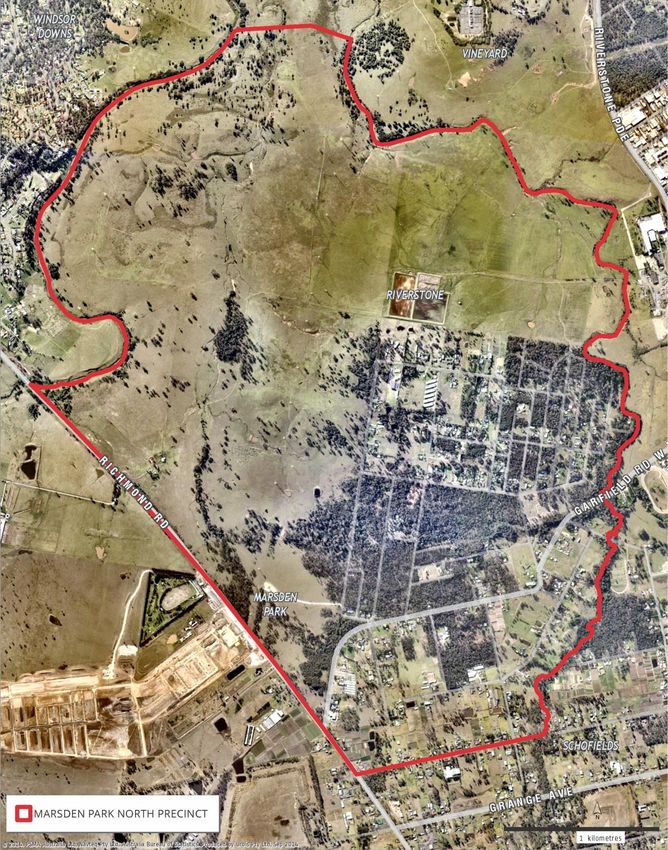
Marsden Park North is bound by Richmond Road to the south west, Vine Street to the south, South Creek to
the north and Eastern Creek to the east. It is semi-rural in nature, with much of the area currently occupied
by farmland and low-density residential housing.
Marsden Park North was released for planning in June 2014, under the NSW Government Precinct
Acceleration Protocol and is currently undergoing master planning.
The Marsden Park North Precinct is 1,227 ha in size and is expected to accommodate approximately 6,312
dwellings and 20,198 new residents at an average household size of 3.2 persons per dwelling. This dwelling
yield reflects the amount of available developable land in Marsden Park North.
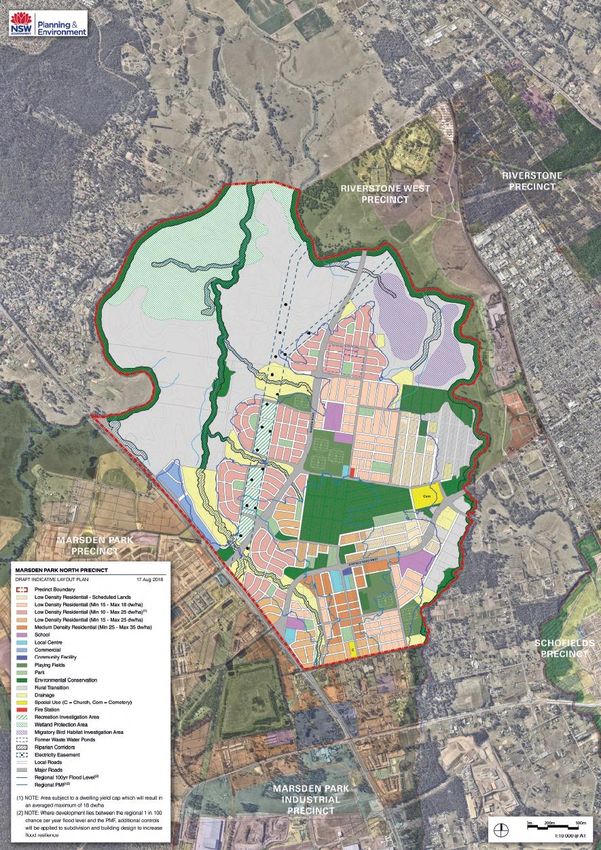
Pictures 1 and 2 overleaf show the rural nature of Marsden Park North. Map 1.1 shows an aerial map of the
precinct, while Map 1.2 shows an indicative concept plan layout of the precinct.
2 MARSDEN PARK NORTH PRECINCT URBIS
MARSDEN PARK NORTH RETAIL AND EMPLOYMENT ASSESSMENTPicture 1 – Marsden Park North Picture 2 – Marsden Park North URBIS MARSDEN PARK NORTH RETAIL AND EMPLOYMENT ASSESSMENT MARSDEN PARK NORTH PRECINCT 3
Marsden Park North Precinct                                             Map 1.1

4 MARSDEN PARK NORTH PRECINCT                                                  URBIS
                                MARSDEN PARK NORTH RETAIL AND EMPLOYMENT ASSESSMENT
Marsden Park North Indicative Layout Plan Map 1.2 Source: NSW DPE URBIS MARSDEN PARK NORTH RETAIL AND EMPLOYMENT ASSESSMENT MARSDEN PARK NORTH PRECINCT 5
2. POPULATION AND DEMOGRAPHIC ANALYSIS
There will be a strong connection between workforce, resident population and the total amount and type
employment land growth that can be supported within the Marsden Park North precinct.
As such a review of the demographic patterns across North West Sydney has been conducted with specific
reference to comparable release areas which provide an indication of the potential resident and worker
profile of Marsden Park North.
2.1. HISTORICAL AND FORECAST POPULATION GROWTH
In June 2014, the Marsden Park North Precinct, located in the North-West Growth Area, was formally
released for planning by the NSW Minister for Planning and Environment under the Precinct Acceleration
Protocol.
For the 1,227 hectare Marsden Park North Precinct, preliminary estimates indicate that the site could
accommodate up to 6,312 new homes for approximately 20,198 new residents. These figures reflect
dwelling and population estimates outlined within the draft ILP for Marsden Park North. They have been
informed by findings from relevant environmental investigations that have assessed the quantum of
developable land within the precinct.
The following section considers the population growth of the subject area, as this reflects the forecast
dwelling production and capacity of the Marsden Park North precinct. Other key assumptions are provided
below:
As no housing mix has been confirmed, Urbis have calculated population using the average household
size of 3.2 persons per dwelling. This is based on the recommendation of Blacktown City Council
Urbis have assumed first dwellings in Marsden Park North to be completed by 2021, with dwelling take-
up ramping up to reach 400 dwellings per annum from 2026. This reflects a preliminary development
programme of staged delivery across sub-precincts within Marsden Park North.
Population Growth
MARSDEN PARK RELEASE AREA TABLE 2.1
2016-21 2021-26 2026-31 2031-36 2036-41
Dwelling Yield
Marsden Park North 50 1,075 3,050 4,878 6,312
Average Household Size 3.2 3.2 3.2 3.2 3.2
Population 2021 2026 2031 2036 2041
Marsden Park North 160 3,440 9,760 15,608 20,198
Annual Population Growth (no.)
2021-26 2026-31 2031-36 2036-41
Marsden Park North 656 1,264 1,170 918
Note: As at June 30
Source: NSW Department of Planning and Environment; Blacktown City Council; Urbis
2.2. DEMOGRAPHIC ANALYSIS
A comparative analysis of the demographic characteristics of both the NWGA and other release areas
(referred to the Release Area Case Study in this analysis) has been undertaken to identify the future
demographic profile of Marsden Park North.
6 POPULATION AND DEMOGRAPHIC ANALYSIS URBIS
MARSDEN PARK NORTH RETAIL AND EMPLOYMENT ASSESSMENTThe geographic areas used to develop a release area benchmark includes three suburbs in the north-
western region of Sydney that were earlier greenfield release precincts, similar to what is anticipated for the
Marsden Park North precinct. These suburbs have undergone the majority of their development between
2003 and 2011 and hence their shifting demographic profile can be seen across the 2006, 2011 and 2016
Census years.
The analysis of these areas has been used to forecast the types of residents that are likely to move into the
Marsden Park North precinct, and includes:
The Ponds
Stanhope Gardens
The Alex Avenue Precinct in Schofields.
This approach to identifying the future demographic profile of Marsden Park North is consistent with other
demographic assessments (e.g. Marsden Park and Schofields).
Table 2.2 overleaf summarises the key demographic statistics for Marsden Park, the North-West Growth
Area and the Release Area Case Study across the 2006, 2011 and 2016 Census years. The key points to
note from the table include:
The suburb of Marsden Park is still characterised by semi-rural housing with a low resident population.
As such, the suburb’s socio-economic profile is expected to change dramatically as the precinct
becomes developed.
The substantial change to socio-demographic indicators seen in the Release Area Case Study reflects
the migration of new residents who have incomes above the average in NWGA, Blacktown LGA and the
Hills Shire
The above average income profile is reflective of the high employment participation and couple
families amongst new residents in subject areas
In addition, these areas typically attract fewer low income groups such as unemployed residents,
renters, students and retirees.
The average household income and average income per capita in Marsden Park has continually
increased over the past 10 years
Similarly, the NWGA has experienced steady growth in average household incomes across the 10-year
period and has also seen a higher per capita over this period than Marsden Park
The average age within Marsden Park has increased continually from 2006 to 2016.
The Release Area Case Study has the youngest average age at 29.5 years old compared to 41.3 years
in Marsden Park, 33.9 years in the NWGA and 34.6 years in the Blacktown LGA and Hills Shire in 2016
The average household sizes of the NWGA and Blacktown LGA and Hills Shire have increased in the
2006 to 2016 period
The average household size in the Release Area Case Study also rose from 3.2 to 3.5 persons
alongside an increase in family households from 89.8% to 92.2% from 2006 to 2016
The housing type in the Release Area Case Study illustrates that developments with an appropriate mix
of detached and attached dwellings are well received by the market for new release precincts
The Release Area Case Study’s housing type reflects the structure of most release precincts with
attached and higher density dwellings co-located with the town centre
Marsden Park has experienced a decrease in the proportion of family households accounting for 72.7%
in 2006 to 68.0% in 2016. The Release Area Case Study has the largest proportion of family
households, representing 92.2% of all households in 2016
The demographic profile indicates that young families with a high rate of employment participation are the
typical household moving into new release areas. The Release Area Case Study has a higher household
income than the average in Blacktown and The Hills Shire, consistent with its age profile which typically has
above average workforce participation (compared to groups such as retirees and students).
URBIS
MARSDEN PARK NORTH RETAIL AND EMPLOYMENT ASSESSMENT POPULATION AND DEMOGRAPHIC ANALYSIS 7It is also important to recognise that the Release Area Case Study’s demographic profile reflects the
households that could afford to purchase into these suburbs attracting a different profile.
8 POPULATION AND DEMOGRAPHIC ANALYSIS URBIS
MARSDEN PARK NORTH RETAIL AND EMPLOYMENT ASSESSMENTKey Demographic Changes
Subject Areas 2006 - 2016 Table 2.2
Marsden Park Suburb North West Growth Area Blacktown LGA and Hills Shire Release Area Case Study
2006 2011 2016 2006 2011 2016 2006 2011 2016 2006 2011 2016
Average Household Income $56,853 $67,754 $90,738 $67,913 $78,035 $113,207 $77,085 $93,507 $110,164 $93,048 $123,589 $142,178
Average Per Capita Income $21,027 $28,783 $34,007 $23,591 $29,260 $38,360 $25,736 $30,729 $30,729 $29,205 $36,742 $41,988
Average Age (years) 35.5 38.6 41.3 35.0 37.8 33.9 33.6 34.6 34.6 28.9 28.9 29.5
Average Household Size 2.8 2.5 2.6 2.9 2.7 3.1 3.1 3.1 3.2 3.2 3.3 3.5
Family Households 72.7% 64.8% 68.0% 78.0% 73.9% 82.8% 83.1% 83% 84% 89.8% 91.2% 92.2%
Unemployment Rate 4.4% 5.5% - 4.5% 5.1% - 5.5% 6.1% - 3.0% 4.0% -
Note: Employment Data for 2016 Census awaiting release
Source: ABS 2006, 2011 and 2016 Census; Urbis
Housing Profile
Subject Areas 2006 - 2016 Table 2.3
Marsden Park Suburb North West Growth Area Blacktown LGA and Hills Shire Release Area Case Study
2006 2011 2016 2006 2011 2016 2006 2011 2016 2006 2011 2016
Detached 72.4% 57.1% 58.1% 91.0% 88.3% 87.8% 85.3% 83.8% 79.9% 98.1% 89.4% 76.6%
Medium Density 0.8% 2.4% 0.9% 1.8% 4.0% 8.0% 10.0% 11.0% 14.7% 1.0% 6.8% 20.5%
High Density 0.0% 0.6% 0.0% 1.6% 0.4% 0.3% 4.1% 4.9% 5.3% 0.8% 3.8% 3.1%
Other 26.8% 39.8% 42.2% 5.6% 7.3% 4.7% 0.6% 0.3% 0.3% 0.1% 0.0% 0.0%
Source: ABS 2006, 2011 and 2016 Census; Urbis
URBIS
MARSDEN PARK NORTH RETAIL AND EMPLOYMENT ASSESSMENT POPULATION AND DEMOGRAPHIC ANALYSIS 9In addition to the above analysis, we have also reviewed particular demographic characteristics in more
depth for the 2016 Census years and benchmarked these to the Greater Capital City Statistical Area. The
industry of employment uses numbers from the 2011 Census as the 2016 figures have been recalled by the
ABS.
The key take outs and implications of this analysis have been outlined below, with the data presented in the
charts on the following pages.
It must be noted that a comparison between the 2011 and 2016 Census data has not been included in this
component due to changes in the reporting of data across the Census years.
Age: Chart 2.1 on the subsequent page shows the age distribution of the residents that live within Marsden
Park, the NWGA and the Release Area Case Study and compare these to the Sydney benchmark in the
2016 Census.
The chart shows that the subject areas have a lower average age compared to the Greater Sydney
Benchmark (with the exception of Marsden Park who have a high proportion of retirees). This trend is shown
where there is a higher proportion of people aged 60+ and a lower proportion of people aged 0-14 in the
Sydney Benchmark.
Household Income: Chart 2.2 shows the Marsden Park, NWGA and Release Area Case Study household
income distribution in 2016 and benchmarks these to the Greater Sydney Area.
The Release Area Case Study has the highest proportion of households (39%) earning over $156,000 in
2016. The rapid increase in household income reflects the higher rate of employment and workforce
participation amongst new households moving into these areas.
Dwelling Tenure: Chart 2.3 displays the type of dwelling tenure for the residents of Marsden Park, the
NWGA and the Release Area Case Study in 2016 and compares this to the Sydney benchmark.
The chart indicates that the Release Area Case Study has a significantly high proportion of mortgage holders
(68.7%) and is a reflection of a younger population, in particular young families buying their first home. This
trend illustrates that the residents that are likely to move into the Marsden Park North area are more likely to
purchase housing rather than rent.
Industry of Employment: Chart 2.4 shows the industry of employment of the residents for the 2016
Census.
The most dominant industries of employment in 2016 across the NWGA are blue collar industries of
manufacturing, transport and wholesale trade industries. The proportion of residents employed in these
industries is well above the proportion across the Sydney benchmark.
Other significant industries of employment for the residents of the NWGA include public and health services
as well as retail trade and accommodation industries.
The most dominant industries of employment in the Release Area Case Study in 2016 were the public and
health services sector (26%), closely followed by professional and administrative services (24%) and
manufacturing, transport and wholesale trade (22%).
The influx of new residents has shifted the workforce from blue collar to white collar and services industries,
which will have an impact on the type of job demand expected in the Marsden Park North Precinct.
10 POPULATION AND DEMOGRAPHIC ANALYSIS URBIS
MARSDEN PARK NORTH RETAIL AND EMPLOYMENT ASSESSMENTAge Distribution 2016
Subject Areas Vs Sydney Benchmark (2016 Census) Chart 2.1
0% 20% 40% 60% 80% 100 %
Marsden Park Suburb 15% 12% 22% 22% 29%
North West
23% 12% 26% 25% 15%
Growth Centre
Release Area
29% 11% 28% 25% 7%
Case Study
Sydney
19% 13% 23% 26% 19%
(Benchmark)
Aged 0-14 Aged 15-24 Aged 25-39 Aged 40-59 Aged 60+
Source: ABS 2016 Census; Urbis
Household Income 2016
Subject Areas Vs Sydney Benchmark (2016 Census) Chart 2.2
0% 20% 40% 60% 80% 100 %
Marsden Park Suburb 36% 8% 25% 16% 17%
North West
18% 5% 27% 25% 25%
Growth Area
Release Area
6% 3% 21% 31% 39%
Case Study
Sydney
22% 6% 27% 20% 23%
(Benchmark)
$Nil - $41,600 $41,600 - $52,000 $52,000 - $104,000 $104,000 - $156,000 $156,000+
Source: ABS 2016 Census; Urbis
URBIS
MARSDEN PARK NORTH RETAIL AND
EMPLOYMENT ASSESSMENT POPULATION AND DEMOGRAPHIC ANALYSIS 11Dwelling Tenure 2016
Subject Areas Vs Sydney Benchmark (2016 Census) Chart 2.3
80.0%
Owner Purchaser Renter
68.7%
70.0%
60.0% 55.0%
50.0% 47.4%
40.0%
34.2%35.0%
28.6% 28.5% 29.9%
30.0% 27.7%
21.2% 20.5%
20.0%
12.2%
10.0%
0.0%
Marsden Park Suburb North West Release Area Sydney
Growth Area Case Study (Benchmark)
Source: ABS 2016 Census; Urbis
Industry of Employment 2016
Subject Areas Vs Sydney Benchmark (2016 Census) Chart 2.4
Agriculture, Mining 10% North West
6% Growth Area
and Other Services*
5%
Release Area
14% Case Study
Construction 7%
7%
Sydney
16% (Benchmark)
Retail Trade
15%
and Accommodation*
16%
Manufacturing, 25%
Transport 22%
and Wholesale Trade* 20%
Professional and 13%
24%
Administrative Services*
25%
Public and Health 21%
26%
Services*
26%
0% 5% 10% 15% 20% 25% 30%
Share of Workforce (%)
Note:
- Agriculture, Mining and Other Services includes 'Agriculture, forestry & fishing', 'Electricity, gas, water & waste services' and 'Other
services'
- Manufacturing, Transport and Wholesale Trade includes 'Manufacturing', 'Wholesale trade' and 'Transport, postal & warehousing'
- Retail Trade and Accommodation includes 'Retail trade' and 'Accommodation & food services'
- Professional and administrative services includes 'Information media & telecommunications', 'Financial & insurance services', 'Rental,
hiring & real estate services', 'Professional, scientific & technical services' and 'Administrative & support services'
- Public and Health Services includes 'Public Administration & safety', 'Education & training', 'Health care & social assistance' and 'Arts
& recreation services'
Source: ABS 2016 Census; Urbis
12 POPULATION AND DEMOGRAPHIC ANALYSIS URBIS
MARSDEN PARK NORTH RETAIL AND EMPLOYMENT ASSESSMENT3. RETAIL SUPPORTABILITY ASSESSMENT
This section provides an overview of the supportability of retail floorspace during the development of
Marsden Park North. More particularly, this section considers:
An appropriate trade area for retail development on the subject site
Estimated timing of residential development in Marsden Park North based on the potential delivery of
approximately 6,312 new dwellings (as identified by NSW DPE):
The current and proposed competitive environment in and around the trade area
The size of the retail spending market available to Marsden Park North.
From this we will assess the amount of retail floorspace supportable and estimated delivery of this floorspace
throughout the development period of Marsden Park North.
3.1. TRADE AREA ANALYSIS
The trade area refers to the area likely to be served by the retail component within Marsden Park North. The
definition of the trade area for any retail development is determined by a number of factors including:
The strength and attraction of the centre in question, determined by success factors such as
composition, layout, car parking and the presence of other local complementary uses
The proximity, composition, quality, size and diversity of retail, business services and community
facilities in competing retail centres
The accessibility of the subject centre in terms of road and public transport networks
Topography and other physical barriers such as rivers, railways and freeways
Proximity and accessibility to potential shoppers.
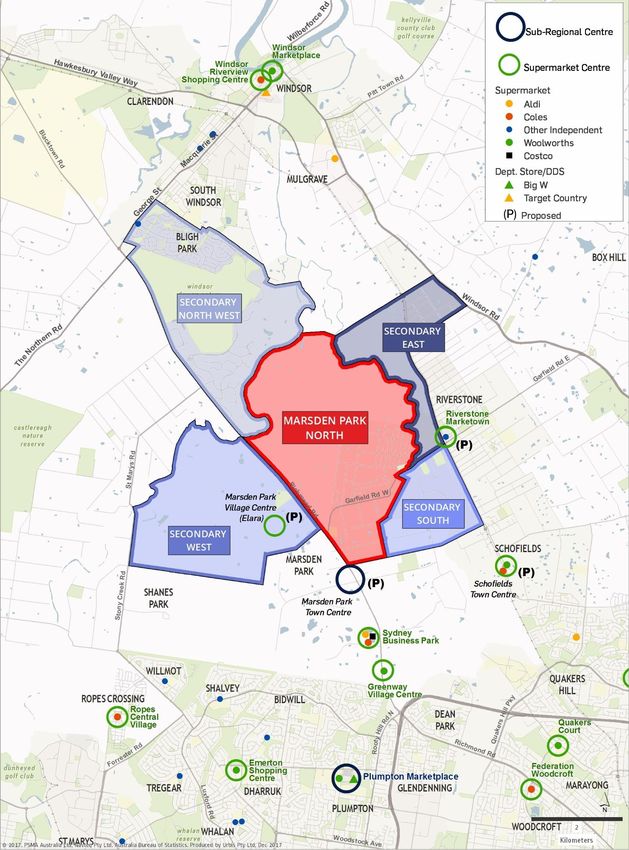
The adopted trade area has been based on ABS Mesh blocks surrounding the subject site. The initial
concept plan for the development indicate a centre is located within the middle of the precinct. On this basis,
we have defined the trade area sectors as follows:
Primary trade area extends over the entire Marsden Park North precinct.
Secondary west trade area extends over the majority of the Marsden Park residential precincts bound
by Stoney Creek Road along the west and Richmond Road to the east. This excludes the proposed
Marsden Park Town Centre and Marsden Park Industrial Area to the south.
Secondary north-west trade area extends from the north-western boundary of Marsden Park North
covering Windsor Downs to the east of Richmond Road and extending as far north as Bligh Park. The
area of Bligh Park is bound by George Street in the west and Rifle Range Road in the north. A large part
of this trade area is occupied by Windsor Downs Nature Reserve. This trade area sector falls outside of
the North-West Growth Area and has already been developed with low density residential uses.
Secondary north-east trade area covers the entire Riverstone West precinct and part of Riverstone.
These precincts both fall within the North-West Growth Area.
Secondary south trade area extends over the northern part of West Schofields precinct and Schofields
precinct. These precincts both fall within the North-West Growth Area.
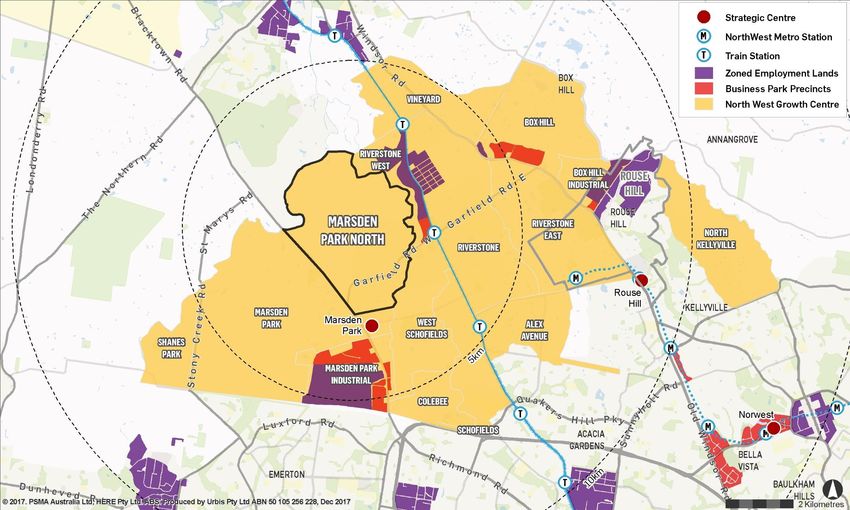
Map 3.1 over page shows the defined trade area and retail competition.
URBIS
MARSDEN PARK NORTH RETAIL AND EMPLOYMENT
ASSESSMENT RETAIL SUPPORTABILITY ASSESSMENT 13TRADE AREA AND COMPETITION Map 3.1
14 RETAIL SUPPORTABILITY ASSESSMENT URBIS
MARSDEN PARK NORTH RETAIL AND EMPLOYMENT ASSESSMENT3.2. TRADE AREA POPULATION
In assessing population forecasts we have had regard to the following information sources:
North West Growth Area Precinct Planning - NSW DPE
Assuming an annual dwelling take-up rate per annum that is consistent with aerial inspection of dwelling
take-up within master-planned communities in the North-West Growth Area
Marsden Park North population projections – NSW DPE
This assessment assumes that new residents will commence entering this market in 2021.
We note there is currently an existing resident population within Marsden Park North of 700 residents (2016
Census) located to the south-eastern area of the precinct. Development would largely be concentrated over
the western and north-western areas of the precinct and therefore these dwellings would be incorporated
with the proposed scheme of approximately 6,312 new dwellings.
Population forecasts for the trade area are shown in Table 3.1. The initial population for Marsden Park North
has been assumed at 2017. The key findings include:
In assessing population growth for the primary trade area and the subject development we have
assumed the development of approximately 6,312 new dwellings. It is noted that there are around 250
existing dwellings in the precinct as of 2016. Key assumptions on dwelling take-up and population
include:
Urbis have assumed that first dwellings in Marsden Park North be completed by 2021. It is expected
that capacity (up to 6,312 dwellings or 20,198 new residents) will be met by 2041.
Take up will eventually reach 400 dwellings per annum, based on an indicative delivery programme
of staged delivery across sub-precincts within Marsden Park North
An average household size of 3.2 persons has been applied in assessing the population to be
attributed to this development.
Growth in the total secondary trade area is largely attributed to Marsden Park which is proposed to have
capacity for around 23,500 residents on completion in 2029. The initial release of lots for this precinct
has commenced.
The secondary north-west is largely developed and therefore negligible growth has been forecast for this
precinct.
The secondary north east and secondary south contain parts of Riverstone and West Schofields.
Accordingly, an estimated proportion of the dwelling yield proposed has been attributed to these
precincts in assessing population forecasts.
The main trade area is expected to contain 18,930 residents in 2021 and grow to 63,040 by 2041. The
primary trade area will account for 33% of the total trade area population in 2041.
URBIS
MARSDEN PARK NORTH RETAIL AND EMPLOYMENT
ASSESSMENT RETAIL SUPPORTABILITY ASSESSMENT 15Trade Area Population
2017-2041 TABLE 3.1
Population
2017 2021 2026 2031 2036 2041
Primary:
Primary 690 850 5,330 11,730 17,210 20,890
Secondary:
West 2,040 7,640 17,080 23,480 23,480 23,480
South 1,060 1,060 2,570 7,370 7,850 7,850
North West 7,780 7,780 7,780 7,780 7,780 7,780
East 160 1,600 3,040 3,040 3,040 3,040
Total Secondary 11,040 18,080 30,470 41,670 42,150 42,150
Main Trade Area 11,730 18,930 35,800 53,400 59,360 63,040
Annual Population Growth (no.)
17-21 21-26 26-31 31-36 36-41
Primary:
Primary 40 896 1,280 1,096 736
Secondary:
West 1,400 1,888 1,280 0 0
South 0 302 960 96 0
North West 0 0 0 0 0
East 360 288 0 0 0
Total Secondary 1,760 2,478 2,240 96 0
Main Trade Area 1,800 3,374 3,520 1,192 736
Annual Population Growth (%)
17-21 21-26 26-31 31-36 36-41
Primary:
Primary 5.4% 44.4% 17.1% 8.0% 4.0%
Secondary:
West 39.1% 17.5% 6.6% 0.0% 0.0%
South 0.0% 19.4% 23.5% 1.3% 0.0%
North West 0.0% 0.0% 0.0% 0.0% 0.0%
East 77.8% 13.7% 0.0% 0.0% 0.0%
Total Secondary 13.1% 11.0% 6.5% 0.2% 0.0%
Main Trade Area 12.7% 13.6% 8.3% 2.1% 1.2%
Note: As at June 30
2017 figures account for existing population in trade area
Source: NSW Department of Planning and Environment; Urbis
3.3. TRADE AREA SPENDING
Retail spending estimates are derived using MarketInfo, a micro-simulation model developed by Market Data
Systems Limited (MDS). This model, which is based on information from the national ABS Household
Expenditure Survey (HES) and the Census of Population and Housing, uses micro-simulation techniques to
16 RETAIL SUPPORTABILITY ASSESSMENT URBIS
MARSDEN PARK NORTH RETAIL AND EMPLOYMENT ASSESSMENTcombine a household’s propensity to spend on particular commodities with the socio-economic
characteristics of individuals to derive spending per capita estimates on a small area basis.
Per Capita Spending
Chart 3.1 shows the variation in retail spending per capita by product group for the total trade area compared
to the Sydney average. All figures are shown in $2017 values including GST. Given there are currently
limited residents within the primary, secondary west, secondary south and secondary east trade areas we
have adopted the retail spending per capita available to residents within new and established
neighbourhoods that were previously residential release areas in North West Sydney. As such, this
represents a retail spending profile that could be achieved within the main trade area in the future.
The emerging profile of the future trade area residents in Marsden Park North and Marsden Park is likely to
make the overall trade area demographic profile increasingly affluent in the future.
The chart shows that the average retail spending per capita of main trade area residents in all product
groups (with the exception of food retail and bulky goods) is lower than the Sydney average. The lower per
capita spending reflects the lower average per capita incomes of main trade area residents. Food retail
which comprises food and groceries expenditure is in line with the Sydney average. Overall total retail
expenditure is -6% below the Sydney average made up of total food (- 4%) and non-food (-7%).
Retail Spending Per Capita Variation from Sydney
Main Trade Area, 2017 Chart 3.1
+3%
Variation from Sydney
-0%
Average
-3%
-4%
-6%
-7%
-10%
-15% -…
-16%
Food Food Apparel Homewares Bulky Leisure/ Retail Food Non-Food Total Retail
Retail Catering Goods General Services
Source: ABS; MarketInfo; Urbis
Current and Future Retail Spending Market
Based on retail spending per capita for trade area residents, the 2016 Census data and the population
forecasts provided in Table 3.2, the following table shows the size of the total retail spending market
available by 2041 by product group and primary trade area and main trade area. Specifically, this shows the
following:
Low current retail spending in the primary trade area can be attributed to Marsden Park North not yet
being developed, with limited residents currently within the trade area
Total retail spending in the primary trade area is forecast to increase significantly at an annual growth
rate of 16.5% between 2017 and 2041.
By 2041, Marsden Park North and Marsden Park in addition to other release precincts within the trade
area are expected to have completed and therefore reached capacity. As such, total retail spending in
the main trade area is forecast to reach $1.2 billion ($2017)
Total food (food retail and food catering) in the main trade area makes up 51% or $618 million ($2017) of
total retail spending in 2041.
URBIS
MARSDEN PARK NORTH RETAIL AND EMPLOYMENT
ASSESSMENT RETAIL SUPPORTABILITY ASSESSMENT 17Forecast Retail Spending by Product Group
Main Trade Area, 2017-2041 ($M, $2017 Incl. GST, Excl. Inflation) TABLE 3.2
Food Food Home- Bulky Leisure/ Retail Total
Apparel
Retail Catering wares Goods General Services Retail
Primary Trade Area:
2017 4 2 1 1 1 1 0 10
2021 6 2 2 1 2 2 1 16
2026 35 16 12 8 14 12 3 98
2031 75 35 25 17 29 26 7 215
2036 110 55 38 27 44 39 11 324
2041 135 69 47 34 55 49 14 403
Product Group % of Total 2017 36% 15% 12% 7% 14% 12% 3% 100%
Product Group % of Total 2041 34% 17% 12% 8% 14% 12% 3% 100%
Main Trade Area:
2017 67 25 18 11 20 19 6 165
2021 118 48 34 22 39 36 10 307
2026 224 98 70 46 81 73 21 612
2031 332 153 107 73 124 112 32 934
2036 377 181 124 88 144 130 37 1,081
2041 411 206 137 101 160 146 41 1,202
Product Group % of Total 2017 41% 15% 11% 7% 12% 12% 3% 100%
Product Group % of Total 2041 34% 17% 11% 8% 13% 12% 3% 100%
Source: ABS; MarketInfo; Urbis
3.4. COMPETITIVE ENVIRONMENT
This section provides commentary around the current provision of competitive retail floorspace relevant to
the proposed development. The commentary establishes the relative competitive framework and provides
background to assist in determining the level of impact that will be attributed to the individual competing
centres.
North West Growth Area Retail Hierarchy
The Metropolitan Strategy identifies a range of smaller local centres identified through the subregional
planning process. This includes Town Centres, Villages, Small Villages and Neighbourhood Centres.
Specifically, these centres comprise:
Town Centres. Town Centres have one or two supermarkets, community facilities, medical centre,
schools, etc. They contain between 4,500 and 9,500 dwellings. Usually a residential origin than
employment destination.
Stand Alone Shopping Centre. Internalised, privately owned centres located away from other
commercial areas, containing many of the attributes of a town centre but without housing or public open
space—may have potential to become a traditional town centre in the long–term.
Village. A strip of shops and surrounding residential area within a 5 to 10-minute walk contains a small
supermarket, hairdresser, take–away food shops. Contain between 2,100 and 5,500 dwellings.
Small Village. A small strip of shops and adjacent residential area within a 5 to 10-minute walk. Contain
between 800 and 2,700 dwellings.
Neighbourhood Centre. One or a small cluster of shops and services. Contain between 150 and 900
dwellings.
18 RETAIL SUPPORTABILITY ASSESSMENT URBIS
MARSDEN PARK NORTH RETAIL AND EMPLOYMENT ASSESSMENT Rural Town, Village or Neighbourhood Centre. Located in rural zones outside metropolitan urban
areas with similar roles to towns, villages and neighbourhoods but rural in character with a wider driving
catchment.
Existing Retail competition
Table 3.3 identifies the competing retail centres of relevance to this assessment, with individual centres of
importance detailed in the following sections. Although there is currently no retail competition within the
trade area, there are a number of centres located beyond the trade area, particularly to the south and east,
which are expected to compete with the subject centre. As such these have also been included in Map 3.2
and detailed in the following section.
The key retail centres of importance include:
Planned and Existing Major Centres
Blacktown is classified as a major health and education precinct within the Greater Sydney Region Plan
(2018) and comprises Westpoint Blacktown. The centre is anchored by a Myer Department Store
(15,400sq.m), Big W and Target DDS, Coles, Aldi and Woolworths supermarkets together with 15 mini
majors. The centre is also supported by 210 retail specialty shops and 50 non-retail shops. The centre
extends to a retail GLA of approximately 82,800sq.m. There is also a Kmart located opposite Westpoint
Blacktown with access from Alphas Street.
In addition to this the CBD extends to the north side of the train station along Main Street towards Sunnyholt
Road, which contains a range of specialty shops.
The centre has mixed performance from the major tenants and the specialty retailers appear to be trading
reasonably well.
Rouse Hill Town Centre is classified as a strategic centre in the Greater Sydney Region Plan (2018). The
town centre is located on the eastern side of Windsor Road, with access available from White Heart Drive,
Rouse Hill Drive and Civic Way. The centre is approximately 12 km east of the precinct.
The current centre comprises approximately 53,500sq.m of retail space and is anchored by a mix of major
tenants including Woolworths, Coles, Target, Big W and Reading cinemas. There are over 200 specialty
shops, an array of cafes, restaurants and other eateries and the town centre incorporates civic, residential
and commercial uses. The centre is currently identified as a “Strategic Centre” in the Central City District
Plan (2018). Rouse Hill Town Centre is expected to trade strongly in the future as the Planned Major Centre
for the North-West Growth Area.
The centre has lodged a development application to substantially increase the retail and leisure /
entertainment floorspace, and is set to accommodate for population growth within the North-West Growth
Area.
Rouse Hill also contains Rouse Hill Village which is located approximately 1 km to the north of Rouse Hill
Town Centre on Windsor Road. The shopping centre incorporates pad sites for ALDI, McDonald’s, Red
Rooster and Hungry Jacks to the south of Mile End Road, as well as the Rouse Hill Village Mall which is
anchored by a small IGA supermarket with a range of convenience based specialty shops. In total, the
centre contains approximately 7,500sq.m of retail floorspace.
Town Centres
Stanhope Gardens is a relatively new town centre which contains Stanhope Village Shopping Centre.
Stanhope Village is located on the south-western corner of Stanhope Parkway and Sentry Drive,
approximately 12.7 km south east of the subject precinct. It is anchored by Coles and ALDI supermarkets
and a Kmart discount department store (DDS). The centre comprises approximately 15,800sq.m of retail
floor area with a mix of food, fashion and non-retail offerings. The centre expanded in late 2013 to
accommodate an ALDI supermarket, an additional eight specialty shops and 60 car parks. Stage four
development is currently underway which includes:
Covered walkway connecting the two malls
Indoor and alfresco dining areas with 12 new specialty stores and food outlets
Outdoor kids play area.
URBIS
MARSDEN PARK NORTH RETAIL AND EMPLOYMENT
ASSESSMENT RETAIL SUPPORTABILITY ASSESSMENT 19Richmond Marketplace is located beyond the trade area and is approximately 11.6 km north west of the
subject precinct. The centre is anchored by a Big W DDS and Woolworths supermarket together with three
mini majors and 43 retail specialty shops. The centre extends to a total retail GLA of approximately
16,500sq.m. The centre presents to a modern standard. Access to basement car parking is provided via
Paget Street with on grade parking entry along March Street.
Plumpton Marketplace is anchored by a Big W DDS and Woolworths supermarket and is supported by 49
retail specialty shops. The centre extends to a total retail GLA of approximately 15,400sq.m. Plumpton
Marketplace is located 9.6 km south of the precinct and although beyond the trade area can be expected to
compete with retail within Marsden Park North.
Village Centres
Riverstone Marketown is located approximately 3.6 km east of the precinct. In its current format, the centre
is considerably dated with a lack of national branded specialty retailers, containing a small IGA. It is our
understanding that the centre is proposed to be extended and upgraded to provide an additional 7,200sq.m
of retail floorspace including two supermarkets and 25 specialty shops. The expansion will also provide a
library of approximately 280sq.m and office space of approximately 400sq.m. At this stage, it is understood
that a development application has been submitted.
Windsor Marketplace is located approximately 10.3 km north of the precinct. It consists of 4,400 sq.m of
retail floorspace providing a 3,700 sq.m Woolworths supermarket and small food retail and catering
tenancies. The centre performs a weekly top-up food retail role for Windsor and surrounding Hawkesbury
LGA residents.
Greenway Village Centre is located approximately 3.6km south of the precinct and is a small retail centre
consisting of a 3,400 sq.m Woolworths supermarket, 200 sq.m BWS liquor and 14 specialty stores. The
centre opened in May 2017.
Neighbourhood Centres
Woolworths Schofields is a full line supermarket with attached BWS and Terry White Chemist. The
freestanding supermarket is located directly adjacent to Schofields Train Station and provides at grade car
parking. The supermarket comprises 4,100 sq.m, with the 180sq.m BWS accessed internally from the
supermarket. The centre opened in late 2014.
Proposed Centres
In addition to the expansion of Stanhope Village and the redevelopment of Riverstone Marketown as detailed
above, we note the following:
Marsden Park is identified as a potential Town Centre within the Central City District Plan (2018). The
North-West Growth Area identifies Marsden Park to provide retail uses in addition to 10,300 dwellings and a
mixed-use employment corridor. The retail identified will include a Town/Village Centre providing two
supermarkets and a department store with floorspace ranging from 30,000sq.m to 35,000sq.m. It is
understood from the Marsden Park Indicative Layout Plan that the retail centre is to be located to the north of
the industrial precinct with frontage to Richmond Road.
In addition to the town/village centre, smaller retail centres have also been identified within the precinct. It is
understood that these will likely be walkable communities and provide small scale mixed use activity zones.
Marsden Park Village Centre (Elara) is identified as a retail centre within Stockland’s Elara masterplan
community development in the Marsden Park priority precinct. Although the scale and mix of retail uses is
currently unknown, the centre will likely include a supermarket to serve the weekly food grocery needs of the
Elara community. Urbis have assumed a completion year of the development by 2021.
Coles Schofields is proposed to accommodate a 4,200sq.m supermarket and four specialty shops along
Railway Terrace (in addition to Woolworths at the Schofields Neighbourhood Centre above). It is understood
that the project has received development approval, although based on publicly available information
(Cordells construction database), development has been deferred until further notice.
20 RETAIL SUPPORTABILITY ASSESSMENT URBIS
MARSDEN PARK NORTH RETAIL AND EMPLOYMENT ASSESSMENTYou can also read