Effect of Salt Stress on Growth and Metabolite Profiles of Cape Gooseberry (Physalis peruviana L.) along Three Growth Stages
←
→
Page content transcription
If your browser does not render page correctly, please read the page content below
molecules
Article
Effect of Salt Stress on Growth and Metabolite Profiles of Cape
Gooseberry (Physalis peruviana L.) along Three Growth Stages
Daissy Monroy-Velandia *                   and Ericsson Coy-Barrera *

                                           Bioorganic Chemistry Laboratory, Facultad de Ciencias Básicas y Aplicadas, Campus Nueva Granada,
                                           Universidad Militar Nueva Granada, Cajicá 250247, Colombia
                                           * Correspondence: day0992@gmail.com (D.M.-V.); ericsson.coy@unimilitar.edu.co (E.C.-B.)

                                           Abstract: Colombia is the main producer of cape gooseberry (Physalis peruviana L.), a plant known
                                           for its various consumption practices and medicinal properties. This plant is generally grown in
                                           eroded soils and is considered moderately tolerant to unfavorable conditions, such as nutrient-poor
                                           soils or high salt concentrations. Most studies conducted on this plant focus on fruit production and
                                           composition because it is the target product, but a small number of studies have been conducted to
                                           describe the effect of abiotic stress, e.g., salt stress, on growth and biochemical responses. In order to
                                           better understand the mechanism of inherent tolerance of this plant facing salt stress, the present
                                           study was conducted to determine the metabolic and growth differences of P. peruviana plants at three
                                           different BBCH-based growth substages, varying salt conditions. Hence, plants were independently
                                           treated with two NaCl solutions, and growth parameters and LC-ESI-MS-derived semi-quantitative
                                           levels of metabolites were then measured and compared between salt treatments per growth substage.
                                           A 90 mM NaCl treatment caused the greatest effect on plants, provoking low growth and particular

                                    metabolite variations. The treatment discrimination-driving feature classification suggested that
Citation: Monroy-Velandia, D.;             glycosylated flavonols increased under 30 mM NaCl at 209 substages, withanolides decreased under
Coy-Barrera, E. Effect of Salt Stress on   90 mM NaCl at 603 and 703 substages, and up-regulation of a free flavonol at all selected stages
Growth and Metabolite Profiles of          can be considered a salt stress response. Findings locate such response into a metabolic context and
Cape Gooseberry (Physalis peruviana        afford some insights into the plant response associated with antioxidant compound up-regulation.
L.) along Three Growth Stages.
Molecules 2021, 26, 2756. https://         Keywords: cape gooseberry; salt stress; growth parameters; metabolic profiling
doi.org/10.3390/molecules26092756

Academic Editors: Anna Andolfi and
Maria Michela Salvatore                    1. Introduction
                                                In their natural growth conditions, plants suffer from several biotic and abiotic stresses
Received: 1 April 2021
Accepted: 5 May 2021
                                           activating various responses to withstand adverse conditions. One of the more troublesome
Published: 7 May 2021
                                           types of abiotic pressure is salt stress since it affects different growth stages, delaying
                                           germination and reducing growth rates such as leaf area, length, and biomass of plants [1].
Publisher’s Note: MDPI stays neutral
                                           Furthermore, it interferes with the physiology, the metabolome/proteome, and causes
with regard to jurisdictional claims in
                                           ionic and osmotic stress, which leads to nutrient imbalance, retention of toxic substances,
published maps and institutional affil-    reduction of photosynthetic activity, and formation of reactive oxygen species (ROS) that
iations.                                   can produce metabolic dysfunction and even affect genetic material [2]. Such effects can
                                           appear separately or jointly, which highly hinders their study.
                                                An evident effect of high salinity is the reduction of biomass and growth of secondary
                                           roots and, consequently, the transport of hormones and growth-promoting substances
Copyright: © 2021 by the authors.
                                           to the leaves would be poor [3]. Leaf primordia and young leaves are highly sensitive
Licensee MDPI, Basel, Switzerland.
                                           to salinity due to their high rates of transpiration and cell division since the tissue is
This article is an open access article
                                           expanding; this leads to a lower number of developed leaves, and leaf abscission and
distributed under the terms and            necrosis [4]. Due to high salinity (≥100 mM), the leaf tissue accumulates Na+ until toxic
conditions of the Creative Commons         levels, leading to the leaf loss and, therefore, photosynthetic area reduction, affecting
Attribution (CC BY) license (https://      growth [3]. Additionally, ROS are overproduced in peroxisomes and chloroplasts, which
creativecommons.org/licenses/by/           favors oxidative damage in the leaves and interferes with CO2 fixation, and increases
4.0/).                                     photorespiration [5].

Molecules 2021, 26, 2756. https://doi.org/10.3390/molecules26092756                                      https://www.mdpi.com/journal/molecules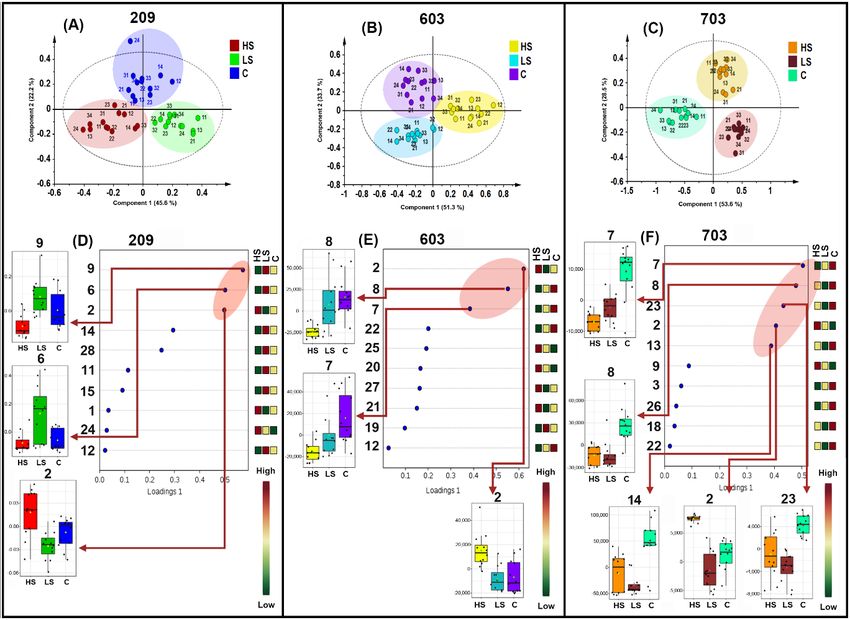
Molecules 2021, 26, 2756                                                                                            2 of 18

                                 Abscisic acid (ABA) accumulation, protein kinases of the SnRK type (Sucrose nonfer
                           menting-Related Kinase) activation, and Ca2+ loss are some of the acclimating responses
                           to tolerate this kind of stress [6]. This adaptation is the result of the SOS (Salt-Overly-
                           Sensitive) pathway, comprising a series of proteins with transmembrane domains that
                           detect Na+ and Ca2+ and triggering a regulation mechanism for ionic homeostasis through
                           the salt compartmentalization, mainly in vacuoles, involving its subsequent elimination [7].
                           Another way of plant response to salt stress is the production of secondary (now currently
                           known as specialized) metabolites. As previously assumed, these compounds did not
                           appear to play a crucial role in the life processes of plants. However, recent studies
                           described and elucidated some of their functions on plant growth and development,
                           even whether they are produced in low quantity (ca. 1% dry weight) [8]. In high-salt
                           events, several secondary metabolites have a protective function against such adverse
                           environmental conditions [9], having roles as osmoregulators, osmoprotectants, and free
                           radical scavengers [10,11]. In this context, the production of free or conjugated phenolic
                           compounds has been highly studied to better understand the strategies and mechanisms to
                           tolerate salt stress [12], since its antioxidant capacity and other benefits are well-recognized
                           (e.g., attractants, UV screens, signaling, structural polymers and defense) [13,14].
                                 A plant belonging to the family Solanaceae with high potential for its cultivation in
                           salinized soils is cape gooseberry (Physalis peruviana L.), also known as goldenberry [4,15].
                           This plant is well-known for the production of sweet fruits, being one of the fruits leading
                           important export rates of fresh matter in several tropical countries [16]. In fact, the cape
                           gooseberry became the second fresh fruit exported after bananas [17]. Cape gooseberry is
                           considered an exotic tropical fruit, being preferred for its flavor, appearance and nutritional
                           quality (e.g., good contents of vitamin A, C, phosphorus, and fiber), and other health
                           benefits related to the presence of some phytochemicals (e.g., phytosterols, polyphenols,
                           fisalins, and withanolides) [18,19]. Indeed, some studies described the hypocholesterolemic,
                           antioxidant, anti-inflammatory, anticancer, and antimicrobial properties of goldenberry
                           fruits, among others [20,21]. P. peruviana fruits are mainly used to consume directly or
                           prepare juices or jams [22,23], but aqueous extracts of leaves have been also traditionally
                           used as a diuretic to treat throat conditions and asthma-related problems [24]. Other bio-
                           logical properties of cape gooseberry leaves have also been described, such as antibacterial,
                           cytotoxic, antioxidant, antidiabetic, and antihepatotoxic activities [25–27].
                                 Many P. peruviana genotypes have been adapted to the edaphoclimatic conditions of
                           specific producing regions (i.e., ecotypes), but a small number of varieties are currently
                           known for the cape gooseberry cultivation. There is the Colombian ecotype, which is
                           characterized by its calyces shape, small fruits (ca. 5 g), bright yellow coloration, and high
                           sugar content [23,28]. Its market acceptability is excellent due to its flavor and appearance,
                           being Colombia, the main exporter of this fruit [29]. Actually, the Colombian Corporation
                           for Agricultural Research (Agrosavia) developed two varieties, namely Corpoica-Dorada
                           and Corpoica-Andina, obtained after in vitro anthers culture. Such varieties are considered
                           the first certified cape gooseberry colombian varieties.
                                 In general, a wide range of agroecological conditions are suitable for several eco-
                           types/varieties of P. peruviana, but the Colombian ecotype grows adequately at 1800–2800 m
                           above sea level, 13–18 ◦ C average temperature, and a well-distributed rainfall between
                           1000 and 2000 mm per year [30]. In addition, this ecotype requires particular soil conditions
                           to be adapted easily, such as 70%–80% average relative humidity, well-drained soils with
                           a pH between 5.5 and 7.0 and high levels of organic matter [30]. Cape gooseberry crops
                           in Colombia are usually found in salinized soils (electrical conductivity > 4 dS/m) [31].
                           Actually, one of the main problems in Colombia regarding soil degradation is salinity,
                           which affects its structure, water transport capacity, availability of nutrients for plants and
                           their tissues themselves [31,32].
                                 There are several studies that have investigated the metabolite variations of P. peruviana
                           via LC-MS methods [32–34], and to the best of our knowledge, only one NMR-based
                           study [16]. However, there is no previous study that has focused on the study of the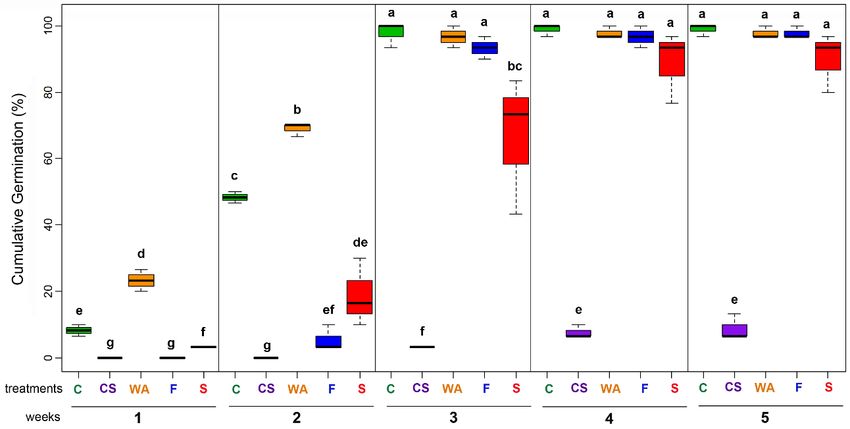
Molecules 2021, 26, 2756 3 of 18
Molecules 2021, 26, 2756 There are several studies that have investigated the metabolite variations of P. 3peru-
of 18
viana via LC-MS methods [32–34], and to the best of our knowledge, only one NMR-based
study [16]. However, there is no previous study that has focused on the study of the met-
abolic response to salt stress along different substages of cape gooseberry plants, which
metabolic response to salt stress along different substages of cape gooseberry plants, which
constitutes the novelty of the present study. Thus, the aim was oriented to determine the
constitutes the novelty of the present study. Thus, the aim was oriented to determine the
effect of salt stress on growth and metabolite profiles of P. peruviana along three different
effect of salt stress on growth and metabolite profiles of P. peruviana along three different
growth substages. Hence, two different salt treatments, namely low and high salinity (i.e.,
growth substages. Hence, two different salt treatments, namely low and high salinity
30 and 90 mM NaCl, respectively), were applied to P. peruviana seedlings to follow phe-
(i.e., 30 and 90 mM NaCl, respectively), were applied to P. peruviana seedlings to follow
notypic and metabolic variations during plant development. The plausible relationship
phenotypic and metabolic variations during plant development. The plausible relationship
between salinity and production of specialized metabolites and the implication of salt
between salinity and production of specialized metabolites and the implication of salt
stress on growth parameters was then explored.
stress on growth parameters was then explored.
2.
2. Results
Results
2.1.
2.1. Selection
Selection of
of Pre-Germination
Pre-Germination Treatment
Treatment
In
In order
order to
to homogenize
homogenize thethe seedling
seedling production
production of of P.
P. peruviana, the seed germination
behavior
behavior was initially examined, using different pre-germination treatments. Cumulative
germination
germination percentage
percentage (%CG)
(%CG) (radicle
(radicle>>11mm)mm)perperweek
weekwas wasthen
thendetermined.
determined.Figure Figure1
1 showsthe
shows thevariations
variationsand
andevolution
evolutionofof%CG%CGover overfive
five weeks
weeks for each pre-germination
treatment. Commercial
treatment. Commercial seeds
seeds only
only reached
reached 8.8%
8.8% CG,
CG, showing
showing an an evident
evident viability
viability loss,
loss,
possibly due to time and storage conditions, which justifies the use of fresh seeds. On the
contrary, wood
contrary, woodash ashpromoted
promoted thethe
highest %CG
highest fromfrom
%CG the first
theweek
first (i.e.,
week 23.3%)
(i.e., and evolved
23.3%) and
promptlypromptly
evolved and suitably over time.
and suitably Thus,
over time.itsThus,
valueitsincreased up to 68.9
value increased up % to at the%second
68.9 at the
week, followed
second by the seeds
week, followed by thewithout treatment
seeds without as control
treatment as groups
control (48.3%). However,
groups (48.3%). How-the
control
ever, thegroup
controland woodand
group ashwood
reachedashsimilar
reached %similar
CG (96.7% CGand(96.7
97.8%,andrespectively), followed
97.8%, respectively),
by fermentation
followed and salinized
by fermentation and (60 mM NaCl)
salinized (60 mM treatments (93.3% and(93.3%
NaCl) treatments 66.7%,and respectively).
66.7%, re-
spectively). These three treatments and control group reached their maximumuntil
These three treatments and control group reached their maximum %CG values %CG fourth
val-
week (> 88%), exhibiting no significant differences (p > 0.05) between them
ues until fourth week (> 88%), exhibiting no significant differences (p > 0.05) between them according to
the post hoc Tukey’s honest significance difference (HSD) test (Figure
according to the post hoc Tukey’s honest significance difference (HSD) test (Figure 1).1).
Figure 1. Cumulative
Cumulative germination
germination percentage
percentage during
during five
five weeks
weeks of
of Physalis
Physalis peruviana
peruviana seeds
seeds subjected
subjected to
to different
different pre-
pre-
germination
germination treatments.
treatments. C:
C: Control
Control (seeds
(seeds without
without treatment,
treatment, green
green boxes);
boxes); CS:
CS: Commercial
Commercial (seeds
(seeds purchased
purchased from
from aa local
local
seller, purple boxes);
seller, purple boxes); WA:
WA: Wood
Wood ash
ash (seeds
(seeds after
after seven-day
seven-day storage
storage with
with wood
wood ash,
ash, orange
orange boxes);
boxes); F:
F: Fermentation
Fermentation (seeds
(seeds
removed after seven-day storage with pulp fruit, blue boxes); S: NaCl (a 60 mM NaCl solution supplied to the seeds three
removed after seven-day storage with pulp fruit, blue boxes); S: NaCl (a 60 mM NaCl solution supplied to the seeds three
times per week, red boxes). Data expressed as median and interquartile range (n = 3). Different letters over each box
times per week, red boxes). Data expressed as median and interquartile range (n = 3). Different letters over each box indicate
indicate significant differences for each %CG according to the post-hoc Tukey test (p < 0.05).
significant differences for each %CG according to the post-hoc Tukey test (p < 0.05).
The highest standard deviation was exhibited by salinized treatment, whose imbibi-
tion and emergence were not uniformly produced. However, salinized treatment reached
%CG > 80%, seeds under this condition germinated later than those seeds treated previ-
ously with wood ash. After three weeks, control and wood ash and fermentation treatmentsMolecules 2021, 26, 2756 4 of 18
progressed similarly. However, wood ash promoted a more efficient evolution in germina-
tion during the first two weeks. Such profile indicated a germination-promoting effect by
wood ash treatment and an early inhibiting effect by salinized and fermentation treatments.
2.2. Effects of Salt Stress on Growth of P. peruviana
Owing to the germination-promoting effect obtained by wood ash as pre-germination
treatment, leading to fast and homogeneous production of P. peruviana seedlings, the study
continued through the propagation of P. peruviana plants under greenhouse conditions.
Seedlings were then treated with two NaCl concentrations (30 and 90 mM, namely low
salinity (LS) and high salinity (HS) treatments, respectively), including a control group
(without NaCl treatment). Thus, the effect of salt stress on P. peruviana growth was initially
studied, measuring some growth parameters, such as length (aerial part and roots), leaf
area, biomass (aerial part and root), root/aerial part ratio, leaf area/biomass ratio and root
ratio, for three selected BBCH-based growth substages of P. peruviana [35], comprising a
vegetative (209) and two reproductive (603 and 703) substages. These measurements are
presented in Table 1. There were no time differences between control and LS groups to
reach BBCH substages, but the growth time between control and HS groups was found
to be different. Thus, the control group required 90 ± 2 days after transplanting to reach
the 209 substage, whereas the HS group needed 15 ± 8 days more to reach this substage.
Similarly, 120 ± 4 days after transplanting (i.e., 30 days 209 substage) were required by
the control group to reach the flowering stage (603), and there was a time difference (i.e.,
18 ± 7 days) between control and HS groups. Finally, slight time differences were found
between HS and control groups to reach the 703 substage (195 ± 8 versus 181 ± 5 days,
respectively).
Aerial part length showed differences in the reproductive stages. Thus, plants under
HS were statistically different (p < 0.05) from that of control and LS groups at the flowering
stage (603), but such differences were more evident at the fruiting stage (703), specifically
between HS and the control group. Differences in root length were also observed between
the HS and control groups at the flowering stage, but no significant differences were found
at the vegetative (209) or fruiting stages.
Table 1. Growth parameters of P. peruviana plants along three growth substages under salinized conditions.
Aerial Part Roots
Substage a Condition b LA c (cm2 ) TB c (g/g)
L c (cm) B c (g) L c (cm) B c (g)
209 C 17.7 ± 1.0 E 2.4 ± 0.7 C 340 ± 98 C 64.5 ± 3.5 BC 1.2 ± 0.4 F 3.7 ± 1.1 D
209 LS 20.2 ± 1.0 E 4.2 ± 1.2 C 515 ± 149 C 74.6 ± 2.2 A 1.3 ± 0.4 F 5.6 ± 1.6 D
209 HS 20.5 ± 1.3 E 2.4 ± 0.7 C 371 ± 107 C 70.0 ± 3.7 AB 1.1 ± 0.3 F 3.5 ± 1.0 D
603 C 57.4 ± 1.5 C 17.3 ± 5.0 BC 1934 ± 558 B 73.6 ± 3.3 A 9.5 ± 2.8 C 26.8 ± 7.7 CD
603 LS 54.4 ± 2.6 C 17.2 ± 5.0 BC 1908 ± 551 B 72.3 ± 2.5 A 7.6 ± 2.2 CD 24.8 ± 7.2 CD
603 HS 45.2 ± 2.1 D 10.9 ± 3.1 C 1018 ± 352 C 62.8 ± 2.8 BC 4.6 ± 1.3 D 15.5 ± 4.5 D
703 C 92.3 ± 3.5 A 53.2 ± 15.4 A 3617 ± 1044 AB 59.6 ± 1.8 C 42.1 ± 9.1 A 95.3 ± 27.5 A
703 LS 81.6 ± 3.2 B 45.0 ± 13.0 A 3784 ± 1092 AB 61.1 ± 1.3 C 26.0 ± 5.5 B 71.0 ± 20.5 AB
703 HS 76.7 ± 3.4 B 39.2 ± 11.3 AB 4110 ± 1187 A 60.0 ± 1.5 C 15.2 ± 4.2 C 54.3 ± 15.7 BC
a BBCH-based growth substages of P. peruviana [31]: vegetative (209), flowering (603), and fruiting (703); b treatment conditions: C: without
NaCl treatment (control group); LS: low salinity (30 mM NaCl); HS: High salinity (90 mM NaCl); c Growth parameters: L: maximum length;
B: Dry-weight biomass); LA: Leaf area; TB: Total biomass as the sum of the aerial part and roots biomasses. Data are expressed as mean ±
standard error of the mean (SEM) (n = 12). Means with the same letter along the same column are not significantly different from each other
at p < 0.05 according to the Tukey test.
The leaf area of the HS group at the flowering stage was also affected by salt treatments,
showing a reduction in the mean area and being significantly different (p < 0.05) to that
of control and LS groups, whereas no significant differences were observed at substages
209 or 703. Additionally, dry-weight biomass of both plant parts (aerial part and roots)
presented significant differences between HS and control groups at both flowering and
fruiting stages, but no significant differences were found at the 209 substage. The HS
treatment had a biomass reducing effect, mostly evident in the root biomass (Table 1).
Some growth parameters-derived indices were then calculated to better appreciate
the effect of salt treatments on roots and aerial part (Table 2). Thus, the mean root/aerialMolecules 2021, 26, 2756 5 of 18
(R/A) ratio decreased markedly under salinized conditions at both reproductive stages
(more evident at the 703 substage), whereas the mean leave area/total biomass (LA/TB)
ratio increased depending on the salt treatment, also more evident at the 703 substage,
indicating a balance between tissue development and performance. Similar behavior was
observed for the aerial and root mass fractions (AMF and RMF, respectively). However,
no clear trend was observed at vegetative and flowering stages, but HS treatment showed
positive and negative effects on these indices related to the biomass of the aerial part and
roots, respectively, at the fruiting stage (Table 2).
Table 2. Growth parameters-derived indices for P. peruviana plants along growth substages under salinized conditions.
Substage a Condition b R/A c (g/g) LA/TB c (m2 /kg) AMF c (g/g) RMF c (g/g)
209 C 0.513 ± 0.145 9.3 ± 2.8 0.66 ± 0.20 0.34 ± 0.10
209 LS 0.317 ± 0.039 9.2 ± 1.7 0.76 ± 0.26 0.24 ± 0.04
209 HS 0.462 ± 0.126 10.6 ± 3.5 0.68 ± 0.24 0.32 ± 0.10
603 C 0.551 ± 0.174 7.2 ± 2.1 0.64 ± 0.19 0.36 ± 0.12
603 LS 0.438 ± 0.098 7.7 ± 2.4 0.70 ± 0.23 0.31 ± 0.08
603 HS 0.425 ± 0.142 7.9 ± 2.3 0.70 ± 0.21 0.30 ± 0.10
703 C 0.790 ± 0.449 3.8 ± 1.0 0.56 ± 0.18 0.44 ± 0.28
703 LS 0.579 ± 0.256 5.3 ± 1.4 0.63 ± 0.20 0.37 ± 0.18
703 HS 0.388 ± 0.178 7.6 ± 3.4 0.72 ± 0.22 0.28 ± 0.13
aBBCH-based growth substages of P. peruviana [31]: vegetative (209), flowering (603), and fruiting (703); b treatment condition: C: withouht
NaCl treatment (control group); LS: low salinity (30 mM NaCl); HS: High salinity (90 mM NaCl); c Growth parameters-derived indices:
R/A: root/aerial part biomass ratio; LA/TB: Leaf area/total biomass ratio; AMF: aerial part mass fraction; RMF: root mass fraction. Data
are expressed as mean ± standard error of the mean (SEM) (n = 12).
2.3. Effects of Salt Stress on Metabolic Profiles of P. peruviana Aerial Parts
The effects of salt stress on metabolic profiles of P. peruviana plants along the selected
growth stages were studied after ethanolic extraction of the respective aerial parts and
subsequent analysis by LC-ESI-MS to obtain the metabolic profiles. The aerial part was
selected because leaves contain the highest content of metabolites in P. peruviana, especially
phenolic-like compounds [17].
After pre-treatment of raw LC-MS-derived profiles, the peak area of each feature
(i.e., metabolite at a retention time) versus observations (i.e., treated plants per substage
(n = 9) and their replicates (n = 12)) were compiled. The resulting metabolic data matrix
(feature × observations = 1213 × 108) was initially filtered by the variable influence on
projection (VIP) scores after partial least squares discriminant analysis (PLS-DA) over the
entire normalized data set. This first classification was performed to explore the distri-
bution of the relative abundance of detected features and select the relevant information
from metabolic profiles by the examination of the most contrasting patterns. Hence, the
differential comparison of the VIP scores of each feature between salinized conditions
led to gather the fifteen most contrasting features per growth substage, based on VIP > 1.
Some of these contrasting features were common among growth substages, but other
features were exclusively selected for a particular substage. Therefore, for the three test
substages, a set of twenty-eight features were statistically selected (fifteen per substage).
Such features (1–28) were annotated at level 3 using their spectral data, which are listed
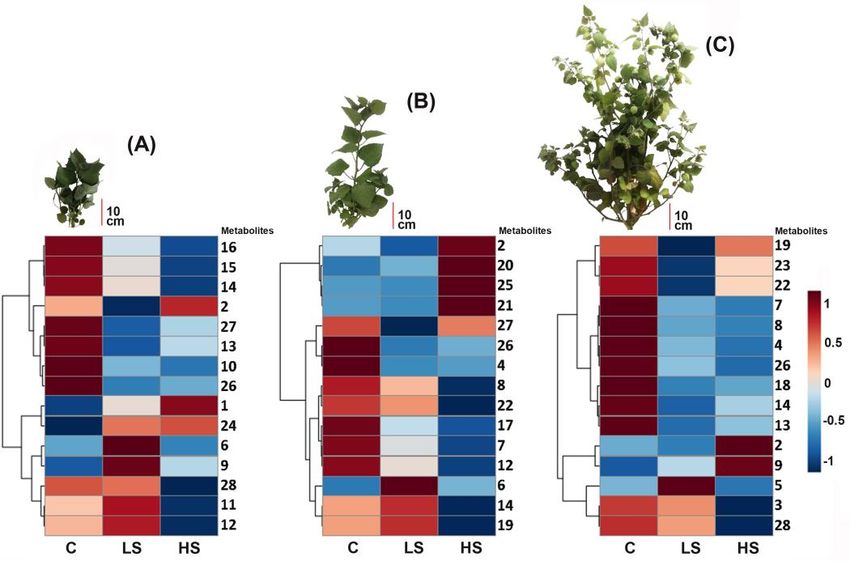
in Table A2. The resulting contrasting patterns were intuitively visualized through heat
maps, whose each color cell is associated with a relative abundance of each metabolite
to compare salt treatments per substage (Figure 2). These heat maps showed that salt
treatment impacted metabolic profiles since important differences (i.e., downregulated and
upregulated metabolites) between control and salinized groups were observed. This trend
was clearly evidenced by the clustering analysis among these most contrasting features,
since two main clusters were observed for all growth substages, comprising downregulated
metabolites (i.e., most-abundant metabolites in the control group) as the first cluster and
upregulated metabolites by the effect of HS and LC treatments as the second one (Figure 2).ments per substage (Figure 2). These heat maps showed that salt treatment impacted met-
abolic profiles since important differences (i.e., downregulated and upregulated metabo-
lites) between control and salinized groups were observed. This trend was clearly evi-
denced by the clustering analysis among these most contrasting features, since two main
Molecules 2021, 26, 2756 clusters were observed for all growth substages, comprising downregulated metabolites6 of 18
(i.e., most-abundant metabolites in the control group) as the first cluster and upregulated
metabolites by the effect of HS and LC treatments as the second one (Figure 2).
Figure2.
Figure 2. Distribution
Distribution ofof the
the relative
relative abundance
abundanceof ofthe
themost
mostcontrasting
contrastingfifteen
fifteenmetabolites
metabolitesdetected
detected
in extracts
in extracts of
ofP.P.peruviana
peruvianaaerial
aerialparts
partsunder
undersalinity
salinityconditions,
conditions,according
accordingto tothe
thesPLS-DA-derived
sPLS-DA-derived
variable influence
variable influence ononprojection
projection(VIP)
(VIP)scores
scores(VIP
(VIP>>1).1). This
Thisdistribution
distribution isisdivided
dividedinto
intothree
threeheat
heat
maps obtained from those profiles of plants at substages (A) 209 (vegetative),
maps obtained from those profiles of plants at substages (A) 209 (vegetative), (B) 603 (flowering),(B) 603 (flowering),
and (C) 7003 (fruiting). Each heat map is organized by columns for each treatment: HS: high salinity
and (C) 7003 (fruiting). Each heat map is organized by columns for each treatment: HS: high salinity
(90 mM NaCl); LS: low salinity (30 mM NaCl); C: control (no NaCl treatment). Each color cell was
(90 mM NaCl); LS: low salinity (30 mM NaCl); C: control (no NaCl treatment). Each color cell was
associated with a normalized (scaled to unit variance, prior heatmap generation) relative abundance
associated with a normalized
of each metabolite, located in(scaled
the rightto side
unit of
variance, prior heatmap
each heatmap, generation)
depending relative
on the color abundance
scale (dark red:
of each
high metabolite,
abundance; located
dark blue: inlowthe right side of
abundance). Theeach heatmap,
most depending
contrasting on the
metabolites percolor scale
growth (dark
substage
red: high abundance;
are organized accordingdark blue:
to the lowclustering
Ward abundance). The most
algorithm contrasting
measuring metabolites
Euclidean perand
distance, growth
num-
bered according
substage to the annotated
are organized according metabolite
to the Wardlist presented
clustering in Table measuring
algorithm A2. Euclidean distance,
and numbered according to the annotated metabolite list presented in Table A2.
The highest number within the most contrasting metabolites were found to be down-
The highest
regulated. number
This fact withina the
indicated most contrasting
depletion metabolites
of the abundance were metabolites
of some found to be down-
by the
regulated. This facttreatments.
effect of salinized indicated aHowever,
depletionaof the abundance
particular of someofmetabolites
up-regulation by the
other metabolites
effect of salinized
differently presentedtreatments.
in LS and However,
HS groupsa particular
along theup-regulation
three growth of other metabolites
substages, were also
differently
observed. In this regard, LS and HS groups at the 209 substage exhibited four (6,were
presented in LS and HS groups along the three growth substages, 9, 11,also
and
observed. In this regard, LS and HS groups at the 209 substage exhibited four
12) and three (1, 2, and 24) upregulated features, respectively (Figure 2A), whereas11, (6, 9, theand
603
12) and three
substage (1, 2, three
showed and 24)
(6, upregulated features,
14, and 19) and respectively
four (2, 20, 25, and(Figure 2A), whereas
21) upregulated the 603
features for
substage
LS and HS showed
groups, three (6, 14, and
respectively 19) and
(Figure four
2B). (2, 20,LS
Finally, andHS
25,and upregulated
21)groups features
at the 703 for
substage
LS and HS groups, respectively (Figure 2B). Finally, LS and HS groups at the 703 substage
resulted in the lowest number of upregulated metabolites, involving one (5) and two (2
and 9), respectively (Figure 2C).
Subsequently, in order to facilitate the recognition of those patterns associated with
statistical discrimination of salt treatments due to the influence of the differential abundance
of particular metabolites, a sparse partial least squares discriminant analysis (sPLS-DA) was
then performed, dividing the whole LC-MS-derived dataset into three groups according
to the growth stage. The suiting predictive performance of sPLS-DA (i.e., classification
error rates < 0.4, cross-validating area under curve > 0.95) for the accurate classification
and variable selection of multiclass problems in a one-step procedure has been previously
demonstrated, showing more efficiency for feature selection than that of other supervised
classification methods [36]. Therefore, sPLS-DA was chosen as the projection-based method
to classify and select those most discriminant features under a three-class (i.e., two salt
treatment and control groups) comparison scheme. The resulting sPLS-DA-derived score
plot for the whole metabolite dataset of those plants at the 209 substage (Figure 3A) showedaccording to the growth stage. The suiting predictive performance of sPLS-DA (i.e., clas-
sification error rates < 0.4, cross-validating area under curve > 0.95) for the accurate clas-
sification and variable selection of multiclass problems in a one-step procedure has been
previously demonstrated, showing more efficiency for feature selection than that of other
Molecules 2021, 26, 2756 supervised classification methods [36]. Therefore, sPLS-DA was chosen as the projection- 7 of 18
based method to classify and select those most discriminant features under a three-class
(i.e., two salt treatment and control groups) comparison scheme. The resulting sPLS-DA-
derived score plot for the whole metabolite dataset of those plants at the 209 substage
graphically that categorical variables (i.e., groups framed according to salt treatments)
(Figure 3A) showed graphically that categorical variables (i.e., groups framed according
can be discriminated due to differentiated metabolic profiles between them through a
to salt treatments) can2 be discriminated due to differentiated metabolic profiles between
well-fitted model (R = 0.919; Q2 = 0.856). Identical pattern for the dataset from plants at
them through a well-fitted model (R = 0.919;2 Q2 = 0.856).2Identical pattern for the dataset
2
the 603 (R2 = 0.869; Q2 2= 0.782) and 703 (R = 0.951; Q = 0.861) substages, but a lower
from plants at the 603 (R = 0.869; Q2 = 0.782) and 703 (R2 = 0.951; Q2 = 0.861) substages, but
dispersion (i.e., a more marked effect) in the score plot related to plants at the 703 substage
a lower dispersion (i.e., a more marked effect) in the score plot related to plants at the 703
was observed (Figure 3B,C).
substage was observed (Figure 3B,C).
Comparativeanalysis
Figure3.3.Comparative
Figure analysisofofthe
theLC-MS
LC-MSdata dataofofaerial
aerialpart-derived
part-derivedextracts
extractsfrom thoseP.P.peruviana
fromthose peruvianaplants
plantscollected
collected
atatdifferent
differentgrowth
growthsubstages
substages(209,
(209,603,
603,and
and703)
703)under
underdifferent
differentsalt
salttreatments
treatments(HS:
(HS:high
highsalinity
salinity(90
(90mMmMNaCl);
NaCl);LS:
LS:low
low
salinity
salinity(30
(30mM
mMNaCl);
NaCl);C:C:Control
Control(without
(withoutNaCl
NaCltreatment))
treatment))by bymeans
meansofofsparse
sparsepartial
partialleast
leastsquares
squaresdiscriminant
discriminantanalysis
analysis
(sPLS-DA)
(sPLS-DA)totoestablish
establishthe
themetabolic
metabolicdifferences
differences(R (R2>>0.85;
2
0.85;QQ2>>0.78).
2
0.78).Scores
Scoresplot
plotsupervised
supervisedby bysalt
salttreatment:
treatment:HS:
HS:red;
red;
LS:
LS: green; C: blue for the dataset from plants at the substages 209,
green; C: blue for the dataset from plants at the substages (A) (B) 603,
(A) 209, (B) and
603,(C)
and703.
(C)Loadings plot ranking
703. Loadings the most-
plot ranking the
influencing metabolites to discriminate treatments for the dataset from plants at the substages (D) 209, (E) 603, and (F)
most-influencing metabolites to discriminate treatments for the dataset from plants at the substages (D) 209, (E) 603, and (F)
703. Metabolites are numbered according to the annotated metabolite list presented in Table A2. The highly top-ranked
703. Metabolites are numbered according to the annotated metabolite list presented in Table A2. The highly top-ranked
metabolites per growth substage are highlighted in red ellipses.
metabolites per growth substage are highlighted in red ellipses.
The sPLS-DA-derived loadings plots (Figure 3D–F) were useful to delineate such
feature-based differences and select important metabolites, showing the top-ranked metabo-
lites by the discriminating influence through the load vector (loadings) according to the
color scale (red: high influence; green: low influence). Thus, ten metabolites were top-
ranked for the dataset along growth substages according to their loadings value (>0.3).
These metabolite rankings were also related to the quartile-based distribution of metabolite
abundances along replicates per salt treatment through respective box plots (Figure 3D–F).
The statistical differences of the mean relative abundance of each respective metabolite
between salt treatments and control, transformed to the sPLS-DA-derived scores and
associated with the median variations, were clearly appreciated, since they exhibited
an unusual relative abundance that statistically stands out in comparison to other treat-
ments. Such top-ranked metabolites were related to flavonols and withanolides (freeMolecules 2021, 26, 2756 8 of 18
and glycosylated), being responsible for the discrimination of salinity treatments. At the
209 substage, two of the top-ranked metabolites discriminated the LS group (identified as
quercetin 3-glucosylgalactoside (9) and quercetin 3-robinobioside-7-glucoside (6)), whereas
one metabolite influenced the discrimination of the HS group (identified as quercetin (2))
(Figure 3D). Conversely, the three most-influencing metabolites appeared to discriminate
salt treatments at the 603 substage. Two of them were related to withanolides, i.e., witha-
physanolide (8) and physanolide A (7), and differentiated the control group. In contrast,
compound (2) (already top-ranked in the previous substage) was the highly top-ranked
metabolite and its relative abundance was also found to be the highest for the HS group
(Figure 3E). At the fruiting stage (703), the respective loading plot (Figure 3F) also had a
red ellipse including five top-ranked metabolites that participated in the treatment differ-
entiation for this substage; four of them were related to withanolides (i.e., 7, 8, physalin B
(14), and physagulin D (23)) and were more associated to the control group. The five one
was compound 2 that again influenced the discrimination of HS group.
3. Discussion
Excessive salinity in soils is considered a serious environmental problem that affects
the growth and development of plants, from their biochemistry, physiology, and morphol-
ogy, impacting the production of those commercially important plants [37]. In the first
instance, salt stress alters the overall water balance of the plant and, in turn, at the cellular
level, disturbs the membranes and proteins, causing metabolic dysfunction [38]. Although
salinity could affect different growth stages by characteristic events and conditions, germi-
nation is usually a tolerant phase for salinity in crop plants, whose tolerance is manifested
by high survival percentage values [1]. However, the germination rate and percentage can
be altered by stressful levels of salinity and these responses may vary between species and
even cultivars [39]. In the case of the cape gooseberry Colombian ecotype, the present study
showed a reduction of the cumulative germination percentage and a germination delay for
those seeds that received the salinity treatment (60 mM), compared to the other treatments.
After four weeks, the maximum percentage was 88.8%, slightly higher than that reported in
studies carried out in Turkey and Brazil, whose germination percentage was ca. 70%, at the
same time and salt concentration. Although salinity produced an early germination delay,
a cumulative percentage was later comparable to that of the control. Therefore, P. peruviana
can be considered a salt-tolerant species during this initial stage [15,40]. However, results
may diverge depending on the environmental conditions, viability and genetic factors
of the test ecotype. Additionally, it is necessary to study each growth stage of the plant
against salt conditions to determine if this tolerance is maintained throughout the cycle.
Salt stress in glycophytic plants, such as cape gooseberry, is tolerated due to the ability to
eliminate the excess of monovalent cations from leaves, since the ion exchange that occurs,
favoring the Na+ expulsion as an osmotic regulation strategy [41].
The pre-germination treatment based on fermentation has been used as a method of
controlling infectious processes in nightshades such as tomatoes. Similarly, in passion-
flower, it is used to break seed dormancy and promote seedling growth and develop-
ment [42,43]. However, fermentation effect may fluctuate by the exposure time and the
test species since it can be risky by reducing the seed viability [44]. During the first two
weeks, the seeds treated with wood ash germinated faster, reaching 68% CG compared
to fermentation (5%). In this regard, a higher germination rate could be induced by the
action of karrikin-type butenolides possibly present in the wood ash. This family of com-
pounds is common in smoke and in charred plant materials, which act as germination
stimulators of some seeds by binding to the KAI2 receptor, as previously studied for other
nightshades [45].
Salt stress tolerance is also manifested by growth indicators in the vegetative and
reproductive stages. High salinity levels often affect shoot growth more than root growth,
so leaf-related parameters may show an evident reduction [1]. Therefore, detailed scrutiny
throughout plant growth stages is highly required, since each stage would be a particularMolecules 2021, 26, 2756 9 of 18
physiological and biochemical scenario to respond to salt stress. For instance, it has been
reported that the growth of one-month-old cape gooseberry seedlings may be favored by
salt concentrations (ca. 30 mM) [31], even concentrations close to 25 mM NaCl do not alter
the growth parameters of P. peruviana during in vitro cultures [46]. In addition, no growth
alterations on roots and stems of 12-week plants were observed using 60 mM NaCl [4], and
90 mM NaCl (9.6 ds/m) can be considered as the optimum salt concentration threshold for
stress on the growth of P. peruviana [31]. In the present study, the vegetative stage (209) did
not show an effect associated with a response to salinity conditions for any of the estimated
growth parameters. It is possible that Ca2+ supplementation during fertilization helped to
alleviate the inhibitory effect of salt on growth at this stage, as reported in other species of
the genus Physalis and cotton plants [47,48]. However, in the case of the higher stages, such
supplementation appeared to be insufficient due to the salt accumulation in the substrate.
In most cases, salinity reduces plant growth because it affects various metabolism
aspects. The root part is the first plant organ that faces the imbalance of the ion reserves
in substrate. The size reduction in plants at mature stages could be related to cumulative
effects of osmotic stress and ionic toxicity due to salinity, manifesting an exacerbated effect
as salt concentration increases, as reported for several Physalis plants [49]. In general,
plants expend energy to counteract stress and try to maintain balanced itself, so growth
is postponed. One of the stress-related symptoms is the undersized stems and leaves,
which translates into a compensation of photosynthetic activity to capture ROS and other
salt-stress-induced metabolites [41]. The effect of salt stress on growth of Physalis, using
high salt concentrations (>60 mM NaCl), was investigated in previous studies, and an
inverse effect between salt concentration and plant growth was found [50]. In other words,
higher salt concentrations promoted a lower plant growth since the dry and fresh weight
of shoots and plant length were found to be reduced [48]. In this study, a significant
reduction in aerial and root length was observed in the high salinity treatment (i.e., 90 mM)
compared to the control. Additionally, a reduction in the dry mass of the aerial and root
parts, and the other growth parameters in reproductive stages, such as flowering and
fruiting, was observed. The results obtained here for the cape gooseberry growth are very
important, since the effect of salinized treatments on growth was particularly evident at
the commercially important production stages. This fact can be reasoned because, during
flowering and fruiting, the plant requires inputs for flower production and fruit filling,
so the reduction in the leaf area and leaf biomass directly affects photosynthesis and, in
turn, the ability to produce high quality fruits in large volumes [51]. Colombian ecotype of
P. peruviana was used in the present study and, being a perennial plant, the salt elimination
is very important to avoid foliar abscission for ensuring leaves throughout plant life [52].
Salinity induces the up-regulation of some compounds in leaves and roots, such as
abscisic acid, which is related to ROS production [53,54], promoting the additional syn-
thesis and accumulation of antioxidant compounds like anthocyanins and other phenolic
compounds [55]. Therefore, phenolic compounds, more exactly flavonols (free or con-
jugated) play an important role during acclimation and/or adaptation of plants to the
stressful environment, as they provide unusual qualities for overcoming abiotic stress, such
as salinity. In this way, a series of complex metabolic processes are triggered and involved
different biological activities such as reducing agents, donors of hydrogen atoms and/or
electrons and free radical scavengers [56,57]. The abundance and/or diversity of phenolic
compounds varies according to the plant growth stage, being prominent when the plant
reached a certain maturity level [19] since this is a way of responding against biotic and
abiotic stresses such as toxic levels of salt [1]. Under a condition without abiotic stress,
plants have a metabolic heritage in the reproductive stage. However, during a salinized
condition, some metabolites may have been depleted in treatments due to salt stress, and
the upregulated compounds can be particularly related to a function against such a condi-
tion [8]. As observed in the heat maps of Figure 2, 15 most-contrasting metabolites among
salt treatments were selected based on VIP > 1 for each growth substage. Some contrasting
metabolites were common among the three (3 compounds) and two substages (3 and 11Molecules 2021, 26, 2756 10 of 18
compounds, respectively), but other contrasting metabolites were found to be unique for
a particular substage (14 compounds). Therefore, an entire set comprising 28 contrasting
metabolites for the three substages was then compiled (1–28, Table A2). These metabolites
were observed to be downregulated and upregulated (17 and 11 metabolites, respectively).
The non-treated cape gooseberry plants at substage 703 exhibited a higher number of
downregulated compounds, i.e., twelve most contrasting metabolites, comprising a phenol
(3), a flavonol (4), and nine withanolides (7, 8, 13, 14, 18, 19, 22, 23, and 28) (Table A2), in
comparison to the other growth stages.
Metabolic differences were evidenced by the sPLS-DA-derived scores plots for each
growth stage, indicating that the cape gooseberry responds metabolically to salinity. This
separation was more evident along the growth stages since the relative abundance of
metabolites for HS treatment decreased during development, while relative abundances in
the control group increased, which is rationalized as the normal plant maturity process.
For LS treatment at the 209 substage, quercetin-like glycosylated flavonoids 6 and 9 were
statistically significant (Figure 3A). This fact indicated that this mixed biosynthetic pathway
is activated [58] in combination with the action of UDP-glycosyltransferases, particularly
expressed to respond to abiotic stimuli and promote production of biologically-important
metabolites, as previously described for model organisms [59]. On the contrary, the free
flavonol quercetin was mainly related to the HS treatment at the same growth stage, pos-
sibly by a specific response to improve antioxidant features to cape gooseberry plants
and tolerate salinized conditions at the vegetative stage. During reproductive stages, the
metabolic and physiological plant responses were found to be different. For substages 603
and 703, no metabolites were related to LS groups, whereas quercetin (2) discriminated
the HS treatment. Unlike the vegetative stage, four withanolides were most abundant in
control plants, two at the 603 substage (7 and 8) and four at the 703 substage (7, 8, 14, and
23), suggesting that some metabolites are normally produced by this ecotype, but they
were downregulated by the effect of salt conditions. From an untargeted metabolomics-
based approach, compound 23 was found to be increased in P. peruviana fruits from those
plants produced under organic systems, possibly due to defensive reasons [32]. In this
sense, a clear effect of salt stress on metabolic profiles is related to a depletion of the
abundance of some withanolides by salt treatments. Contrarily, withanolides increased
considerably (> 80 mg/g dry weight) under high-temperature stress during thermotol-
erance experiments with P. peruviana [60]. On comparing the metabolite variations with
growth parameters, in the HS treatment at the fruiting stage, a reduction of the both abun-
dance of certain metabolites and growth was observed, possibly due to the reduction in leaf
growth to impulse biosynthesis. Although the vegetative stage was not strongly affected
during its growth, a higher number of metabolites were better statistically ranked by the
loadings vector, which mainly influenced the discrimination of salt treatments.
In the present study, under supervised feature classification and selection through
sPLS-DA, quercetin-like flavonols were found to be related to the metabolic response
against salt stress, even from the 209 substage, since they influenced the statistical discrimi-
nation between salt treatments and control. In fact, the box plot of compound 2 exhibited
a lesser dispersed relative abundance, indicating a more consistent response against salt
stress at the fruiting stage (Figure 3F). Quercetin (2) was recently found to mediate salt
tolerance in tomato plants through the enhancement of plant antioxidant defense and
glyoxalase systems, favoring plant growth and photosynthetic pigment synthesis [61].
It has been reported that the antioxidant activity in fruit trees increases if the plant is
affected by salt stress, for protecting tissues against ROS and oxidative damage [62]. Hence,
up-regulation of antioxidant compounds is considered a common response induced by salt
stress to maintain cellular function and physiological stability of plants [10]. The induction
of compound biosynthesis is also related to the accumulation of solutes in cellular or-
ganelles to promote osmoregulation. The imbalance caused by osmotic stress disrupts the
functionality of the primary metabolism, such as nutrient transport and evapotranspiration.
Therefore, the plant responds with a set of secondary metabolism-derived products andMolecules 2021, 26, 2756 11 of 18
modifies its growth to balance physiological processes and withstand salt stress [63]. In this
context, since cape gooseberry is moderately tolerant to salinity, the specialized metabolism
would be a response to overpass salt stress.
4. Materials and Methods
4.1. Plant Material
Seeds of Physalis peruviana were obtained by direct extraction of ripe fruits of the
Colombian ecotype from a local commercial crop. Seeds were separated from the pulp in a
mortar with distilled water (DW). Successive washes were then carried out with DW and
the seeds were subsequently dried with absorbent paper and stored in paper bags until
used [64].
4.2. Germination Assays:
A comparison was made on seed germination using four different pre-germination
methods, as reported in the literature, including a control. The seeds were disinfected with
a 1% NaClO solution for 1 min. Seeds were then placed in germination chambers. The
germination chamber consisted of one 150 × 22 mm2 Petri dish with absorbent paper. Thirty
freshly-removed P. peruviana seeds were placed onto the absorbent paper (Uline, Pleasant
Prairie, WI, USA). The seeds were watered three times per week with sterile distilled water
(SDW), or according to the corresponding treatment. There were three repetitions for each
treatment. The total number of seeds for each treatment was 90. The germination chambers
were maintained at room conditions (20 ◦ C, sunlight, 12/12 (day/night) photoperiod) to
initiate imbibition and subsequent germination. Seeds were considered as germinated if
the radicle was visible (at least 1 mm) [15,65]. The cumulative germination percentage
was measured every week for 5 weeks. The pre-germination treatments were selected and
organized as follows: (1) Fermentation: Seeds were directly stored with the fruit pulp in
a lidded bottle with 50 mL of DW during a week in darkness. After this time, the seeds
were washed with DW; (2) Wood ash: Seeds were immersed into a 150 mL mixture of DW
with 1.0 g of wood ash (obtained from a eucalyptus tree) during a week in darkness; (3)
Salinity (NaCl): A 60 mM NaCl solution in SDW was prepared to be supplied to the seeds
three times per week; (4) Commercial: Seeds were purchased from a local seller (Copragro
S.A.S, Bogotá, Colombia), previously treated with two antifungals (Thiram and Captan)
(Syngenta, Chicago, IL, USA) prior packaging; (5) Control: SDW was used to keep the
seeds moist inside the germination chambers.
Once the best treatment for rapid and homogeneous germination of the seeds was
selected, a new germination procedure was carried out to obtain seedlings with the two
cotyledons fully deployed.
4.3. Plant Material and Management
This experiment was carried out under greenhouse conditions (average temperature
14.3 ± 5.2 ◦ C, and 81.8% ± 10.3% relative humidity). The seedlings with deployed cotyle-
dons were transferred to blond peat (Pindstrup Plus Orange) (Pindstrup Mosebrug A/S,
Ryomgaard, Denmark) in 72-well seedbeds until they reached the 104 substage of the
P. peruviana BBCH scale [35], with daily irrigation until the substrate is saturated. They
were kept inside a tunnel with 50% polyshade. Once desired substage was reached, the
seedlings were individually transferred to 8 L plastic bags with a 2:1 loamy-silty soil:rice
husk mixture. The soil was previously solarized for five weeks as a disinfection procedure.
In addition, the required volume of water was determined to reach the field capacity of the
substrate and ensure adequate irrigation. For this, the cylinder volume equation was used
as indicated in Equation (1):
V = πr2 h (1)
where r corresponds to the radius of the cylinder and h is the height.Molecules 2021, 26, 2756 12 of 18
Using a ThetaKit probe (∆-T Devices Ltd, Cambridge, UK), the percentage of moisture
was estimated in the substrate and, knowing the volume of the bag, it was possible to
calculate the specific volume of irrigation for each bag, as in Equation (2):
θ FC − θ H%
V= × Vbag (2)
100
where θ FC corresponds to the expected field capacity, θ H% is the percentage value of
humidity that the probe throws and Vbag is the volume of the bag previously calculated.
Based on soil analysis, three applications of Mainstay Ca 21.4% (Cosmocel Iberica,
Zaragoza, Spain) were made, with an application dose of 20 mL/30 L, throughout the
culture cycle. The fertilization was managed in two ways: (1) foliar fertilization: provided
once per week from substage 209 until the end of the crop cycle (nutrifoliar: 2 cm3 /L;
carrier: 1 cm3 /L); (2) fertigation: A Hoagland’s solution (prepared as the mixture presented
in Table A1), suitable for the cultivation of gooseberry according to soil analysis, was
supplied once per week during vegetative stages, and twice per week during reproductive
stages. The irrigation of the crop was manual and depended on the percentage of humidity
obtained with the ThetaKit probe and the calculation made with Equation (2). This calcula-
tion was made for each plant (as biological replicate) three times a week. Weed control and
maintenance pruning were performed once per week. The distance between plants was
maintained, and the leaves did not touch each other.
4.4. Plant Treatments
Three treatments of 0 (control), 30 (low salinity), and 90 (high salinity) mM NaCl were
studied over one year. The salt concentrations were applied to the plants every two days.
Each experiment repetition comprised 36 experimental units (each experimental unit con-
stituted a plant in an individual bag), corresponding to plants of the same age and the same
transplanting time, to ensure twelve replicates per growth substage. They were arranged
in 8 L plastic bags, labelled as treatments or control, to involve an entire set of 108 plants.
The developmental substages selected for the study included a vegetative stage (209) and
two reproductive stages (603 and 703) on the BBCH scale for Physalis peruviana [35]. The
plants were harvested upon reaching each substage. Plant parts were separated into aerial
and root parts.
4.5. Growth Parameters
The growth parameters were taken at each harvesting time. Plants were allowed
to grow until they reached the substages 209 (nine visible apical bifurcated shoots), 603
(three open flowers), and 703 (three fruits with typical size and shape), according to the
BBCH scale [35]. After removal, roots were washed, and the following growth parameters
(such as length, leaf area, and dry-weight biomass) were measured and other indices (such
as root/aerial and leaf area/biomass ratios, and leaf mass and root mass fractions) were
calculated according to previously reported information [66,67].
4.6. Extraction of Plant Material
To prepare the ethanol-soluble extract, freshly harvested plant material (aerial part)
was rapidly frozen, lyophilized, dipped in liquid nitrogen and ground into a fine powder
using a mortar. Dry, ground plant material was extracted with 96% ethanol under stirring
using stainless steel beads for 30 min at room temperature. The resulting mixtures were
filtered and concentrated under reduced pressure. The resulting raw extracts were stored
(maximum 3 days) at −20 ◦ C until analysis.
4.7. LC-MS Analysis, Annotation, and Identification of Top-Ranked Metabolites
Ethanol extracts were analyzed by liquid chromatography coupled to mass spectrom-
etry using a Shimadzu LC-MS 2020 system (Shimadzu Corp., Kyoto, Japan). For this, a
solution of each extract was prepared at a concentration of 5 mg/mL in absolute ethanol,Molecules 2021, 26, 2756 13 of 18
filtered on a 0.22 µm pore silicone/PTFE membrane (Restek Corp., Bellefonte, PA, USA).
Separation of the components of the extracts was performed on a Synergi Hydro-RP C-18
(4.6 × 150 mm2 and 5 µm) (Phenomenex Inc., Torrance, CA, USA) using an LC-MS system
consisting of a separation module equipped with a photodiode array detector (DAD),
electrospray ionization (ESI) and a detector with a quadrupole mass analyzer (Shimadzu
Corp., Kyoto, Japan). The flow rate was 0.7 mL/min, and for the mobile phases, 1% formic
acid in water Mili-Q and 1% formic acid in acetonitrile (ACN) were used. We prepared
1.0 µg/mL in absolute ethanol, and 10 µL of this solution was injected into the LC system.
The analysis was monitored at a wavelength of 270 nm. The values of mass/charge ratio
(m/z) were obtained under ionization in negative mode. The spectrometer parameters were
configured as follows: ion spray voltage −0.5 kV; block temperature 400 ◦ C; drying gas
flow 15 L/min (N2 ). The LC-MS-derived raw data were pre-processed with Mzmine 2.2
(Whitehead Institute for Biomedical Research, Cambridge, MA, USA) to perform the typical
data pre-treatment comprising feature detection, deconvolution, filtering, deisotopization,
gap-filling, gap-filled, alignment, and normalization to get list of individualized features
and their peak areas [68]. Feature annotations were initially performed after detailed
scrutiny of the MS data combined with ultraviolet-visible (UV-Vis) spectra of VIP-selected
most contrasting metabolites (1–28, Table A2), in comparison to the chemical characteristics
previously reported to Physalis species [16,32,33] and the information registered in the
dictionary of natural products and the metlin database [69,70]. The highly sPLS-DA top-
ranked compounds (2, 6–9, 14, and 23) were finally identified using authentic standards.
Quercetin (2) was purchased from Sigma-Aldrich (St. Louis, MO, USA). Other compounds
were obtained after purification from gathered extracts by semi-preparative HPLC, using a
Prominence system (Shimadzu, Columbia, MD, USA) and a reversed-phase Phenomenex
Luna C18 column (250 × 10 mm2 and 5 µm) (Phenomenex, Torrance, CA, USA). Ten
consecutive injections of target extract (400 µL, 50 mg/mL in EtOH) were separated at a
flow rate of 3 mL/min using different mixtures of solvents A (1% formic acid in ACN)
and B (1% aqueous formic acid) under isocratic elution. Previously annotated target peaks
were collected in highly depurated fractions to afford pure compounds. Structures of
purified compounds were elucidated by 1 H and 13 C NMR on an Agilent DD2 600 MHz
spectrometer (Bruker, Billerica, MA, USA) using CDCl3 as solvent. NMR data of com-
pounds 6–9, 14, and 23 coincided completely with the data of reported compounds, such as
quercetin 3-O-β-glucosyl(l→6)-β-galactoside (6) ([71], quercetin 3-O-β-robinobioside-7-O-
β-glucoside (9) [72], withaphysanolide (7) [73], physanolide A (8) [74], physalin B (14) [74],
and physagulin D (23)[75].
4.8. Statistical Analysis
Normal distribution of growth parameter data was assessed by means of a Shapiro-
Wilks test (p > 0.5). Once the normal distribution was verified, an one-way analysis of
variance (ANOVA) was performed, followed by multiple comparisons through a post hoc
Tukey’s HSD test to define the significant differences between treatment means, using R
project software version 3.0.2 (R Foundation, Vienna, Austria). In the case of comparative
analysis of metabolic profiles, the resulting whole data matrix was imported into the
Metaboanalyst 4.0 (McGill University, Montreal, QC, Canada) [76]. A classical partial least
squares regression with discriminant analysis (PLS-DA) was initially carried out to filter the
raw dataset according to the resulting VIP scores for selecting the most contrasting features
between salt treatments per growth stage. Each compared group had 12 independent
replicates. This was combined with intuitive visualization through heat map distributions.
Subsequently, sparse partial least squares regression with discriminant analysis (sPLS-
DA) was also employed for dimension reduction, classification, and identification of
spectral features that drive group separation, particularly by the selection of the top-ranked
metabolites that influenced the most the specific discrimination between salt treatments,
using mean centering and default parameters (5 components, 10 variable per component,
and 5-fold cross-validation).You can also read


