A low CO2-responsive mutant of Setaria viridis reveals that reduced carbonic anhydrase limits C4 photosynthesis
←
→
Page content transcription
If your browser does not render page correctly, please read the page content below
Journal of Experimental Botany, Vol. 72, No. 8 pp. 3122–3136, 2021
doi:10.1093/jxb/erab039 Advance Access Publication 2 February 2021
This paper is available online free of all access charges (see https://academic.oup.com/jxb/pages/openaccess for further details)

RESEARCH PAPER

A low CO2-responsive mutant of Setaria viridis reveals that
reduced carbonic anhydrase limits C4 photosynthesis
Jolly Chatterjee1,†, , Robert A. Coe2, Kelvin Acebron1,*, , Vivek Thakur1,3, Ragothaman M. Yennamalli4,

                                                                                                                                                                  Downloaded from https://academic.oup.com/jxb/article/72/8/3122/6126531 by guest on 20 September 2021
Florence Danila5, , Hsiang-Chun Lin1, Christian Paolo Balahadia1, Efren Bagunu1, Padhma Preiya P. O. S.3,
Soumi Bala5, Xiaojia Yin1, Govinda Rizal1, Jacqueline Dionora1, Robert T. Furbank5, ,
Susanne von Caemmerer5 and William Paul Quick1,6,†
1
  C4 Rice Centre, International Rice Research Institute (IRRI), Los Baños, Philippines
2
  CSIRO Agriculture Flagship, Australian Plant Phenomics Facility, GPO Box 1500, Canberra, ACT 2601, Australia
3
  Department of Systems & Computational Biology, School of Life Sciences, University of Hyderabad, Hyderabad-500046, India
4
  Department of Bioinformatics, School of Chemical and Biotechnology, SASTRA Deemed to be University, Thanjavur,
Tamilnadu-613401, India
5
  ARC Centre of Excellence for Translational Photosynthesis, Research School of Biology, Australian National University, GPO Box 1500,
Canberra, ACT 2601, Australia
6
  Department of Animal and Plant Sciences, University of Sheffield, Sheffield S10 2TN, UK

* Present address: IBG-2, Forschungszentrum Jülich (FZJ), D-52425 Jülich, Germany.
†
  Correspondence: j.chatterjee@irri.org or w.p.quick@irri.org

Received 14 September 2020; Editorial decision 15 January 2021; Accepted 30 January 2021

Editor: Christine Raines, University of Essex, UK

Abstract
In C4 species, β-carbonic anhydrase (CA), localized to the cytosol of the mesophyll cells, accelerates the interconver-
sion of CO2 to HCO3–, the substrate used by phosphoenolpyruvate carboxylase (PEPC) in the first step of C4 photosyn-
thesis. Here we describe the identification and characterization of low CO2-responsive mutant 1 (lcr1) isolated from
an N-nitroso-N-methylurea- (NMU) treated Setaria viridis mutant population. Forward genetic investigation revealed
that the mutated gene Sevir.5G247800 of lcr1 possessed a single nucleotide transition from cytosine to thymine in a
β-CA gene causing an amino acid change from leucine to phenylalanine. This resulted in severe reduction in growth
and photosynthesis in the mutant. Both the CO2 compensation point and carbon isotope discrimination values of the
mutant were significantly increased. Growth of the mutants was stunted when grown under ambient pCO2 but re-
covered at elevated pCO2. Further bioinformatics analyses revealed that the mutation has led to functional changes
in one of the conserved residues of the protein, situated near the catalytic site. CA transcript accumulation in the mu-
tant was 80% lower, CA protein accumulation 30% lower, and CA activity ~98% lower compared with the wild type.
Changes in the abundance of other primary C4 pathway enzymes were observed; accumulation of PEPC protein was

Abbreviations: A, net rate of CO2 assimilation; CA, carbonic anhydrase; CCM, carbon-concentrating mechanism; CE, maximum carboxylation efficiency; Ci, inter-
cellular CO2 concentration; Fv/Fm, maximum quantum efficiency of PSII photochemistry; Fv′/Fm′, maximum efficiency of PSII in the light; lcr, low CO2-responsive
mutant; LSU, large subunit of Rubisco; MDH, malate dehydrogenase; ME, malic enzyme; NMU, N-nitroso-N-methylurea; NPQ, non-photochemical quenching;
PEPC, phosphoenolpyruvate carboxylase; PPDK, pyruvate phosphate dikinase; qP, fraction of the maximum PSII efficiency that is realized in the light; PPFD,
photosynthetic photon flux density; Rd, dark respiration rates; qP, photochemical quenching; QY, quantum yield; Γ, CO2 compensation point; Φ, quantum yield for
CO2 assimilation; ΦPSII, PSII operating efficiency.
© The Author(s) 2021. Published by Oxford University Press on behalf of the Society for Experimental Biology.
This is an Open Access article distributed under the terms of the Creative Commons Attribution License (http://creativecommons.org/licenses/by/4.0/),
which permits unrestricted reuse, distribution, and reproduction in any medium, provided the original work is properly cited.
Identification of an S. viridis mutant with reduced CA activity | 3123

significantly increased and accumulation of malate dehydrogenase and malic enzyme decreased. The reduction of
CA protein activity and abundance in lcr1 restricts the supply of bicarbonate to PEPC, limiting C4 photosynthesis and
growth. This study establishes Sevir.5G247800 as the major CA allele in Setaria for C4 photosynthesis and provides
important insights into the function of CA in C4 photosynthesis that would be required to generate a rice plant with a
functional C4 biochemical pathway.

Keywords: Carbonic anhydrase, C4 photosynthesis, C4 rice, forward genetics, mutant screen, Setaria viridis

Introduction                                                           components modulating photosynthetic cellular specialization

                                                                                                                                           Downloaded from https://academic.oup.com/jxb/article/72/8/3122/6126531 by guest on 20 September 2021
                                                                       (suberization of the BSC wall and positioning of the chloro-
C4 plants have evolved a combination of anatomical and bio-            plast), localization of C3 and C4 photosynthetic enzymes (C4
chemical specializations that concentrate CO2 around Rubisco           biochemistry, the Calvin cycle, and the photorespiratory cycle),
(Hatch, 1987). In C4 leaves, specialized mesophyll cells (MCs)         the identity of transporters supporting C4 metabolic flux, and
and bundle sheath cells (BSCs) support a biochemical CO2               the regulators of C4 gene expression. Knowledge of these pro-
pump (von Caemmerer and Furbank, 2003) where each mol-                 cesses is an essential requirement for engineering a functional
ecule of CO2 entering the cytosol of the MCs is converted              C4 photosynthetic pathway into rice.
to bicarbonate (HCO3–) by the activity of carbonic anhydrase              In an earlier study, we described the development of high-
(CA). This is then incorporated into phosphoenolpyruvate               throughput screening for identifying CO2-responsive mutants
(PEP) by PEP carboxylase (PEPC), yielding the C4 acid                  of the C4 monocot model species Setaria viridis (L.) P. Beauv.
oxaloacetate (OAA). In most agriculturally important C4 spe-           (Coe et al., 2018). The mutant population was generated using
cies, the OAA is taken up into the chloroplast of the MCs              N-nitroso-N-methylurea (NMU). There, we could identify 46
where it is reduced to malate by NADP-dependent malate                 candidate mutant lines with reduced Fv/Fm relative to wild-
dehydrogenase (NADP-MDH). Malate is exported back to                   type (WT) plants under conditions of low CO2 partial pressure
the cytosol and then diffuses into the BSCs. It is then trans-
                                                                       (pCO2) at 15 µbar (0.0015%). This threshold level was deter-
ported into the chloroplast and oxidatively decarboxylated
                                                                       mined considering the difference in the CO2 compensation
by NADP-dependent malic enzyme (NADP-ME), yielding
                                                                       point in C3 and C4 species. Reduction in Fv/Fm with an in-
CO2, NADPH, and pyruvate. CO2 is assimilated by Rubisco
                                                                       creased CO2 compensation point is used as a signature for de-
and pyruvate is transported into the chloroplast of the MCs
                                                                       creased photosynthetic efficiency and a loss of C4 function.
where it is converted to PEP by pyruvate phosphate dikinase
                                                                          In 1990, Hatch and Burnell (1990) demonstrated that in
(PPDK). This pump can elevate CO2 in this compartment by
                                                                       vivo CA activities in C4 leaves were only just sufficient to
up to 10-fold above air levels (Furbank and Hatch, 1987; von
Caemmerer and Furbank, 2003), suppressing photorespiration             support rates of PEP carboxylation. Since then, it has been
and CO2 saturating photosynthesis in air.                              debated whether high CA activities are a requirement for evo-
   The efficiencies of C4 photosynthesis have long driven              lution of C4 photosynthesis. The enzyme is a part of a mul-
interest in engineering a C4 photosynthetic pathway into               tiple gene family, where one gene may give rise to multiple
C3 crop species (Matsuoka et al., 2001; Häusler et al., 2002;          CA isoforms via alternative splicing of the coding sequence
Miyao, 2003; Kajala et al., 2011; Miyao et al., 2011). In rice, this   (CDS). Functional evaluation of any of these genes gives dif-
could potentially lead to increases in radiation use efficiency        ferent phenotypic expression in different species, which makes
and yield of up to 50% (Hibberd et al. 2008). The C4 Rice              it difficult to interpret its role unambiguously. Whether the
Consortium (https://c4rice.com) is currently investigating             CA activity in C4 leaves has been reduced by transgenesis or
the feasibility of engineering the leaf anatomy and biochem-           other genetic means; conflicting reports have suggested either
istry required to support a two-celled photosynthetic pathway          a large inhibition of photosynthesis (von Caemmerer et al.,
(Kajala et al., 2011; Lin et al., 2016). To help achieve this, a       2004) or that little or no effect was observed (Studer et al.,
toolkit of genes is being assembled. Unknown genes are being           2014; Osborn et al., 2017). In this study, by adopting a for-
identified through forward genetics, whereby large populations         ward genetics approach, we identify the CA allele responsible
of C4 plants are mutagenized and then screened for a loss of           for the carbon-concentrating mechanism (CCM) in the C4
C4 photosynthetic characteristics and function (Furbank et al.,        model species S. viridis to be the underlying causal gene of the
2009). This approach has already led to the identification of          low CO2-responsive mutant lcr1 (NM04534 in Coe et al., 2018)
some promising mutants with altered leaf anatomy (Rizal et al.,        using next-generation sequencing and mapping. We study in
2015, 2017). However, there remains much which is unknown              detail the role of CA in C4 photosynthesis, plant growth, and
about the efficiencies, genes, and mechanisms underpinning             isotope discrimination in S. viridis. This work provides insights
the C4 photosynthetic process. Among these are the genetic             into the function and genetic regulation of C4 photosynthesis.
3124 | Chatterjee et al

Materials and methods                                                        photochemistry (Fv/Fm), which gives a good understanding of a plant’s
                                                                             photosynthetic efficiency, was calculated as: (Fm–Fo)/Fm. Detailed kin-
Plant material                                                               etic studies were performed on the M5 generation mutant plants and the
A low CO2-responsive mutant (NM04534, lcr1) was identified from a            WT. Measurements of rapid chlorophyll fluorescence kinetics were made
population of S. viridis A10.1 NMU mutants as described in Coe et al.        following acclimation for 20 s at six different actinic light intensities be-
(2018). The mutant was identified based on its reduced Fv/Fm values in       tween 25 µmol m–2 s–1 and 1000 µmol m–2 s–1. Plants were characterized
ambient (390 µbar pCO2) and in low CO2 conditions (15 µbar pCO2).            for the maximum efficiency of PSII in the light if all centres were open
The Fv/Fm values of the successive generations of lcr1 were checked in       (Fv′/Fm′), (Fm′–Fo′)/Fm′; PSII operating efficiency (ΦPSII), (Fm′–F′/Fm′);
ambient and low CO2 conditions using a PlantScreen Compact System            and photochemical (qP) and non-photochemical quenching (NPQ). qP
(Photon Systems Instruments) machine with replicated progenies to            (Fm′–F′)/(Fm′–Fo′), relates PSII maximum efficiency to operating effi-
finally achieve a stable phenotype in the M5 generation. A single M5         ciency; and NPQ [(Fm/Fm′)–1] estimates the rate constant for heat loss
mutant line (progeny number 23-50) was selected and advanced for             from PSII. F and F′ are the fluorescence emission from a dark- or light-
further characterization and gene identification. The mutant is charac-      adapted leaf; Fo and Fo′ are the minimal fluorescence from a dark- and
                                                                             light-adapted leaf; Fm and Fm′ are maximal fluorescence from a dark- and

                                                                                                                                                             Downloaded from https://academic.oup.com/jxb/article/72/8/3122/6126531 by guest on 20 September 2021
terized for its photosynthetic, leaf anatomy, and biochemical characters
mostly on the plants of the M5 and M6 generation, except the Fv/Fm           light-adapted leaf, respectively; and Fv and Fv′ are the variable fluores-
value, which was measured throughout as a marker to select the true          cence from a dark- and light-adapted leaf. Details of the method are
candidate mutants. The seeds of S. viridis A10.1 were obtained from Dr       given in Coe et al. (2018). Fluorescence values represent the median of
Thomas Brutnell (Danforth Plant Science Center), and the rice seeds          fluorescence values obtained for each plant and nine plants per line.
were obtained from the genebank of the International Rice Research
Institute (IRRI), Philippines.                                               Plant biomass
                                                                             The number of tillers was counted and plant height was measured at the
                                                                             maximum tillering stage taking measurements from the soil surface to
Plant growth conditions                                                      the tip of the youngest fully expanded leaf prior to destructive biomass
Plants were grown in two different locations, at the IRRI, Los Banos,        measurements. All above-ground biomass (leaves, stems, and sheaths) was
Philippines (14.1699°N, 121.2441°E); and at the Australian National          harvested, weighed, placed in papers bags, and oven-dried at 70 °C until a
University (ANU), Canberra, Australia (35.2809°S, 149.1300°E) in dif-        constant dry biomass weight was achieved. Leaf chlorophyll content was
ferent CO2 levels. At IRRI, the plants were grown in low CO2 (15 µbar        estimated at the mid-tillering stage using the upper fully expanded leaves
pCO2), ambient (390 µbar pCO2), and elevated pCO2 level 1 conditions         employing a SPAD Chlorophyll Meter (SPAD, Konica Minolta, Japan).
(1% or 10 000 µbar pCO2), whereas in ANU the plants were grown in            Values given are the average ±SD of 10 plants per line.
elevated CO2 level 2 conditions—at 2% CO2 (20 000 µbar pCO2).
   Seed dormancy was broken by soaking in 5% liquid smoke (Wright’s
Liquid Smoke, B&G Foods Inc., Roseland, NJ, USA) for 24 h; they were         Leaf microscopy
then thoroughly rinsed with water and sown on moist filter paper. When       Leaf anatomy measurements were scored from the three cleared trans-
the hypocotyl was ~5 mm long, seedlings were transferred to 0.5 litre pots   verse leaf section images on the middle portion of one leaf each taken
containing sterilized soil from the IRRI upland farm mixed with 0.4 g l–1    from five plants per line. Cleared leaf sections and fresh leaf sections are
Osmocote Plus 15-9-12 (The Scotts Company Ltd, Thorne UK). Plants            prepared and imaged as described in Chatterjee et al. (2016).The sections
were cultivated in a greenhouse at ambient CO2 or inside custom-made         were imaged by an Olympus BX51 compound microscope using bright
growth chambers at different controlled CO2 concentrations, as men-          field for cleared sections and an Olympus BX52 disc spinning fluores-
tioned above. Irradiance in the greenhouse ranged between 500 µmol           cent microscope for fresh sections. The images were acquired with an
m–2 s–1 and 2000 µmol m–2 s–1 with a day length of between 11 h and          Olympus DP71 camera. These were analysed with Olympus CellSens
13 h. Day and night temperature ranged between 21 °C and 34 °C, with a       software (http://www.olympus-lifescience.com) and ImageJ software
relative humidity of between 60% and 70%. Inside the growth chambers,        v.1.43 (Schindelin et al. 2015) to calculate leaf thickness (µm), BSC (µm2),
~63% of the ambient solar irradiance is transmitted at the canopy level;     MC (µm2), and epidermal cell (µm2) area, and area of the chloroplast in
the air temperature was maintained at ~30 °C and a relative humidity of      BSC area (µm2).
60–70%.
   At the ANU, seeds were germinated in garden soil mix fertilized with
Osmocote (Scotts, Australia) in small containers before being trans-         Stomatal measurement
ferred to individual 2 litre pots. Plants were always grown in controlled-   Stomatal measurements were performed on a total of five leaves taken
environment chambers at an elevated CO2 level 2 (i.e. 2% CO2), irradiance    from five plants per line. Leaf nail varnished images of abaxial imprints
500 µmol photons m–2 s–1, 16 h photoperiod, and day and night tempera-       were used to score stomatal density and stomatal size under ×20 and ×40
ture of 28 °C and 24 °C, respectively. Pots were watered daily.              magnification with the BX51 Olympus bright field microscope. Stomatal
                                                                             density was counted from 25 random observations and the length and
                                                                             width were determined from observation of 25 random stomata per line.
Chlorophyll fluorescence imaging
Chlorophyll fluorescence images were acquired with the PlantScreen™
Compact System (Photon System Instruments) as described in de-               Photosynthetic measurements
tail in the previous report by Coe et al. (2018). Images were analysed       Gas exchange measurements were performed on M6 generation plants.
using Fluorcam 7 v1.024.2 (Photon Systems Instruments), and fluores-         Leaf gas exchange measurements were made using a Li-6400XT infrared
cence parameters were calculated in the software according to Genty          gas analyzer (LI-COR Biosciences) on the plants grown at ambient or in
et al. (1989). Plants are imaged for Fv/Fm after 30 min of dark adapta-      1% CO2 (elevated CO2 level 1). The cuvette was fitted with a standard
tion, and data were used for candidate selection, checking heritability      2×3 cm leaf chamber and a 6400-02B light source. Measurements were
of the low Fv/Fm character in the mutant, confirmation of BC1F1, and         made after the leaves were acclimated in the cuvette for ~30 min, with
BC1F2 population screening. The maximum quantum efficiency of PSII           a constant air flow rate of 400 μmol s–1, leaf temperature of 30 °C, leaf
Identification of an S. viridis mutant with reduced CA activity | 3125
to air vapour pressure deficit between 1.0 kPa and 1.5 kPa, and relative 2017). Simultaneous measurements of CO2, H2O, C18O16O, and H218O
humidity of 60–65%. Data were acquired between 08.00 h and 13.00 h. were made by coupling two LI-6400XT gas exchange systems to a TDL
Measurements were made on at least three plants during the tillering stage (model TGA200A, Campbell Scientific Inc.) and a cavity ring-down
on the mid-portion between the proximal and distal end of a fully ex- spectrometer (L2130-i, Picarro Inc., Sunnyvale, CA, USA) to measure the
panded leaf.The response curves of the net CO2 assimilation rate (A, µmol oxygen isotope composition of water vapour.The system is essentially that
m–2 s–1) to changing intercellular pCO2 (Ci, µbar) were acquired by first described above except that the TGA100a was replaced by a TGA200A
stabilizing the plants in 400 µbar pCO2 and then increasing the Ca (pCO2 and the additional laser for water vapour measurements was added to-
in the cuvette) stepwise from 20 µbar to 2000 µbar at a photosynthetic gether with a 16 port distribution manifold.The sample and reference gas
photon flux density (PPFD) of 1800 µmol photon m–2 s–1 at an appro- streams were sampled with a T junction in the match valve tubing and in
priate O2 level (2, 21, 40, 60, and 80% O2). The CO2 compensation point the reference line of the LI-6400XT, respectively. This allowed leaves of
(Γ) and maximum carboxylation efficiency (CE) were calculated from two plants to be measured in sequence, with each LI-6400XT sampled
the intercept (Vogan et al., 2007) and slope (Wang et al., 2006) of the by the TDL at 4 min intervals for 20 s at the sample and reference line.
CO2–response curves. Light–response curves were acquired by increasing The Picarro cavity ring-down spectrometer sampled for 3 min, so that
the PPFD from 0 to 2000 µmol photon m–2 s–1 at a Ca of 400 µbar. The
Downloaded from https://academic.oup.com/jxb/article/72/8/3122/6126531 by guest on 20 September 2021
leaves were sampled at 6 min intervals. Gas exchange was calculated using
quantum efficiency for CO2 assimilation (Φ) was calculated from the slope the equations presented by von Caemmerer and Farquhar (1981), and Δ
of the light–response curves (PPFD3126 | Chatterjee et al
phenotype are likely to be common to all individuals of the mutant pool the mutant, and a heterodimer made of β-CA isoforms (Sevir.5G247800
(yielding a mutant allele frequency of 1); however, such variants will ei- and Sevir.5G247900.1). This was done so that an isoform was hypothe-
ther be absent or in a heterozygous state in the individuals of the azygous sized to interact with other isoforms, leading to re-establishment of the
pool (yielding a mutant allele frequency of ~0.33). Such variants (mutant lost function due to mutation at position 156.
pool) are also likely to show a typical linkage pattern with the neigh-
bouring variants in the mutant pooled sample. Therefore, genomic loci
harbouring such variants were extracted from the mutant pool and were Candidate gene expression analysis
considered as candidates. Progenies of the M6 generation were used for gene expression analysis.
The candidate mutations were annotated using the S. viridis genome Plants were grown in ambient CO2 conditions in IRRI. The youngest
annotation available at the Phytozome database (release 12; https:// fully expanded third leaves were harvested for total RNA extraction
phytozome.jgi.doe.gov/pz/portal.html). Mutations located within a gene using TRIZOL (Invitrogen). Total RNA was treated with RQ1 RNase-
leading to an alteration to protein sequence became the basis to identify free DNase (Promega). DNase-treated samples were reverse transcribed
candidate genes. using the First-strand cDNA synthesis kit (Roche Diagnostics). cDNA
Downloaded from https://academic.oup.com/jxb/article/72/8/3122/6126531 by guest on 20 September 2021
samples were normalized to 100 ng µl–1 for all the quantitative PCR
Functional characterization of amino acid substitution by (qPCR) experiments using a NanoDrop 8000 spectrophotometer
sequence conservation and protein structural analysis (ThermoFisher Scientific). LightCycler 480 SYBR Green I Master mix
In order to examine the effect of Leu156Phe substitution, the amino (Roche Diagnostics) was used as dye for the qPCR run on StepOnePlus
acid conservation profile was first obtained. Members of the ‘Carbonic Real-Time PCR (ThermoFisher Scientific). Three biological replicates
anhydrase 2’ gene family from Angiosperms were obtained from the for the WT and mutant line were obtained. Relative gene expression
Phytozome database (https://phytozome.jgi.doe.gov), available under was computed using the 2–ΔΔCt method (Livak and Schmittgen, 2001;
the ‘Gene ancestry’ tab of the Sevir.5G247800 information page. Using Schmittgen and Livak, 2008) with polylpolyglutamate synthase (FGS;
the Biomart tool of Phytozome, 226 peptide sequences were extracted Sv035045) and glyceraldehyde 3-phosphate dehydrogenase (GAPDH;
and multiple-aligned using the MAAFT tool (version 7; https://mafft. Sevir.1G225700) as internal control genes with primer sequences
cbrc.jp/alignment/server/; Mode: L-INS-i). Fifteen sequences, which ap- obtained from Lambert-Frotte (2015). Amplification specificities of all
peared partial/incomplete, were dropped and the fully conserved residues primers used were analysed using melt-curve analysis on each qPCR run.
were finally identified from the multiple alignment itself. Primer sequences used were: 5′-GCGGGTGCCTTTGCCTCCCT
The mechanism of β-CA function in plants had been thoroughly and 5′-CTGGGTGCCTGGCCCTCCT for Sevir.5G247800.1,
examined in the β-CA protein of Pisum sativum by Kimber and Pai 5′-TGCTTCGCTGGGTTGAGCATCGT and 5′-CTGGGTGCCT
(2000), wherein the residues were identified for Zn binding, active site, GGCCCTCCT for Sevir.5G247800.2, 5′-CACCTTCTCCTCCACC
catalytic cleft formation, non-catalytic bicarbonate-binding pocket, and GCACA and 5′-GCGATGTTGCGGACAGCGA for Sevir.5G247900,
solvent access. To further explore the role of the residues in β-CA func- and 5′-CGCCGCGGGAGAACCCGA and 5′-CGGCCCGAACAG
tion, and loss of function due to Leu156Phe substitution, structural CATGGGGT for Sevir.5G248000. Transcript abundance for
models were generated and analysed. The native and mutant peptide se- Sevir.2G245200 was undetectable and so was not included in the analysis.
quence of Sevir.5G247800 was given as input to the Rosetta tool to build
3-D protein structures using the comparative modelling approach (Kim
et al., 2004). Rosetta provided five models with a confidence score ran- Leaf protein and western blot
ging from 0.0 to 1.0, where a confidence score of 0.0 is indicative of a Progenies of the M6 generation were used for protein analysis. Leaf sam-
bad model and 1.0 of a perfect model (Song et al., 2013). ples were harvested between 09.00 h and 11.00 h from the fourth fully
Among the five models, the structure present in the same conformation expanded leaf of plants grown at ambient CO2 conditions at IRRI.
as in Type I CA (based on the classification of Rowlett, 2010) was selected Proteins were extracted by homogenizing leaf material in 250 µl of
for further analysis of (i) contact order (CO) calculation; (ii) estimation of buffer containing 100 mM Bicine-KOH, pH 9.8, and 25 mM DTT (Lin
long-range interacting residues by identifying the primary, secondary, and et al., 2016). Proteins were fractionated by 12% (w/v) SDS–PAGE with
tertiary shell of residues; and (iii) analysing the dimer interface of native Precision Plus Protein™ Unstained Standards (BIORAD, USA) used
and mutant proteins. The CO quantifies the global protein topology and as the loading control. Samples were loaded based on equal leaf weight
correlates with protein folding rates (Plaxco et al., 1998); thus, by com- [34 µg for PEPC and Rubisco large subunit (LSU), 136 µg for PPDK,
paring intraprotein interactions of the native and mutant proteins, the and 340 µg for MDH, ME, and CA]. After electrophoresis, proteins were
stabilizing forces can be quantified. The higher the CO value, the higher electroblotted onto a polyvinylidene difluoride membrane and probed
the stabilizing factor of the interaction type (Rader et al., 2012). with rabbit antisera containing antibodies made against PEPC pro-
As a complementary method of identifying short- and long-range tein, MDH protein, ME protein, Rubisco LSU protein (all provided by
interactions, inspiration came from electron shells surrounding the nu- Richard Leegood, University of Sheffield, UK), PPDK protein (provide
cleus. In the case of proteins, residue 156 was considered as the nucleus, by Chris Chastain, Minnesota State University, USA), and CA protein
and the residues interacting with 156 (Leu or Phe) were considered as (provided by Jim Burnell, James Cook University, Australia).The dilutions
the first shell of interacting residues; the residues that interact with these of PEPC, PPDK, MDH, ME, Rubisco LSU, and CA antibodies were
first shell of interacting residues were considered as the second shell 1:20 000, 1:20 000, 1:5000, 1:5000, 1:30 000, and 1:5000, respectively.
of interacting residues, and similarly the residues that interact with the A peroxidase-conjugated secondary antibody (Sigma Aldrich, USA) was
second shell of interacting residues were identified as the third shell of used at a dilution of 1:5000, and immunoreactive bands were visualized
interacting residues (Drawz et al., 2009; Brodkin et al., 2011, 2015) In with ECL Western Blotting Detection Reagents (GE Healthcare, UK).
each shell, redundancy was removed and directionality of moving away Total soluble leaf protein content was determined using the Bradford
from the nucleus was maintained. method (Bradford, 1976).
The third analysis involved determining the residues interacting be-
tween the monomers of Sevir.5G247800. This directly established the
various unique interactions in native and mutant proteins that stabilize Enzyme activity
the dimer stoichiometry of Type I CA. This analysis was performed on Enzyme activities were measured on 5-week-old plants that were grown
three protein structures; the homodimer of the native, the homodimer of in 2% CO2 conditions (elevated CO2 level 2). A high CO2 concentrationIdentification of an S. viridis mutant with reduced CA activity | 3127
Downloaded from https://academic.oup.com/jxb/article/72/8/3122/6126531 by guest on 20 September 2021
Fig. 2. Chlorophyll fluorescence properties of lcr1. The graph shows the
Fv/Fm of wild-type (WT) and M5 generation lcr1 plants grown at ambient
and low pCO2. Values are the average ±SE of 10 individual plants per line.
Significant variation in values of the WT and lcr1 are denoted with *P3128 | Chatterjee et al
Downloaded from https://academic.oup.com/jxb/article/72/8/3122/6126531 by guest on 20 September 2021
Fig. 3. Plant morphology and leaf anatomy of lcr1. (A) The lcr1 plant shows a dwarf phenotype in ambient pCO2, but recovered in elevated pCO2.
Scale bar=5cm. (B) Leaves are thin in lcr1 in ambient pCO2. Quantification of leaf anatomical traits is given in Table 1. Red shows autofluorescence of
chloroplast; yellow shows the autofluorescence from the cell walls. Scale bar=50 µm. Plant images are redrawn from Coe et al. (2018).
Table 1. Morphological characteristics of lcr1 in ambient and elevated CO2
Characteristics Unit Ambient pCO2 Elevated pCO2
WT lcr1 WT lcr1
Biomass
SPAD Relative unit 36.6±1.4 a 10.8±0.5 b*** 42.9±0.5 a 41.6±0.5 a
Height cm 31.9±1.0 b 12.0±0.6 c*** 49.5±21.5 a 48.2±2.8 a
Tiller number Count 6.7±0.6 b 4.3±0.3 c*** 17.0±2.6 a 16.8±3.0 a
Panicle number Count 5.2±0.4 a 3.1±0.3 b** 8.1±0.4 a 7.1±0.3 a
Whole plant FW (vegetative part) g 6.83±0.4 a 4.61±0.3 b* 6.83±0.19 a 5.46±0.10.4 a
Whole plant DW (vegetative part) g 0.58 ±0.64 a 0.4±0.3 b* 1.00±0.44 a 0.840±0.20 a
Leaf anatomy
Leaf thickness µm 135.3±5.0 a 86.2±2.7 b *** 133.8±3.1 a 136.2±1.9 a
Area of a single mesophyll cell µm2 596.7±67.5 263.6±22.9 c*** 626.2±116.6 a 457.7±37.8 *
Area of an individual bundle sheath cell µm2 400. 2±39.8 a 188.6±14.7 c*** 400.2±23.6 a 362.7±31.4 b*
Chloroplast area in bundle sheath cells µm2 50.2±5.4 a 24.8±0.4 c*** 58.9±5.0 a 48.2±6.8 b*
Stomatal characteristics
Stomatal density Count per mm2 71.1±6.5 a 103.9±9.4 b*** 67.1±4.9 a 71.8±6.2 a
Stomatal length µm 27.4±1.3 a 24.7±1.4 a 25.8±0.3 a 24.6±0.8 a
Stomatal width µm 21.5±0.9 a 16.9±1.6 a 21.5±1.1 a 23.7±2.1 a
Biomass values are the average ±SD of 10 plants per line. Leaf anatomy scores are the average ±SE of at least five transverse leaf section images from
each of five plants per line. Stomatal measurements are the average ±SE of scores taken on the abaxial side of five leaves from five different plants per
line. Different letters denote statistical significance (***PIdentification of an S. viridis mutant with reduced CA activity | 3129
Table 2. Photosynthetic response of lcr1 in ambient and elevated CO2 conditions
Γ CE Rd Φ
µbar mol m–2 s–1 bar-1 µmol CO2 m s–2 –1
mol CO2 mol–1 quanta
Ambient pCO2
WT 2.27±0.62 a 0.56±0.04 a 1.01±0.18 b 0.06±0.00 a
lcr1 66.16±11.53 c*** 0.02±0.00 d*** 1.46±0.19 a* 0.05±0.00 b*
Elevated pCO2
WT 2.57±0.19 a 0.58±0.05 b 1.15±0.1 b 0.06±0.00 a
lcr1 18.00±2.63 b** 0.05±0.00 c** 1.06±0.14 b 0.06±0.00 a
CO2 compensation point (Γ), carboxylation efficiency (CE), respiration rates (Rd), and quantum yield for CO2 assimilation (Φ ). Measurements of Γ and CE
were made at a PPFD of 1800 µmol photons m–2 s–1, and Φ at a pCO2 (Ca) of 400 µbar and a leaf temperature of 30 °C. Values are the average ±SE of
Downloaded from https://academic.oup.com/jxb/article/72/8/3122/6126531 by guest on 20 September 2021
one leaf from 4–8 plants per line grown at ambient or elevated pCO2. Different letters denote statistically significant differences (***P3130 | Chatterjee et al
Table 3. Gas exchange measurements of lcr1 on elevated CO2 level 2-grown plants
Units WT lcr1
Gas exchange measurements with 13C laser
CO2 assimilation rate µmol m–2 s–1 33.8±1.2 13.7 1.2***
Stomatal conductance mol H2O m–2 s–1 0.29±0.03 0.41±0.03*
Ratio of intercellular to ambient CO2, Ci/Ca Ratio 0.46±0.04 0.82±0.01***
∆ 13C ‰ 2.8±0.35 13.3±0.34***
Gas exchange measurements with C18O16O laser
CO2 assimilation rate µmol m–2 s–1 36.1±1.7 14.3±0.79***
Stomatal conductance mol H2O m–2 s–1 0.31±0.03 0.39±0.02*
Ratio of intercellular to ambient CO2, Ci/Ca Ratio 0.45±0.02 0.81±0.09***
Downloaded from https://academic.oup.com/jxb/article/72/8/3122/6126531 by guest on 20 September 2021
∆C18O16O ‰ 22.6±1.9 16.2±3.2
The plants were grown in 2% CO2. The measurements were made at 2% O2, 25 °C leaf temperature, and an irradiance of 1500 µmol quanta m–2 s–1 in
a gas exchange system coupled to tuneable diode lasers that could measure either 13C or 18O discrimination. Asterisks denote statistically significant
differences (*PIdentification of an S. viridis mutant with reduced CA activity | 3131
involved in the active site, the catalytic cleft, and solvent ac-
cess, respectively; whereas two other residues present in the
tertiary shell are Cys87 and His147, both involved in ligand
binding (Supplementary Table S8).The mutant protein showed
new covalent interactions at primary, secondary, and tertiary
interacting shells of residues to accommodate the side chain
of Phe156. Some of them were unique to Phe156 interaction
shells, which also included residues involved in β-CA function
in plants (Supplementary Fig. S7; Supplementary Table S8).
Details of the functionally important amino acids of β-CA are
shown in Supplementary Table S9. Even the inter-monomer
Downloaded from https://academic.oup.com/jxb/article/72/8/3122/6126531 by guest on 20 September 2021
interactions in the homodimer were also affected in mutant di-
mers, with loss of seven out of 11 salt bridges (Supplementary
Table S6). The possibility of a heterodimer seemed unlikely as
none of the interactions of native homodimers was observed in
heterodimers (Supplementary Tables S6, S7).
Reduced abundance of CA transcript in lcr1
To confirm that the mutation had led to suppression of
β-CA transcript accumulation, quantitative real-time PCR
(RT-qPCR) was performed on the mutated β-CA transcript
of lcr1. Gene Expression Atlas data for S. viridis shows that
Sevir.5G247800 is the most expressed β-CA isoform in the
S. viridis leaf (Supplementary Fig. S8A). Expression of both
the splice forms of the candidate gene (Sevir.5g247800.1 and
Sevir.5g247800.2) was reduced in lcr1, and is 0.8- and 0.5-fold
lower than in WT plants (Fig. 7). Interestingly, the transcript
abundance of two other tandem β-CA genes on chromosome
5 (Sevir.5G247900 and Sevir.5G248000) was also reduced in
lcr1 (Supplementary Fig. S8B).
Reduced CA activity and abundance in lcr1
Enzyme assays revealed that the activity of CA in lcr1 leaves was
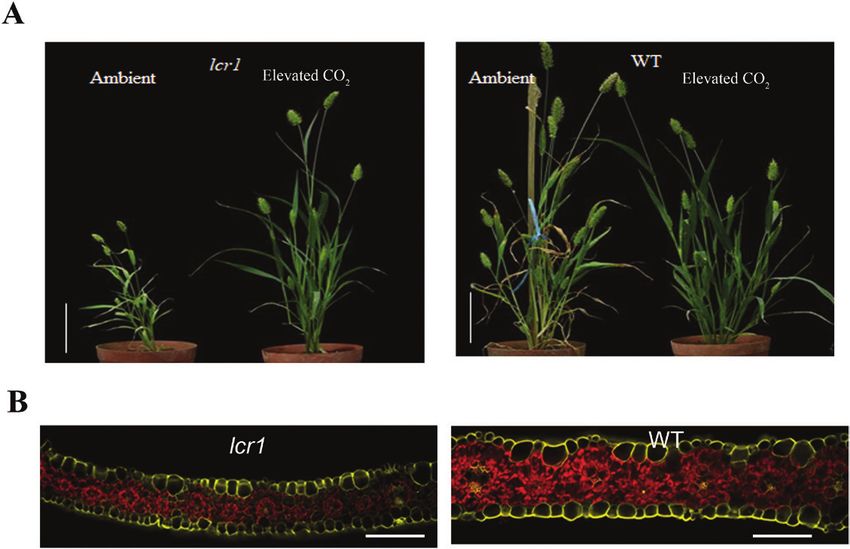
Fig. 6. Sequencing of the BC1F2 population. (A) Histogram of Fv/Fm at only 2% of that of the WT (Table 4). Immunoblotting with an
ambient pCO2 and after 48 h at low pCO2 in a BC1F2 population of lcr1. anti-CA antibody showed an ~30% reduction in protein ac-
Solid and dashed vertical lines are the average Fv/Fm of the wild type (WT) cumulation of CA in the mutant (Fig. 8). The abundance of
at ambient and low pCO2, respectively (n=300 for BC1F2 of lcr1; n= 50 for
the WT); ~25% of the population shows mutant response. (B) Mutant allele
primary C4 cycle enzymes was investigated to examine the
frequencies in chromosome 5. The graph represents the plot of mutant effect of the mutation on C4 metabolism. The accumulation of
allele frequency along the length of chromosome 5. The lines at 1 and 0.5 MDH (14% lower) and ME (15% lower) was also found to be
represent the threshold of allele frequency in the mutant and WT pool. reduced in the mutant, while the accumulation of PEPC in-
creased (10% higher) (Fig. 8). No significant differences in the
a confidence score of 0.7) showed a characteristic dimer of accumulation of PPDK or the Rubisco LSU were observed
β-CA, with both Leu156 and Phe156 buried inside the (Fig. 8). The activities of Rubisco or PEPC (Table 4) were
hydrophobic core of their respective structures, and located both significantly higher in lcr1 (Table 4). No differences were
~8 Å away from the catalytic site (Supplementary Fig. S6). observed in the localization of the proteins within the cellular
Comparison of the CO of the mutant structure with that of compartments (Supplementary Figs S9–S11).
the WT showed an increase in aromatic–aromatic interactions
(Δ=14), but a substantial decline in aromatic–sulfur inter-
actions (Δ= –25) (Supplementary Table S5). Leu156 interacts
with some of the functionally important residues (directly
Discussion
or indirectly). Three such residues, present in the secondary Carbonic anhydrase (EC 4.2.1.1) catalyses the reversible
shell of Leu156, are Gly151, Ile111, and Val170, which are conversion of CO2 to HCO3, which is the first step of C43132 | Chatterjee et al photosynthesis (Hatch and Burnell, 1990). There are multiple for C4 photosynthesis. The growth inhibition and photosyn- families of CAs in plants, of which the β-CA isoforms are the thetic phenotype of lcr1 is similar to that exhibited by antisense most prevalent in higher plants (DiMario et al., 2017). There suppression of a putative cytosolic CA (CA3) in the C4 dicot are also considerable variations in CA activity between species, Flaveria bidentis, where reduction of CA activity to 10% of that regardless of their photosynthetic capacities (Gillon and Yakir, of WT plants showed marked inhibition of CO2 assimilation 2001; Cousins et al., 2008). In C4 species, localized within the and a requirement of high CO2 for growth (von Caemmerer cytosol of MCs, CA provides the substrate for PEPC (Hatch et al., 2004; Cousins et al., 2006). However, our results contrast and Burnell, 1990) by accelerating the interconversion of CO2 with those reported for the monocot Zea mays (Studer et al., to HCO3– by up to 104-fold (Badger and Price, 1994), but 2014) and gene suppression work in S. viridis (Osborn et al., the importance of CA in C4 photosynthesis is still a matter of 2017) in which CA activity was reduced to 50% and
Identification of an S. viridis mutant with reduced CA activity | 3133

                                                                                                                                                                Downloaded from https://academic.oup.com/jxb/article/72/8/3122/6126531 by guest on 20 September 2021
Fig. 8. Soluble leaf proteins. (A) Western blots of wild types (WTs) and five individuals of lcr1. Protein was extracted from the fully expanded fourth leaf;
samples were loaded on an equal leaf weight (34 µg for PEPC and LSU, 136 µg for PPDK, 340 µg for MDH, ME, and CA). (B) Integrated density values
are expressed as fold changes relative to WT plants (average ±SE, n=5). Asterisks denote statistically significance differences relative to average WT
values (P
3134 | Chatterjee et al
to negatively impact the structural stability of the protein, and concludes that despite conflicting evidence, CA is a crucial first
eventually the normal functioning of the β-CA enzyme. The step in the C4 pathway, at least in S. viridis, and potentially in all
mutation even alters transcript accumulation for all CA genes C4 plants. In other species, different CA isoforms may take on
located on chromosome 5 and a significant reduction in total this role and be responsible for a similar phenotype.
leaf CA protein abundance and activity (Supplementary Fig.
S8; Fig. 8; Table 4).
Supplementary data
Sevir.5g247800 as a target to achieve CA response in
The following supplementary data are available at JXB online.
C3 plans
Table S1. Stomatal properties of lcr1 at elevated CO2 level 2.
CA in C3 plants has similar kinetic properties to those of Table S2. SNPs associated with the lcr phenotype.
Table S3. Sorghum β-CA gene Sobic.003G234500 expres-
Downloaded from https://academic.oup.com/jxb/article/72/8/3122/6126531 by guest on 20 September 2021
C4 plants (Hatch and Burnell, 1990), but it is localized in
a different subcellular compartment (Tanz et al., 2009). sion in leaf, extracted from Phytomine (https://phytozome.jgi.
Evolutionary studies predicted that the C4 CA has evolved doe.gov/phytomine/report.do?id=358824185#expression).
from C3 CA by loss of transit peptide and relocation of the Table S4. List of amino acid residues found to be fully con-
enzyme in the cytosol; eventually, it was recruited in the C4- served in β-CA homologues across entire plant genomes.
specific carboxylation function (Ludwig, 2012). It is predicted Table S5. Contact order values for each interaction type in
that the most abundant CA in the C3 chloroplast stroma was native and mutant structures.
actually modified in this way and present in multiple copies Table S6. Change in inter-monomer interactions between
in C4 species. Evidence from the phylogeny study shows that native and mutant structures of β-CA.
rice homologues LOC_Os01g45274 and LOC_Os09g28910 Table S7. Change in inter-monomer interactions between
are the closest homologues of Sevir.5G247800, with 83.3.% native (homodimer) and isoform heterodimer structures of
and 48.0% protein similarity, respectively. Both of these rice β-CA.
genes code for chloroplastic precursors of the β-CA gene in Table S8. List of amino acid residues found in primary, sec-
rice and might be potential targets to create a CA response in ondary, and tertiary shells of Leu156 and Phe156.
rice. On this note, the transgenic approach is adopted by the Table S9. List of functionally important amino acid residues
C4 consortium to overexpress the C4 CA from Z. mays in the identified in Pisum sativum β-CA by Kimber and Pai (2000)
MCs of rice using a cell-specific promoter (Kajala et al., 2011). and Rowlett (2010).
However, it still remains unclear if the multiple roles for CA Fig. S1. Recovery of leaf anatomical structure in elevated
in C3 plants are an important consideration for manipulating CO2.
the accumulation and activity of these proteins in C3 plants. Fig. S2. Rapid chlorophyll fluorescence kinetics.
Therefore, given the involvement of a single CA isoform in Fig. S3. Stomatal conductance (gs) of lcr1 and the WT in am-
the C4 pathway in S. viridis, it may be a better choice than the bient and elevated CO2 conditions.
CA of Z.mays, and can be incorporated in a C3 species along Fig. S4. Net CO2 assimilation rate (A) at different
with other C4 enzymes to create a C4 environment. Even the oxygen levels.
cis-element of Sevir.5G247800 could be tested for C4-specific Fig. S5. Expression pattern in leaf developmental gra-
gene expression in the mesophyll cytosol. dient of maize β-CA2 (Sevir.5G247800) orthologues
Overall, our results demonstrate unequivocally that CA GRMZM2G121878 and GRMZM2G348512.
is an absolute requirement for C4 photosynthesis, and that Fig. S6. Homology models of native and mutant
uncatalysed rates of CO2 to HCO3– appear to be insufficient Sevir.5G247800 protein structures.
to support C4 photosynthetic flux (Hatch and Burnell, 1990; Fig. S7. Venn diagram comparing combined interaction
Badger and Price, 1994). Our results highlight the potential shells (primary, secondary, and tertiary) of Leu156 and Phe156,
importance of expressing at least some CA in the mesophyll and further with the functionally important residues of β-CA
cytosol of rice MCs in order to generate a functional C4 bio- (as per Kimber and Pai, 2000).
chemical pathway capable of high rates of photosynthesis. Fig. S8. Expression pattern of β-CA isoforms in the Gene
Expression Atlas of S. viridis (A) and on quantification by
RT-qPCR in lcr1 (B).
Conclusion
Fig. S9. Representative images of immunolocalization of
Our results highlight the potential utility of chemical mutant carbonic anhydrase protein in wild-type and M6 generation
screens to identify key genes involved in C4 photosynthesis. lcr1 plants.
The mutant shows a large reduction in carbon assimilation, a Fig. S10. Representative images of immunolocalization
higher CO2 compensation point, and higher carbon isotope of Rubisco protein in wild-type and M5 generation
discrimination. Analysis reveals mutation in the β-CA gene in lcr1 plants.
the mutant, which not only causes a large reduction in CA ac- Fig. S11. Representative images of immunolocalization of
tivity in the, but also changes C4 enzyme abundance.This study PEPC protein in wild-type and M6 generation lcr1 plants.Identification of an S. viridis mutant with reduced CA activity | 3135
Acknowledgements Brodkin HR, Novak WR, Milne AC, et al. 2011. Evidence of the partici-
pation of remote residues in the catalytic activity of Co-type nitrile hydratase
The authors wish to thank Nikki Larazo for curation of the Setaria mu- from Pseudomonas putida. Biochemistry 50, 4923–4935.
tant population. We thank Michael Alcasid for backcrossing the mutants, Brown RH, Byrd GT. 1993. Estimation of bundle sheath cell conductance
Julius Ranada and Reychelle Mogul for assistance in developing the low in C4 species and O2 insensitivity of photosynthesis. Plant Physiology 103,
1183–1188.
CO2 screen, Irma Canicosa for the gas exchange measurements, Paolo
Salazar, Robert Nepomuceno, Michael Orlina, Jeffren Punzalan, Rey Burnell JN, Suzuki I, Sugiyama T. 1990. Light induction and the effect
of nitrogen status upon the activity of carbonic anhydrase in maize leaves.
Vergara, and Joseph Lagman for assistance with the screening, Walter Plant Physiology 94, 384–387.
Krystler Israel for leaf photosynthetic biochemistry, and Abigail Elmido-
Chatterjee J, Dionora J, Elmido-Mabilangan A, Wanchana S,
Mabilangan and Maricar Mercado for anatomy data collection. We are Thakur V, Bandyopadhyay A, Brar DS, Quick WP. 2016. The evo-
grateful to Hei Leung (IRRI, Philippines) for his valuable suggestions. lutionary basis of naturally diverse rice leaves anatomy. PLoS One 11,
Suggestions by Professor H.A. Nagarajaram (UoH, India) and prelim- e0164532.
inary analysis of the CA structure by Dr Manish Kumar (UDSC, India) Christin PA, Osborne CP. 2013. The recurrent assembly of C4 photosyn-
Downloaded from https://academic.oup.com/jxb/article/72/8/3122/6126531 by guest on 20 September 2021
was very helpful. This work was supported by the International Rice thesis, an evolutionary tale. Photosynthesis Research 117, 163–175.
Research Institute, Bill and Melinda Gates Foundation (OPPGD1394), Coe RA, Chatterjee J, Acebron K, et al. 2018. High-throughput chloro-
Department for International Development (DFID) UK, and the phyll fluorescence screening of Setaria viridis for mutants with altered CO2
compensation points. Functional Plant Biology 45, 1017–1025.
ARC Centre of Excellence in Translational Photosynthesis in Australia
Collatz GJ, Ribas-Carbo M, Berry JA. 1992. Coupled photosyn-
(CE140100015). Author VT would like to acknowledge funding from
thesis—stomatal model for leaves of C4 plants. Australian Journal of Plant
DBT-India’s Ramalingaswamy Re-Entry fellowship. Physiology 19, 519–538.
Cousins AB, Badger MR, von Caemmerer S. 2006. Carbonic anhydrase
and its influence on carbon isotope discrimination during C4 photosynthesis.
Conflict of interest Insights from antisense RNA in Flaveria bidentis. Plant Physiology 141,
232–242.
The authors declare no known conflicts of interest. Cousins AB, Badger MR, von Caemmerer S. 2008. C4 photosynthetic
isotope exchange in NAD-ME- and NADP-ME-type grasses. Journal of
Experimental Botany 59, 1695–1703.
Craig H. 1957. Isotopic standards for carbon and oxygen and correction
Author contributions factors for mass spectrometric analysis of carbon dioxide. Geochimica et
Cosmochimica Acta 12, 133–149.
JC, RAC, KA, and VT performed the genetic screening, identification
of the mutant, physiological, morphological. and anatomical character- DePristo MA, Banks E, Poplin R, et al. 2011. A framework for variation
discovery and genotyping using next-generation DNA sequencing data.
ization of the mutant, and identification of the causal gene. FD, HL, EB, Nature Genetics 43, 491–498.
and SB performed the enzyme assay and protein analysis. CPB and XY
DiMario RJ, Clayton H, Mukherjee A, Ludwig M, Moroney JV. 2017.
conducted gene expression analysis. VT, RMY, and PPPOS performed Plant carbonic anhydrases: structures, locations, evolution, and physio-
all the bioinformatics analysis. GR and JD supervised the backcrossing logical roles. Molecular Plant 10, 30–46.
of lcr1 with A.10. RTF, SvC, and WPQ supervised the whole project. All DiMario RJ, Cousins AB. 2019. A single serine to alanine substitution
authors contributed to writing the manuscript. decreases bicarbonate affinity of phosphoenolpyruvate carboxylase in C4
Flaveria trinervia. Journal of Experimental Botany 70, 995–1004.
Drawz SM, Bethel CR, Hujer KM, Hurless KN, Distler AM, Caselli E,
Data availability Prati F, Bonomo RA. 2009. The role of a second-shell residue in modifying
substrate and inhibitor interactions in the SHV beta-lactamase: a study of
The raw reads from whole genome sequencing of pooled samples used ambler position Asn276. Biochemistry 48, 4557–4566.
in this work is available at NCBI’s Short Read Archive (SRA) under Evans JR, Sharkey TD, Berry JA, Farquhar GD. 1986. Carbon isotope
Bioproject ID PRJNA692561 (experiment: SRX10094751). discrimination measured concurrently with gas exchange to investigate CO2
diffusion in leaves of higher plants. Australian Journal of Plant Physiology
13, 281–292.
Evans JR, von Caemmerer S. 2013. Temperature response of carbon
References isotope discrimination and mesophyll conductance in tobacco. Plant, Cell &
Badger MR, Price GD. 1994. The role of carbonic anhydrase in photo- Environment 36, 745–756.
synthesis. Annual Review of Plant Physiology and Plant Molecular Biology Farquhar GD. 1983. On the nature of carbon isotope discrimination in C4
45, 369–392. species. Australian Journal of Plant Physiology 10, 205–226.
Berry JA, Farquhar GD. 1978. The CO2 concentrating function of C4 Farquhar GD, Ehleringer JR, Hubick KT. 1989. Carbon isotope discrim-
photosynthesis. A biochemical model. In: Hall D, Coombs J, Goodwin TW, ination and photosynthesis. Annual Review of Plant Physiology and Plant
eds. Proceedings of the Fourth International Congress on Photosynthesis. Molecular Biology 40, 503–537.
London: Biochemical Society of London, 119–131. Furbank RT, Hatch MD. 1987. Mechanism of C4 photosynthesis: the size
Bolger AM, Lohse M, Usadel B. 2014. Trimmomatic: a flexible trimmer for and composition of the inorganic carbon pool in bundle sheath cells. Plant
Illumina sequence data. Bioinformatics 30, 2114–2120. Physiology 85, 958–964.
Bradford MM. 1976. A rapid and sensitive method for the quantitation of Furbank RT, von Caemmerer S, Sheehy J, Edwards G. 2009. C4 rice: a
microgram quantities of protein utilizing the principle of protein–dye binding. challenge for plant phenomics. Functional Plant Biology 36, 845–856.
Analytical Biochemistry 72, 248–254. Genty B, Briantais J-M, Baker NR. 1989. The relationship between
Brodkin HR, DeLateur NA, Somarowthu S, Mills CL, Novak WR, the quantum yield of photosynthetic electron transport and quenching
Beuning PJ, Ringe D, Ondrechen MJ. 2015. Prediction of distal residue of chlorophyll fluorescence. Biochemica et Biophysica Acta 990,
participation in enzyme catalysis. Protein Science 24, 762–778. 87–92.3136 | Chatterjee et al
Gillon J, Yakir D. 2001. Influence of carbonic anhydrase activity in ter- Miyao M, Masumoto C, Miyazawa S, Fukayama H. 2011. Lessons from
restrial vegetation on the 18O content of atmospheric CO2. Science 291, engineering a single-cell C4 photosynthetic pathway into rice. Journal of
2584–2587. Experimental Botany 62, 3021–3029.
Hatch MD. 1987. C4 photosynthesis: a unique blend of modified bio- Murray MG, Thompson WF. 1980. Rapid isolation of high molecular
chemistry, anatomy and ultrastructure. Biochimica et Biophysica Acta 895, weight plant DNA. Nucleic Acids Research 8, 4321–4325.
81–106. Osborn HL, Alonso-Cantabrana H, Sharwood RE, Covshoff S,
Hatch MD, Burnell JN. 1990. Carbonic anhydrase activity in leaves and Evans JR, Furbank RT, von Caemmerer. 2017. Effects of reduced car-
its role in the first step of C4 photosynthesis. Plant Physiology 93, 825–828. bonic anhydrase activity on CO2 assimilation rates in Setaria viridis: a trans-
Häusler RE, Hirsch HJ, Kreuzaler F, Peterhänsel C. 2002. genic analysis. Journal of Experimental Botany 68, 299–310.
Overexpression of C4-cycle enzymes in transgenic C3 plants: a biotech- Peisker M. 1979. Conditions of low, and oxygen-independent, CO2 com-
nological approach to improve C3 photosynthesis. Journal of Experimental pensation concentrations in C4 plants as derived from a simple model.
Botany 53, 591–607. Photosynthetica 13, 198–207.
He DX, Edwards GE. 1996. Estimation of diffusive resistance of bundle Plaxco KW, Simons KT, Baker D. 1998. Contact order, transition state
sheath cells to CO2 from modelling of C4 photosynthesis. Photosynthetic placement and the refolding rates of single domain proteins. Journal of
Downloaded from https://academic.oup.com/jxb/article/72/8/3122/6126531 by guest on 20 September 2021
Research 49, 195–208. Molecular Biology 10, 985–994.
Hibberd JM, Sheehy JE, Langdale JA. 2008. Using C4 photosynthesis to Rader AJ, Yennamalli RM, Harter AK, Sen TZ. 2012. A rigid network of
increase the yield of rice—rationale and feasibility. Current Opinion in Plant long-range contacts increases thermostability in a mutant endoglucanase.
Biology 11, 228–231. Journal of Biomolecular Structure and Dynamics 30, 628–637.
Jenkins CL, Furbank RT, Hatch MD. 1989a. Inorganic carbon diffusion Rizal G, Karki S, Thakur V, Wanchana S, Alonso-Cantabrana H,
between C4 mesophyll and bundle sheath cells: direct bundle sheath CO2 Dionora J, Sheehy JE, Furbank R, von Caemmerer S, Quick WP.
assimilation in intact leaves in the presence of an inhibitor of the C4 pathway. 2017. A sorghum (Soghum bicolor) mutant with altered carbon isotope
Plant Physiology 91, 1356–1363. ratio. PLoS One 12, e0179567.
Jenkins CL, Furbank RT, Hatch MD. 1989b. Mechanism of C4 photosyn- Rizal G, Thakur V, Dionora J, Karki S, et al. 2015. Two forward gen-
thesis: a model describing the inorganic carbon pool in bundle sheath cells. etic screens for vein density mutant in sorghum converge on a cytochrome
Plant Physiology 91, 1372–1381. P450 gene in the brassinosteroid pathway. The Plant Journal 84, 257–266.
Jiang H, Barbier H, Brutnell T. 2013. Methods for performing crosses in Rowlett RS. 2010. Structure and catalytic mechanism of the β-carbonic
Setaria viridis, a new model system for the grasses. Journal of Visualized anhydrases. Biochimica et Biophysica Acta 1804, 362–373.
Experiments 80, 50527. Schindelin J, Rueden CT, Hiner MC, Eliceiri KW. 2015. The ImageJ
John CR, Smith-Unna RD, Woodfield H, Covshoff S, Hibberd JM. ecosystem: an open platform for biomedical image analysis. Molecular
2014. Evolutionary convergence of cell-specific gene expression in inde- Reproduction and Development 82, 518–529.
pendent lineages of C4 grasses. Plant Physiology 165, 62–75. Schmittgen TD, Livak KJ. 2008. Analyzing real-time PCR data by com-
Kajala K, Covshoff S, Karki S, et al. 2011. Strategies for engineering parative CT method. Nature Protocols 3, 6.
a two-cell C4 photosynthetic pathway into rice. Journal of Experimental Song Y, DiMaio F, Wang RY, Kim D, Miles C, Brunette T, Thompson J,
Botany 62, 3001–3010. Baker D. 2013. High-resolution comparative modeling with RosettaCM.
Kiirats O, Lea PJ, Franceschi VR, Edwards GE. 2002. Bundle sheath Structure 21, 1735–1742.
diffusive resistance to CO2 and effectiveness of C4 photosynthesis and Studer AJ, Gandin A, Kolbe AR, Wang L, Cousins AB, Brutnell TP.
refixation of photorespired CO2 in a C4 cycle mutant and wild-type 2014. A limited role for carbonic anhydrase in C4 photosynthesis as revealed
Amaranthus edulis. Plant Physiology 130, 964–976. by a ca1ca2 double mutant in maize. Plant Physiology 165, 608–617.
Kim DE, Chivian D, Baker D. 2004. Protein structure prediction and ana- Tanz SK, Tetu SG, Vella NG, Ludwig M. 2009. Loss of the transit peptide
lysis using the Robetta server. Nucleic Acids Research 32, W526–W531. and an increase in gene expression of an ancestral chloroplastic carbonic
Kimber MS, Pai EF. 2000. The active site architecture of Pisum sativum anhydrase were instrumental in the evolution of the cytosolic C4 carbonic
beta-carbonic anhydrase is a mirror image of that of alpha-carbonic anhydrase in Flaveria. Plant Physiology 150, 1515–1529.
anhydrases. The EMBO Journal 19, 1407–1418. Vogan PJ, Frohlich MW, Sage RF. 2007. The functional significance of
Lambret-Frotté J, de Almeida LCS, de Moura SM, Souza FLF, C3–C4 intermediate traits in Heliotropium L (Boraginaceae): gas exchange
Linhares FS, Alves-Ferreira M. 2015. Validating internal control genes for perspectives. Plant, Cell & Environment 30, 1337–1345.
the accurate normalization of qPCR expression analysis of the novel model von Caemmerer S. 2000. Biochemical models of leaf photosynthesis, Vol.
plant Setaria viridis. PLoS One 10, e0135006. 2. Melbourne: CSIRO Publishing.
Li H. 2013. Aligning sequence reads, clone sequences and assembly von Caemmerer S, Farquhar GD. 1981. Some relationships between
contigs with BWA-MEM. ArXiv 1303. [Preprint]. the biochemistry of photosynthesis and the gas exchange of leaves. Planta
Lin HS, Karki S, Coe RA, et al. 2016. Targeted knockdown of GDCH in 153, 376–387.
rice leads to mild photorespiratory deficient phenotype useful as a building von Caemmerer S, Furbank RT. 1999. Modelling of C4 photosynthesis.
block for C4 rice. Plant & Cell Physiology 57, 919–932. In: Sage RF, Monson RK, eds.The biology of C4 photosynthesis. San Diego:
Livak KJ, and Schmittgen TD. 2001. Analysis of relative gene expression Academic Press, 169–207.
data using real-time quantitative PCR and the 2–ΔΔCT method. Methods 25, von Caemmerer S, Furbank RT. 2003. The C4 pathway: an efficient CO2
402–408. pump. Photosynthesis Research 77, 191–207.
Ludwig M. 2012. Carbonic anhydrase and the molecular evolution of C4 von Caemmerer S, Quinn V, Hancock NC, Price GD, Furbank RT,
photosynthesis. Plant, Cell & Environment 35, 22–37. Ludwig M. 2004. Carbonic anhydrase and C4 photosynthesis: a transgenic
Matsuoka M, Furbank RT, Fukayama H, Miyao M. 2001. Molecular analysis. Plant, Cell & Environment 27, 697–703.
engineering of C4 photosynthesis. Annual Review of Plant Physiology and Wang Q, Zhang Q, Fan D, Lu C. 2006. Photosynthetic light and CO2
Plant Molecular Biology 52, 297–314. utilization and C4 traits of two novel super-rice hybrids. Journal of Plant
McKenna A, Hanna M, Banks E, et al. 2010. The Genome Analysis Physiology 163, 529–537.
Toolkit: a MapReduce framework for analyzing next-generation DNA Williams TG, Flanagan LB, Coleman JR. 1996. Photosynthetic gas ex-
sequencing data. Genome Research 20, 1297–1303. change and discrimination against 13CO2 and C18O16O in tobacco plants
Miyao M. 2003. Molecular evolution and genetic engineering of C4 photo- modified by an antisense construct to have low chloroplastic carbonic
synthetic enzymes. Journal of Experimental Botany 54, 179–189. anhydrase. Plant Physiology 112, 319–326.You can also read