Tropical atmospheric circulation response to the G1 sunshade geoengineering radiative forcing experiment
←
→
Page content transcription
If your browser does not render page correctly, please read the page content below
Atmos. Chem. Phys., 18, 8689–8706, 2018
https://doi.org/10.5194/acp-18-8689-2018
© Author(s) 2018. This work is distributed under
the Creative Commons Attribution 4.0 License.

Tropical atmospheric circulation response to the G1 sunshade
geoengineering radiative forcing experiment
Anboyu Guo1 , John C. Moore1,2,3 , and Duoying Ji1
1 College of Global Change and Earth System Science, Beijing Normal University, 19 Xinjiekou Wai St.,
Beijing 100875, China
2 Arctic Centre, University of Lapland, P.O. Box 122, 96101 Rovaniemi, Finland
3 CAS Center for Excellence in Tibetan Plateau Earth Sciences, Beijing 100101, China

Correspondence: John C. Moore (john.moore.bnu@gmail.com)

Received: 6 February 2018 – Discussion started: 15 February 2018
Revised: 16 May 2018 – Accepted: 26 May 2018 – Published: 20 June 2018

Abstract. We investigate the multi-Earth system model re-         1   Introduction
sponse of the Walker circulation and Hadley circulations un-
der the idealized solar radiation management scenario (G1)        Large-scale tropical atmospheric circulation may be parti-
and under abrupt4xCO2. The Walker circulation multi-model         tioned into two independent orthogonal overturning con-
ensemble mean shows changes in some regions but no sig-           vection cells, namely the Hadley circulation (HC) and the
nificant change in intensity under G1, while it shows a 4◦        Walker circulation (WC; Schwendike et al., 2014). The HC is
eastward movement and 1.9 × 10⁹ kg s−1 intensity decrease         the zonally symmetric meridional circulation with an ascend-
in abrupt4xCO2. Variation in the Walker circulation intensity     ing branch in the Intertropical Convergence Zone (ITCZ) and
has the same high correlation with sea surface temperature        a descending branch in the subtropical zone and which plays
gradient between the eastern and western Pacific under both       a critical role in producing tropical and subtropical climatic
G1 and abrupt4xCO2. The Hadley circulation shows signif-          zones, especially deserts (Oort and Yienger, 1996). The WC
icant differences in behavior between G1 and abrupt4xCO2,         is the asymmetric zonal circulation, which extends across the
with intensity reductions in the seasonal maximum north-          entire tropical Pacific, characterized by an ascending center
ern and southern cells under G1 correlated with equator-          over the Maritime Continent and western Pacific, eastward
ward motion of the Intertropical Convergence Zone (ITCZ).         moving air flow in the upper troposphere, a strong descend-
Southern and northern cells have a significantly different re-    ing center over the eastern Pacific and surface trade winds
sponse, especially under abrupt4xCO2 when impacts on the          blowing counter to the upper winds along the equatorial Pa-
southern Ferrel cell are particularly clear. The southern cell    cific completing the circulation (Bjerknes, 1969).
is about 3 % stronger under abrupt4xCO2 in July, August              Observational evidence shows a poleward expansion of the
and September than under piControl, while the northern is         HC in the past few decades (Hu et al., 2011) and an inten-
reduced by 2 % in January, February and March. Both cir-          sification of the HC in the boreal winter (Song and Zhang,
culations are reduced under G1. There are significant rela-       2007). Climate model simulations with increased greenhouse
tionships between northern cell intensity and land tempera-       gas forcing also indicate a poleward expansion of the Hadley
tures, but not for the southern cell. Changes in the meridional   circulation (Hu et al., 2013; Ma and Xie, 2013; Kang and Lu,
temperature gradients account for changes in Hadley inten-        2012; Davis et al., 2016). Vallis et al. (2015) analyzed the re-
sity better than changes in static stability in G1 and espe-      sponse of 40 CMIP5 climate models, finding that there was
cially in abrupt4xCO2. The difference in the response of the      only modest model agreement on changes. Robust results
zonal Walker circulation and the meridional Hadley circula-       were a slight expansion and weakening of the winter cell HC
tions under the idealized forcings may be driven by the zonal     in the Northern Hemisphere (NH). It is unclear how closely
symmetric relative cooling of the tropics under G1.               the model simulations match reality. Choi et al. (2014) and
                                                                  Quan et al. (2014) both suggest that reanalysis trends for the

Published by Copernicus Publications on behalf of the European Geosciences Union.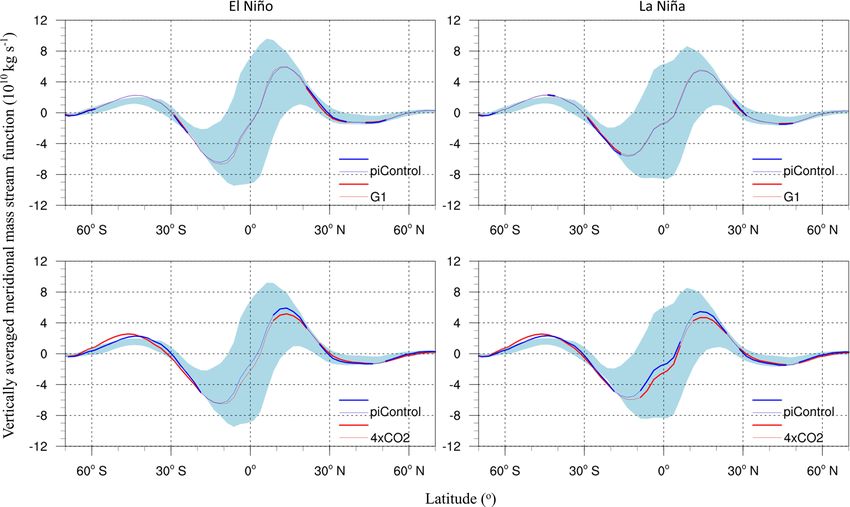
8690                                    A. Guo et al.: Sunshade geoengineering impact on tropical atmospheric circulation

Hadley cell edges may be overstated, especially compared           more than over oceans relative to abrupt4xCO2 and hence re-
to independent observations, and model trends are in reason-       duces the temperature difference between land and oceans by
able agreement with the reanalysis trends (Davis and Birner,       about 1 ◦ C. Extreme precipitation is affected by SRM such
2017; Garfinkel et al., 2015), but choice of metric also mat-      that heavy precipitation events become rarer, while small
ters (Solomon et al., 2016) when discussing trends.                and moderate events become more frequent (Tilmes et al.,
   Many authors have considered the impact of greenhouse           2013). This is generally opposite to the impact of GHG forc-
gas forcing on the Hadley circulation, particularly with re-       ing alone, which tends to produce a “wet gets wetter and dry
spect to changes in the width of the tropical belt (e.g., Frier-   gets drier” pattern to global precipitation anomalies (Tilmes
son et al., 2007; Grise and Polvani, 2016; Johanson and Fu,        et al., 2013; Held and Soden, 2006). Finally, tropical extreme
2009; Lu et al., 2007; Seidel et al., 2008), but far fewer have    cyclones have been shown to be affected by SRM in ways
discussed changes in Hadley intensity (Seo et al., 2014; He        that do not simply reflect changes in tropical sea surface tem-
and Soden, 2015). The importance of tropical belt widening         peratures due to large-scale planetary circulations and tele-
is of course due to its impact on the hydrological system,         connection patterns (Moore et al., 2015).
especially the locations of the deserts (Lau and Kim, 2015;           To date, few studies of the impact of SRM on tropi-
Seager et al., 2010), which are critically important for the       cal atmospheric circulation have been published. Ferraro et
habitability of several well-populated areas.                      al. (2014), using an intermediate complexity climate model,
   Observational evidence shows a strengthening and west-          found tropical overturning circulation weakens in response to
ward movement of the WC from 1979 to 2012 (Bayr et al.,            SRM with stratospheric sulfate aerosol injection. But SRM
2014; Ma and Zhou, 2016). However, the time required to ro-        simulated as a simple reduction in total solar irradiance does
bustly detect and attribute changes in the tropical Pacific WC     not capture this effect. Davis et al. (2016) analyzed nine Ge-
could be 60 years or more (Tokinaga et al., 2012). Model           oMIP models and report that the HC expands in response to
results suggest a significant eastward movement with weak-         a quadrupling of atmospheric carbon dioxide concentrations
ening intensity under greenhouse gas forcing (Bayr et al.,         more or less proportionality to the climate sensitivity of the
2014), and He and Soden (2015) propose that sea surface            climate model and shrinks in response to a reduction in solar
temperature warming plays a crucial role in both the east-         constant. Smyth et al. (2017) report that decreases in Hadley
ward shift and the weakening of the WC. They also note that        cell intensity drive the reduction in tropical precipitation un-
this weakening may be reversed by rapid land warming.              der SRM, and that seasonal changes mean that the ITCZ has
   Geoengineering as a method of mitigating the deleterious        smaller-amplitude northward shifts compared with no SRM.
effects of anthropogenic climate change has been suggested            The El Niño–Southern Oscillation (ENSO) is the largest
as a complement to mitigation and adaptation efforts. For ex-      mode of multi-annual variability exhibited by the climate
ample, Shepherd (2009) summarized the methodologies and            system in terms of its temperature variability and also for
governance implications as early as a decade ago. Solar ra-        its socioeconomic impacts. This tropical circulation pattern
diation management (SRM) geoengineering can lessen the             is intimately related to changes in the WC by their depen-
effect of global warming due to the increasing concentra-          dences on the Pacific Ocean zonal sea surface temperature
tions of greenhouse gases by reducing incoming solar radia-        gradient and indirectly to the HC by its impacts on global en-
tion. This compensation of longwave radiative forcing with         ergy balance. Few studies of climate model ENSO response
shortwave reductions necessarily leads to nonuniform effects       to SRM have been made, with Gabriel and Robock (2015)
around the globe, as summarized in results for many cli-           finding that stratospheric aerosol injection by the GeoMIP
mate models in the Geoengineering Model Intercomparison            G4 experiment produces no significant impacts on El Niño–
Project (GeoMIP) by Kravitz et al. (2013). This is due to          Southern Oscillation. The SRM and GHG forcing in the G4
the seasonal and diurnal patterns of shortwave forcing be-         experiment are both relatively low compared with the G1 ex-
ing far different from the almost constant longwave radia-         periment, since under G4 the GHG scenario is the modest
tive absorption. In addition, SRM tends to produce net dry-        RCP4.5, which means that natural climate variability in the
ing due to the decreasing vertical temperature gradient as         50-year-long period of SRM may obscure features. However,
greenhouse gasses (GHGs) increase absorption in the tro-           this topic is worthy of more investigation since one concern
posphere, while shortwave radiative forcing affects surface        is that SRM will place the climate system into a new regime
temperatures (Bala et al., 2011). These differences in short-      of variability (Robock, 2008; Shepherd, 2009). If this were
wave and longwave forcing impacts atmospheric circulation          the case then we expect that the dominant climate modes
and hence precipitation patterns, summarized for the Ge-           of variability would also differ from both preindustrial con-
oMIP models by Tilmes et al. (2013). The general pattern           ditions and those under GHG forcing alone. Although this
of temperature change under abrupt4xCO2 includes accen-            can be studied via volcanic analogues, they are imperfect
tuated Arctic warming and the least warming in the tropics.        due to their transient nature compared with the long-term de-
G1 largely reverses these changes, but leaves some residual        ployment of SRM (Robock et al., 2008). Tropical volcanic
warming in the polar regions and under-cools the tropics rel-      eruptions do indeed change the global circulation (Robock,
ative to piControl. SRM also reduces temperatures over land        2000), and so climate mode change is a potential risk of

Atmos. Chem. Phys., 18, 8689–8706, 2018                                             www.atmos-chem-phys.net/18/8689/2018/
A. Guo et al.: Sunshade geoengineering impact on tropical atmospheric circulation                                           8691

SRM. Hence examining the tropical circulations and their re-      used monthly mean model output data. Reanalysis data span
sponse under ENSO modulation can provide evidence on the          the years 1979–2016.
likelihood of SRM inducing a regime change on the global             Composite analysis is applied for the study on the influ-
climate system.                                                   ence of ENSO. We follow Bayr et al. (2014) and use de-
   In this paper we utilize simulation results from eight Earth   trended and normalized Niño 3.4 index (monthly averaged
system models (ESMs) that participated in the GeoMIP G1           sea surface temperature anomaly in the region bounded by
experiment (Kravitz et al., 2011) and compare these re-           5◦ N–5◦ S, from 170–120◦ W) as a criteria to select ENSO
sults with the corresponding Climate Model Intercompari-          events. An index > 1 represents an El Niño event and < −1
son Project Phases 5 (CMIP5) experiment for the abrupt qua-       a La Niña one (Bayr et al., 2014). We concatenate variables
drupling of CO2 (abrupt4xCO2) and preindustrial conditions        in all El Niño and La Niña events for each individual model
(piControl). The G1 scenario is the largest SRM signal ad-        to get El Niño and La Niña data sets and then calculate en-
dressed to date by experiments given that it is designed to       semble results.
balance radiative forcing from quadrupled CO2 ; hence the
signal to noise ratio is high, and furthermore it has been        2.1   Mass stream function
completed a by a large number of ESMs and so we can ex-
amine across model differences in simulations. We address         The HC and WC represent the meridional and zonal compo-
the following key questions: does the G1 scenario counteract      nents of the complete three-dimensional tropical atmospheric
position and intensity variations in the Walker and Hadley        circulation. We follow many previous authors (e.g., Davis et
circulations caused by the GHG longwave forcing under             al., 2016; Bayr et al., 2014; Nguyen et al., 2013; Ma and
abrupt4xCO2? How does the tropical atmospheric circula-           Zhou, 2016; Yu et al., 2012) in using mass stream function to
tion, including the Walker and Hadley circulations, respond       conveniently separate and picture these two convective flows.
to warm and cold phases of the El Niño–Southern Oscillation          The zonal mass stream function (ψz ) and meridional mass
in G1 and abrupt4xCO2?                                            stream function (ψm ) are defined as follows:
                                                                              Zps
                                                                       2π a
                                                                  ψz =              uD dp,                                    (1)
                                                                        g
2   Data and methods                                                           0
                                                                                        Zps
We use eight ESMs (Table 1), a subset of the group de-                 2π a cos(φ)
                                                                  ψm =                        v dp,                           (2)
scribed in Kravitz et al. (2013), that have completed G1.                   g
We are limited to these models due to the unavailability of                              0
some fields in the output from other models. The simulations      where uD and v respectively represent the divergent com-
in each model are initiated from a preindustrial condition        ponent of the zonal wind and the zonal mean meridional
that has reached steady state, denoted as piControl, which        wind, a is the radius of Earth, g is the acceleration of gravity
is the standard CMIP5 name for this experiment (Taylor et         (9.8 m s−2 ), p is the pressure, ps is the surface pressure and
al., 2012). Our reference simulation, denoted abrupt4xCO2,        the φ in Eq. (2) is latitude. The meridionally averaged uD
is also a standard CMIP5 experiment in which CO2 concen-          values between 5◦ S and 5◦ N are integrated from the top of
trations are instantaneously quadrupled from the control run.     the atmosphere to the surface in calculating the zonal mass
This experiment implies an atmospheric CO2 concentration          stream function (ψz ).
of nearly 1140 ppm, close to concentrations under “business          Some previous studies have removed the fast response
as usual” scenarios such as RCP8.5 by the year 2100. Exper-       transient and only use years 11–50 of G1 and abrupt4xCO2
iment G1 in GeoMIP involves an instantaneous reduction of         to avoid climate transient effects (e.g., Smyth et al., 2017;
insolation simultaneous with this CO2 increase such that top-     Kravitz et al., 2013), while Davis et al. (2016) discarded the
of-atmosphere (TOA) radiation differences between G1 and          first 5 years, noting that the choice is conservative. We ex-
piControl are no more than 0.1 W m−2 for the first 10 years       amine whether the zonal and meridional mass stream func-
of the 50-year experiment (Kravitz et al., 2011). The amount      tions have transient effects at the start of the simulation
of solar radiation reduction is model dependent but does not      (Fig. S1 in the Supplement). We show the time series of
vary during the course of the simulation.                         the WC as defined by the vertically averaged value of the
   We used the following variables from eight climate models      stream function ψz (STRF; see Sect. 2.2) and show that there
and reanalysis data (Table 1): sea level pressure (SLP), sea      is variability at many timescales up to decadal but without
surface temperature (SST), zonal wind (U ), meridional wind       significant transient effects. This is confirmed by statistical
(V ), sea level pressure and sea surface temperature interpo-     analysis of each model; for example, there are four mod-
lated onto a regular 1◦ × 1◦ grid. The zonal and meridional       els (CCSM4, HadGEM2-ES, IPSL-CM5A-LR and MIROC-
winds are regridded onto a common horizontal fixed grid of        ESM) that have significantly (p < 0.05) higher STRF in the
2.5◦ × 2.5◦ as in many preceding studies (Bayr et al., 2014;      first 10 years of the abrupt4xCO2 simulation than in the fol-
Ma and Zhou, 2016; Stachnik and Schumacher, 2011). We             lowing decades. This is not due to a transient affecting the

www.atmos-chem-phys.net/18/8689/2018/                                                 Atmos. Chem. Phys., 18, 8689–8706, 2018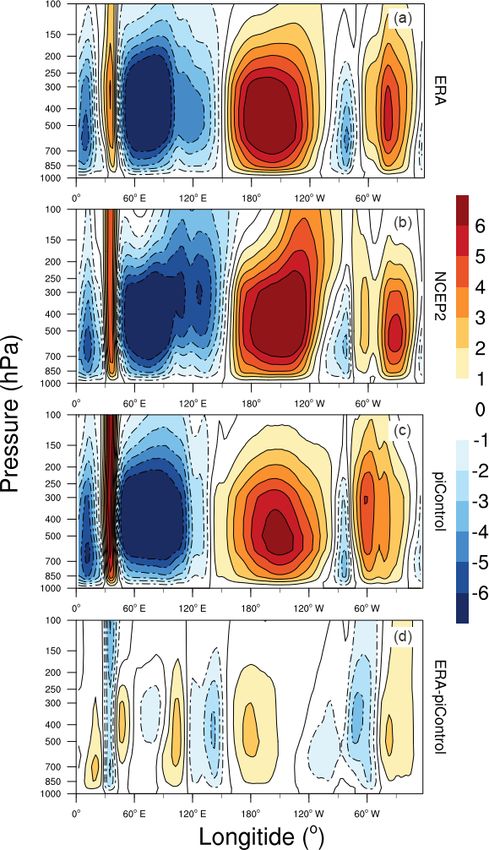
8692                                        A. Guo et al.: Sunshade geoengineering impact on tropical atmospheric circulation

Table 1. The GeoMIP and CMIP5 models and the reanalysis data used in the paper.

                     No.      Model∗                        Reference                                            Lat × Lon
                     1        BNU-ESM                       Ji et al. (2014)                                     2.8◦ × 2.8◦
                     2        CanESM2                       Arora et al. (2011)                                  2.8◦ × 2.8◦
                     3        CCSM4                         Gent et al. (2011)                                   0.9◦ × 1.25◦
                     4        GISS-E2-R                     Schmidt et al. (2014)                                2◦ × 2.5◦
                     5        HadGEM2-ES                    Collins et al. (2011)                                1.25◦ × 1.875◦
                     6        IPSL-CM5A-LR                  Dufresne et al. (2013)                               2.5◦ × 3.75◦
                     7        MIROC-ESM                     Watanabe et al. (2011)                               2.8◦ × 2.8◦
                     8        NorESM1-M                     Bentsen et al. (2013), Iversen et al. (2013)         1.9◦ × 2.5◦
                     9        NCEP-DOE (NCEP2)              Kanamitsu et al. (2002)                              2.5◦ × 2.5◦
                     10       ERA-Interim                   Simmons et al. (2007)                                0.75◦ × 0.75◦
                    ∗ Full Names: BNU-ESM, Beijing Normal University Earth System Model; CanESM2, the Second Generation Canadian
                    Earth System Model; CCSM4, the Community Climate System Model version 4; GISS-E2-R, Goddard Institute for Space
                    Studies ModelE version 2; IPSL-CM5A-LR, Institut Pierre Simon Laplace ESM; MIROC-ESM, Model for Interdisciplinary
                    Research on Climate–Earth System Model; NorESM1-M, Norwegian ESM.

first few years, but rather to higher values around 3 years                    2.3     Hadley circulation index
into the simulation; this is not unusual for each model’s
multi-annual and decadal variability. On the other hand, the                   Many authors have separated the northern and southern HC
measures of circulation that rely on sea surface tempera-                      cells simply by dividing by hemisphere (e.g., Davis et al.,
ture (Fig. S2) show some difference in the first decade com-                   2016), but during the active periods of each cell, the circula-
pared with later periods under abrupt4xCO2. The Hadley                         tion extends across the Equator into the opposite hemisphere.
cell vertically averaged stream function shows similar re-                     The boundary at the edge of the tropics is also known to
sults and strong seasonal variability (not shown). Therefore                   move latitudinally but the circulation cell rapidly becomes
to utilize as much data as possible and increase the robust-                   weaker beyond the zero crossing of the rotation sense. To
ness of our statistical analysis, we use all 50 years of G1                    capture the variability of the HC cells we select the season
and abrupt4xCO2 simulations. We use 100 years of piCon-                        of maximum intensity for each cell and measure the strength
trol simulations as baseline climate for the same reason.                      across its full latitudinal extent. Thus we define the HC in-
                                                                               tensity for the southern cell as the average meridional stream
2.2    Walker circulation index                                                function between 900 and 100 hPa over the area between
                                                                               40◦ S and 15◦ N in July, August and September (JAS) and
Four related indices have been used to characterize the WC                     the northern cell as the absolute value of mean meridional
intensity and its position. Tropical Pacific east–west gradi-                  stream function between 15◦ S and 40◦ N in January, Febru-
ents, defined by conditions in the Darwin region (5◦ S–5◦ N,                   ary and March (JFM). We experimented with using narrower
80–160◦ E) and the Tahiti region (5◦ S–5◦ N, 160–80◦ W), of                    definitions of the Hadley cell (38–15 or 35–15◦ ) in the three
sea level pressure (1SLP) and temperature (1SST; Bayr et                       experiments, finding almost the same systematic offsets in
al., 2014; DiNezio et al., 2013; Ma and Zhou, 2016; Vecchi                     intensities across the models and experiments. This is also
and Soden, 2007; Vecchi et al., 2006) are highly correlated                    true for each hemisphere separately. Departures in model en-
for all three experiments discussed here with R 2 around 0.9.                  semble mean intensity across the three experiments for both
Ma and Zhou (2016) used the vertically averaged value of the                   hemispheres from an outer latitude of 40◦ range from 6.6–7
stream function ψz (STRF) over the western and central Pa-                     and 13.8–14 % with outer latitudes of 38 and 35◦ , respec-
cific (150◦ E–150◦ W), and this is also very highly correlated                 tively. So using the wide latitude bands we chose captures all
with 1SST and 1SLP. As we are interested in the structure                      the variability in the Hadley cells in all the models and ex-
of the circulation, we use either the complete, longitudinally                 periments without introducing biases due to experiments or
averaged stream function or the STRF in the rest of the paper.                 hemispheres. We use the 900–100 hPa levels (whereas typi-
   To determine the WC movement in different experiments,                      cally 200 hPa has been the ceiling; e.g., Nguyen et al., 2013)
we use the western edge of WC to represent its position. The                   to accommodate the raised tropopause under GHG forcing,
western edge is defined by the zero value of the vertically                    while avoiding boundary effects.
averaged ψz between 400 and 600 hPa in the western Pacific
120–180◦ E (Ma and Zhou, 2016).

Atmos. Chem. Phys., 18, 8689–8706, 2018                                                              www.atmos-chem-phys.net/18/8689/2018/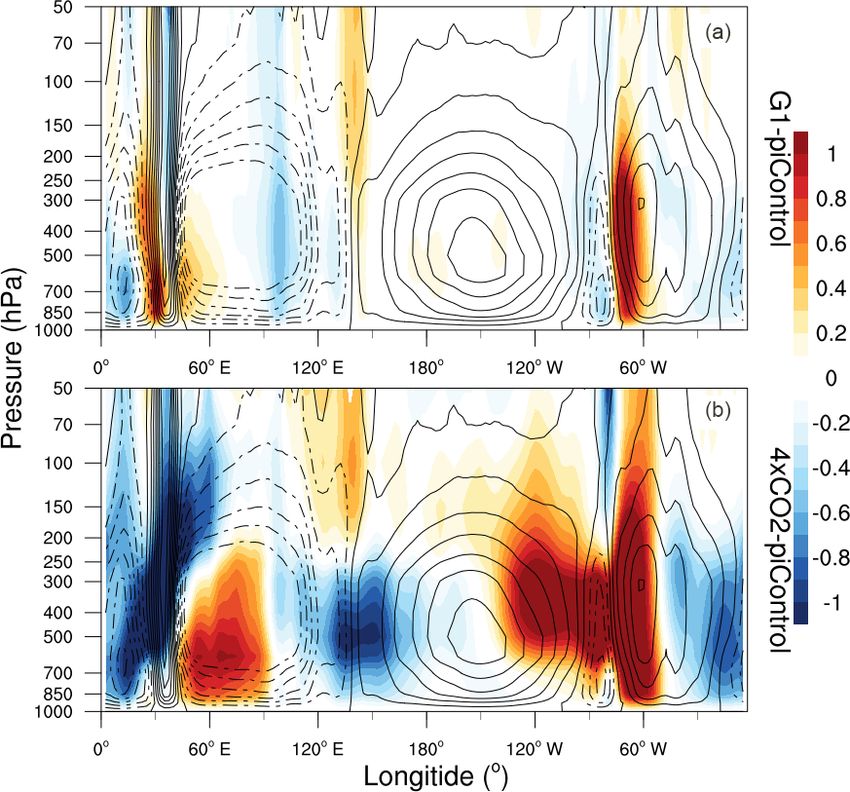
A. Guo et al.: Sunshade geoengineering impact on tropical atmospheric circulation                                                8693

3     Walker circulation response

3.1    Intensity

The annual mean state of zonal mass stream function (ψz )
calculated from eight ensemble member mean piControl,
ERA-Interim reanalysis and the NCEP2 reanalysis results are
shown in Fig. 1. Zonal mass stream function (ψz ) can intu-
itively depict the WC, which exhibits its strongest convection
(positive values) in the equatorial zone across the Pacific. The
WC center is around 500 hPa and 160◦ W. Figure 1d shows
that the ERA-Interim circulation has an eastward displace-
ment and the intensity measured by STRF is overestimated
by 26 % relative to ensemble piControl. There is a similar
structure to the stream function differences between NCEP2
reanalysis and piControl, and the STRF is only overestimated
by 3 % relative to ensemble piControl.
   The relative changes from piControl under G1 and
abrupt4xCO2 experiments are shown in Fig. 2. The features
of WC are very similar in both the G1 and piControl ex-
periments shown in Fig. 2a. In abrupt4xCO2 differences are
larger and include a rise in the vertical extent of the circu-
lation and an eastward shift in Fig. 2b. This is quantifiably
confirmed by the STRF index increase of just 0.3 % in G1
but a significant decrease of 7 % in abrupt4xCO2 relative to
piControl (Table 2). However, only five out of eight models
agree on the sign of the changes in abrupt4xCO2 and there is
much diversity between individual models (Fig. S3).

3.2    Position

The vertically averaged zonal mass stream functions (ψz ) for
the ensemble means of the three experiments as a function
of longitude are shown in Fig. 3. To quantitatively measure
the position change in the WC we use the western edge in-
dex. The ERA-Interim and NCEP2 reanalysis data respec-             Figure 1. Walker circulation in the ERA-Interim reanalysis (a),
tively show 10.5 and 18◦ more easterly positions than the          NCEP2 reanalysis (b), model ensemble mean under piControl (c)
piControl state. The WC shifts 0.5◦ westward in G1 and 4◦          and difference between ERA-Interim and piControl (d). Color
eastward in abrupt4xCO2 relative to piControl for the multi-       bar indicates the value of averaged zonal mass stream function
model ensemble mean. There is a significant change in the          (1010 kg s−1 ). Warm colors (positive values) indicate a clockwise
ensemble mean position and strength under abrupt4xCO2,             rotation and cold colors (negative values) indicate an anticlockwise
but not G1 in Table 2. However, only five out of eight mod-        rotation.
els agree on the sign of the changes, so the inter-model dif-
ferences are rather large in this case. In the G1 experiment,
the WC strengthens over the western Pacific around 130 to          missing the African features in their piControl simulation).
150◦ E and weakens over the eastern Pacific around 115 to          BNU-ESM shows the opposite anomaly, while GISS-E2-R
80◦ W, indicating a westward movement relative to piCon-           shows a complex pattern. There is only a small change in the
trol (Table 2). Thus the pattern is the opposite of that seen      STRF zero crossing location in the region (Fig. 3b) because
under abrupt4xCO2 in Fig. 3b.                                      the anomalies are not vertical. This position is at the transi-
   Under G1 there is a westward shift in the ascending branch      tion from tropical West African rain forest to wood and grass-
of the circulation from about 30 to about 20◦ E as indicated       land in East Africa under present climates. The movement
by comparing the red shaded region around 30◦ E in Fig. 2a         westward would impact the rain forests of the Congo basin.
with the piControl result in Fig. 1c. Figure S3 shows that the     There is no similar positional change under abrupt4xCO2 in
anomaly is present in CanESM2, CCSM4 and NorESM1-M,                the region, though there are many more changes in the circu-
while three models show almost no change (and indeed are           lation as a whole.

www.atmos-chem-phys.net/18/8689/2018/                                                Atmos. Chem. Phys., 18, 8689–8706, 2018
8694 A. Guo et al.: Sunshade geoengineering impact on tropical atmospheric circulation
Table 2. The change in Walker circulation position (◦ ) and intensity (1010 kg s−1 ) in eight models and their ensemble mean. The number
in the brackets represents the percentage of change relative to piControl. The negative position (STRF) represents westward movement
(weakening) and a positive value represents eastward movement (strengthening). Statistically significant differences at 5 % are in shown in
bold.
Earth system model G1 abrupt4xCO2
Position STRF Position STRF
BNU-ESM 0.32 (0.2) −0.04 (−2.3) 8.6 (5.8) −0.34 (−18)
CanESM2 3.8 (2.7) −0.32 (−11) 16.4 (11.5) −0.56 (−19.3)
CCSM4 −1 (−0.7) 0.5 (20.6) −0.3 (−0.2) 0.58 (24.6)
GISS-E2-R 10.6 (6.5) −0.83 (−73.5) 21.2 (13) −1.6 (−143)
HadGEM2-ES −1 (−0.7) 0.34 (10.8) 4.9 (3.3) −0.14 (−4.4)
IPSL-CM5A-LR 1.4 (1) −1.8 (−7.8) 0.15 (0.1) 0.43 (18.3)
MIROC-ESM 0.5 (0.4) 0.03 (0.7) −5.2 (−4.2) −0.72 (−19.1)
NorESM1-M −3.7 (−2.3) 0.56 (20.2) −6.6 (−4.2) 0.93 (33.6)
Ensemble −0.5 (−0.3) 0.007 (0.3) 4 (2.8) −0.19 (−7.1)
Figure 2. Shading indicates model ensemble mean zonal Figure 3. The vertically averaged zonal mass stream function
stream function anomalies (1010 kg s−1 ) G1-piControl (a) and (1010 kg s−1 ) (a) in piControl, G1, abrupt4xCO2 experiment for en-
abrupt4xCO2-piControl (b). Warm colors (positive values) indi- semble mean, ERA-Interim and NCEP2; their difference relative to
cate a clockwise rotation and cold colors (negative values) indicate piControl (b).
an anticlockwise rotation. Contours indicate the value of averaged
meridional mass stream function (1010 kg s−1 ) in piControl as plot-
ted in Fig. 1c.
about 25◦ of latitude. The intensity anomalies relative to pi-
Control from both the reanalysis data sets are less than 21 %
4 Hadley circulation intensity response (Fig. 4).
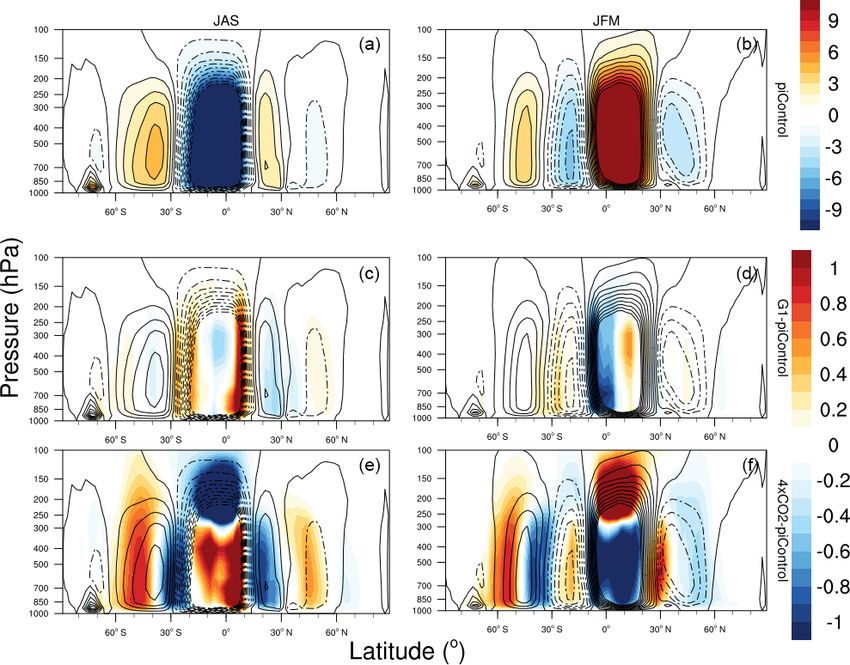
Circulation anomalies under abrupt4xCO2 (Fig. 5b) show
The climatology of the meridional mass stream function enhanced overturning aloft and weakened overturning at
(ψm ) calculated from the multi-model ensemble mean is lower levels in both northern and southern Hadley cells. The
shown in Figs. 4 and 5 and the individual models are shown elevation of the circulation upper branches rises with in-
in Fig. S4. This can naturally describe the HC with a clock- creased GHG concentration, as previously noted (Vallis et al.,
wise rotation in the NH and an anticlockwise rotation in the 2015), and is likely a consequence of the rise in tropopause
Southern Hemisphere (SH). The southern Hadley cell width height due to GHGs. The southern cell shows a complex
spans nearly 35◦ of latitude and the northern Hadley cell anomaly structure with a positive anomaly between 45 and
Atmos. Chem. Phys., 18, 8689–8706, 2018 www.atmos-chem-phys.net/18/8689/2018/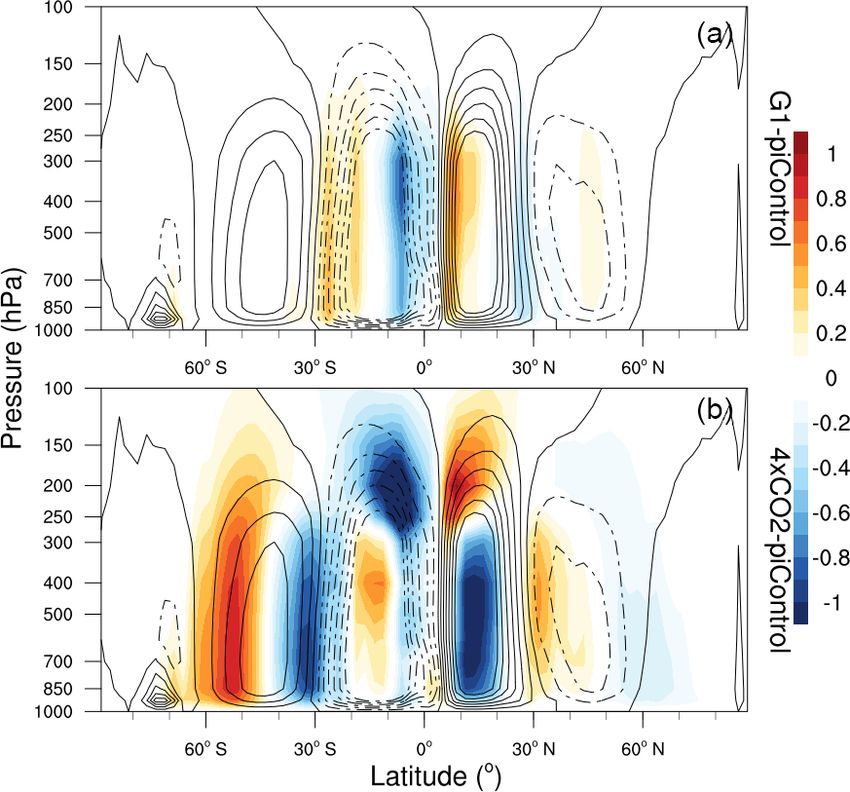
A. Guo et al.: Sunshade geoengineering impact on tropical atmospheric circulation                                                    8695

                                                                       Figure 5. Shading indicates model ensemble mean zonal
                                                                       stream function anomalies (1010 kg s−1 ) G1-piControl (a) and
                                                                       abrupt4xCO2-piControl (b). Warm colors (positive values) indi-
                                                                       cate a clockwise rotation and cold colors (negative values) indicate
                                                                       an anticlockwise rotation. Contours indicate the value of averaged
                                                                       meridional mass stream function (1010 kg s−1 ) in piControl as plot-
                                                                       ted in Fig. 4c.

                                                                          In JAS, when the ITCZ is located furthest north around
                                                                       15◦ N, the G1 anomaly indicates a reduction in the upward
                                                                       branch of the southern cell or, equivalently, a southern mi-
                                                                       gration of the ITCZ. Similarly in JFM there is a correspond-
                                                                       ing reduction in the strength of the upwelling branch of the
                                                                       northern cell (Fig. 6c and d). This is a similar result as ob-
Figure 4. Hadley circulation in the ERA-Interim reanalysis (a),
                                                                       tained by Smyth et al. (2017), who considered the ITCZ po-
NCEP2 reanalysis (b), model ensemble mean under piControl (c)          sition to be defined as the centroid of precipitation and found
and the difference between ERA-Interim and piControl (d). Color        changes in position of fractions of a degree. Figure 7b shows
bar indicates the value of averaged meridional mass stream function    that the modeled motion of the ITCZ explains 73 % of the
(1010 kg s−1 ). Warm colors (positive values) indicate a clockwise     variance in intensity of the JAS southern cell peak inten-
rotation and cold colors (negative values) indicate an anticlockwise   sity, which is significant at the 95 % level. Thus the larger
rotation.                                                              the model reduction in intensity, the more the boundary of
                                                                       the ITCZ moves equatorward. The correlation for the JFM
                                                                       northern cell (Fig. 7a) is not strong enough to be signifi-
65◦ S also in the Ferrel cell circulation that borders it at           cant, though it still indicates correlation between intensity
higher southern latitudes. The northern cell anomaly is sim-           and ITCZ position changes. The combined seasonal effect
pler in comparison. Under G1 the changes (Fig. 5a) are                 of both cell changes is a reduced migration of the upwelling
largest near the equatorial margins of the cells, with a clear         branches of the circulation cells across the Equator, as was
increase in the strength of the ascending current. There is            also noted by Smyth et al. (2017).
no significant change in the upper branch of the circulation,             The GISS-E2-R model has strikingly different anomalies
showing that the tropopause has returned to close to piCon-            under both G1 and abrupt4xCO2 compared with other mod-
trol conditions despite the greenhouse concentrations being            els, with much more variability and more changes in the sign
raised. Seasonal differences illustrate the changes induced            of rotation not only within the Hadley cell but also in the sur-
under the experiments in a clearer way than the annual en-             rounding Ferrel cells. If we exclude this model from the en-
semble result (Fig. 6).                                                semble, we get an even clearer result showing that the move-

www.atmos-chem-phys.net/18/8689/2018/                                                    Atmos. Chem. Phys., 18, 8689–8706, 2018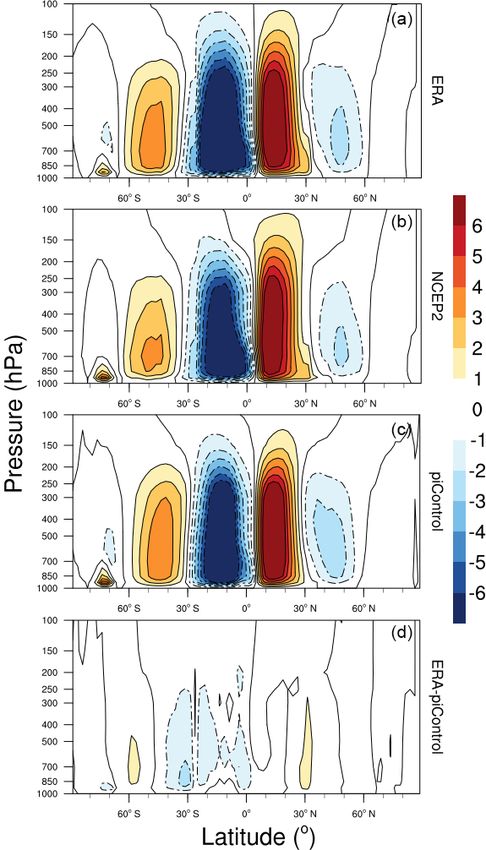
8696                                      A. Guo et al.: Sunshade geoengineering impact on tropical atmospheric circulation

Figure 6. Model ensemble mean meridional stream function in piControl (a, b), anomalies relative to piControl for G1 (c, d) and anomalies
relative to piControl for abrupt4xCO2 experiments (e, f). Panels (a, c, e) indicate JAS months and panels (b, d, f) indicate JFM months.
Color bar indicates the value of averaged meridional mass stream function (1010 kg s−1 ). Warm colors (positive values) indicate a clockwise
rotation and cold colors (negative values) indicate an anticlockwise rotation. Contours indicate the value of averaged meridional mass stream
function (1010 kg s−1 ) in piControl.

ment of the equatorial edge of the Hadley cells (the ITCZ)               5   ENSO variability in the Walker and Hadley
totally dominates the response under G1 (Fig. S5).                           circulations
   The situation under abrupt4xCO2 is more complex
(Fig. 6e and f). The expansion of the tropics has been noted             Many previous study have concluded that the WC weakens
both in GHG simulations and observationally (Davis et al.,               and shifts eastward during El Niño, with opposite effects
2016; Hu et al., 2011), along with the larger southern expan-            under La Niña (Ma and Zhou, 2016; Power and Kociuba,
sion. The extratropical changes in the Ferrel circulation are            2011; Yu et al., 2012; Power and Smith, 2007). HC shrinks
also more pronounced in the SH.                                          and strengthens during El Niño events, while expanding and
   A reduction in the strength of the NH winter cell was                 weakening during La Niña (Nguyen et al., 2013; Stachnik
also a robust result of climate models under RCP8.5, while               and Schumacher, 2011). The G1 solar dimming SRM im-
the southern cell exhibited almost no change (Vallis et al.,             pacts on the Walker and Hadley circulations during ENSO
2015). Our results in Fig. 8 show a multi-model ensemble                 events will be discussed in this section.
mean reduction of Hadley intensity under G1 of −18 × 108                    The WC differences between G1, abrupt4xCO2 and pi-
and of −7 × 10⁸ kg s−1 for abrupt4xCO2. The JAS southern                 Control vary among models during ENSO events (Fig. S6).
Hadley intensity exhibits a fall of −16 × 108 kg s−1 under               But the multi-model ensemble mean presents a clear picture
G1 but an increase of 23 × 108 kg s−1 under abrupt4xCO2.                 (Fig. 9). The results show that features of the WC response
At least six out of eight models agree on these sign changes             to ENSO are significantly changed under abrupt4xCO2 com-
in both hemispheres and scenarios. Thus the SH results differ            pared with piControl, while G1 compares quite closely to pi-
for abrupt4xCO2 from those presented in Vallis et al. (2015).            Control. Differences between G1 and piControl only mani-
The anomalies for most models are significant, and the en-               fest themselves at the eastern (about 165–180◦ E) and west-
semble means are 8 standard errors from zero and thus highly             ern (about 120–90◦ W) sides of the WC, with a signifi-
significant.                                                             cant westward movement during El Niño and no significant
                                                                         changes during La Niña.

Atmos. Chem. Phys., 18, 8689–8706, 2018                                                    www.atmos-chem-phys.net/18/8689/2018/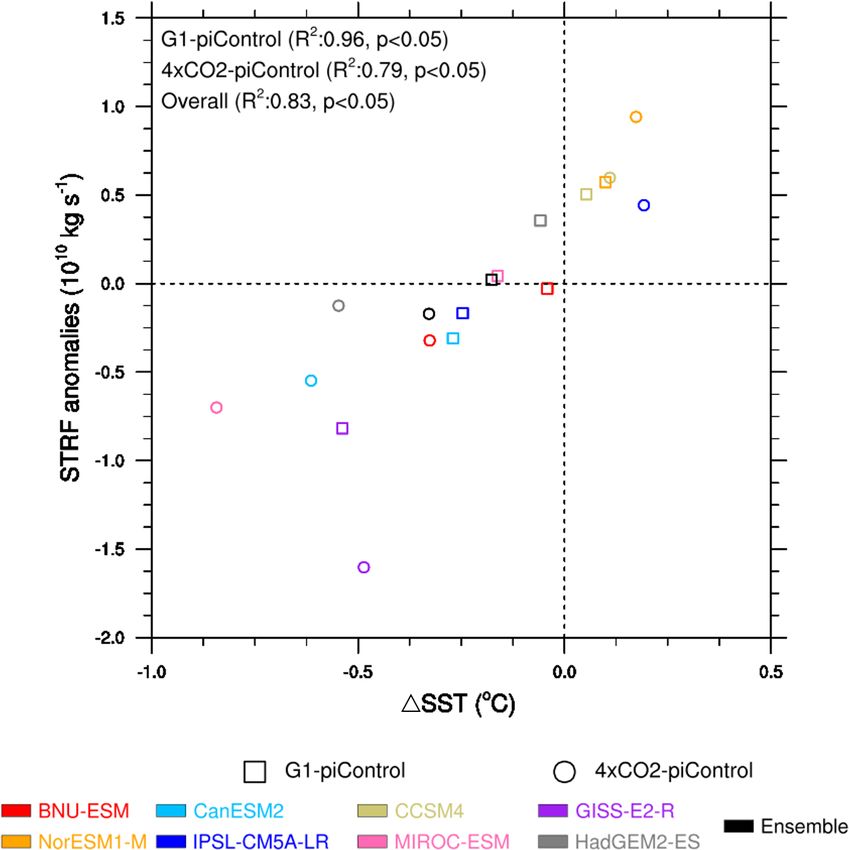
A. Guo et al.: Sunshade geoengineering impact on tropical atmospheric circulation 8697
Figure 7. Change in Hadley cell intensity as a function of ITCZ position under G1 relative to piControl across the models for the northern
Hadley cell in JFM (a) and the southern Hadley cell in JAS (b). The ITCZ position is defined from the centroid of precipitation (Smyth et
al., 2017).
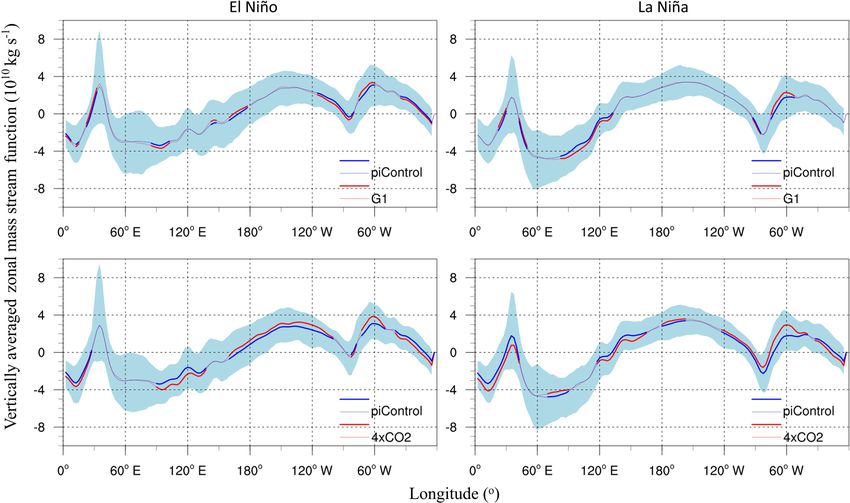
HC responses to ENSO under G1, abrupt4xCO2 and pi-
Control vary among models (Fig. S7). Figure 10 shows the
ensemble mean results. As with the WC, the climatological
features of the Hadley cell show more significant changes
under abrupt4xCO2 than G1 compared with piControl.
The most notable feature of Fig. 10 is the increase in
intensity during La Niña between 10◦ S and 10◦ N under
abrupt4xCO2. This corresponds to changes in the southern
Hadley cell (remember that the axis of the Hadley cells is
northwards of the Equator). Also under the same conditions
there is weakening of the northern Hadley cell between 10
and 20◦ N. The same features are almost as noticeable for
abrupt4xCO2 for El Niño conditions and hence is a gen-
eral feature of the abrupt4xCO2 climate state. Beyond the
Hadley cells there are modest but statistically significant
changes in the Ferrel circulations, particularly in the SH.
Changes under G1 in comparison are much smaller than un-
der abrupt4xCO2, though there are significant reductions in
intensity near the margins of the Hadley cells. The northern
Figure 8. Anomalies (1010 kg s−1 ) relative to piControl amongst cell is more affected in El Niño, while the southern one is
models in Hadley circulation for the northern cell in JFM (a), de- more affected in La Niña states.
fined as the magnitude of the mean meridional stream function be-
tween 15◦ S and 40◦ N, and (b) the southern cell in JAS, defined
as the magnitude of the mean meridional stream function between
15◦ N and 40◦ S. The dot size for the models is about 1 standard 6 Hadley and Walker circulations relationships
error of the model mean. with temperature
6.1 Walker circulation
In contrast, under abrupt4xCO2 almost the whole WC
(about 165◦ E–105◦ W) strengthens in intensity and the west- Changes in tropical Pacific SST dominate the global warm-
ern edge shifts westward at the 95 % statistical significance ing response of the WC change (Sandeep et al., 2014). A
level during El Niño relative to piControl. During La Niña reduced SST gradient between the eastern and western Pa-
there is a significant eastward movement in general. cific drives the weakening of the WC that was seen in a
quadrupled CO2 experiment (Knutson and Manabe, 1995).
The temperature difference between the eastern and west-
www.atmos-chem-phys.net/18/8689/2018/ Atmos. Chem. Phys., 18, 8689–8706, 2018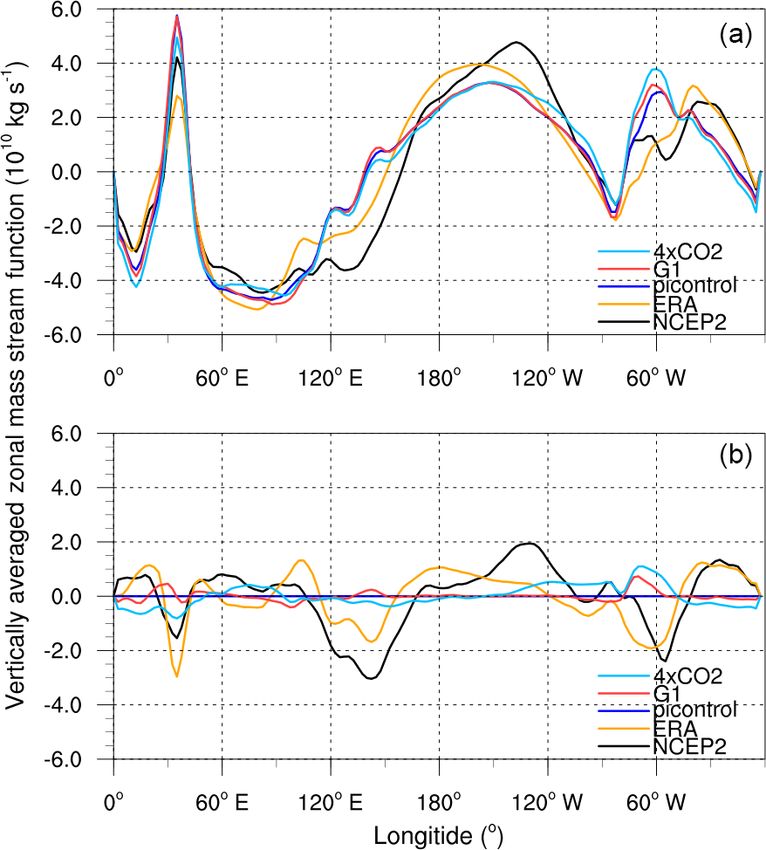
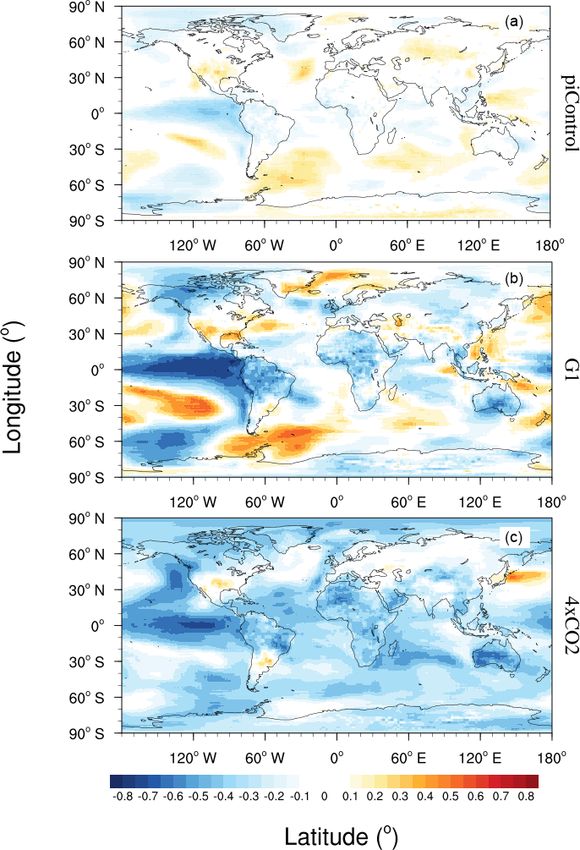
8698                                      A. Guo et al.: Sunshade geoengineering impact on tropical atmospheric circulation

Figure 9. The vertically averaged zonal mass stream function under ENSO. For El Niño or La Niña conditions, the blue line in each panel
represents the vertically averaged zonal mass stream function (1010 kg s−1 ) under piControl. The red line in the top row is G1 and the bottom
row is abrupt4xCO2. The thick lines denote locations where circulation changes are significant at the 95 % confidence level. The 16–84 %
range across the eight individual models is shown by light blue shading.

Figure 10. The vertically averaged meridional mass stream function under ENSO. For El Niño or La Niña conditions, the blue line in each
panel represents the vertically averaged zonal mass stream function (1010 kg s−1 ) under piControl. The red line in the top row is G1 and
the bottom row is abrupt4xCO2. The thick lines denote locations where circulation changes are significant at the 95 % confidence level. The
16–84 % range across the eight individual models is shown by light blue shading.

ern Pacific SST explains 96 % of the inter-model variance                the lack of any transient in STRF (Fig. S1), the relationship
in the strength of the WC in the G1-piControl anomalies and              with 1SST is nearly as good as for piControl. This suggests
79 % of the variance for abrupt4xCO2-piControl (Fig. 11).                that there is no difference in the mode of behavior of the WC
There is no difference in model behavior between the G1 and              under solar dimming SRM or GHG forcing in contrast to the
abrupt4xCO2 anomalies and SST explains 83 % of the over-                 changes seen in the Hadley cells.
all variance. Despite a temperature transient of a decade or so             The correlation between yearly STRF and global 2 m tem-
(e.g., Kravitz et al., 2013) in the abrupt4xCO2 simulation and           peratures is shown in Fig. 12 and the individual models are

Atmos. Chem. Phys., 18, 8689–8706, 2018                                                     www.atmos-chem-phys.net/18/8689/2018/
A. Guo et al.: Sunshade geoengineering impact on tropical atmospheric circulation                                              8699

Figure 11. Model mean monthly anomalies relative to each model’s
piControl of STRF and 1SST. A positive value of STRF and 1SST
indicates strengthening of the Walker circulation.

shown in Fig. S8. We discard the first 20 years for G1 and
abrupt4xCO2 to remove the temperature transients. In G1
all models except CanESM2 and MIROC-ESM have strong
negative correlations between STRF and tropical Pacific tem-
peratures. BNU-ESM, CCSM4 and NorESM1-M show a                     Figure 12. Mean correlation between yearly STRF and global grid-
positive correlation with temperatures in the South Pacific        ded 2 m temperatures for 100 years of piControl (a) and the final
convergence zone (SPCZ) and its linear extension in the            30 years of G1 (b) and abrupt4xCO2 (c) experiments for the eight-
                                                                   model ensemble mean.
South Atlantic. These features are generally muted or ab-
sent in the piControl simulations. Experiments with an atmo-
spheric circulation model (Van der Wiel et al., 2016) suggest
that a key feature of the diagonal structure of the SPCZ is        6.2   Hadley circulation
the zonal temperature gradient in the Pacific, which allows
warm moist air from the Equator into the SPCZ region. This         We now consider how surface temperature changes may im-
moisture then intensifies (diagonal) bands of convection car-      pact the HC. To remove the transients, we only use the last 30
ried by Rossby waves (Van der Wiel et al., 2016). Two of           years for G1 and abrupt4xCO2. The decrease in the northern
the three models with a positive correlation between STRF          Hadley cell intensity in JFM (Fig. 8) correlates with north-
and SPCZ temperatures, CCSM4 and NorESM1-M, have in-               ern hemispheric land temperatures (Fig. 13), explaining 58 %
creased STRF and 1SST under G1 (Fig. 11), suggesting that          of the variance in model anomaly under G1 – which is nev-
this mechanism is responsive in at least some of the models to     ertheless not significant at the 95 % level – and 81 % under
G1 changes in forcing. The SPCZ is the only part of the ITCZ       abrupt4xCO2. NH land temperature also explains 83 % of the
that extends beyond the tropics and so may be expected to be       G1 anomaly in the southern Hadley cell in JAS, but has no
more subject to the meridional gradients in radiative forcing      impact on the abrupt4xCO2 anomaly. Both SRM and GHG
produced by G1. The correlations under abrupt4xCO2 are             forcing modifies the land–ocean temperature difference rela-
more variable across the models, though some of the mod-           tive to piControl and so conceivably affects HC, for example
els like IPSL-CM5A-LR, MIROC-ESM and HadGEM2-ES                    by changing the hemispheric temperature and the position of
exhibit widespread anticorrelation between STRF and tem-           the ITCZ (Broccoli et al., 2006). Under abrupt4xCO2, land–
peratures; the spatial variability suggests that this is not due   ocean temperature differences in the tropics (between 30◦ N
to the strong transient response in global temperature rises       and 30◦ S) are reduced to essentially zero, while under G1
under abrupt4xCO2.                                                 differences in the tropics are 1.2 ◦ C, which is not significantly

www.atmos-chem-phys.net/18/8689/2018/                                               Atmos. Chem. Phys., 18, 8689–8706, 2018
8700 A. Guo et al.: Sunshade geoengineering impact on tropical atmospheric circulation
Figure 13. Hadley intensity mean model anomalies versus the Northern Hemisphere land temperature for the northern Hadley cell in JFM (a)
and the southern Hadley cell in JAS (b). A positive value of Hadley intensity indicates Hadley circulation strengthening regardless of the
direction.
different from the piControl difference of 1.4 ◦ C. Since the tions give fairly similar numbers for the estimated change in
largest continental land masses are in the NH, we would ex- Hadley intensities in the northern and southern cells under
pect any differences in HC induced by land–ocean contrasts G1 and abrupt4xCO2. These estimates agree with the sim-
in the NH to be visible in the southern Hadley cell. We ex- ulated changes in intensities under G1, but are very differ-
plored the impact of land–ocean temperature differences by ent from those simulated under abrupt4xCO2. The obvious
considering differences in the surface temperatures over Ti- cause of the discrepancies under abrupt4xCO2 is the change
bet and the whole tropical ocean temperature (Fig. S9). Re- in static stability, which in both model scaling formulations
sults were similar to those for Fig. 13, with significant corre- leads to 18–25 % reductions in Hadley intensity compared
lations for G1 in the southern Hadley cell. with the ensemble model simulated changes of about ±4 %.
Seo et al. (2014) examine the relative importance of This supports the analysis of Seo et al. (2014) that it is the
changes in meridional temperature gradients in potential meridional temperature gradient that is the dominant factor
temperature, subtropical tropopause height and static stabil- in determining the strength of the HC.
ity on the strength of the HC. They find that according to
scaling theory based on the Held and Hou (1980) and the
Held (2000) models and an analysis of 30 CMIP5 models 7 Discussion
forced by the RCP8.5 scenario, the meridional temperature
He and Soden (2015) conclude from experiments designed
gradient is the most important factor.
to elucidate the role of various forcings on tropical circula-
We used the same procedure as Seo et al. (2014) on the
tion that weakening of the WC under GHG forcing is primar-
four models (BNU-ESM, IPSL-CM5A-LR, HadGEM2-ES,
ily due to mean SST warming. They also note that increased
MIROC-ESM) that provide all the fields needed under the
land–sea temperature contrast results in strengthening of the
G1 and abrupt4xCO2 scenarios (Table 3). The changes in
circulation, and also that while the pattern of GHG warm-
ensemble mean circulation intensity are similar under G1
ing is close to an El Niño, there are sufficient differences
and abrupt4xCO2, as are the changes in potential tempera-
to produce quite different responses in the WC. We may
ture gradients relative to piControl, but the changes in static
therefore expect that changes under G1 compared with pure
stability are very different between the experiments. The tro-
GHG forcing would manifest themselves given the changes
pospheric heights also change between G1 and abrupt4xCO2
in both the direct and indirect CO2 forcings. What we ob-
scenarios, with small reductions under G1 and about a 3
serve, though, is that changes in the WC are modest, and ex-
and 0.9 % increase, respectively, in the southern and north-
amination of the dependence on intensity as a function of
ern cells under abrupt4xCO2. We used the two scaling rela-
zonal Pacific Ocean temperature differences (Fig. 11) shows
tions given by Seo et al. (2014) to also estimate the change in
no differences between the GHG and G1 forcings. Similarly,
Hadley intensity based on the changes in temperature gra-
we find no change in the intensity with land–ocean tempera-
dients, static stability and tropospheric height for the en-
ture gradients.
semble mean of the four models (Table 3). Both formula-
Atmos. Chem. Phys., 18, 8689–8706, 2018 www.atmos-chem-phys.net/18/8689/2018/A. Guo et al.: Sunshade geoengineering impact on tropical atmospheric circulation 8701
Table 3. The percentage changes in G1-piControl and abrupt4xCO2-piControl relative to piControl in the four-model (BNU-ESM, IPSL-
CM5A-LR, HadGEM2-ES, MIROC-ESM) ensemble mean, with the across-model range in brackets. Functions 1 and 2 are scale factors for
the Hadley circulation (Seo et al., 2014).
Scenario G1-piControl abrupt4xCO2-piControl
North South North South
Temperature gradient −2.6 (−3.5 to −1.1) −1.2 (−1.7 to 0.1) −4.4 (−6.1 to 0.7) −4 (−6.1 to −0.3)
Static stability −3.4 (−4.7 to −1.5) −3.2 (−5.2 to −0.4) 21 (18 to 26) 23 (21 to 27)
Subtropical tropopause height −0.1 (−2.1 to 1.8) −0.5 (−1.4 to −0.1) 0.87 (1.2 to 6) 3 (−0.7 to 4)
Function 1a −3.35 (−9.8 to 4.4) −1.05 (−7.5 to 1.2) −29.8 (−30 to −17) −25.5 (−32 to −19)
Function 2b −2.9 (−8.2 to 3.8) −1.13 (−6.4 to 0.7) −22.6 (−23 to −12) −18.5 (−24 to −14)
Hadley intensityc −3.7 (−6.4 to −0.5) −1.2 (−6 to 0.8) −3.4 (−4.1 to −1) 4.3 (2.4 to 4.8)
a Function 1 is 5 δH + 5 δ1H − δ1V and is based on the model of Held and Hou (1980).
2 H 2 1H 1V
b Function 2 is 9 δH + 2 δ1H − 3 δ1V , which is derived from the model by Held (2000). 1 is the meridional temperature gradient defined as θeq −θhigher lat ,
4 H 1H 4 1V H θ0
which is the tropospheric mean meridional potential temperature gradient with θ0 denoting the hemispheric troposphere mean potential temperature and θeq calculated
◦ ◦ ◦
between 10 N and 10 S. We follow Seo et al. (2014) in taking θhigher lat as the average potential temperature between 10 and 50 N for the Northern Hemisphere
θ −θ
winter and 10–30◦ S for the Southern Hemisphere. Potential temperature gradients are defined here as the average between 1000 and 400 hPa. 1V = 300θ 925 is the
0
◦ −1
dry static stability of the tropical troposphere. H is the subtropical tropopause height estimated as the level at which the lapse rate decreases to 2 C km .
c The Hadley intensity ψ is described in Sect. 2.3 and we use JFM in the Northern Hemisphere and JAS in the Southern Hemisphere.
m
We see large changes throughout the whole Hadley cell Furthermore, the intensity of the HC is expected to de-
circulation under abrupt4xCO2. We also see that the northern crease as it expands and also in response to an accelerated
boundary of the southern cell tends to expand even further hydrological cycle. An enhanced hydrological cycle is ex-
northwards with a corresponding weakening of the northern pected under GHG forcing but not SRM, which leads to net
cell during La Niña conditions. Global temperatures are rela- drying (Kravitz et al., 2013). This cannot be a complete ex-
tively reduced during La Niña years. Beyond the Hadley cells planation for circulation changes since the HC also depends
there are modest but statistically significant changes, particu- on the evolution of the baroclinic instabilities in the extra-
larly in the SH Ferrel circulations with poleward movement. tropics, which may have a quite different response to cli-
Changes under G1 in comparison are much smaller than un- mate warming (e.g., Vallis et al., 2015). Our analysis of in-
der abrupt4xCO2, though there are significant reductions in tensity shows differences in behavior between the southern
intensity near the margins of the Hadley cells and these are and northern cells, in particular a lack of strong dependence
related to the equatorward motion of the ITCZ. The northern on temperature gradients for the southern cell. The difference
cell is affected more in El Niño, while the southern one is in behavior between northern and southern Hadley cells has
more affected by La Niña states. not been explained to date. Seo et al. (2014) note that under
Davis et al. (2016) show that southern Hadley cell expan- RCP8.5 forcing, models of the southern Hadley cell changes
sion in the tropics is on average twice the northern Hadley are split almost equally between those predicting increases in
expansion. The idealized forcings in abrupt4xCO2 and G1 intensity and those that suggest decreases, whereas all but 1
show that this cannot be due to stratosphere ozone depletion of 30 models predict a decrease in the northern cell. We note
– the mechanism sometimes used to account for the simi- that the robustly understood v ertical expansion of the circu-
lar observed greater expansion of the southern Hadley cell lation as the tropopause rises under abrupt4xCO2 has been
(Waugh et al., 2015). The changes in the width of the tropi- associated with a decrease in the circulation intensity (Seo
cal belt are strongly dependent on the tropical static stability et al., 2014; He and Soden, 2015) in climate models forced
in the models according to the Held and Hou (1980) scal- by GHGs and as expected from considerations of Clausius–
ing, which is with the potential temperatures at the tropi- Clapeyron scaling if relative humidity is relatively constant,
cal tropopause (100 hPa) and the surface. Since the adiabatic as summarized by Vallis et al. (2015). This is not the case
lapse rates scale with surface temperature, this is also re- for the scaling functions from Seo et al. (2014; Table 3), in
flected in the surface temperature. Consideration of simpli- which tropopause height change is proportional to intensity
fied convective systems based on moist static energy fluxes change. Nor it is consistent with increases simulated in the
(Davis, 2017) and/or making some assumptions with the southern Hadley cell intensity and simultaneous decreases
Held (2000) and Held and Hou (1980) models led Seo et in the northern one relative to piControl, although both are
al. (2014) to suggest Hadley cell intensity scales according stronger than under the G1 forcing. Our analysis of the rel-
to the Equator–pole temperature gradient. ative importance of factors in driving intensity suggests, as
with Seo et al. (2014), that the meridional temperature gradi-
www.atmos-chem-phys.net/18/8689/2018/ Atmos. Chem. Phys., 18, 8689–8706, 20188702 A. Guo et al.: Sunshade geoengineering impact on tropical atmospheric circulation ent plays the dominant role rather than tropopause height or signed to be zonally symmetric, and that may explain the static stability changes. lack of impact in the WC under both G1 and GHG forcing. Grise and Polvani (2016) explored how the dynamic re- There are clear changes in Hadley cells under the latitudinal sponse of the atmosphere, including metrics such as Hadley varying forcing of G1. The reduction in incoming shortwave cell edge, varied with model climate sensitivity, which is the radiation in G1 would intuitively mean reduced heating, sea mean temperature rise associated with doubled CO2 . They surface temperatures and moisture flux in the ITCZ, which found significant correlation across a suite of CMIP5 models follows the movement of the sun. Analysis of extreme precip- running the abrupt4xCO2 that was largely confined to the SH itation events in daily data from the GeoMIP models (Ji et al., and also that the pole-to-Equator surface temperature gradi- 2018) shows that the annual wettest consecutive 5 days are ent accounted for significant parts of the dynamic variabil- drier under G1 along a seasonal path that follows the ITCZ ity that was not dependent on the mean temperature. How- motion, while precipitation extremes increase in the tropical ever, we find that the response times of the HCs to changes dry seasons. This result is consistent with the variation in the in radiative forcing are very fast, as shown by the lack of Hadley intensity cell seen here. transients in the simulated time series. Sea surface tempera- tures, especially under the strong abrupt4xCO2 forcing, takes at least a decade and parts of the system, such as the deeper ocean, would require even longer to reach equilibrium. Un- 8 Summary der abrupt4xCO2 the global land–ocean temperature differ- ence is reduced by about 1.3 ◦ C relative to piControl, while Our main purpose in this study has been to answer the follow- G1 reduces the contrast by only 0.3 ◦ C. The NH continents ing questions: does the G1 scenario counteract the position have faster response times than the oceans and so we would and intensity variations in the Walker and Hadley circulations expect the SH to be much further from an equilibrium re- caused by the GHG longwave forcing under abrupt4xCO2? sponse than the NH. This is also reflected in the lack of an How does the tropical atmospheric circulation, including the equivalent to the “Arctic amplification” seen in the NH un- Walker and Hadley circulations, respond to warm and cold der both observed and simulated forcing by GHGs. The lack phases of the El Niño–Southern Oscillation (ENSO) in G1 of anomalous southern polar warming is linked to the much and abrupt4xCO2? cooler surface temperatures in the Antarctic mitigating both The WC in G1 displays insignificant increases in intensity temperature feedbacks and the ice–albedo feedback mech- and no shift in its western edge in the Pacific Ocean rela- anism (Pithan and Mauritsen, 2014). The speed of the re- tive to piControl and hence does counteract the changes from sponse of the circulation changes calls into question the im- GHG forcing. There is a potentially important change in the portance of static stability and meridional gradients in driv- position of the WC associated with the West African rain for- ing the changes in the circulation, since the circulation re- est and East African grassland zones under G1, with poten- sponds faster. Bony et al. (2013) attributed rapid changes in tial for the encroachment of a drier climate into the Congo circulation in quadrupled CO2 to direct CO2 forcing. A fast basin. In contrast, the HC shows larger changes under G1 that response could also be a result of cloud feedback, land–ocean are not simple reversals of those induced by GHG forcing temperature differences and perhaps humidity, which are also on piControl climate. There are asymmetric responses be- important for poleward energy transport in G1 (Russotto and tween the hemispheres under both GHG and solar dimming Ackerman, 2018a, b). The low cloud fraction decreases un- that are correlated with direct forcings rather than adjustment der G1, warming the planet by reducing the reflection of solar of sea surface temperatures and correlated with changes in shortwave radiation, but atmospheric humidity is reduced, al- meridional and land–ocean temperature gradients. These dif- lowing heat to escape, and less energy is transported from the ferences in the response of the Hadley and Walker circula- tropics to the poles. tions are consistent with the zonally invariant forcing of both Our analysis of circulation intensity changes and their solar dimming and GHGs and the meridionally varying solar dependence on temperature changes shows quite different dimming. sets of behavior under G1 than under abrupt4xCO2 for the A clear WC westward movement during El Niño and an Hadley but not the WC. The response under G1 relative to eastward movement during La Niña are shown nearly ev- piControl is a slight overcooling of the tropics relative to erywhere along the Equator in abrupt4xCO2. However, the the global mean temperature (Kravitz et al., 2013). Exper- eastern and western boundaries of the WC shift westward iments with idealized climate models (Tandon et al., 2013) during El Niño in G1 relative to piControl. The range and show that heating at the Equator alone tends to reduce the amplitudes of significant changes are smaller in G1 than in Hadley cell width, while wider heating in an annulus around abrupt4xCO2. The same is true in general for the Hadley cell. the outer tropics (20–35◦ in each hemisphere) tends to pro- Under abrupt4xCO2 the northern Hadley cell significantly duce a complex response to circulation in both Hadley and decreases in intensity under both la Niña and El Niño condi- Ferrel cells more reminiscent of the anomaly patterns seen tions, while under G1 the decreases are smaller and limited under abrupt4xCO2. The climate forcing under G1 is de- to each cell’s poleward boundaries. Atmos. Chem. Phys., 18, 8689–8706, 2018 www.atmos-chem-phys.net/18/8689/2018/
You can also read