Technical note: Low meteorological influence found in 2019 Amazonia fires
←
→
Page content transcription
If your browser does not render page correctly, please read the page content below
Biogeosciences, 18, 787–804, 2021
https://doi.org/10.5194/bg-18-787-2021
© Author(s) 2021. This work is distributed under
the Creative Commons Attribution 4.0 License.

Technical note: Low meteorological influence found in
2019 Amazonia fires
Douglas I. Kelley1 , Chantelle Burton2 , Chris Huntingford1 , Megan A. J. Brown1,3 , Rhys Whitley4 , and Ning Dong5
1 UK  Centre for Ecology & Hydrology, Wallingford, Oxfordshire, OX10 8BB, UK
2 Met Office Hadley Centre, Fitzroy Road, Exeter, EX1 3PB, UK
3 DISCnet Centre for Doctoral Training, School of Physical Sciences, The Open University, Walton Hall, Milton Keynes,

MK7 6AA, UK
4 Natural Perils Pricing, Commercial and Consumer Portfolio and Product, Suncorp Group, Sydney, Australia
5 Department of Biological Sciences, Macquarie University, North Ryde, NSW 2109, Australia

Correspondence: Douglas I. Kelley (douglas.i.kelley@gmail.com)
and Chantelle Burton (chantelle.burton@metoffice.gov.uk)

Received: 3 April 2020 – Discussion started: 11 May 2020
Revised: 25 October 2020 – Accepted: 24 November 2020 – Published: 4 February 2021

Abstract. The sudden increase in Amazon fires early in the       being caused by meteorological conditions alone, decreasing
2019 fire season made global headlines. While it has been        to 6 %–7 % along the agricultural–humid forest interface in
heavily speculated that the fires were caused by deliberate      Brazil’s central states and 8 % in Paraguay and Bolivia dry
human ignitions or human-induced landscape changes, there        forests. Our results suggest that changes in land use, cover
have also been suggestions that meteorological conditions        or management are the likely drivers of the substantial in-
could have played a role. Here, we ask two questions: were       crease in the 2019 early fire season burnt area, especially in
the 2019 fires in the Amazon unprecedented in the histori-       Brazil. Burnt area for September in the arc of deforestation
cal record, and did the meteorological conditions contribute     had a 14 %–26 % probability of being caused by meteoro-
to the increased burning? To answer this, we take advan-         logical conditions, potentially coinciding with a shift in fire-
tage of a recently developed modelling framework which           related policy from South American governments.
optimises a simple fire model against observations of burnt
area and whose outputs are described as probability densities.
This allowed us to test the probability of the 2019 fire sea-
son occurring due to meteorological conditions alone. The        1   Introduction
observations show that the burnt area was higher than in
previous years in regions where there is already substantial     South American fires made global headlines in August 2019,
deforestation activity in the Amazon. Overall, 11 % of the       with the largest increase in fire activity seen in nearly 10
area recorded the highest early season (June–August) burnt       years (INPE, 2019; Lizundia-Loiola et al., 2020). Of the
area since the start of our observational record, with areas     roughly 100 000 fires burning by the end of the month,
in Brazil’s central arc of deforestation recording the highest   around half were in the Amazon rainforest region (de
ever monthly burnt area in August. However, areas outside of     Oliveira Andrade, 2019; INPE, 2019). While fires in drier
the regions of widespread deforestation show less burnt area     savannah regions of South America such as the Cerrado are
than the historical average, and the optimised model shows       more common, fires in the rainforest are not a natural oc-
that this low burnt area would have extended over much of        currence and are rarely ignited without human intervention
the eastern Amazon region, including in Brazil’s central arc     (Aldersley et al., 2011). As such, fires in humid, tropical re-
of deforestation with high fire occurrence in 2019. We show      gions where the vegetation is not adapted to frequent burn-
that there is a 9 % likelihood of the observed August fires      ing (Kelley, 2014; Staver et al., 2020; Zeppel et al., 2015),
                                                                 have much higher tree mortality rates (Brando et al., 2014;

Published by Copernicus Publications on behalf of the European Geosciences Union.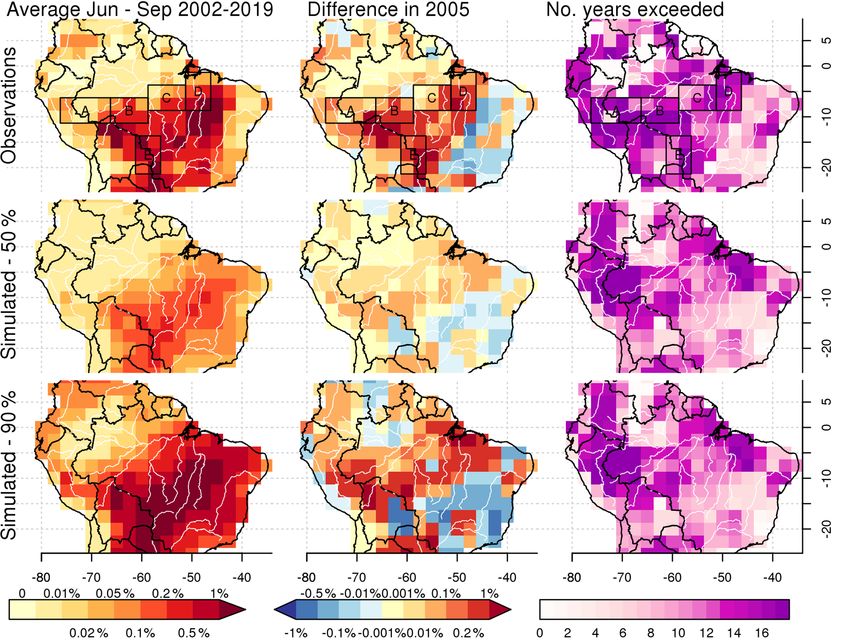
788                         D. I. Kelley et al.: Technical note: Low meteorological influence found in 2019 Amazonia fires

Cochrane and Schulze, 1999; Pellegrini et al., 2017). As a          the number of drivers. Fire danger indices (FDIs), which can
result, an estimated 906 000 ha of the Amazon biome was             capture simultaneous drivers, are useful for calculating the
lost to fires in 2019 (Butler, 2017). The amount of carbon          level of risk of a fire spreading and becoming severe in a par-
and trace gas emission was also a major concern given the           ticular area (de Groot et al., 2015). FDIs have been adapted
high biomass of the areas being burnt, and smoke from these         to assess recent and future trends in climate regarding fire
fires reached cities as far as São Paulo more than 2700 km          weather (Burton et al., 2018; Jolly et al., 2015) and attribute
away (Lovejoy and Nobre, 2019). Usually, small-scale fires          increases in fire risk to anthropogenic changes in climate
in Amazonia are associated with deliberate but localised            (van Oldenborgh et al., 2020). These metrics thereby pro-
deforestation, although in dry years, there is more risk of         vide rapid policy-relevant information for fire management
these fires escaping into much larger areas (Aragão et al.,         (De Groot et al., 2010; Perry et al., 2020). However, FDIs
2018). Hence the substantial increase in fires in 2019 sparked      by themselves do not account for fuel or ignitions, differen-
much debate about whether the level of burning was unprece-         tiating them from fire observations such as burnt area, which
dented, whether increased burning was driven by a drier than        makes them an unsuitable tool for assessing fire in the holis-
normal fire season and whether raised levels of direct defor-       tic context of weather, fuel dynamics, ignitions, and human
estation played a role (Arruda et al., 2019; Escobar, 2019).        land and fire management (Kelley and Harrison, 2014). Fire-
   The Amazon has not been the only place with recent un-           enabled land surface models (LSMs) can, however, account
usual and high fire activity, with large-scale fire events world-   for these drivers (Kelley and Harrison, 2014; Lasslop et al.,
wide in the last couple of years including in the Arctic,           2016; Prentice et al., 2011b) to simulate a physical, observ-
Mediterranean, Australia, the UK and the US. In Novem-              able measure of fire regimes, such as burnt area or number of
ber 2018 over 80 people were killed in the Camp Fire in Par-        fires. Some LSM fire schemes achieve this by modelling fuel
adise, California, the most destructive in California’s history,    moisture using FDIs (Lenihan et al., 1998; Rabin et al., 2017;
with the Camp, Woolsey and Carr fires together costing an           Venevsky et al., 2002). However, most LSMs have been de-
estimated USD 27 billion in damages (Nauslar et al., 2019).         veloped to study long-term, often decadal-timescale carbon
California 2020 fire season is set to be even more damag-           dynamics and Earth system feedbacks and therefore often fail
ing (Anon, 2020), though the true extent and costs are still        to reproduce year-to-year patterns of fire with the required
increasing at the time of writing. Hundreds of fires burnt in       accuracy to determine the causes of individual fire seasons
Siberia and Alaska throughout the 2019 and 2020 Northern            (Andela et al., 2017; Hantson et al., 2016, 2020). Embed-
Hemisphere summers, releasing over 150 Mt of CO2 in 2019            ding fire within a complex vegetation model system also pre-
and 244 Mt in 2020 into the atmosphere (Witze, 2020). Of            vents rapid observation–model fusion, as iterative optimisa-
major concern was the release of large quantities of black          tion techniques are too computationally expensive and insta-
carbon with the potential to further accelerate local arctic        bilities arise from non-linear responses of fire to simulated
ice melt (Patel, 2019). The UK saw some burning, including          vegetation and fuel dynamics. Many large-scale vegetation-
a peatland fire in north-east Sutherland that doubled Scot-         modelling projects, therefore, simulate up to a “present day”
land’s carbon emission for 6 d in May 2019 (Wiltshire et al.,       that can be several months or years out of date (Friedling-
2019). Between September 2019 and February 2020, fires              stein et al., 2019; Hantson et al., 2020). This lack of pre-
across south-eastern Australian burnt around 18.6 × 10⁶ ha,         dictive capability has led to calls for simulation frameworks
destroyed over 5900 buildings and killed at least 34 people         that fuse statistical representations of fire drivers with mod-
(Boer et al., 2020; RFS, 2019; Sanderson and Fisher, 2020).         elling techniques that consider such interactions (Fisher and
Unusual fire events such as these are expected to increase          Koven, 2020; Forkel et al., 2017; Krawchuk and Moritz,
in frequency in the future from both changes in climate and         2014; Sanderson and Fisher, 2020; Tollefson, 2018; Williams
socio-economic pressures on the landscape (Fonseca et al.,          and Abatzoglou, 2016).
2019; Jones et al., 2020). Given the concerns raised and the           Kelley et al. (2019) developed a methodology which ad-
extent to which much of these fire events captured the atten-       dresses this gap by coupling the same representation of pro-
tion of the public and press in recent months, in the after-        cesses found in simple fire-enabled LSMs (Rabin et al.,
math, it is important to look at these events objectively. In       2017) using a Bayesian inference framework. The main ad-
particular, it is essential to determine whether they were un-      vantage of this system is that it can assess the contribution
usual in the context of the historical record and, if so, what      of different fire drivers directly from observations and track
might be new and emerging drivers.                                  uncertainty in the model parameters and the models’ abil-
   There are many ways to assess drivers of historical fire         ity to reproduce observations. We apply this methodology
events. Some studies simply correlate individual drivers with       here, using monthly meteorological conditions and burnt area
burnt area in isolation (Andela et al., 2017; Van Der Werf          (BA) observations to constrain and drive the model, thus cap-
et al., 2008). However, these do not consider the complex in-       turing interannual variability within the context of changing
teraction of multiple drivers regarding fire and are therefore      meteorological conditions. We use this framework to answer
unable to go beyond a loose attribution of a particular forc-       the specific question: did the meteorological conditions con-
ing to fire, which can easily be confused as causations due to      tribute to the Amazonia fires of 2019?

Biogeosciences, 18, 787–804, 2021                                                       https://doi.org/10.5194/bg-18-787-2021
D. I. Kelley et al.: Technical note: Low meteorological influence found in 2019 Amazonia fires                                   789

2   Methods                                                            The model was optimised against MCD64A1 burnt area
                                                                    (Giglio et al., 2018) for the period July 2002 to June 2018,
The modelling protocol and optimisation framework largely           which was the common period for all datasets (Table S2) over
follow Kelley et al. (2019), where a more detailed descrip-         South America, south of 13◦ N. We used the same Bayesian
tion may be found. Here, we summarise and outline further           inference technique as per Kelley et al. (2019). Bayes’ theo-
refinements. Monthly BA is modelled as a product of limita-         rem states that the likelihood of the values of the set, β, which
tions imposed by four controls: (1) fuel availability; (2) mois-    contain our 24 unknown parameters (i.e. the 21 parameters
ture in live and dead fuel; (3) anthropogenic and natural igni-     from Kelley et al. (2019), wd from Eq. (1) and error term pa-
tion; (4) both active suppression and landscape fragmentation       rameters P0 , σ in Eq. 3) and our known model inputs, given
effects from human land use (Table S1 in the Supplement).           a set of observations Ys is proportional to the prior proba-
Each control is calculated as a linear combination of its re-       bility distribution of β (P (β)) multiplied by the conditional
spective drivers. The impact each control has on fire is repre-     probability of Ys given β:
sented by a logistic curve describing the maximum allowed
                                                                    P (β|Ys ) ∝ P (β) · P (Ys |β).                               (2)
burnt area based on that control, and the product of all four
limitations is used to determine BA.                                   As 41.47 % of the burnt area observations are zero and
   We made several changes to the previous modelling pro-           the remaining are normally distributed under logit transfor-
tocol in order to utilise near-real-time meteorological and         mation (Fig. A1 in Appendix A), we, therefore, defined the
fire variables so that we can produce relevant results that         likelihood, P (Ys |β) using a zero-inflated normal distribution
closely follow the fire event and to better describe the con-       on the logit transformed burnt area, as opposed to a simple
ditional probability distribution between parameter samples         normal distribution as used in Kelley et al. (2019). This bet-
and burnt area observations. We used the MODIS Collec-              ter described the observational to the simulated difference in
tion 6 MCD64A1 burnt area product (Giglio et al., 2018) as          burnt area during times of very low or very high burning. Our
our target dataset and replaced actual over potential evapo-        zero-inflation likelihood term is therefore described as
transpiration in the moisture control with soil moisture (Ta-       P (Ys = 0| β) = 5N           2
                                                                                       i (1 − BAi ) · (1 − P0 ),
ble S1). We also used both the top 10 cm and 10–200 cm
                                                                                                             N
soil moisture (Kalnay et al., 1996) as independent moisture         P (Ys > 0| β) = [1 − P (Ys = 0| β)] · √
drivers in order to capture the impact of previous drought                                                 σ 2π
                                                                                          (                            2 )
years on deep water availability for live fuel. As near-real-                                N logit(yi ) − logit(BAi )
                                                                                    · exp 6i                                 ,   (3)
time wet-day information is also not available, we replaced                                                 σ
wet days in the calculation of dead fuel drying potential (Kel-
ley et al., 2014) with a proxy for wet days (WDs), using            where i represents an individual data point, yi is the burnt
Global Precipitation Climatology Project (GPCP) precipita-          area observations,
                                                                                         N is the observation sample size and

                                                                                      x
tion (Adler et al., 2003) (pr) based on (Prentice et al., 2011a)    logit(x) = log 1−x .
                                                                       The posterior solution was inferred for all model parame-
WD = 1 − e−wd·pr ,                                           (1)    ters using a Metropolis–Hastings Markov chain Monte Carlo
                                                                    (MCMC) step with the PyMC3 Python package (Salvatier
where wd is an optimised parameter.                                 et al., 2016), running 10 chains each over 10 000 iterations.
   All variables were resampled and, where necessary, inter-        We used all of the 44 750 grid cells on our 2.5◦ grid and
polated to a monthly time step as per Kelley et al. (2019).         monthly time step for 16 years in our assimilation procedure.
All driving variables were provided on a resolution of 2.5◦         This is a departure from Kelley et al. (2019), where only 10 %
except land use, provided at 0.5◦ . We, therefore, choose to        of grid cells were used, as our sample size was much smaller
regrid all datasets to a resolution of 2.5◦ , as interpolating to   and we did not face the same computational demand. Due
a finer resolution would provide no new information about           to our sample size, our likelihood dominates over our priors,
the meteorological drivers tested. MCD64A1, soil moisture           and as with Kelley et al. (2019), priors predominantly were
and equilibrium fuel moisture content were processed using          employed to set physically plausible bounds on our parame-
the “rgdal” (Bivand et al., 2016) and “raster” (Hijmans and         ters.
van Etten, 2014) packages in R (R Core Team, 2015). For                Once optimised, the model was then run from January
MODIS vegetation continuous field (VCF) fractional covers           2002–December 2019, and so the trained model was in a
(Dimiceli et al., 2015), tiles were merged and resampled to         predictive mode for 2019. Due to data availability at the
the model grid using the “gdal” package (GDAL/OGR con-              time of writing, July 2017–June 2018 land cover, land use
tributors, 2018). Land use, population density, precipitation,      and population density were recycled for July 2018 onwards
humidity, temperature and lightning were processed using            (Table S2). We sampled 100 parameter ensemble members
the iris package (Met Office, 2013) with Python version 3           from the last 5000 iterations of each of the 10 chains, pro-
(Python Software Foundation, https://www.python.org/, last          viding us with 1000 ensemble members to estimate the mod-
access: 27 March 2019).                                             els’ posterior solution to Eq. (2). Sampling was performed

https://doi.org/10.5194/bg-18-787-2021                                                         Biogeosciences, 18, 787–804, 2021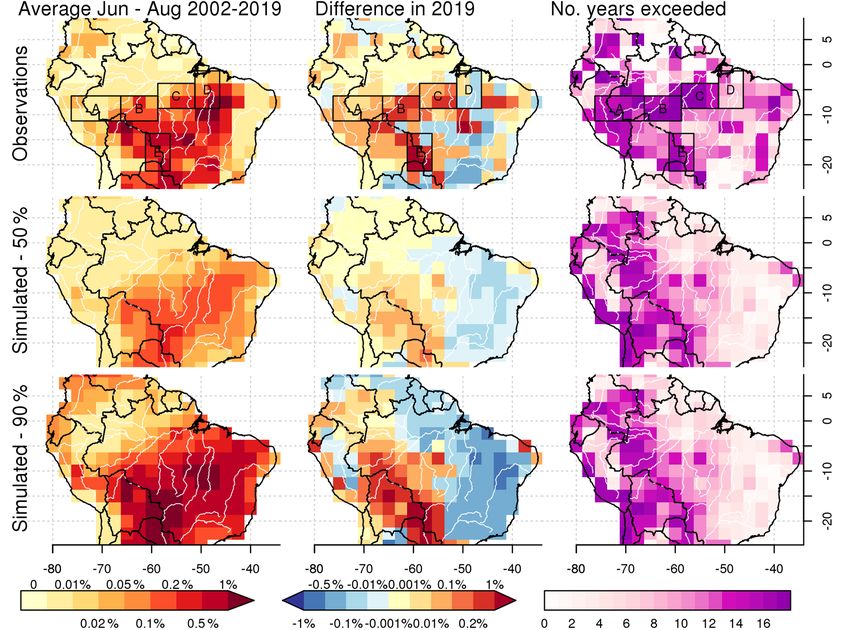
790 D. I. Kelley et al.: Technical note: Low meteorological influence found in 2019 Amazonia fires
using the iris package (Met Office, 2013) with Python ver- F. area of active deforestation
sion 3 (Python Software Foundation, https://www.python.
org/). The posterior solution provides an estimate of the burnt G. the southern end of agricultural–humid tropical forest
area based on the parameter uncertainty of our model, corre- interface in Brazil’s central states, often associated with
sponding to the yellow areas in time series in Figs. 1 and 2. the arc of deforestation in Brazil’s central states
The mean burnt area for a particular parameter combination H. drier savanna and woodland in Cerrado and Caatinga
(BAβ ) was obtained from in the eastern basin where land has already been heavily
converted to agriculture
Z1
BAβ = P (BA|β) · BA dBA. (4) I. southern seasonally dry–deciduous Chiquitano and
Gran Chaco forests, mainly along the Amazon and La
0
Plata watersheds.
BAβ was evaluated using the implementation of the fire We assessed the probability of 2019 fire activity being ex-
Model Intercomparison Project (fireMIP) benchmarking plained by information provided to the model in three ways
metrics (Hantson et al., 2020; Kelley et al., 2013; Rabin et al., (Table 1):
2017) as per Kelley et al. (2019). We also performed ad-
ditional benchmarking metrics of the models’ ability to re- 1. The likelihood of observed monthly burnt area based on
produce seasonality and inter-annual variability of fire. See the information provided to our model: in the predictive
Figs. S1–S3 in the Supplement and the model evaluation model, the probability of a burnt area y (where y can be
Supplement for validation methods and results. outside training data Ys , as is the case for our year 2019
We chose five regions (marked A–E in Fig. 1 and Table 1; analysis) being explained by our model (Pred(y) – full
see Fig. A2 for locations) to represent forest areas already model uncertainty, or model error, in tan areas on time
under pressure from deforestation. Regions A–C form a tran- series in Figs. 1 and 2) is proportional to the probability
sect (west to east) across the agricultural–humid tropical for- of y given a parameter set, β, weighted by P (β| Ys ):
est interface in Brazil’s arc of deforestation, often associated Z
with deforestation (Fig. S4), whereas the D and E regions Pred(y) ∝ P (β| Ys ) · P (y| β)dβ. (5)
are found in agricultural regions embedded in savanna and PS
grassland regions that experience frequent burning:
Where the observed burnt area, y, falls within the
A. Acre, southern Amazonas state and Brazilian–Peruvian model’s full posterior, (D(y)) is then the sum of all
border probabilities greater than y:
B. Rondônia and northern Mato Grosso, Brazil Z1
D(y) = Pred(y)dBA. (6)
C. Tocantins, Brazil
y
D. Maranhão and Piau in coastal deforestation regions
When D(y) ∼ 0, 1 suggests y is towards the extremes
E. Brazilian, Bolivian and Paraguayan border. of the posterior. As our posterior solution is not nor-
mally distributed, observations can fall at the extremes
We also assessed an overall area of active deforestation (i.e. when there is no burnt area, y = 0 and by defi-
(AAD) in the Amazon region (Fig. A2). This area is defined nition D(y) = 1) and still have a high likelihood (i.e.
as the parts of South American southern tropics with signif- if P (Ys = 0| β) in Eq. (3) is much greater than 0; see
icant decreasing tree cover trends, as seen in VCF (Dimiceli Fig. B2 as an example). We, therefore, define the sig-
et al., 2015) and significant increasing agricultural fractions nificance of D(y) as the probability of y occurring by
in the HYDEv3.1 dataset (Klein Goldewijk et al., 2010). chance (pv(y)) from the sum of all probabilities below
Trend analysis used the same technique described in Kel- P (y) (Fig. B2):
ley et al. (2019), where we took significance as p < 0.05 on
the linear trend for each month in the year on logit trans- i≤n
X Zyi
formed cover variables, using the green–brown R package pv(y) = 1 − P (x)dx − P (y) · (yi − yi−1 ), (7)
(Forkel et al., 2013, 2015). AAD was additionally assessed i2·Z y
i−1
over three sub-region areas, primarily to evaluate the mod-
els’ historic performance and assess the increase in 2019 fires where {yi , . . ., yn } is the set of solutions to P (yi ) =
across the humidity gradient: P (y).
Whenever D(y) and pv(y) are low, this indicates burn-
ing is significantly higher than expected by the model in
that month.
Biogeosciences, 18, 787–804, 2021 https://doi.org/10.5194/bg-18-787-2021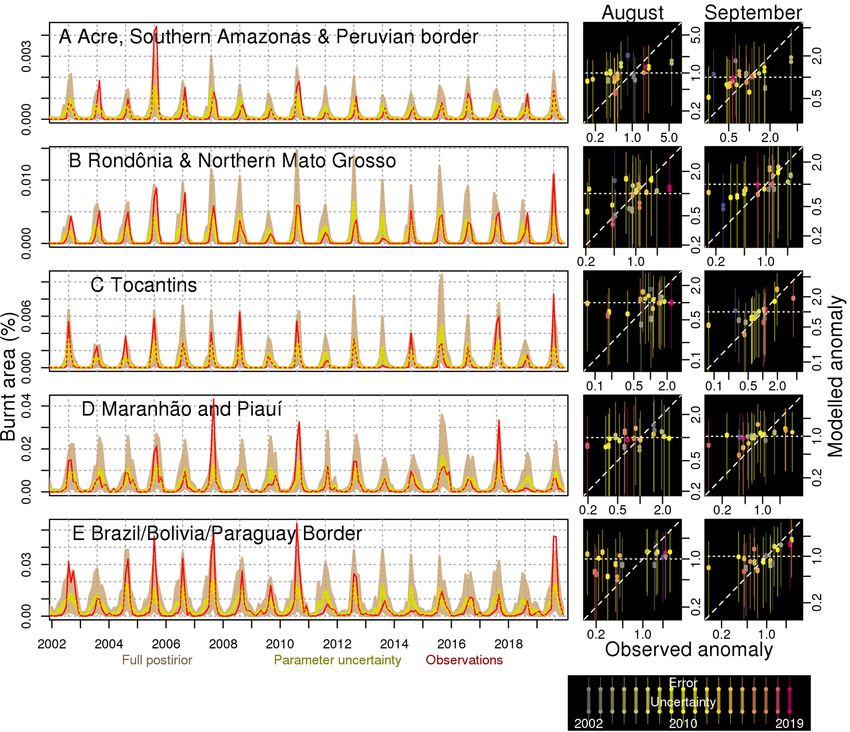
D. I. Kelley et al.: Technical note: Low meteorological influence found in 2019 Amazonia fires                                         791

Table 1. Observed and model anomaly in burnt area for August and September 2019 as a fraction of August and September averages
2002–2019 across selected regions (see methods). Red indicates more burning than normal, blue less and yellow around average burning.
The model is expressed as 5 %–95 % of the posterior accounting for parameter uncertainty. The first column under “likelihood” shows the
percentage likelihood that the observed burnt area is as suggested by the model; the second column gives the associated p value. The third
column gives the percentage likelihood that the model suggests a higher than average burnt area for the given month, and the fourth column
shows the percentage likelihood that the model captures the observed anomaly based on the full model posterior.

                                                                                                                    R BA
  2. The likelihood that the burnt area would have been                      where         P (BA/2|βi ∩ βj ) =       0     P (BA − x|βj ) ·
     higher than the annual average, i.e. the fraction of the                P (BA|βi )dx and
     model’s full posterior being greater than the model’s an-
     nual average climatological posterior (the point where                                          ZBA
     the vertical lines cross 1 in the right-hand columns in                 P (BA/3|βi ∩ βj ∩ βk ) = P (BA − x|βk )
     Figs. 1 and 2): a climatological burnt area “clim” for a                                              0
     given month, m, in the year (i.e. January, February, etc.)                                       · P (x/2|βi ∩ βj )dx .            (8)
     can be calculated from the convolution of each year’s
     posterior solutions, βyr,m . Note that it is the model in-              The probability of an anomaly A in a given year, yr, for
     puts, incorporated in βm , and not the model parameters                 month m, is, therefore
     that vary with time:
                                                                                                     Z1
    P (BA|climm ) = P BA|β2001,m ∩ β2002,m . . . ∩ β2019,m ,                 P (A|βyr,m ∩ climm ) =        P (A · BA|βyr,m )
                                                                                                      0
                                                                                                   · P (BA|clim)dBA          .          (9)

https://doi.org/10.5194/bg-18-787-2021                                                            Biogeosciences, 18, 787–804, 2021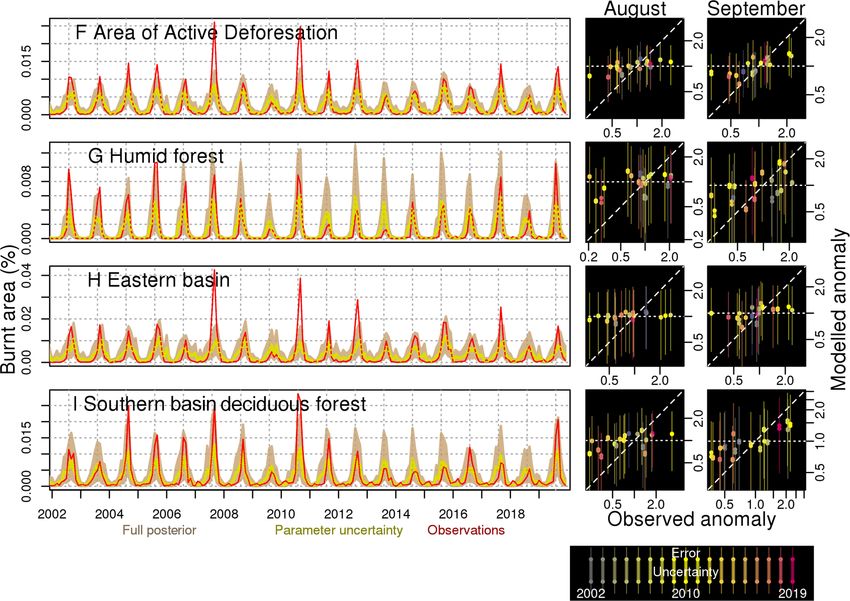
792                          D. I. Kelley et al.: Technical note: Low meteorological influence found in 2019 Amazonia fires

       The likelihood of a year having a higher anomalous A        2016). The model reproduced the spatial pattern of this in-
       is the sum of probabilities of < A:                         creased burning in 2005 and 2010 (Figs. C1 and C2 in
                                                                   Appendix C). In our different regions, observed levels of
                               ZA                                  burning fall within our model’s posterior (Figs. B1 and B2
       L(A|βyr,m ∩ climm ) =        P (A|βyr,m ∩ climm )dA. (10)   in Appendix B), although they are at the higher end, with
                               0                                   a high value of expectation (height of the posterior curve
                                                                   in Figs. B1 and B2) and high p value (blue shaded area,
       And the likelihood of the year an average burnt area is     Figs. B1 and B2). This, along with the model’s high Spear-
       given by L(1|βyr,m ∩ climm ).                               man’s rank performance (Figs. S1 and S2) suggests that the
                                                                   model is able to capture the interannual variations driven
    3. The likelihood of the observed anomalous year occur-        by meteorological conditions. Deforestation rates in 2004/05
       ring is given by                                            were high (Marengo et al., 2018), and an increase in fire ac-
                                                                 tivity in 2007 has also been linked to deforestation across
           ym,yr                                                   the Amazon (Morton et al., 2008). Additionally, in the early
       L         /|βyr,m ∩ climm ,                     (11)
             ym                                                    part of our observational record, much of the region has
                                                                   been shown to be less coupled to meteorological drivers and
       where ym,yr is the burnt area for the month, m, and year,
                                                                   more heavily influenced by human fire and land management
       yr, in question and ym is the climatological average of
                                                                   (Aragão et al., 2018). This is reflected by the improved per-
       that month
                                                                   formance of the model, which depends solely on changing
                                                                   population density and land use cover and not on changes in
3     Results                                                      landscape management, during this later period in the AAD
                                                                   (Fig. 2F, 2011 onwards), particularly in areas dominated by
3.1    Burnt area from 2001–2018                                   agriculture (Fig. 2H).
                                                                      On the whole, the framework’s posterior is better able
The highest historic burnt areas are found in the Savanna re-      to encompass extremes in observations in humid regions
gions of tropical South America (Fig. 3), though some burn-        (Fig. 2G vs. H and I), particularly across the Brazilian arc
ing still occurs in forested areas, particularly in areas which    of deforestation (Fig. 1A–C vs. D and E). Overall, 19 out
have experienced an increase in agriculture and decrease in        of 204 months up to 2018 for the AAD (∼ 9 %) fall out-
tree cover since 2002 (Fig. S4). The model reproduces this         side the 90 % confidence interval (tan in Fig. 2F), suggesting
spatial pattern, and the model’s full posterior encompasses        that the frameworks posterior accurately describes the occur-
the full range of burnt areas (Fig. 3, and benchmarking in         rence of more extreme months for the region as a whole. That
the Supplement). Burnt area starts to increase in May and          only 13 months out of (204 months × 5 regions) 1020 months
dies out in October throughout most of the area of active de-      (∼ 1 %) fall outside the posterior for smaller regions (Fig. 1)
forestation, although it can start as late as July in more hu-     suggests that the posterior is wider than expected. Our as-
mid areas and can continue through to December in drier Sa-        sessments of mismatch between observations and model for
vanna (Fig. S3). The bulk of the burnt area occurs in August       these regions will, therefore, likely be conservative, partic-
and September. September typically sees the highest burnt          ularly for humid regions B and C, with no months prior to
area in central Brazil, whereas fire peaks in August around        2019 falling outside the 90 % confidence interval.
Bolivia and Paraguay (Figs. 1E and S3). Our model repro-
duces this seasonal pattern in burning across all regions (see     3.2   Burnt area in 2019 in context
benchmarking in the Supplement), including onset and peak
(Fig. S3). As our model maintains constant human ignitions         The year 2019 burnt area during the early fire season (de-
and suppression throughout the year, this suggests that the        fined as June to August) was higher than the 2002–2019 av-
seasonal pattern can be largely reproduced from meteorolog-        erage in areas of recent historical deforestation, despite a
ical variations, although a slight increase in uncertainty in      lower than average burnt area over much of the rest of the
early fire season burning could point to increased human ig-       continent (Fig. 3). The AAD as a whole saw the third high-
nitions not captured in the model (Fig. S3).                       est levels of burning in the fire season (Fig. 2F, August), be-
   Unusually high levels of burning occurred in 2004 in the        hind 2007 and 2010. Overall, 11 % of the AAD, particularly
Bolivian–Paraguayan dry forest (red line in Fig. 1E), in 2005      around the central region of Brazil’s arc of deforestation, ex-
in the eastern arc of deforestation (Fig. 1A) and Paraguay         perienced more burning in August than in any previous year
dry forest (Fig. 1E), in 2007 in monsoonal coastal forests         since our observation record started in 2002 (Fig. 1B and C).
(Fig. 1D), and in 2010 in Bolivia and Paraguay dry forests         Despite burnt area returning to normal levels in September
(Fig. 1D and E). The 2005 and 2010 burnings have pre-              across most of the AAD (Fig. 4), burning remained high in
viously been associated with droughts driven by a tropical         humid forest areas (Fig. 2G). Burning also remained higher
North Atlantic warming anomaly (Marengo and Espinoza,              than average along the border between Brazil, Bolivia and

Biogeosciences, 18, 787–804, 2021                                                      https://doi.org/10.5194/bg-18-787-2021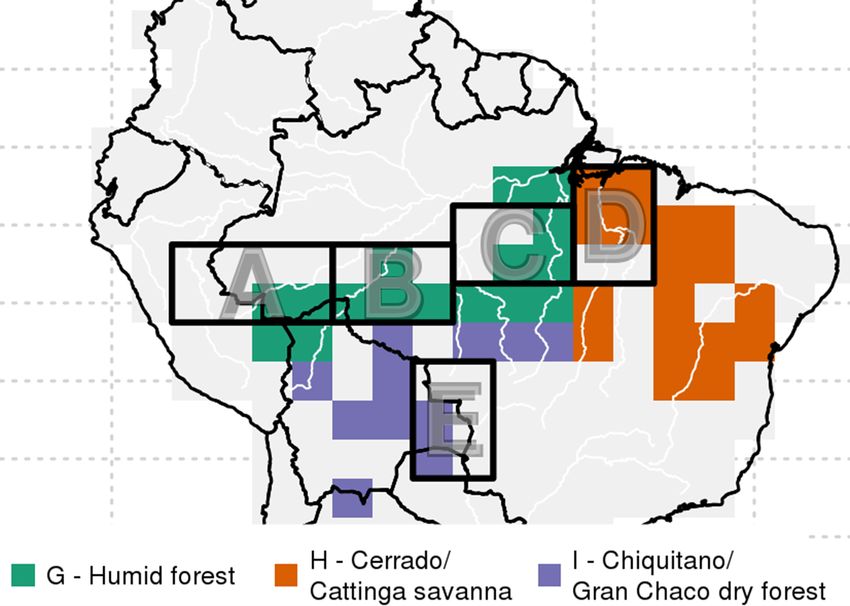
D. I. Kelley et al.: Technical note: Low meteorological influence found in 2019 Amazonia fires                                       793

Figure 1. Time series and fire season anomalies for modelled and observed burnt area. See Fig. A2 for locations of A–E. Red lines show
monthly burnt area observations from MCD64A1, yellow shows model accounting for parameter uncertainty (10 %–90 %) and brown shows
full model uncertainty (10 %–90 %). The red line is dashed when observations and model accounting for parameter uncertainty overlap.
Vertical grid lines are positioned for August each year. Right-hand plots show observed (x axis) and modelled (y axis) anomaly, calculated
as 2019 burnt area over 2002–2019 climatological average burnt area for (first column) August and (second column) September. The colour
indicates the year, with 2019 in red. Thin lines show 10 %–90 % full model uncertainty, while dots and thick line indicate 10 %–90 %
parameter uncertainty

Paraguay (Figs. 1E, 2I and 4). This meant that, while the              converted agricultural land near the Brazilian coast (Fig. S4).
burnt area was higher than usual in 2019, it was not excep-            Only 0 %–2 % of the area of the AAD showed unprecedented
tionally higher over the entire fire season (June–September)           high burning in the model, compared to the 11 % in observa-
for the entire AAD, though individual regions still stand out          tions. Observed burnt area in August falls outside the full
as having much higher burning than in any previous year,               model’s posterior (at 90 % confidence interval) for the AAD
particularly in Brazil’s central states (Fig. 1B and C).               (Fig. 2F), with only a 9 % likelihood of being explained by
                                                                       the model (Table 1). This is particularly prominent in more
3.3   Climatic conditions in 2019                                      humid areas, with a 10 % likelihood in humid forests (Fig. 2G
                                                                       and Table 1, G) – tied as lowest likelihood in the observa-
The model shows with high confidence that most of eastern              tional record with September 2005, compared to 17 % like-
Amazonia should have, in fact, experienced less fire than nor-         lihood in seasonally dry forests regions (Fig. 2I) and 17 %
mal for June–August when accounting for 2019 meteorolog-               the driest, savanna areas (Fig. 2H) where observations tend
ical conditions. This expected low fire rate included areas in         to fall outside the model posterior more often (see Sect. 3.1).
the Brazilian humid-forest–agricultural interface in the AAD           Regions B, C in central Brazil, and E on the Brazil, Bolivia
that saw higher than annual average burning in observations            and Paraguay border are even less likely to be explained by
(Figs. 1C and 3). The western Amazon shows an increase in              the model (7 % for B, 6 % for C and 8 % for E; Table 1),
fire compared to the annual average (Fig. 3). The observed             despite all previous months falling within the full model’s
burnt area, however, still exceeds the model in all our re-            posterior confidence range in these regions, except for Au-
gions in 2019 (Fig. 1) except region D in the already heavily          gust and September in the 2005 in region A, although it is

https://doi.org/10.5194/bg-18-787-2021                                                            Biogeosciences, 18, 787–804, 2021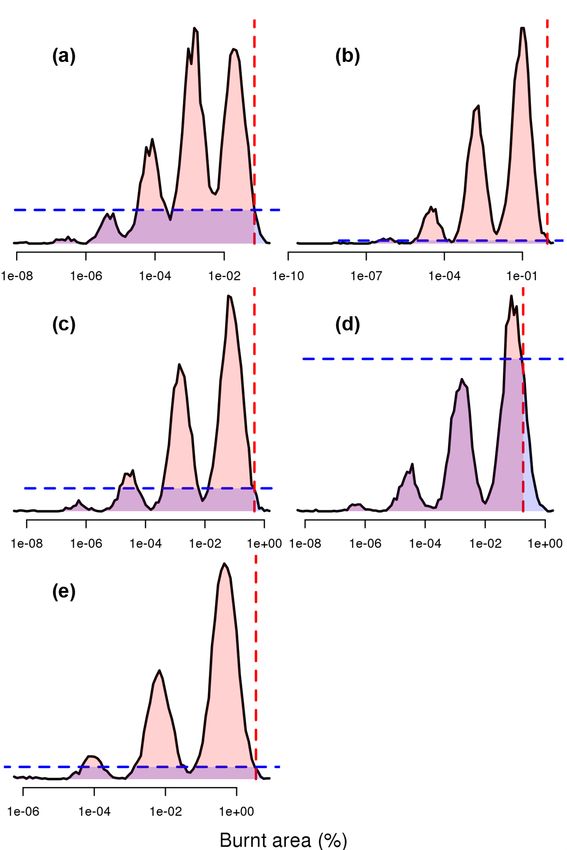
794                           D. I. Kelley et al.: Technical note: Low meteorological influence found in 2019 Amazonia fires

Figure 2. As Fig. 1, but for the area of active deforestation region, which incorporates areas where there has been a significant increase in
agriculture and decrease in tree cover. See Fig. S4 and regions and increased agriculture and decreased tree cover in the (G) humid tropical
forest, (H) savanna and (I) dry–deciduous forest.

Figure 3. Maps of modelled and observed percentage of burnt area. First row: observed burnt area, for June–August 2002–2019 annual
average (left) and difference between June–August 2019 and 2002–2019 average (centre) and the number of years which the 2019 burnt area
exceeds (right). Second and third row: as top row, for the model posterior’s 5 % and 95 % percentiles.

Biogeosciences, 18, 787–804, 2021                                                             https://doi.org/10.5194/bg-18-787-2021
D. I. Kelley et al.: Technical note: Low meteorological influence found in 2019 Amazonia fires                               795

Figure 4. Same as Fig. 3 but for September.

more likely that burnt area regions A and D at either end of     the 5 % observed reduction in drier savanna regions in H
Brazil’s arc of deforestation could be explained by the model    seems to be in line with the model (at 67 % likelihood).
(18 % and 20 %, respectively).                                      By September, there was less disparity between observa-
   The observed anomaly for August 2019 is higher than the       tions and models. In regions B and C, for example, observa-
model across all regions except D. This is particularly promi-   tions had a 14 % and 26 % probability of being explained by
nent in regions B and C, where observations show that burnt      the model and a 66 % and 25 % likelihood of the anomalous
area was 196 % and 138 % greater than the August average         year as seen in the observations. Across the AAD, the more
(Table 1), whereas the model suggests that meteorological        modest 16 % increase in the observations had a likelihood of
conditions alone should have resulted in a fire season with      40 %.
a 16 %–22 % increase (based on 5 %–95 % parameter uncer-
tainty range for parameter uncertainty) in burnt area in B and
2 % reduction to 4 % increase for C compared to the August       4   Discussion
average, with only a 57 % and 53 % chance of a greater burnt
area than the average for B and C, respectively. The likely      The observed spatial pattern of burnt area in June–August
occurrence of the observed anomaly was 7 % and 10 % for B        2019 shows that unprecedented burning was only seen in
and C, respectively (Table 1) – much greater than any previ-     Brazilian regions normally associated with deforestation.
ous year (Fig. 1B and C, August column).                         Our modelling framework demonstrates that, based on me-
   The higher observed anomaly vs. the model extends over        teorological conditions alone, reduced burning seen across
much of the AAD (Fig. 2, August column, red points). The         the rest of tropical South America should have extended into
model suggests a 4 %–6 % reduction for the AAD, with a           these regions. Specifically, our analysis suggests that there is
49 % probability of greater than the annual average burnt        only a 9 % probability that the levels of burning in the early
area (Table 1). By comparison, the observed burnt area was       fire season would have been caused by 2019 meteorological
45 % greater than the annual average, with a 20 % likelihood.    conditions or natural ignitions alone (time series in Figs. 1
Again, the observed anomaly seems to be least likely in more     and 2). Eastern areas normally associated with deforesta-
humid regions. For our humid area, G, the model suggests a       tion did show expected levels of burning, but in the western
small (10 %–14 %) increase in burnt area, with only a 12 %       and central parts of the arc of deforestation and Bolivia and
probability of a 107 % increase seen in observations, whereas    Paraguay dry forests, burning was much higher. Here there
                                                                 is a 6 %–8 % of such high levels of burning compared to the

https://doi.org/10.5194/bg-18-787-2021                                                     Biogeosciences, 18, 787–804, 2021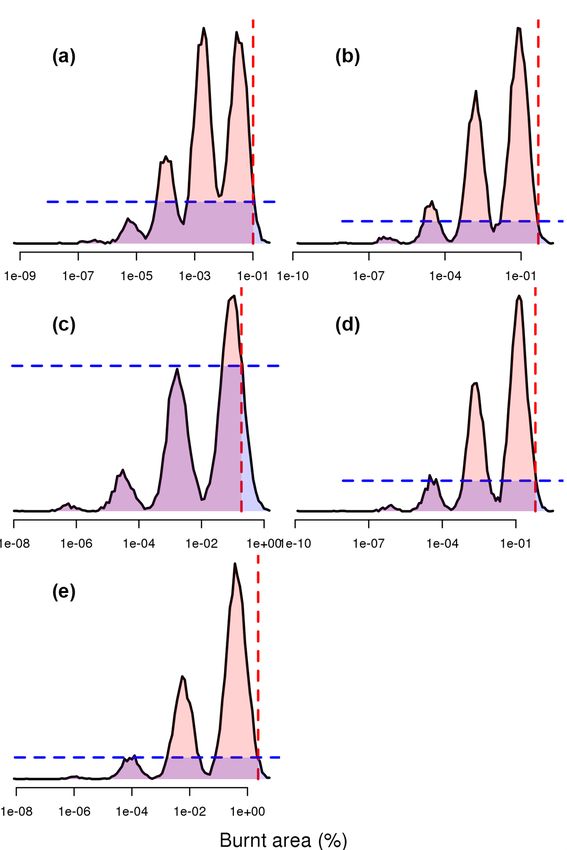
796                          D. I. Kelley et al.: Technical note: Low meteorological influence found in 2019 Amazonia fires

background rate (Fig. 1, August column), with areas where            5   Conclusions
agriculture meets more humid forest seeing the most unusual
levels of burning. As our model’s posterior reflects the levels      In this study, we have used a novel Bayesian modelling ap-
of burning in previous dry years, we can eliminate drier con-        proach, which tests the likelihood of observed extremes in
ditions as a possible driver of increased 2019 fires. We also        fire against inferred historical relationships by tracking un-
account for, and therefore eliminate, longer-term drier con-         certainties in modelling fire in the land surface. Our frame-
ditions through deep soil moisture as a possible driver. The         work provides a rapid assessment of whether there was any
cause of increased burning in 2019 is therefore either a driver      influence of meteorological conditions across the Amazon
left static in the model for 2019 or a process not considered.       that exacerbated fire levels in 2019.
Because of the non-availability of near-real-time data, drivers         The model predicts a lower burnt area than we see in the
held unchanged at 2018 values for 2019 are tree cover, land          observations for Amazonia during June–August 2019, in-
use and human population. The only plausible way tree cover          dicating that from observed meteorological data alone, we
could have substantially changed is through increased de-            would not expect 2019 to be a high-fire year. This result
forestation rates (Zhang et al., 2015). Thereby changes in           points to socio-economic factors having a strong role in the
drivers not accounted for in 2019 would only have caused             high recorded fire activity. Specifically, we conclude that it
increased burning through direct human manipulation of the           is likely (> 90 % probability) based on past relationships
landscape rather than the particular meteorological features         between burnt area and meteorological conditions that the
of that year.                                                        weather conditions did not trigger the increase in burning in
   Improved descriptions of evolving changes in human fire           Amazonia during the early fire season in 2019. This result
and landscape interactions over time may also be required            holds over the entire area of active deforestation and further-
to capture direct human-driven changes in burnt area. This           more is likely (93 %) in central Amazonia.
is likely to include changes in demography or human be-
haviour. For example, we currently account for the impact
of a changing population on fire starts and suppression but
not for how fire ignitions per person change over time. An
evolving policy could have also been the cause of the unusual
fire activity. It should also be noted that observed fire activity
returned to expected levels given meteorological conditions
in September over most of the deforestation region (Figs. 1
and 4). This reduction could be after the June–August fires
received international media coverage, triggering efforts in
combating fires from South American governments (BBC
news, 2019; NASA, 2019).

Biogeosciences, 18, 787–804, 2021                                                        https://doi.org/10.5194/bg-18-787-2021
D. I. Kelley et al.: Technical note: Low meteorological influence found in 2019 Amazonia fires                                        797

Appendix A

Figure A1. Distribution of burnt areas in MODIS Collection 6 MCD64A1 burnt area product (Giglio et al., 2018) and (red line) fitted normal
distribution of logit transformed burnt areas greater than 0.

Figure A2. Study regions. Boxes mark areas used for time series in Fig. 1 and rows A–E in Table 1. Coloured areas for time series if Fig. 2
and F–I in Table 1, with the entire coloured region being used for F AAD. See Fig. S4 for construction of AAD and areas G–I.

https://doi.org/10.5194/bg-18-787-2021                                                             Biogeosciences, 18, 787–804, 2021
798 D. I. Kelley et al.: Technical note: Low meteorological influence found in 2019 Amazonia fires
Appendix B
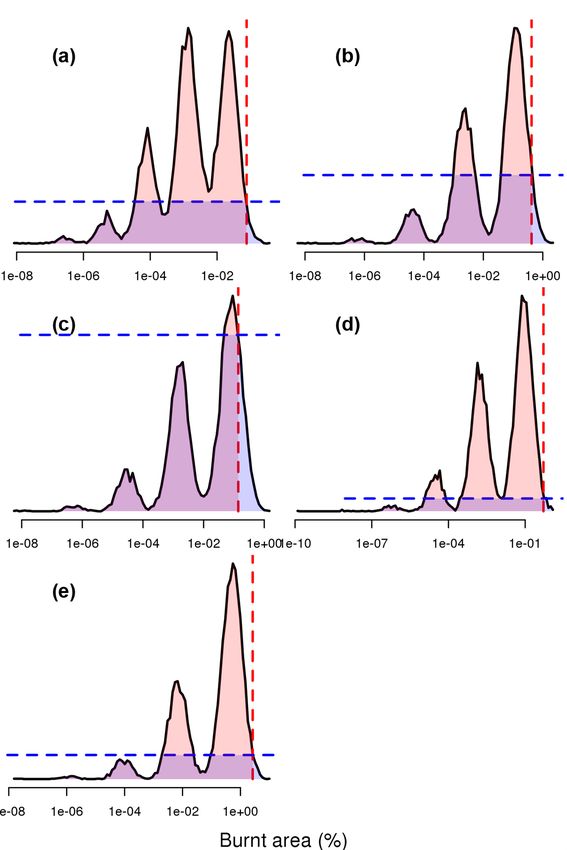
Figure B2. As Fig. B1 but for August 2010.
Figure B1. Full model posterior solution (black line) for August
2005 across each of the sub-regions compared to MODIS Collection
6 MCD64A1 burnt area product (Giglio et al., 2018) (red dashed
line). Red shaded area (posterior solution smaller than observed)
shows the likelihood high burnt areas were influenced by factors
external to the modelling framework. Blue shaded area is the area of
the posterior which has less chance of occurrence than the observed
burnt area (given by blue dashed line).
Biogeosciences, 18, 787–804, 2021 https://doi.org/10.5194/bg-18-787-2021D. I. Kelley et al.: Technical note: Low meteorological influence found in 2019 Amazonia fires 799 Figure B3. As Fig. B1 but for August 2019. https://doi.org/10.5194/bg-18-787-2021 Biogeosciences, 18, 787–804, 2021
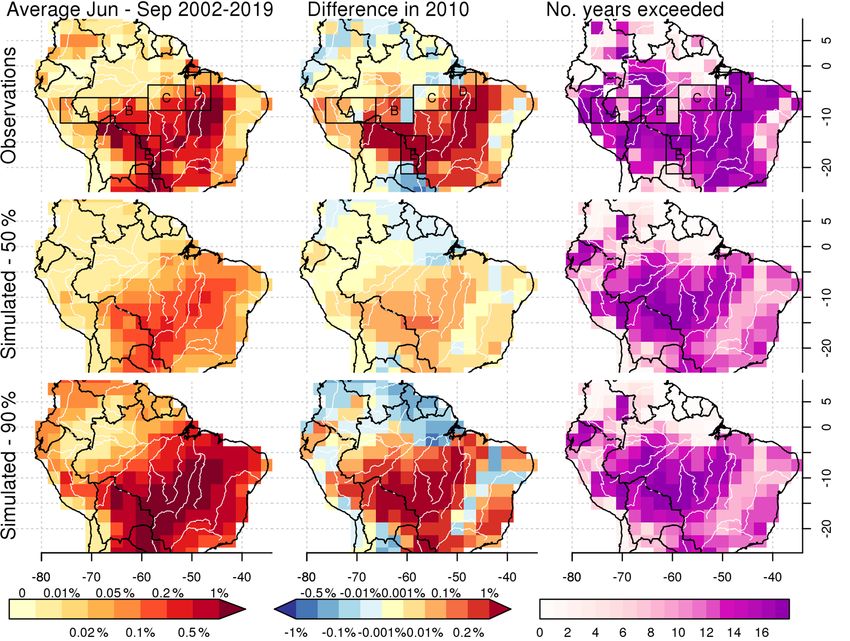
800                         D. I. Kelley et al.: Technical note: Low meteorological influence found in 2019 Amazonia fires

Appendix C

Figure C1. Same as Fig. 3 but for June–September annual average compared to 2005.

Figure C2. Same as Fig. C1 but for 2010.

Biogeosciences, 18, 787–804, 2021                                                   https://doi.org/10.5194/bg-18-787-2021
D. I. Kelley et al.: Technical note: Low meteorological influence found in 2019 Amazonia fires                                            801

Code and data availability. The model code and Bayesian infer-           Andela, N., Morton, D. C., Giglio, L., Chen, Y., van der Werf, G.
ence framework used to support the findings of this study are               R., Kasibhatla, P. S., DeFries, R. S., Collatz, G. J., Hantson, S.,
archived at https://doi.org/10.5281/zenodo.4298760 (Kelley et al.,          Kloster, S., Bachelet, D., Forrest, M., Lasslop, G., Li, F., Man-
2020a). Model output is archived at https://doi.org/10.5281/zenodo.         geon, S., Melton, J. R., Yue, C., and Randerson, J. T.: A human-
4298902 (Kelley et al., 2020b). Driving data availability is listed in      driven decline in global burned area, Science, 356, 1356–1362,
Table S1.                                                                   2017.
                                                                         Anon: 2020 Incident Archive, CAL FIRE, available at: https://www.
                                                                            fire.ca.gov/incidents/2020/ (last access: 10 April 2019), 2020.
Supplement. The supplement related to this article is available on-      Aragão, L. E. O. C., Anderson, L. O., Fonseca, M. G., Rosan, T.
line at: https://doi.org/10.5194/bg-18-787-2021-supplement.                 M., Vedovato, L. B., Wagner, F. H., Silva, C. V. J., Silva Ju-
                                                                            nior, C. H. L., Arai, E., Aguiar, A. P., Barlow, J., Berenguer, E.,
                                                                            Deeter, M. N., Domingues, L. G., Gatti, L., Gloor, M., Malhi,
Author contributions. DIK, CB, MAJB and CH developed the                    Y., Marengo, J. A., Miller, J. B., Phillips, O. L., and Saatchi,
modelling framework; DIK, RW designed the Bayesian inference                S.: 21st Century drought-related fires counteract the decline of
framework; DIK, MAJB and ND collated and regridded input data.              Amazon deforestation carbon emissions, Nat. Commun., 9, 536,
DIK, CB, CH performed the analysis. CB wrote the first draft of the         https://doi.org/10.1038/s41467-017-02771-y, 2018.
paper with input from DIK, CH and ND. All authors contributed to         Arruda, D., Candido, H. G., and Fonseca, R.: Amazon
the final paper.                                                            fires threaten Brazil’s agribusiness, Science, 365, 1387,
                                                                            https://doi.org/10.1126/science.aaz2198, 2019.
                                                                         BBC news: Amazon fires: Brazil bans land clearance blazes for
                                                                            60 days, BBC news, available at: https://www.bbc.co.uk/news/
Competing interests. The authors declare that they have no conflict
                                                                            world-latin-america-49507405 (last access: 3 November 2020),
of interest.
                                                                            2019.
                                                                         Bivand, R., Keitt, T., and Rowlingson, B.: rgdal: Bindings for the
                                                                            Geospatial Data Abstraction Library, available at: http://CRAN.
Acknowledgements. GPCP precipitation and NCEP reanalysis data               R-project.org/package=rgdal, last access: 10 November 2016.
were provided by the NOAA/OAR/ESRL PSD, Boulder, Colorado,               Boer, M. M., de Dios, V. R., and Bradstock, R. A.: Unprecedented
USA, from their website at https://www.esrl.noaa.gov/psd/ (last ac-         burn area of Australian mega forest fires, Nat. Clim. Change, 10,
cess: 20 January 2020).                                                     171–172, 2020.
                                                                         Brando, P. M., Balch, J. K., and Nepstad, D. C.: Abrupt
                                                                            increases in Amazonian tree mortality due to drought–fire
Financial support. The contribution by Douglas I. Kelley and                interactions, P. Natl. Acad. Sci. USA, 111, 6347–6352,
Megan A. J. Brown was supported by the UK Natural Environment               https://doi.org/10.1073/pnas.1305499111, 2014.
Research Council through The UK Earth System Modelling Project           Burton, C., Betts, R. A., and Jones, C. D.: Will fire danger be
(UKESM, grant no. NE/N017951/1). Chris Huntingford was sup-                 reduced by using Solar Radiation Management to limit global
ported by the NERC CEH National Capability Fund. Ning Dong                  warming to 1.5 ◦ C compared to 2.0 ◦ C?, Geophys. Res. Lett., 45,
is supported by the Australia Research Council (DP170103410)                3644–3652, https://doi.org/10.1002/2018GL077848, 2018.
and Macquarie university research seeding grant to Melanie Zep-          Butler, R.: Calculating deforestation figures for the Amazon, Rio de
pel. Megan A. J. Brown was additionally supported by the Sci-               Janeiro, available at: https://rainforests.mongabay.com/amazon/
ence and Technology Facilities Council (grant no. ST/P006760/1)             deforestation_calculations.html (last access: 29 February 2020),
through the DISCnet Centre for Doctoral Training.                           2017.
                                                                         Cochrane, M. A. and Schulze, M. D.: Fire as a Recurrent Event in
                                                                            Tropical Forests of the Eastern Amazon: Effects on Forest Struc-
Review statement. This paper was edited by Sönke Zaehle and re-             ture, Biomass, and Species Composition1, Biotropica, 31, 2–16,
viewed by Sönke Zaehle and one anonymous referee.                           1999.
                                                                         De Groot, W. J., Goldammer, J. G., Justice, C. O., and Lynham, T.
                                                                            J.: Implementing a global early warning system for wildland fire,
                                                                            in: Proc. Virchow. Pirquet. Med. Soc., University of Coimbra,
                                                                            Coimbra, Portugal, 15–18, 2010.
References                                                               de Groot, W. J., Wotton, B. M., and Flannigan, M. D.: Chapter 11 –
                                                                            Wildland Fire Danger Rating and Early Warning Systems, in:
Adler, R. F., Huffman, G. J., Chang, A., Ferraro, R., Xie, P.-P.,           Wildfire Hazards, Risks and Disasters, edited by: Shroder, J. F.
  Janowiak, J., Rudolf, B., Schneider, U., Curtis, S., Bolvin, D.,          and Paton, D., Elsevier, Oxford, 207–228, 2015.
  Gruber, A., Susskind, J., Arkin, P., and Nelkin, E.: The Version-2     de Oliveira Andrade, R.: Alarming surge in Amazon fires
  Global Precipitation Climatology Project (GPCP) Monthly Pre-              prompts global outcry, Nature, https://doi.org/10.1038/d41586-
  cipitation Analysis (1979–Present), J. Hydrometeorol., 4, 1147–           019-02537-0, 2019.
  1167, 2003.                                                            Dimiceli, C., Carroll, M., Sohlberg, R., Kim, D. H., Kelly,
Aldersley, A., Murray, S. J., and Cornell, S. E.: Global and regional       M., and Townshend, J. R. G.: MOD44B MODIS/Terra
  analysis of climate and human drivers of wildfire, Sci. Total En-         Vegetation Continuous Fields Yearly L3 Global 250 m
  viron., 409, 3472–3481, 2011.

https://doi.org/10.5194/bg-18-787-2021                                                               Biogeosciences, 18, 787–804, 2021
802 D. I. Kelley et al.: Technical note: Low meteorological influence found in 2019 Amazonia fires SIN Grid V006, NASA EOSDIS Land Processes DAAC, Werf, G. R., Voulgarakis, A., and Yue, C.: The status and chal- https://doi.org/10.5067/MODIS/MOD44B.006, 2015. lenge of global fire modelling, Biogeosciences, 13, 3359–3375, Escobar, H.: Amazon fires clearly linked to de- https://doi.org/10.5194/bg-13-3359-2016, 2016. forestation, scientists say, Science, 365, 853, Hantson, S., Kelley, D. I., Arneth, A., Harrison, S. P., Archibald, S., https://doi.org/10.1126/science.365.6456.853, 2019. Bachelet, D., Forrest, M., Hickler, T., Lasslop, G., Li, F., Man- Fisher, R. A. and Koven, C. D.: Perspectives on the future of Land geon, S., Melton, J. R., Nieradzik, L., Rabin, S. S., Prentice, I. Surface Models and the challenges of representing complex ter- C., Sheehan, T., Sitch, S., Teckentrup, L., Voulgarakis, A., and restrial systems, J. Adv. Model. Earth Sy., 12, e2018MS001453, Yue, C.: Quantitative assessment of fire and vegetation properties https://doi.org/10.1029/2018MS001453, 2020. in simulations with fire-enabled vegetation models from the Fire Fonseca, M. G., Alves, L. M., Aguiar, A. P. D., Arai, E., Ander- Model Intercomparison Project, Geosci. Model Dev., 13, 3299– son, L. O., Rosan, T. M., Shimabukuro, Y. E., and Aragão, L. 3318, https://doi.org/10.5194/gmd-13-3299-2020, 2020. E. O. C.: Effects of climate and land-use change scenarios on Hijmans, R. J. and van Etten, J.: raster: Geographic data analy- fire probability during the 21st century in the Brazilian Amazon, sis and modeling, R package version, available at: http://CRAN. Glob. Change Biol., 25, 2931–2946, 2019. R-project.org/package=raster (last access: 15 March 2018), Forkel, M., Carvalhais, N., Verbesselt, J., Mahecha, M. D., Neigh, 2014. C., and Reichstein, M.: Trend Change Detection in NDVI Time INPE: INPE Fire Count Data, available at: http://queimadas.dgi. Series: Effects of Inter-Annual Variability and Methodology, Re- inpe.br/queimadas/portal-static/estatisticas_paises/, last access: mote Sensing, 5, 2113–2144, 2013. 29 February 2019. Forkel, M., Migliavacca, M., Thonicke, K., Reichstein, M., Jolly, W. M., Cochrane, M. A., Freeborn, P. H., Holden, Schaphoff, S., Weber, U., and Carvalhais, N.: Co-dominant wa- Z. A., Brown, T. J., Williamson, G. J., and Bowman, ter control on global inter-annual variability and trends in land D. M. J. S.: Climate-induced variations in global wild- surface phenology and greenness, Glob. Change Biol., 21, 3414– fire danger from 1979 to 2013, Nat. Commun., 6, 7537, 3435, 2015. https://doi.org/10.1038/ncomms8537, 2015. Forkel, M., Dorigo, W., Lasslop, G., Teubner, I., Chuvieco, E., Jones, M. W., Smith, A., Betts, R., Canadell, J. G., Prentice, I. C., and Thonicke, K.: A data-driven approach to identify con- and Le Queìreì, C.: Climate change increases the risk of wild- trols on global fire activity from satellite and climate obser- fires, ScienceBrief Review, available at: https://ueaeprints.uea.ac. vations (SOFIA V1), Geosci. Model Dev., 10, 4443–4476, uk/id/eprint/77982/, last access: 29 February 2020. https://doi.org/10.5194/gmd-10-4443-2017, 2017. Kalnay, E., Kanamitsu, M., Kistler, R., Collins, W., Deaven, D., Friedlingstein, P., Jones, M. W., O’Sullivan, M., Andrew, R. M., Gandin, L., Iredell, M., Saha, S., White, G., Woollen, J., Zhu, Hauck, J., Peters, G. P., Peters, W., Pongratz, J., Sitch, S., Le Y., Chelliah, M., Ebisuzaki, W., Higgins, W., Janowiak, J., Mo, Quéré, C., Bakker, D. C. E., Canadell, J. G., Ciais, P., Jack- K. C., Ropelewski, C., Wang, J., Leetmaa, A., Reynolds, R., son, R. B., Anthoni, P., Barbero, L., Bastos, A., Bastrikov, V., Jenne, R., and Joseph, D.: The NCEP/NCAR 40-Year Reanalysis Becker, M., Bopp, L., Buitenhuis, E., Chandra, N., Chevallier, Project, B. Am. Meteorol. Soc., 77, 437–472, 1996. F., Chini, L. P., Currie, K. I., Feely, R. A., Gehlen, M., Gilfillan, Kelley, D. I.: Modelling Australian fire regimes, PhD thesis, Mac- D., Gkritzalis, T., Goll, D. S., Gruber, N., Gutekunst, S., Har- quarie, University, Ryde, NSW, Australia, 2014. ris, I., Haverd, V., Houghton, R. A., Hurtt, G., Ilyina, T., Jain, Kelley, D. I. and Harrison, S. P.: Enhanced Australian car- A. K., Joetzjer, E., Kaplan, J. O., Kato, E., Klein Goldewijk, K., bon sink despite increased wildfire during the 21st century, Korsbakken, J. I., Landschützer, P., Lauvset, S. K., Lefèvre, N., Environ. Res. Lett., 9, 104015, https://doi.org/10.1088/1748- Lenton, A., Lienert, S., Lombardozzi, D., Marland, G., McGuire, 9326/9/10/104015, 2014. P. C., Melton, J. R., Metzl, N., Munro, D. R., Nabel, J. E. M. S., Kelley, D. I., Prentice, I. C., Harrison, S. P., Wang, H., Simard, M., Nakaoka, S.-I., Neill, C., Omar, A. M., Ono, T., Peregon, A., Fisher, J. B., and Willis, K. O.: A comprehensive benchmarking Pierrot, D., Poulter, B., Rehder, G., Resplandy, L., Robertson, E., system for evaluating global vegetation models, Biogeosciences, Rödenbeck, C., Séférian, R., Schwinger, J., Smith, N., Tans, P. P., 10, 3313–3340, https://doi.org/10.5194/bg-10-3313-2013, 2013. Tian, H., Tilbrook, B., Tubiello, F. N., van der Werf, G. R., Wilt- Kelley, D. I., Harrison, S. P., and Prentice, I. C.: Improved simula- shire, A. J., and Zaehle, S.: Global Carbon Budget 2019, Earth tion of fire–vegetation interactions in the Land surface Processes Syst. Sci. Data, 11, 1783–1838, https://doi.org/10.5194/essd-11- and eXchanges dynamic global vegetation model (LPX-Mv1), 1783-2019, 2019. Geosci. Model Dev., 7, 2411–2433, https://doi.org/10.5194/gmd- GDAL/OGR contributors: GDAL/OGR Geospatial Data Abstrac- 7-2411-2014, 2014. tion software Library, Open Source Geospatial Foundation, Ver- Kelley, D. I., Bistinas, I., Whitley, R., Burton, C., Marthews, T. R., sion 3.2, available at: http://gdal.org (last access: March 2020), and Dong, N.: How contemporary bioclimatic and human con- 2018. trols change global fire regimes, Nat. Clim. Change, 9, 690–696, Giglio, L., Boschetti, L., Roy, D. P., Humber, M. L., and Justice, 2019. C. O.: The Collection 6 MODIS burned area mapping algorithm Kelley, D. I., Whitley, R., Brown, M. A. J., and Bur- and product, Remote Sens. Environ., 217, 72–85, 2018. ton, C.: Scripts used in the submission of “Low Cli- Hantson, S., Arneth, A., Harrison, S. P., Kelley, D. I., Prentice, I. C., matic Influence found in 2019 Amazonia Fires”, Zenodo, Rabin, S. S., Archibald, S., Mouillot, F., Arnold, S. R., Artaxo, https://doi.org/10.5281/zenodo.4298760, 2020a. P., Bachelet, D., Ciais, P., Forrest, M., Friedlingstein, P., Hickler, Kelley, D. I., Whitley, R., Burton, C., Brown, M. A. J., Huntingford, T., Kaplan, J. O., Kloster, S., Knorr, W., Lasslop, G., Li, F., Man- C., and Dong, N.: ConFire Model input/output for South Amer- geon, S., Melton, J. R., Meyn, A., Sitch, S., Spessa, A., van der ica, Zenodo, https://doi.org/10.5281/zenodo.4298902, 2020b. Biogeosciences, 18, 787–804, 2021 https://doi.org/10.5194/bg-18-787-2021
D. I. Kelley et al.: Technical note: Low meteorological influence found in 2019 Amazonia fires                                            803

Klein Goldewijk, K., Goldewijk, K. K., Beusen, A., Van Drecht,         Prentice, I. C., Harrison, S. P., and Bartlein, P. J.: Global vegetation
  G., and De Vos, M.: The HYDE 3.1 spatially explicit                     and terrestrial carbon cycle changes after the last ice age, New
  database of human-induced global land-use change over the past          Phytol., 189, 988–998, 2011a.
  12,000 years, Global Ecol. Biogeogr., 20, 73–86, 2010.               Prentice, I. C., Kelley, D. I., Foster, P. N., Friedlingstein, P., Har-
Krawchuk, M. A. and Moritz, M. A.: Burning issues: statistical            rison, S. P., and Bartlein, P. J.: Modeling fire and the terres-
  analyses of global fire data to inform assessments of environ-          trial carbon balance, Global Biogeochem. Cy., 25, GB3005,
  mental change, Environmetrics, 25, 472–481, 2014.                       https://doi.org/10.1029/2010gb003906, 2011b.
Lasslop, G., Brovkin, V., Reick, C. H., Bathiany, S., and Kloster,     Rabin, S. S., Melton, J. R., Lasslop, G., Bachelet, D., Forrest,
  S.: Multiple stable states of tree cover in a global land surface       M., Hantson, S., Kaplan, J. O., Li, F., Mangeon, S., Ward, D.
  model due to a fire-vegetation feedback, Geophys. Res. Lett., 43,       S., Yue, C., Arora, V. K., Hickler, T., Kloster, S., Knorr, W.,
  6324–6331, 2016.                                                        Nieradzik, L., Spessa, A., Folberth, G. A., Sheehan, T., Voul-
Lenihan, J. M., Daly, C., Bachelet, D., and Neilson, R. P.: Simu-         garakis, A., Kelley, D. I., Prentice, I. C., Sitch, S., Harrison,
  lating broad-scale fire severity in a dynamic global vegetation         S., and Arneth, A.: The Fire Modeling Intercomparison Project
  model, Northwest Sci., 72, 91–101, 1998.                                (FireMIP), phase 1: experimental and analytical protocols with
Lizundia-Loiola, J., Pettinari, M. L., and Chuvieco, E.: Tempo-           detailed model descriptions, Geosci. Model Dev., 10, 1175–
  ral Anomalies in Burned Area Trends: Satellite Estimations of           1197, https://doi.org/10.5194/gmd-10-1175-2017, 2017.
  the Amazonian 2019 Fire Crisis, Remote Sens.-Basel, 12, 151,         R Core Team: R: A Language and Environment for Statistical
  https://doi.org/10.3390/rs12010151, 2020.                               Computing, available at: http://www.R-project.org/, last access:
Lovejoy, T. E. and Nobre, C.: Amazon tipping point:                       16 April 2015.
  Last chance for action, Sci. Adv., 5, eaba2949,                      RFS: New South Wales Rural Fire Service, available at: https://
  https://doi.org/10.1126/sciadv.aba2949, 2019.                           www.rfs.nsw.gov.au/fire-information/fires-near-me, last access:
Marengo, J. A. and Espinoza, J. C.: Extreme seasonal droughts and         29 February 2019.
  floods in Amazonia: causes, trends and impacts: EXTREMES IN          Salvatier, J., Wiecki, T. V., and Fonnesbeck, C.: Probabilistic pro-
  AMAZONIA, Int. J. Climatol., 36, 1033–1050, 2016.                       gramming in Python using PyMC3, PeerJ. Comput. Sci., 2, e55,
Marengo, J. A., Souza, C. A., Thonicke, K., Burton, C., Hal-              https://doi.org/10.7717/peerj-cs.55, 2016.
  laday, K., Betts, R. A., and Soares, W. R.: Changes in cli-          Sanderson, B. M. and Fisher, R. A.: A fiery wake-up call for climate
  mate and land use over the Amazon Region: current and fu-               science, Nat. Clim. Change, 10, 175–177, 2020.
  ture variability and trends, Front Earth Sci. Chin., 6, 228,         Staver, A. C., Brando, P. M., Barlow, J., Morton, D. C., Paine, C. E.
  https://doi.org/10.3389/feart.2018.00228, 2018.                         T., Malhi, Y., Araujo Murakami, A., and Del Aguila Pasquel, J.:
Met Office: Iris: A Python library for analysing and visualising          Thinner bark increases sensitivity of wetter Amazonian tropical
  meteorological and oceanographic data sets, v1.2 edn., Exeter,          forests to fire, Ecol. Lett., 23, 99–106, 2020.
  Devon, available at: http://scitools.org.uk/ (last access: 8 Octo-   Tollefson, J.: ECOLOGY Huge wildfires defy explanation, Nature,
  ber 2019), 2013.                                                        561, 16–17, 2018.
Morton, D. C., Defries, R. S., Randerson, J. T., Giglio, L.,           Van Der Werf, G. R., Randerson, J. T., Giglio, L., Gobron, N., and
  Schroeder, W., and Van Der Werf, G. R.: Agricultural intensi-           Dolman, A. J.: Climate controls on the variability of fires in the
  fication increases deforestation fire activity in Amazonia, Glob.       tropics and subtropics, Global Biogeochem. Cy., 22, GB3028,
  Change Biol., 14, 2262–2275, 2008.                                      https://doi.org/10.1029/2007GB003122, 2008.
NASA: Uptick in Amazon Fire Activity in 2019, NASA Earth Ob-           van Oldenborgh, G. J., Krikken, F., Lewis, S., Leach, N. J.,
  servatory, available at: https://www.earthobservatory.nasa.gov/         Lehner, F., Saunders, K. R., van Weele, M., Haustein, K., Li,
  images/145498/uptick-in-amazon-fire-activity-in-2019 (last ac-          S., Wallom, D., Sparrow, S., Arrighi, J., Singh, R. P., van
  cess: 3 November 2020), 2019.                                           Aalst, M. K., Philip, S. Y., Vautard, R., and Otto, F. E. L.: At-
Nauslar, N. J., Brown, T. J., McEvoy, D. J., and Lareau, N. P.:           tribution of the Australian bushfire risk to anthropogenic cli-
  Record-setting 2018 California wildfires, in: State of the Climate      mate change, Nat. Hazards Earth Syst. Sci. Discuss. [preprint],
  2018, edited by: Blunden, J. A. D. S. A., Special Supplement to         https://doi.org/10.5194/nhess-2020-69, in review, 2020.
  the Bulletin of the American Meteorological Society Vol. 100,        Venevsky, S., Thonicke, K., Sitch, S., and Cramer, W.: Simulating
  No. 9, September 2019, p. 195, 2019.                                    fire regimes in human-dominated ecosystems: Iberian Peninsula
Patel, K.: Arctic Fires Fill the Skies with Soot, NASA Earth Ob-          case study, Glob. Change Biol., 8, 984–998, 2002.
  servatory, available at: https://earthobservatory.nasa.gov/images/   Williams, A. P. and Abatzoglou, J. T.: Recent Advances and Re-
  145380/arctic-fires-fill-the-skies-with-soot, last access: 1 De-        maining Uncertainties in Resolving Past and Future Climate Ef-
  cember 2019.                                                            fects on Global Fire Activity, Current Climate Change Reports,
Pellegrini, A. F. A., Anderegg, W. R. L., Paine, C. E. T., Hoffmann,      2, 1–14, 2016.
  W. A., Kartzinel, T., Rabin, S. S., Sheil, D., Franco, A. C., and    Wiltshire, J., Hekman, J., and Milan, B. F.: Carbon loss and eco-
  Pacala, S. W.: Convergence of bark investment according to fire         nomic impacts of a peatland wildfire in north-east Sutherland,
  and climate structures ecosystem vulnerability to future change,        Scotland, in: Report on impact of wildfire on the peatland and
  Ecol. Lett., 20, 307–316, 2017.                                         released carbon from the peatland, 12–17 May 2019, Ricardo
Perry, J. J., Cook, G. D., Graham, E., Meyer, C. P. M., Murphy,           Energy & Environment for WWF-UK, 2019.
  H. T., and VanDerWal, J.: Regional seasonality of fire size and      Witze, A.: The Arctic is burning like never before – and that’s bad
  fire weather conditions across Australia’s northern savanna, Int.       news for climate change, Nature, 585, 336–337, 2020.
  J. Wildland Fire, 29, 1–10, 2020.

https://doi.org/10.5194/bg-18-787-2021                                                              Biogeosciences, 18, 787–804, 2021
You can also read