Living with floating vegetation invasions - DORA 4RI
←
→
Page content transcription
If your browser does not render page correctly, please read the page content below
Ambio 2021, 50:125–137
https://doi.org/10.1007/s13280-020-01360-6

 RESEARCH ARTICLE

Living with floating vegetation invasions
Fritz Kleinschroth , R. Scott Winton , Elisa Calamita ,
Fabian Niggemann, Martina Botter, Bernhard Wehrli ,
Jaboury Ghazoul

Received: 19 February 2020 / Revised: 4 June 2020 / Accepted: 15 June 2020 / Published online: 28 July 2020

Abstract Invasions of water bodies by floating vegetation,             INTRODUCTION
including water hyacinth (Eichhornia crassipes), are a
huge global problem for fisheries, hydropower generation,              More than 50 years ago, Science published a landmark
and transportation. We analyzed floating plant coverage on             article, ‘‘Aquatic Weeds’’ (Holm et al. 1969). The authors
20 reservoirs across the world’s tropics and subtropics,               reviewed a global assortment of floating vegetation inva-
using [ 30 year time-series of LANDSAT remote-sensing                  sions that incurred substantial costs by blocking boat traf-
imagery. Despite decades of costly weed control, floating              fic, degrading the capacity to irrigate crops, and interfering
invasion severity is increasing. Floating plant coverage               with hydropower generation. The authors further suggested
correlates with expanding urban land cover in catchments,              that such invasions are ‘‘the symptoms of our failure to
implicating urban nutrient sources as plausible drivers.               manage our resources.’’ They argued that the management
Floating vegetation invasions have undeniable societal                 remedy to this global crisis is the stepping up of biological
costs, but also provide benefits. Water hyacinths efficiently          quarantines and physical, chemical and/or biological con-
absorb nutrients from eutrophic waters, mitigating nutrient            trol interventions.
pollution problems. When washed up on shores, plants may                   Since Holm et al. (1969) sounded the alarm, research on
become compost, increasing soil fertility. The biomass is              aquatic weed invasions has accelerated, while very sub-
increasingly used as a renewable biofuel. We propose a                 stantial resources have been allocated to control measures
more nuanced perspective on these invasions moving away                (Villamagna and Murphy 2010; Hussner et al. 2017). For
from futile eradication attempts towards an ecosystem                  example, the Spanish government spent 20.9 million US$
management strategy that minimizes negative impacts                    over 4 years to use heavy machinery to physically remove
while integrating potential social and environmental                   floating vegetation along a 75 km stretch of the Guadiana
benefits.                                                              river (EPPO 2009); two million US$ were spent on per-
                                                                       sonnel costs to run a 3-year project on biological control of
Keywords Biological invasions  Dams                                  water hyacinths in Benin (De Groote et al. 2003); and a
Google earth engine  Land cover change  Urbanization                single herbicide spraying campaign on Hartebeespoort dam
Water-energy-food nexus                                                in South Africa cost an equivalent of 200’000 US$ (Van
                                                                       Wyk and Van Wilgen 2002). Although local examples of
                                                                       successful control exist (Wainger et al. 2018), aquatic weed
                                                                       invasions continue to persist in tropical and subtropical
                                                                       river systems to this day, and are even expanding to higher
                                                                       latitudes with warming climates (Kriticos and Brunel
Fritz Kleinschroth and R. Scott Winton contributed equally to this     2016).
work.                                                                      To assess trends and future development of floating
                                                                       vegetation we need to understand patterns of floating
Electronic supplementary material The online version of this
article (https://doi.org/10.1007/s13280-020-01360-6) contains sup-     vegetation invasions in space and time, and relate their
plementary material, which is available to authorized users.           distribution to potential drivers such as sources of

                                                           Ó The Author(s) 2020
                                                              www.kva.se/en                                               123
126                                                                                                   Ambio 2021, 50:125–137

anthropogenic pollution in the catchment. We expect that,       Floating vegetation detection
despite control efforts, floating vegetation invasions will
persist in the warm regions of the world as long as the         Floating vegetation cover on reservoirs can be detected
nutrient inputs that drive them continue to worsen. If there    through optical remote sensing due to the clear difference
is no prospect of eradication, then we need to learn how to     in spectral reflectance to open water and to submerged
live with such invasions by applying an ecosystem man-          vegetation and algae that occur inside the water column
agement approach that acknowledges new ecosystem                (Albright et al. 2004; Khanna et al. 2012; Thamaga and
realities, and seeks to manage invasive floating vegetation     Dube 2018). For the selected reservoirs, we produced time
as an integral element of the system. In doing so, there is     series of floating vegetation cover. This approach has been
the potential to reduce the scale and costs of control          possible through the availability of cloud-based access to
measures, and even to harness potential benefits of floating    the entire Landsat archive from 1984 to 2018, provided by
vegetation.                                                     Google Earth Engine. The possibility to run individually
   Reservoirs are particularly useful for studying floating     developed algorithms on this huge archive makes it pos-
vegetation at a global scale because they act as choke          sible to evaluate the long time series and distributed areas
points, where accumulated floating plant masses can be          presented in this paper. For the observed time-span, we
detected from space (Coetzee et al. 2017). Reservoirs are       masked the water surface area and extracted the part of it
particularly vulnerable to water hyacinth (Eichhornia           that was covered with floating vegetation in each of
crassipes), considered one of the world’s worst invasive        2-month intervals that had imagery available. The grouping
weeds (Holm et al. 1977; Nentwig et al. 2018). To assess        into 2-month time steps helped to reduce errors due to
dynamics of water hyacinth and other floating species           missing data from cloud cover and unavailable imagery.
cover over time, we analyze three decades of floating plant     Bi-monthly averaging also reduced the error introduced
cover for 20 reservoirs around the world in which water         through individual days where wind and currents spread the
hyacinth invasions have been documented. We track               floating plants over particularly large areas with low den-
catchment land cover changes over the same time period to       sity coverage. Especially before 1999, data gaps occur due
assess potential changes in nutrient sources (i.e. agricul-     to missing imagery. For Bellandur, Hartebeespoort and
ture, urbanization). Finally, we convert water hyacinth         Minjiang, time series were cropped to 2000, 1990 and 1995
coverage into biomass and nutrient content (phosphorus,         respectively, as dams were only completed by these years.
nitrogen) using synthetic mean values from literature to        While we targeted reservoirs with the presence of water
assess the plants’ potential to mitigate aquatic nutrient       hyacinths, carpets of floating vegetation often also include
pollution and serve as a source of biofuel and fertilizer.      other species (Hestir et al. 2008; Cavalli et al. 2009). Our
                                                                long-term automated detection method was not able to
                                                                differentiate different species of floating plants, but we
MATERIALS AND METHODS                                           argue that grouping them makes sense, given that the main
                                                                problems they cause (such as physical obstruction of
Study sites                                                     waterways) are independent of the species.
                                                                   We defined water bodies based on the global surface
Dams are the places in river systems that trap floating         water occurrence data (Pekel et al. 2016). To account for
vegetation and provide stagnant waters where they accu-         seasonal variations in the water surface, we applied
mulate (Fig. 1a). A literature search on 19 June 2019 in        thresholds between 5 and 75% occurrence based on case-
Web of Science, using the search terms ((‘‘water hyacinth’’     by-case visual assessment of Google Earth high resolution
OR ‘‘Eichhornia crassipes’’) AND (reservoir OR dam))            imagery for multiple years (see Table S1). In a next step,
generated 132 hits. Based on abstract and full text search,     the Normalized Difference Vegetation Index (NDVI) was
we selected all studies that reported mass occurrences of E.    calculated using Landsat data to identify vegetation based
crassipes in dammed reservoirs and regulated river sys-         on its spectral reflectance in the red and near infrared
tems. Together with literature that we found through            spectrum. The NDVI uses the fact that plants strongly
snowballing and a search with the same keywords in              absorb visible light (400–700 nm) and reflect near-infrared
Google Scholar to account for grey literature, we found 65      light (700–1100 nm), resulting in an index from ? 1 to - 1
studies fulfilling these criteria (Table S1). We sorted the     describing the vitality of vegetation. The fact that water
list by continent and randomly selected 20 sites ensuring       poorly reflects infrared light facilitates the differentiation
equal geographic representation across the Americas,            between vegetation and water (Robles et al. 2015). A
Africa, Asia and Europe (Table 1). This allowed us to study     2-month composite of satellite data was used to minimize
the temporal and spatial dynamics of floating vegetation        the influence of data gaps due to clouds and cloud shadows.
invasions on globally distributed sample reservoirs.            Using a NDVI threshold of 0.3 and masking all areas

                                                    Ó The Author(s) 2020
123                                                    www.kva.se/en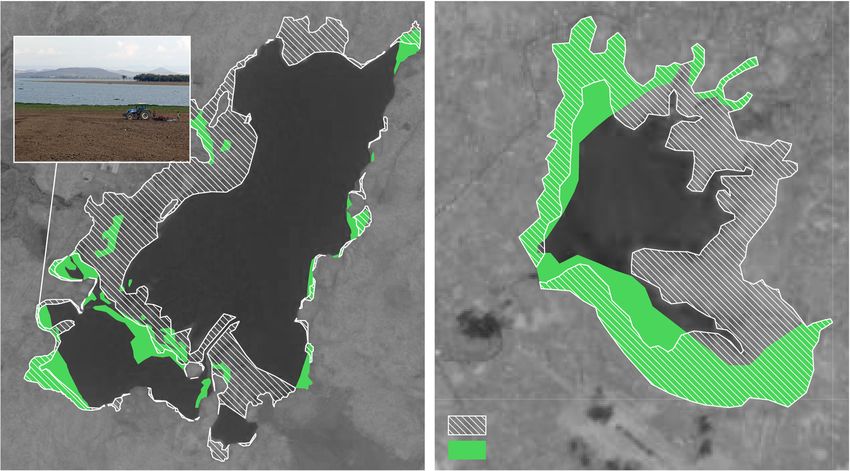
Ambio 2021, 50:125–137                                                                                                                  127

Fig. 1 A Kafue gorge dam in Zambia with floating vegetation trapped at the spillway (picture by ATEC-3D). B Carpets of floating water
hyacinths on a tributary of the Vam Co Dong River in Vietnam. C Part of the Kafue flats wetland in Zambia. The bright green fringe along the
shore is composed of two exotic floating plant species, water hyacinth and Amazon frogbit (picture by ATEC-3D)

outside the water body results in a layer of floating                   each other. P values smaller than 0.05 were considered
vegetation.                                                             significant.
   To analyze the long-term trend in floating vegetation                   Since we excluded seasonally flooded areas, the auto-
invasions, we normalized the area covered by floating                   mated approach to classify floating vegetation is not
plants for each site between 0 and 1. We then grouped                   appropriate to detect overlaps between seasonally dry areas
these values across sites in 5-year intervals. We used a                and those covered by floating vegetation. For two reser-
pairwise Wilcoxon rank sum test with a Benjamini &                      voirs with strong seasonal water level alterations, we
Hochberg adjustment for p-values (Benjamini and Hoch-                   therefore, manually digitized water surface area and float-
berg 1995) to compare each of the seven intervals with                  ing vegetation during one hydrologic season (2017/2018)

                                                          Ó The Author(s) 2020
                                                             www.kva.se/en                                                      123
128 Ambio 2021, 50:125–137
to identify areas dominated by floating vegetation that run described above. The model is limited and could be
dry occasionally. Comparison of floating vegetation on improved in the future by including other variables such as
permanent water bodies and seasonally dry areas, gave an density of urban areas, availability of wastewater treatment
indication where plants strand, senesce and decompose on infrastructures and run-off vs. infiltration depending on
land. Both reservoirs, Lake Koka in Ethiopia and Lake vegetation and soils.
Batujai in Indonesia, showed signs of agricultural use of We used overall peaks in floating vegetation cover to
the temporarily inundated areas, detected from personal account for the full variability during the study period,
field observations (Koka) and from Google Earth imagery given that coverage is close to 0 for all reservoirs at some
(Batujai). point in time. We log-transformed values to approximately
conform to normality. We used absolute rather than rela-
Land cover modelling tive values of peak floating vegetation cover. Here, our
assumption was that there is a direct link between nutrient
We extracted land cover change from the ESA CCI land inputs from a given land cover area and the amount of
cover time series from 1992 to 2015 (Li et al. 2017) within vegetation that grows. Only small reservoirs up to 5 km2 in
catchment polygons at Pfafstetter levels 5–10 from the size showed up to 100% coverage of floating vegetation,
HydroSheds database (Lehner and Grill 2013). We then thus limiting the results. For larger reservoirs the overall
used linear regression models to correlate peak floating size was less influential.
vegetation cover with the change in urban and agricultural
land-cover within each catchment between 1992 and 2015. Climate data
As an additional variable we calculated the size of the
reservoirs based on the same surface water extent (Pekel We used rainfall data from the CHIRPS dataset (Funk et al.
et al. 2016) used for floating vegetation detection as 2014) and temperature data from station data of the Global
Table 1 Overview of the study sites and floating vegetation cover summary (for further information see Table S1)
# Name Country Catchment Water extent Mean vegetation Mean vegetation Max. vegetation Max. vegetation
area (km2) (km2)a cover (km2)b cover (%)b cover (km2)c cover (%)c
1. Bailianhe China 1733 20.56 0.49 2.4 5.80 28.21
2. Batujai Indonesia 184 5.60 0.31 5.53 2.75 49.09
3. Bellandur India 149 1.85 0.3 16.18 1.77 95.91
4. Chao Phraya Thailand 117 900 6.57 0.26 3.99 3.67 55.83
5. Chivero Zimbabwe 2247 20.79 0.94 4.54 7.51 36.10
6. Guadiana Spain 48 420 23.01 0.55 2.4 4.04 17.57
7. Hartebeespoort South Africa 4028 17.15 1.78 10.36 9.04 52.69
8. Kafue gorge Zambia 152 800 10.66 1.17 9.99 5.49 51.48
9. Kanewal India 216 3.11 0.84 26.87 3.09 99.28
10. Koka Ethiopia 11 140 130.08 1.49 1.15 18.24 14.02
11. Mariquita Mexico 176 3.38 0.71 21.0 2.49 73.81
12. Minjiang China 52450 52.59 2.26 4.3 23.28 44.26
13. Petrobras Brazil 200 1.78 0.35 19.72 1.78 99.75
14. Ross Barnet USA 7680 87.99 0.49 0.55 3.06 3.47
15. Salto Grande Brazil 38 740 5.57 0.2 3.59 1.16 20.75
16. Taabo Ivory Coast 59 610 25.21 0.5 0.2 8.65 34.30
17. Tapacurá Brazil 476 5.33 0.29 5.5 1.86 34.91
18. Tomine Colombia 356 20.91 0.18 0.85 2.71 12.95
19. Valsequillo Mexico 4033 23.38 5.14 21.97 16.39 70.08
20. Vam Co Dong Vietnam 6452 5.35 0.3 5.53 2.89 54.05
a
Based on surface water occurrence threshold (see supplemental information) (Pekel et al. 2016)
b
Based on observed floating vegetation cover in any given 2-month interval (Fig. 2)
c
Highest floating vegetation cover detected in any 2-month interval during the full study period
Ó The Author(s) 2020
123 www.kva.se/enAmbio 2021, 50:125–137 129
● Guadiana
●
Ross Barnett Bailianhe ●
Mariquita
●
●
Kanewal ● Minjiang
● Valsequillo
Bellandur ● Chao Phraya
●
●
Koka ●
Vam Co Dong
● Taabo ●
Tomine
●
Batujai
●
Tapacura
Petrobras ● Kafue ● ● Chivero
● Salto Grande
Hartebeespoort ●
Bailianhe Batujai Bellandur
0 2 4 6
1.0
0.0 1.5
0.0
1990 2000 2010 2020 1990 2000 2010 2020 1990 2000 2010 2020
Chao Phraya Chivero Guadiana
4
2
4
2
0
0
0
1990 2000 2010 2020 1990 2000 2010 2020 1990 2000 2010 2020
Coverage (km2)
Hartebeespoort Kafue Kanewal
8
2.0
4
4
2
0.0
0
0
1990 2000 2010 2020 1990 2000 2010 2020 1990 2000 2010 2020
Koka Mariquita Minjiang
1.5
10
10
0.0
0
0
1990 2000 2010 2020 1990 2000 2010 2020 1990 2000 2010 2020
Petrobras Ross Barnett Salto Grande
0.0 0.6 1.2
2.0
1.0
0.0
0.0
1990 2000 2010 2020 1990 2000 2010 2020 1990 2000 2010 2020
Taabo Tapacura Tomine
8
1.5
0.0 1.5
4
0.0
0
1990 2000 2010 2020 1990 2000 2010 2020 1990 2000 2010 2020
Valsequillo Vam Co Dong
0.0 1.5 3.0
10
Floating vegetation cover
0
1990 2000 2010 2020 1990 2000 2010 2020
Year
Fig. 2 Time series of floating vegetation cover in 20 reservoirs with reported occurrence of water hyacinths since 1984, when frequent, reliable
remote sensing data first becomes available. Time series for Minjiang start later, as the dam was built in the 1990s. Other empty values result
from data gaps
Historical Climatology Network (Lawrimore et al. 2011). the occurrence of floating vegetation peaks relative to tem-
For the full observation period, we calculated bi-monthly perature and rainfall and ordered observations depending on
annual peak occurrence of rainfall, temperature and floating latitudes.
vegetation. We calculated the time lag (in months) between
Ó The Author(s) 2020
www.kva.se/en 123130 Ambio 2021, 50:125–137
0.8
Nutrient contents in river systems and bound
in biomass a ab ab ab ab b c
Floating vegetation cover (normalized)
For converting areal coverage of water hyacinth to nutrient
0.6
mass, we use the synthetic mean values of 2.01 (± 0.21
SE) kg dry mass m-2 of water hyacinth and 2.18 (± 0.35)
% nitrogen and 1.05 (± 0.33) % phosphorus taken from
0.4
available studies (see Tables S2 and S3). To estimate river
nutrient flux we multiplied discharge by concentration. We
used discharge values from the Global Runoff Database
Centre (GRDC) or from literature. Discharge data were not
0.2
available for Tapacura reservoir, so we estimated it by
generating a catchment area: discharge curve using nearby
GRDC stations (Fig. S3). We used the long-term mean of
0.0
total phosphorus and total nitrogen concentrations reported
1984−88 1989−93 1994−98 1999−03 2004−08 2009−13 2014−18
by the International Centre for Water Resources and Global
Time interval
Change GEMStat water quality database (https://gemstat.
org/) (Table S4). We calculated the uncertain fraction of Fig. 3 Boxplots of normalized floating vegetation cover across 20
nutrient content in biomass by multiplying the relative reservoirs between 1984 and 2018 grouped in 5-year intervals. Values
standard errors (10.6% for biomass, 16% for N and 31% for for each site are normalized between 0 and 1. Small letters indicate
significant differences (p \ 0.05) between intervals, determined
P).
through a pairwise Wilcoxon rank sum test
All calculations were done using R (R Core Team 2018)
with the packages ‘‘raster’’, ‘‘rgdal’’, ’’rgeos’’, ’’rnoaa’’, Rainfall delivers nutrients into aquatic ecosystems, facili-
’’ggplot2’’. tating growth, and flushes plant mats out of backwaters into
reservoirs (Fig. S1).
RESULTS AND DISCUSSION Urban nutrient pollution a likely driver
Increasing dominance of floating vegetation Continued increases in floating vegetation cover in reser-
voirs is troubling in view of the resources deployed to fight
Our remote sensing analysis of plant coverage on 20 invasions and the global boom of tropical dam construction
reservoirs indicates that floating vegetation invasions are that is likely exacerbating the problem (Zarfl et al. 2014).
getting worse (Fig. 2). After fluctuations in the 1980s and Floating vegetation growth is controlled by the availability
1990s, overall coverage reached significantly higher levels of phosphorus and nitrogen (Wilson et al. 2005; Coetzee
since 2009 (Fig. 3). The one exception is the Kafue Gorge and Hill 2012; You et al. 2014), and increased nutrient
Reservoir in Zambia, which experienced its most intense loading linked to changes in land cover could enhance
coverage in 1990s. Even here, following a decade of low water hyacinth growth. One potential landscape source is
plant coverage achieved by intensive nutrient pollution expansion of intensive agriculture and associated fertilizer
controls and control campaigns from 1998 to 2000 (Chola leaching, though we do not find a significant correlation
2001), floating vegetation has begun to increase again since between floating vegetation cover and change in cropland
2011. For other reservoirs, short-lived low values are extent in the catchment (linear model, p = 0.191). It is
explained by specific control campaigns, as for Mariquita possible that agricultural fertilizers are important nutrient
in Mexico (Aguilar et al. 2003) and Ross Barnett reservoir sources in some locations, but the best available land cover
in the USA (FTN Associates 2011). time series (ESA CCI) does not discriminate between
Nearly all sites exhibited seasonal oscillations in floating degrees of agricultural intensification, limiting our capacity
plant coverage (Fig. 2), as previously documented for Lake to thoroughly assess this potential driver.
Victoria (Albright et al. 2004). In some cases, such as Ross An alternative nutrient source could stem from urban
Barnett Reservoir in Mississippi, USA, and Vam Co Dong land cover and associated municipal wastewater or indus-
in Vietnam (Fig. 1 B), the vegetation disappears com- trial effluents. We find a strong positive correlation
pletely during the cool/dry season. Floating vegetation between peak floating vegetation cover and increasing
peaks tend to correlate with annual peaks in temperature urban land cover (Fig. 4; p \ 0.001, R2 = 0.43). Addi-
and rainfall. Cooler temperatures limit the plants’ growth tionally, floating vegetation dominance correlates with
rate, especially in subtropical or temperate settings.
Ó The Author(s) 2020
123 www.kva.se/enAmbio 2021, 50:125–137 131
reservoir size (p = 0.011). Small reservoirs can reach peak Given that the floating invasion issue is global and will
floating vegetation coverage [ 80%, meaning the size of likely persist and worsen alongside urbanization, we pro-
the water body limits further expansion (Table 1). To pose a more nuanced perspective to management. Because
account for this limitation, we classified reser- human nutrient inputs drive floating plant growth, dense
voirs \ 5 km2 as ‘‘small’’-type. To account for differences mats commonly form at sheltered and shallow sites near
in streamflow, we further added the category ‘‘river’’ for urban areas (Fig. S2). These places coincide with living
run-of-the-river reservoirs with retention times \ 2 days. and working areas, hence the disruption to human activity.
The remaining 12 reservoirs are considered ‘‘large’’-types Rapid growth of water hyacinth might be better interpreted
that also show a strong correlation with urban land cover as an indicator and symptom of a more serious issue of
change (Fig. 4, p = 0.002, R2 = 0.61). poor wastewater management rather than a specific prob-
Despite the unconstrained variability in wastewater lem to be addressed in isolation. Water hyacinth outbreaks
treatment across catchments, increasing urban land cover also occur in South America, its native range, in polluted
explains up to 61% of variability in floating vegetation surface waters. Invasion is, therefore, not necessarily a
coverage. Industrial point-sources are likely to be impor- function of being an exotic species in a novel environment.
tant nutrient sources for water hyacinth in some places Moreover, as long as nutrient loads remain modest, water
(Sinkala et al. 2002) and they are typically embedded hyacinth appears to lack the capacity to outcompete co-
within urbanized areas. In addition, inadequate urban occurring floating vegetation species (Khanna et al. 2012).
wastewater treatment, a widespread problem in tropical Based on drone images, we have found that in regions of
countries that dominate our data set, is likely to be a sig- the Kafue river system in Zambia, water hyacinths co-exist
nificant nutrient source driving long-term patterns in the in association with diverse communities of other (native
coverage we observe at reservoirs globally. We conclude and non-native) aquatic plant species (Fig. 1c).
that a major driver of increasing floating vegetation on
reservoirs is nutrient pollution delivered to aquatic Invasions may mitigate nutrient pollution
ecosystems from urban areas. Given the high rates of urban
expansion around the world (Seto et al. 2012) and an Blooms of floating aquatic vegetation are a symptom of
exacerbation of nutrient pollution globally (Damania et al. nutrient pollution but could become part of solution
2019), it is likely that the increasing trend of floating strategies. Only a reduction of nutrient emissions through,
vegetation invasions will continue. for example, treatment of wastewater and urban runoff,
will reduce the underlying cause of aquatic weed invasions.
Minjiang
Koka
3 Minjiang
Reservoir
Koka size (km2)
3
Valsequillo
Peak floating vegetation cover (log)
2
Taabo Valsequillo 10
Hartebeespoort Hartebeespoort 20
2 50
Chivero Kafue 2
Bailianhe Chivero Taabo 100
Ross Barnett Bailianhe Kafue
Kanewal Kanewal Guadiana
Chao Phraya Chao Phraya Reservoir
Batujai Guadiana Batujai Ross Barnett type
1 Vam Co Dong Vam Co Dong
Tomine 1 large
Mariquita
Tapacura Mariquita Tomine river
Bellandur Tapacura small
Petrobras Bellandur Petrobras
Salto Grande Salto Grande
0 0
0 100 200 300 0 400 800 1200
Urban land cover change (km2) Agricultural land cover change (km2)
Fig. 4 Scatterplot showing the correlation between log-transformed peak floating vegetation cover in reservoirs and change in urban and
agricultural land cover from 1992 to 2015 (ESA CCI land cover time series) in each catchment. Scaling of points according to reservoir size,
color coding by reservoir type. Regression lines for the full dataset with 95% confidence intervals in gray
Ó The Author(s) 2020
www.kva.se/en 123132 Ambio 2021, 50:125–137
Nonetheless, floating vegetation itself can ameliorate some a high degree of urbanization, such as Hartebeespoort in
of the problems of high nutrient loads by its capacity to South Africa (39% P, 61% N) and Tapacurá in Brazil
extract nutrients directly from the water column (Brix (48% P, 82% N). Water hyacinth may also be important in
1997; Pilon-Smits 2005). Floating vegetation is regularly more oligotrophic large catchments, such as the Kafue in
used in this way in constructed wetlands to treat wastew- Zambia where 19% and 3% of annual P and N fluxes are
ater (Reddy and Sutton 1984; Dhote and Dixit 2009) with bound within floating plants (Fig. 5). The proportion is
the proven ability to remove heavy metals from contami- more modest in smaller, run-of-the-river reservoirs with a
nated water bodies through phytoremediation (Jones et al. large catchment area, such as Chao Phraya in Thailand.
2018; Rodrı́guez-Espinosa et al. 2018). In the absence of Floating plants in reservoirs represent a long-term
effective wastewater treatment facilities, uncontrolled removal of nutrients from surface water when their bio-
floating vegetation invasions may partly take over the role mass is removed mechanically, or sequestered through
of mitigating anthropogenic pollution (Rezania et al. 2015). sedimentation which may capture 8% of water hyacinth
In shallow lake systems, such effects might contribute to detritus annually (Reddy and DeBusk 1991). But even in
the resilience of the lake system, and reduce the likelihood the absence of significant export processes, nutrients bound
of a transformative system shift to a eutrophic stable state. to floating plants remain relatively unavailable to biota and
We evaluated the potential for floating vegetation to may serve as an important buffer to prevent aquatic
absorb nutrients, and found that carpets of floating vege- ecosystem collapse. A host of fish and invertebrate herbi-
tation on reservoirs represent a major nutrient pool. Based vores consume water hyacinth, themselves attracting
on the area and corresponding biomass detected on our data predators such as larger fish and birds (Gopal 1987; Njiru
set of 20 reservoirs, the annual peak phosphorus content of et al. 2002). Thus a complex food web assembles atop a
these plants is 1.1 Gg, approximately 3% of the increase in water hyacinth foundation. Without water hyacinth to lock
phosphorus fertilizer demand for Africa south of the Sahara up nutrients in biomass, there is a risk of reservoirs
from 2014 to 2018 (FAO 2015). An examination of specific becoming increasingly eutrophic and dominated by phy-
catchments reveals that nutrients bound to floating plants toplankton or cyanobacteria (Scheffer et al. 1993). Floating
represent a substantial component of local riverine nutrient vegetation, even if it doesn’t permanently remove nutri-
fluxes. This is most pronounced in smaller catchments with ents, likely reduces nutrient availabilities in the water, and
A
B
Fig. 5 Percentage of total riverine nutrient flux bound to floating vegetation for sub-set of study sites with available total nutrient concentration
and discharge data
Ó The Author(s) 2020
123 www.kva.se/enAmbio 2021, 50:125–137 133
mitigates the undesirable effects of nutrient pollution to
fish populations through algal blooms and hypoxia. Further
evidence for its importance as a nutrient buffer are studies
documenting rapid increases in dissolved nutrient concen-
trations following chemical spraying or mechanical
shredding (Mangas-Ramı́rez and Elı́as-Gutiérrez 2004;
Reddy and Sacco 2010). For at least some local managers,
the nutrient buffering benefits provided by water hyacinth
are already common knowledge (Sinkala et al. 2002).
From problem to resource
Floating vegetation control programmes are costly (Mara
1976; Epanchin-Niell 2017; Jardine and Sanchirico 2018).
They are also likely to be ineffective in the long term
unless water nutrient levels are managed. A systems ori-
ented approach to managing aquatic weeds is needed, one
that takes account of inputs and outputs across spatial
scales and ecosystem boundaries. Such an approach would
benefit from recognizing that water hyacinth, while cer-
tainly a problem, can also be part of the solution, for
example by reducing nutrient levels in watercourses,
removing heavy metals (Chunkao et al. 2012), as well as
providing new income opportunities (Fig. 6).
Given their high nutrient contents, stranded floating
Fig. 6 Baskets made of water hyacinths from a community project, plants are readily available as green manure (Gunnarsson
for sale in a shop in Phnom Penh, Cambodia and Petersen 2007). For seasonally flooded areas of Lake
Fig. 7 Visual interpretation of shoreline variation and floating vegetation coverage from Landsat and Sentinel 2 images collected between
September 2017 and August 2018 from Lake Koka and Lake Batujai sites. Reservoirs in flat topographies show strong season fluctuations in the
shoreline (hashed area). The areas that dry out coincide by 50% with those that were (at least temporarily) covered with floating vegetation (green
areas). In the overlapping areas, floating vegetation becomes stranded and can serve as compost, as shown in the inset photograph, taken in
March 2019
Ó The Author(s) 2020
www.kva.se/en 123134 Ambio 2021, 50:125–137
Koka in Ethiopia and Lake Batujai in Indonesia we show of the purification and fertilization services as well as the
how stranded floating plants transport nutrients out of the additional biomass of the floating plants.
water back to the land where they fertilize croplands
(Fig. 7). In 2018, 48% or 7.34 km2 (Koka) and 77% or Acknowledgements FK, EC, MB and FN are funded by the DAFNE
project of the European Union H2020 program (Grant Agreement
2.1 km2 (Batujai) of floating vegetation cover was stranded Number 690268). We thank Imasiku Nyambe and his team for
on the shore and at least partially ploughed into agricultural hosting us at UNZA in Zambia as well as Gete Zeleke and Amare
fields. The sequestration of nutrients from the water col- Bantider at WLRC in Ethiopia. Simon Spratley from ATEC-3D
umn, and their subsequent transport to land systems during collected drone imagery. Two anonymous reviewers provided helpful
comments to the manuscript.
floods and flood recessions, can deliver the dual benefit of
reducing eutrophication risk while replenishing soil fertil- Open Access This article is licensed under a Creative Commons
ity. By substituting water hyacinth for synthetic fertilizers, Attribution 4.0 International License, which permits use, sharing,
farmers avoid the cost of the latter, as well as the risk of adaptation, distribution and reproduction in any medium or format, as
long as you give appropriate credit to the original author(s) and the
further nutrient run-off into watercourses. source, provide a link to the Creative Commons licence, and indicate
The caloric value of the plant biomass is increasingly if changes were made. The images or other third party material in this
acknowledged as a benefit provided by floating vegetation article are included in the article’s Creative Commons licence, unless
(Shanab et al. 2018; Wang et al. 2019). Water hyacinth is indicated otherwise in a credit line to the material. If material is not
included in the article’s Creative Commons licence and your intended
being utilized for bioethanol and biogas production (Wang use is not permitted by statutory regulation or exceeds the permitted
and Calderon 2012; Hernández-Shek et al. 2016) and the use, you will need to obtain permission directly from the copyright
potential for small scale local energy generation in water holder. To view a copy of this licence, visit http://creativecommons.
hyacinth affected areas is high (Wilkie and Evans 2010) org/licenses/by/4.0/.
despite the challenge of the plant’s high water content
(Coetzee et al. 2017). Examples are projects in Niger
Data Availability The data generated and analysed during the cur-
(Almoustapha et al. 2009) and Kenya (Grist et al. 2018), rent study are publicly available with the DOI https://doi.org/10.3929/
where biogas from water hyacinths is successfully used as ethz-b-000420432 under the following link: https://www.research-
a substitute for wood fuel. Our set of 20 reservoirs annually collection.ethz.ch/handle/20.500.11850/420432bzw.
generates roughly 220 Gg of floating vegetation biomass
(Table 1, Table S2), which at a conversion rate of 0.28 m3
biogas per dry kg (Wolverton and Mcdonald 1981), could
annually produce 0.13 TWh of electricity (at 2 kWh per m3 REFERENCES
of biogas), worth roughly 19 million US$ in Kenya where
energy costs 15 US cents per kWh (as of march 2019). Aguilar, J.A., O.M. Camarena, T.D. Center, and G. Bojórquez. 2003.
Dam sites seem particularly useful locations for biofuel Biological control of waterhyacinth in Sinaloa, Mexico with the
weevils Neochetina eichhorniae and N. bruchi. BioControl 48:
plants due to the accumulating of plant material and the 595–608. https://doi.org/10.1023/A:1025707603627.
available infrastructure for plant collection and access to Albright, T.P., T.G. Moorhouse, and T.J. Mcnabb. 2004. The rise and
electricity grids. fall of water hyacinth in Lake Victoria and the Kagera River
Basin, 1989–2001. Journal of Aquatic Plant Management 42:
73–84.
Almoustapha, O., S. Kenfack, and J. Millogo-Rasolodimby. 2009.
Biogas production using water hyacinths to meet collective
CONCLUSIONS
energy needs in a sahelian country. Field Actions Science
Reports 2: 27–32. https://doi.org/10.5194/facts-2-27-2009.
Our analysis provides a global picture of increasing float- Benjamini, Y., and Y. Hochberg. 1995. Controlling the false
ing vegetation invasions during more than three decades, discovery rate: A practical and powerful approach to multiple
testing. Journal of the Royal Statistical Society 57: 289–300.
alongside a strong urbanization trend. As nutrient pollution
Brix, H. 1997. Do macrophytes play a role in constructed treatment
from urban areas continues to increase, invasive floating wetlands? Water Science and Technology 35: 11–17.
vegetation can at least partially fulfill important water Cavalli, R.M., G. Laneve, L. Fusilli, S. Pignatti, and F. Santini. 2009.
purification functions, buffering further negative conse- Remote sensing water observation for supporting Lake Victoria
weed management. Journal of Environmental Management 90:
quences for aquatic ecosystems and water users. In the
2199–2211. https://doi.org/10.1016/j.jenvman.2007.07.036.
context of adaptive ecosystem management (Heinimann Chola, P. 2001. Management of aquatic weeds on the Kafue river in
2010; Nanda et al. 2018), efforts to manage floating veg- Zambia. In 27th WEDC conference: People and systems for
etation invasions should not be focused on unrealistic tar- water, sanitation and health, ed. R. Scott, 381–382. Lusaka:
Zambia.
gets to eliminate invasive species. A more effective long-
Chunkao, K., C. Nimpee, and K. Duangmal. 2012. The King’s
term strategy would be to work with the seasonal dynamics initiatives using water hyacinth to remove heavy metals and
of the hydrological and biological system to make best use plant nutrients from wastewater through Bueng Makkasan in
Ó The Author(s) 2020
123 www.kva.se/enAmbio 2021, 50:125–137 135
Bangkok, Thailand. Ecological Engineering 39: 40–52. https:// freshwater aquatic plants: A review. Aquatic Botany 136:
doi.org/10.1016/j.ecoleng.2011.09.006. 112–137. https://doi.org/10.1016/j.aquabot.2016.08.002.
Coetzee, J.A., and M.P. Hill. 2012. The role of eutrophication in the Jardine, S.L., and J.N. Sanchirico. 2018. Estimating the cost of
biological control of water hyacinth, Eichhornia crassipes, in invasive species control. Journal of Environmental Economics
South Africa. BioControl 57: 247–261. https://doi.org/10.1007/ and Management 87: 242–257. https://doi.org/10.1016/j.jeem.
s10526-011-9426-y. 2017.07.004.
Coetzee, J.A., M.P. Hill, T. Ruiz-Téllez, U. Starfinger, and S. Brunel. Jones, J.L., R.O. Jenkins, and P.I. Haris. 2018. Extending the
2017. Monographs on invasive plants in Europe N° 2: Eichhor- geographic reach of the water hyacinth plant in removal of heavy
nia crassipes (Mart.) Solms. Botany Letters 164: 303–326. metals from a temperate Northern Hemisphere river. Scientific
https://doi.org/10.1080/23818107.2017.1381041. Reports 8: 1–15. https://doi.org/10.1038/s41598-018-29387-6.
Damania, R., S. Desbureaux, A.-S. Rodella, J. Russ, and E. Zaveri. Khanna, S., M.J. Santos, E.L. Hestir, and S.L. Ustin. 2012. Plant
2019. Quality Unknown. The invisible water crisis. Washington, community dynamics relative to the changing distribution of a
DC: World Bank. https://doi.org/10.1596/978-1-4648-1459-4. highly invasive species, Eichhornia crassipes: A remote sensing
Dhote, S., and S. Dixit. 2009. Water quality improvement through perspective. Biological Invasions 14: 717–733. https://doi.org/
macrophytes: A review. Environmental Monitoring and Assess- 10.1007/s10530-011-0112-x.
ment 152: 149–153. https://doi.org/10.1007/s10661-008-0303-9. Kriticos, D.J., and S. Brunel. 2016. Assessing and managing the
Epanchin-Niell, R.S. 2017. Economics of invasive species policy and current and future pest risk from water hyacinth, (Eichhornia
management. Biological Invasions 19: 3333–3354. https://doi. crassipes), an invasive aquatic plant threatening the environment
org/10.1007/s10530-017-1406-4. and water security. PLoS ONE 11: 1–18. https://doi.org/10.1371/
EPPO. 2009. Eichhornia crassipes. EPPO Bulletin 39: 460–464. journal.pone.0120054.
https://doi.org/10.1111/j.1365-2338.2008.01261.x. Lawrimore, J.H., M.J. Menne, B.E. Gleason, C.N. Williams, D.B.
FAO. 2015. World fertilizer trends and outlook to 2018. Rome: Food Wuertz, R.S. Vose, and J. Rennie. 2011. An overview of the
& Agriculture Organisation of the United Nations. https://doi. Global Historical Climatology Network monthly mean temper-
org/10.4060/ca6746en. ature data set, version 3. Journal of Geophysical Research 116:
FTN Associates. 2011. Comprehensive protection and restoration D19121. https://doi.org/10.1029/2011JD016187.
plan for the Ross Barnett Reservoir Watershed, Mississippi. Lehner, B., and G. Grill. 2013. Global river hydrography and network
Jackson, MS: Mississippi Department of Environmental Quality. routing: Baseline data and new approaches to study the world’s
Funk, C., P. Peterson, M. Landsfeld, D. Pedreros, J. Verdin, J. large river systems. Hydrological Processes 27: 2171–2186.
Rowland, B. Romero, G. Husak, et al. 2014. A quasi-global https://doi.org/10.1002/hyp.9740.
precipitation time series for drought monitoring. U.S. Geological Li, W., N. Macbean, P. Ciais, P. Defourny, S. Bontemps, R.A.
Survey Data Series 832: 4. Houghton, and S. Peng. 2017. Gross and net land cover changes
Gopal, B. 1987. Water hyacinth. Amsterdam: Elsevier B.V. based on plant functional types derived from the annual ESA
Grist, N., A. Winkels, and J. Reynolds. 2018. Baseline study: Dunga CCI land cover maps. Earth System Science Data. https://doi.
beach biogas community and household pilot. University of org/10.5194/essd-2017-74.
Cambridge Institute for Sustainability Leadership (CISL). Mangas-Ramı́rez, E., and M. Elı́as-Gutiérrez. 2004. Effect of
De Groote, H., O. Ajuonu, S. Attignon, R. Djessou, and P. mechanical removal of water hyacinth (Eichhornia crassipes)
Neuenschwander. 2003. Economic impact of biological control on the water quality and biological communities in a Mexican
of water hyacinth in Southern Benin. Ecological Economics 45: reservoir. Aquatic Ecosystem Health and Management 7:
105–117. https://doi.org/10.1016/S0921-8009(03)00006-5. 161–168. https://doi.org/10.1080/14634980490281597.
Gunnarsson, C.C., and C.M. Petersen. 2007. Water hyacinths as a Mara, M.J. 1976. Estimated costs of mechanical control of water
resource in agriculture and energy production: A literature hyacinths. Journal of Environmental Economics and Manage-
review. Waste Management 27: 117–129. https://doi.org/10. ment 2: 273–294. https://doi.org/10.1016/S0095-0696(76)80005-
1016/j.wasman.2005.12.011. 8.
Heinimann, H.R. 2010. A concept in adaptive ecosystem manage- Nanda, A.V.V., J. Rijke, L. Beesley, B. Gersonius, M.R. Hipsey, and
ment—An engineering perspective. Forest Ecology and Man- A. Ghadouani. 2018. Matching ecosystem functions with
agement 259: 848–856. https://doi.org/10.1016/j.foreco.2009.09. adaptive ecosystem management: Decision pathways to over-
032. come institutional barriers. Water (Switzerland). https://doi.org/
Hernández-Shek, M.A., L.S. Cadavid-Rodrı́guez, I.V. Bolaños, and 10.3390/w10060672.
A.C. Agudelo-Henao. 2016. Recovering biomethane and nutri- Nentwig, W., S. Bacher, S. Kumschick, and P. Pys. 2018. More than
ents from anaerobic digestion of water hyacinth (Eichhornia ‘‘‘100 worst’’’ alien species in Europe. Biological Invasions 20:
crassipes) and its co-digestion with fruit and vegetable waste. 1611–1621. https://doi.org/10.1007/s10530-017-1651-6.
Water Science and Technology 73: 355–361. https://doi.org/10. Njiru, M., A. N. Othina, A. Getabu, D. Tweddle, and I. G. Cowx.
2166/wst.2015.501. 2002. Is the invasion of water hyacinth, Eichhornia crassipes
Hestir, E.L., S. Khanna, M.E. Andrew, M.J. Santos, J.H. Viers, J.A. Solms (Mart .) a blessing to Lake Victoria fisheries? In
Greenberg, S.S. Rajapakse, and S.L. Ustin. 2008. Identification Management and ecology of lake and reservoir fisheries, ed.
of invasive vegetation using hyperspectral remote sensing in the I. G. Cowx, 255–263. Oxford: Blackwell.
California Delta ecosystem. Remote Sensing of Environment Pekel, J.-F., A. Cottam, N. Gorelick, and A.S. Belward. 2016. High-
112: 4034–4047. https://doi.org/10.1016/j.rse.2008.01.022. resolution mapping of global surface water and its long-term
Holm, L.G., L.W. Weldon, and R.D. Blackburn. 1969. Aquatic changes. Nature 540: 418–422. https://doi.org/10.1038/
weeds. Science 166: 699–709. nature20584.
Holm, L. R. G., D. L. Plucknett, J. V Pancho, and J. P. Herberger. Pilon-Smits, E. 2005. Phytoremediation. Annual Review of Plant
1977. The world’s worst weeds. Distribution and biology. Biology 56: 15–39. https://doi.org/10.1016/B978-0-12-394807-6.
Honolulu, Hawaii: University Press of Hawaii. 00016-2.
Hussner, A., I. Stiers, M.J.J.M. Verhofstad, E.S. Bakker, B.M.C. R Core Team. 2018. R: A language and environment for statistical
Grutters, J. Haury, J.L.C.H. van Valkenburg, G. Brundu, et al. computing. R Foundation for Statistical Computing. Vienna: R
2017. Management and control methods of invasive alien Foundation for Statistical Computing.
Ó The Author(s) 2020
www.kva.se/en 123136 Ambio 2021, 50:125–137
Reddy, K.R., and W.F. DeBusk. 1991. Decomposition of water Wang, Z., F. Zheng, and S. Xue. 2019. The economic feasibility of
hyacinth detritus in eutrophic lake water. Hydrobiologia 211: the valorization of water hyacinth for bioethanol production.
101–109. https://doi.org/10.1007/BF00037366. Sustainability (Switzerland). https://doi.org/10.3390/
Reddy, K.R., and P.D. Sacco. 2010. Decomposition of water hyacinth su11030905.
in agricultural drainage water. Journal of Environment Quality Wilkie, A.C., and J.M. Evans. 2010. Aquatic plants: An opportunity
10: 228. https://doi.org/10.2134/jeq1981. feedstock in the age of bioenergy. Biofuels 1: 311–321. https://
00472425001000020022x. doi.org/10.4155/bfs.10.2.
Reddy, K.R., and D.L. Sutton. 1984. Waterhyacinths for water quality Wilson, J.R., N. Holst, and M. Rees. 2005. Determinants and patterns
improvement and biomass production. Journal of Environmental of population growth in water hyacinth. Aquatic Botany 81:
Quality 13: 1–8. https://doi.org/10.2134/jeq1984. 51–67. https://doi.org/10.1016/j.aquabot.2004.11.002.
00472425001300010001x. Wolverton, B.C., and R.C. Mcdonald. 1981. Energy from vascular
Rezania, S., M. Ponraj, A. Talaiekhozani, S.E. Mohamad, M.F. Md plant wastewater treatment systems. Economic Botany 35:
Din, S.M. Taib, F. Sabbagh, and F.M. Sairan. 2015. Perspectives 224–232. https://doi.org/10.1007/BF02858689.
of phytoremediation using water hyacinth for removal of heavy Van Wyk, E., and B.W. Van Wilgen. 2002. The cost of water
metals, organic and inorganic pollutants in wastewater. Journal hyacinth control in South Africa: A case study of three options.
of Environmental Management 163: 125–133. https://doi.org/10. African Journal of Aquatic Science 27: 141–149. https://doi.org/
1016/j.jenvman.2015.08.018. 10.2989/16085914.2002.9626585.
Robles, W., J.D. Madsen, and R.M. Wersal. 2015. Estimating the You, W., D. Yu, D. Xie, L. Yu, W. Xiong, and C. Han. 2014.
biomass of waterhyacinth (Eichhornia crassipes) using the Responses of the invasive aquatic plant water hyacinth to altered
normalized difference vegetation index derived from simulated nutrient levels under experimental warming in China. Aquatic
landsat 5 TM. Invasive Plant Science and Management 8: Botany 119: 51–56. https://doi.org/10.1016/j.aquabot.2014.06.
203–211. https://doi.org/10.1614/ipsm-d-14-00033.1. 004.
Rodrı́guez-Espinosa, P.F., J.A. Mendoza-Pérez, J. Tabla-Hernandez, Zarfl, C., A.E. Lumsdon, J. Berlekamp, L. Tydecks, and K. Tockner.
E. Martı́nez-Tavera, and M.M. Monroy-Mendieta. 2018. 2014. A global boom in hydropower dam construction. Aquatic
Biodegradation and kinetics of organic compounds and heavy Sciences 77: 161–170. https://doi.org/10.1007/s00027-014-0377-
metals in an artificial wetland system (AWS) by using water 0.
hyacinths as a biological filter. International Journal of
Phytoremediation 20: 35–43. https://doi.org/10.1080/15226514. Publisher’s Note Springer Nature remains neutral with regard to
2017.1328397. jurisdictional claims in published maps and institutional affiliations.
Scheffer, M., S.H. Hosper, M.-L. Meijer, B. Moss, and E. Jeppesen.
1993. Alternative equilibria in shallow lakes. Trends in Ecology
& Evolution 8: 275–279. https://doi.org/10.1016/0169- AUTHOR BIOGRAPHIES
5347(93)90254-M. Fritz Kleinschroth (&) is a Postdoc in the Ecosystem Management
Seto, K.C., B. Güneralp, and L.R. Hutyra. 2012. Global forecasts of group at ETH Zurich. He specialises in global landscape planning
urban expansion to 2030 and direct impacts on biodiversity and issues, working on interdisciplinary nexus approaches for nature
carbon pools. Proceedings of the National Academy of Sciences conservation and land-use planning. He has a dual-PhD degree in
of the United States of America 109: 16083–16088. https://doi. Ecology and Biodiversity from AgroParisTech, France and Forestry
org/10.1073/pnas.1211658109. from Bangor University, UK.
Shanab, S.M.M., E.A. Hanafy, and E.A. Shalaby. 2018. Water Address: Ecosystem Management, Institute of Terrestrial Ecosystems,
hyacinth as non-edible source for biofuel production. Waste and Department of Environmental Systems Science, ETH Zurich,
Biomass Valorization 9: 255–264. https://doi.org/10.1007/ Universitätsstr. 16, 8092 Zurich, Switzerland.
s12649-016-9816-6. e-mail: klfritz@ethz.ch
Sinkala, T., E.T. Mwase, and M. Mwala. 2002. Control of aquatic
weeds through pollutant reduction and weed utilization: A weed R. Scott Winton (&) is a postdoctoral researcher and lecturer at the
management approach in the lower Kafue River of Zambia. Swiss Federal Institute of Technology (ETH) Zurich and the Swiss
Physics and Chemistry of the Earth 27: 983–991. https://doi.org/ Federal Institute for Aquatic Science and Technology (Eawag). His
10.1016/S1474-7065(02)00102-X. research focus is on the ecology, biogeochemistry and conservation of
Thamaga, K.H., and T. Dube. 2018. Remote sensing of invasive water freshwater aquatic ecosystems. He holds a PhD in Environmental
hyacinth (Eichhornia crassipes): A review on applications and Science and Policy from the Duke University Wetland Center in the
challenges. Remote Sensing Applications: Society and Environ- Nicholas School of the Environment (North Carolina, USA).
ment 10: 36–46. https://doi.org/10.1016/j.rsase.2018.02.005. Address: Institute of Biogeochemistry and Pollutant Dynamics,
Villamagna, A.M., and B.R. Murphy. 2010. Ecological and socio- Department of Environmental Systems Science, ETH Zurich,
economic impacts of invasive water hyacinth (Eichhornia Universitätsstr. 16, 8092 Zurich, Switzerland.
crassipes): A review. Freshwater Biology 55: 282–298. https:// Address: Surface Waters – Research and Management, Eawag, Swiss
doi.org/10.1111/j.1365-2427.2009.02294.x. Federal Institute of Aquatic Science and Technology, 6047 Kas-
Wainger, L.A., N.E. Harms, C. Magen, D. Liang, G.M. Nesslage, tanienbaum, Switzerland.
A.M. McMurray, and A.F. Cofrancesco. 2018. Evidence-based e-mail: scott.winton@gmail.com
economic analysis demonstrates that ecosystem service benefits
of water hyacinth management greatly exceed research and Elisa Calamita is a PhD student at the Institute of Biogeochemistry
control costs. PeerJ 6: e4824. https://doi.org/10.7717/peerj.4824. and Pollutant Dynamics of ETH Zurich. Her research interests include
Wang, Z., and M.M. Calderon. 2012. Environmental and economic the impact of dams on river water quality at low latitude.
analysis of application of water hyacinth for eutrophic water Address: Institute of Biogeochemistry and Pollutant Dynamics,
treatment coupled with biogas production. Journal of Environ- Department of Environmental Systems Science, ETH Zurich,
mental Management 110: 246–253. https://doi.org/10.1016/j. Universitätsstr. 16, 8092 Zurich, Switzerland.
jenvman.2012.06.031.
Ó The Author(s) 2020
123 www.kva.se/enAmbio 2021, 50:125–137 137
Address: Surface Waters – Research and Management, Eawag, Swiss Address: Institute of Biogeochemistry and Pollutant Dynamics,
Federal Institute of Aquatic Science and Technology, 6047 Kas- Department of Environmental Systems Science, ETH Zurich,
tanienbaum, Switzerland. Universitätsstr. 16, 8092 Zurich, Switzerland.
e-mail: elisa.calamita@usys.ethz.ch Address: Surface Waters – Research and Management, Eawag, Swiss
Federal Institute of Aquatic Science and Technology, 6047 Kas-
Fabian Niggemann is a remote sensing expert at VISTA Remote tanienbaum, Switzerland.
Sensing in Geosciences. His research interests include hyperspectral e-mail: bernhard.wehrli@eawag.ch
and multi-temporal vegetation monitoring.
Address: VISTA Remote Sensing in Geosciences GmbH, Gabels- Jaboury Ghazoul is Professor of Ecosystem Management at ETH
bergerstr. 51, 80333 Munich, Germany. Zurich, and the holder of the Prince Bernhard Chair of International
e-mail: niggemann@vista-geo.de Nature Conservation at Utrecht University, and Director of the Centre
for Sustainable Forests and Landscapes at the University of Edin-
Martina Botter is a PhD candidate in Environmental Engineering at burgh. His core expertise is plant reproductive ecology in human
ETH Zurich. Her research interests include hydrological and solute modified landscapes, with a focus on forested landscape mosaics.
transport modelling at the catchment scale. Address: Ecosystem Management, Institute of Terrestrial Ecosystems,
Address: Institute of Environmental Engineering, ETH Zurich, Ste- Department of Environmental Systems Science, ETH Zurich,
fano-Franscini-Platz 3, 8093 Zurich, Switzerland. Universitätsstr. 16, 8092 Zurich, Switzerland.
e-mail: botter@ifu.baug.ethz.ch Address: Prince Bernhard Chair of International Nature Conservation,
Ecology and Biodiversity, Department of Biology, Utrecht Univer-
Bernhard Wehrli is Professor for Aquatic Chemistry at the sity, Utrecht, The Netherlands.
Department of Environmental System Sciences at ETH Zurich. His Address: Centre for Sustainable Forests and Landscapes, University
research is focused on interdisciplinary approaches to analyze the of Edinburgh, Edinburgh EH9 3JT, Scotland.
biogeochemistry of inland waters. e-mail: jaboury.ghazoul@env.ethz.ch
Ó The Author(s) 2020
www.kva.se/en 123You can also read