The radiative impact of out-of-cloud aerosol hygroscopic growth during the summer monsoon in southern West Africa - Atmos. Chem. Phys
←
→
Page content transcription
If your browser does not render page correctly, please read the page content below
Atmos. Chem. Phys., 19, 1505–1520, 2019
https://doi.org/10.5194/acp-19-1505-2019
© Author(s) 2019. This work is distributed under
the Creative Commons Attribution 4.0 License.

The radiative impact of out-of-cloud aerosol hygroscopic growth
during the summer monsoon in southern West Africa
Sophie L. Haslett1,a , Jonathan W. Taylor1 , Konrad Deetz2 , Bernhard Vogel2 , Karmen Babić2 , Norbert Kalthoff2 ,
Andreas Wieser2 , Cheikh Dione3 , Fabienne Lohou3 , Joel Brito4 , Régis Dupuy4 , Alfons Schwarzenboeck4 ,
Paul Zieger5,6 , and Hugh Coe1
1 School of Earth and Environmental Sciences, University of Manchester, Manchester, UK
2 Instituteof Meteorology and Climate Research, Karlsruhe Institute of Technology (KIT), Karlsruhe, Germany
3 Laboratoire d’Aérologie, Université Paul Sabatier Toulouse III (UPS), Toulouse, France
4 Laboratoire de Météorologie Physique, Université Clermont Auvergne, Aubière, France
5 Department of Environmental Science and Analytical Chemistry, Stockholm University, Stockholm, Sweden
6 Bolin Centre for Climate Research, Stockholm University, Stockholm, Sweden
a now at: Department of Environmental Science and Analytical Chemistry, Stockholm University, Stockholm, Sweden

Correspondence: Hugh Coe (hugh.coe@manchester.ac.uk)

Received: 5 August 2018 – Discussion started: 20 August 2018
Revised: 4 January 2019 – Accepted: 24 January 2019 – Published: 5 February 2019

Abstract. Water in the atmosphere can exist in the solid,         sured by sun photometers at the ground site. The spread in the
liquid or gas phase. At high humidities, if the aerosol pop-      calculated AODs was less than the spread from the sun pho-
ulation remains constant, more water vapour will condense         tometer measurements. In both cases, values above 0.5 were
onto the particles and cause them to swell, sometimes up to       seen predominantly in the mornings and corresponded with
several times their original size. This significant change in     high humidities. Observations of modest variations in aerosol
size and chemical composition is termed hygroscopic growth        load and composition are unable to explain the high and vari-
and alters a particle’s optical properties. Even in unsatu-       able AODs observed using sun photometers, which can only
rated conditions, this can change the aerosol direct effect,      be recreated by accounting for the very elevated and variable
for example by increasing the extinction of incoming sun-         relative humidities (RHs) in the boundary layer. Most im-
light. This can have an impact on a region’s energy balance       portantly, the highest AODs present in the mornings are not
and affect visibility. Here, aerosol and relative humidity mea-   possible without the presence of high RH in excess of 95 %.
surements collected from aircraft and radiosondes during the      Humid layers are found to have the most significant impact
Dynamics–Aerosol–Chemistry–Cloud Interactions in West             on AOD when they reach RH greater than 98 %, which can
Africa (DACCIWA) campaign were used to estimate the ef-           result in a wet AOD more than 1.8 times the dry AOD. Unsat-
fect of highly humid layers of air on aerosol optical proper-     urated humid layers were found to reach these high levels of
ties during the monsoon season in southern West Africa. The       RH in 37 % of observed cases. It can therefore be concluded
effects of hygroscopic growth in this region are of particular    that the high AODs present across the region are driven by
interest due to the regular occurrence of high humidity and       the high humidities and are then moderated by changes in
the high levels of pollution in the region. The Zdanovskii,       aerosol abundance. Aerosol concentrations in southern West
Stokes and Robinson (ZSR) mixing rule is used to estimate         Africa are projected to increase substantially in the coming
the hygroscopic growth of particles under different condi-        years; results presented here show that the presence of highly
tions based on chemical composition. These results are used       humid layers in the region is likely to enhance the consequent
to estimate the aerosol optical depth (AOD) at λ = 525 nm         effect on AOD significantly.
for 63 relative humidity profiles. The median AOD in the re-
gion from these calculations was 0.36, the same as that mea-

Published by Copernicus Publications on behalf of the European Geosciences Union.
1506                                                               S. Haslett et al.: Radiative effects from aerosol liquid water

1   Introduction                                                     on the known growth factors of the pure constituents. While
                                                                     ambient aerosol is known to exist in a combination of inter-
Aerosol particles can absorb water even in sub-saturated con-        nal and external mixing states, this assumption is reasonable
ditions. In humid environments, this process can increase            for more aged, regional aerosol populations (Boucher et al.,
their size substantially. This increase in the aerosol liquid        2013; Pratt and Prather, 2010). When the HGF is known,
water content affects a particle’s interactions with radiation       the size distributions and known densities of aerosol par-
by increasing its diameter and changing its refractive in-           ticles and constituents can be used to estimate the volume
dex. Therefore, increased aerosol water content can alter the        of water in an aerosol sample. A number of closure studies
aerosol direct effect on radiative forcing. In addition, these       have been carried out to assess the reliability of these calcu-
alterations to aerosol characteristics can affect visibility and     lations compared with H-TDMA measurements, with com-
form haze or alter the chemical interactions of particles in the     pelling results (Gysel et al., 2007; Hersey et al., 2009; Mc-
atmosphere (Chen et al., 2012).                                      Figgans et al., 2005). Both McFiggans et al. (2005) and Gy-
   The extent to which an aerosol particle takes on water (its       sel et al. (2007) found closure was not possible when nitrate
hygroscopic growth) is dependent on a number of variables,           loadings were included in calculations. Gysel et al. (2007)
including its chemical composition, the ambient aerosol con-         suggested that this was likely due to the evaporation of nitrate
centration and the relative humidity (RH) in its environment.        in the H-TDMA, although some studies have found closure
Due to the complexity of this function, hygroscopic growth           between ZSR calculated and measured hygroscopic growth
has been identified as one of the key uncertainties in aerosol       for nitrate-containing particles (Guo et al., 2015; Henningan
radiative forcing (Forster et al., 2007). While the growth of        et al., 2015). Another explanation for discrepancies found in
inorganic aerosol species is reasonably well understood, the         optical closure studies using H-TDMAs is that these instru-
complexity of organic aerosols, which can include hundreds           ments usually only select dry sizes in the lower submicron
of different compounds, has made it difficult to establish a         size range and thus miss optically important size ranges in
definitive approach to investigating its hygroscopic proper-         the accumulation and coarse mode (Zieger et al., 2011).
ties in a mechanistic way (Gysel et al., 2007; Topping et al.,          A number of recurring features have been observed in
2005). A number of studies have been carried out to examine          various HGF measurements: Aklilu et al. (2006) noted that
hygroscopic growth empirically in the ambient environment            a high proportion of sulfate is often correlated with high
(e.g. Esteve et al., 2014; Gysel et al., 2007; Hersey et al.,        HGF values. This is related to the highly hygroscopic nature
2009; Highwood et al., 2012; Kamilli et al., 2014; Liu et al.,       of sulfate-containing aerosols compared with other species.
2011).                                                               Studies have shown that organic aerosol does grow hygro-
   A particle’s hygroscopic properties can be described using        scopically, though to a lesser extent than many inorganic
kappa (κ), which was developed by Petters and Kreidenweis            species (e.g. Nguyen et al., 2016). The HGF is slightly larger
(2007) to collate all of the chemical variables that affect hy-      for secondary organics and more aged aerosol due to its high
groscopicity into a single parameter. Although this value can        oxidation levels. However, the influence of even highly oxi-
vary slightly with RH and temperature, it is robust enough           dised organic compounds is small compared with that of in-
to be considered a constant for a given chemical composi-            organic compounds. Therefore, the organic-to-inorganic ra-
tion in most ambient cases. This value is closely related to         tio has been found to be a more influential factor for the HGF
an aerosol’s hygroscopic growth factor (HGF) in a given en-          than the composition of the organic aerosol itself (McFiggans
vironment – the ratio between its diameter after it has ab-          et al., 2005). A single value is therefore often used to repre-
sorbed water and its dry diameter. These quantities present          sent the HGF of organic aerosol. Urban environments have
challenges for measurement, as the majority of aerosol in-           been found to include several types of aerosol that are pri-
struments dry aerosol particles before measuring their prop-         marily hydrophobic (they do not readily absorb water). These
erties.                                                              include freshly emitted combustion particles due to their high
   Some studies have used the hygroscopic tandem differ-             soot content, and insoluble organic compounds (Swietlicki
ential mobility analyser (H-TDMA) to measure the wet di-             et al., 2008). The HGF correlates closely with the RH in a
ameters of aerosol particles (Swietlicki et al., 2008), which        region, and has been found to follow diurnal patterns in RH
makes a direct calculation of the HGF possible above rel-            closely (e.g. Liu et al., 2011).
ative humidities of around 90 %. A particle’s hygroscopic-              When the aerosol water content in a region has been cal-
ity depends on its chemical constituents. Therefore, another         culated, this value can be used in tandem with the calculated
approach is to estimate aerosol water content based purely           refractive index of wet particles to calculate changes to the
on measurements of chemical composition and on an aerosol            scattering and extinction properties of the particles, for ex-
population’s size distribution. If an aerosol population with        ample using a framework like that described by Esteve et al.
different chemical constituents can be assumed to be inter-          (2014). Thus, changes to the radiative properties of particles
nally mixed, the Zdanovskii, Stokes and Robinson (ZSR)               and their consequent impact on radiative forcing can be esti-
mixing rule (Stokes and Robinson, 1966; Zdanovskii, 1948)            mated.
allows the HGF of a mixed particle to be estimated based

Atmos. Chem. Phys., 19, 1505–1520, 2019                                               www.atmos-chem-phys.net/19/1505/2019/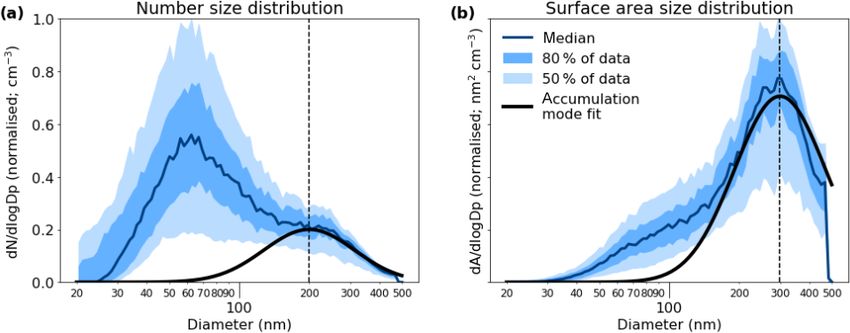
S. Haslett et al.: Radiative effects from aerosol liquid water                                                                 1507

   During the monsoon season in West Africa, the RH is of-           0.5 was applied to the data, which is typical for ambient
ten high, which results in substantial aerosol hygroscopic           data (Middlebrook et al., 2011). Comparisons between the
growth. Therefore, this is a region in which hygroscopic             AMS and the volume convolved size distribution show that
growth is likely to have a large impact on radiative forcing.        other components, for example mineral dust, contribute little
This supposition is supported by a previous study in southern        to the submicron aerosol mass and that coarse mode con-
West Africa, which found a strong increase in backscatter in         centrations were low. While mineral dust makes an impor-
the region between 18:00 and 00:00 UTC. This was thought             tant contribution to West African aerosol throughout much
to be related to aerosol growth due to increases in humidity         of the year (Ji et al., 2018), its concentration in the south-
during these times (Babić et al., 2018). Anthropogenic emis-        ern region during the monsoon season is often low due to
sions in the region are projected to increase substantially by       the predominant southerly monsoon winds (Knippertz et al.,
2030 (Liousse et al., 2014), which will increase the impact          2017). Instances of lofted dust layers have been observed to
of this hygroscopic growth.                                          the north of the West African region, but have not been con-
   This study presents radiosonde and aircraft data from the         sidered in this analysis; if present, they would simply add to
Dynamics–Aerosol–Chemistry–Cloud Interactions in West                the total aerosol optical depth (AOD) in the column. Black
Africa (DACCIWA) campaign, a large field campaign that               carbon concentrations were established using a Single Parti-
took place in southern West Africa during June and July 2016         cle Soot Photometer (SP2; Droplet Measurement Technolo-
(Knippertz et al., 2015, 2017; Flamant et al., 2018). Chemical       gies, Longmont, CO, USA). This produced a time series of
and physical aerosol measurements from the British Antarc-           the mass concentration of refractory black carbon larger than
tic Survey (BAS) Twin Otter and the French Service des               0.3 fg. Calibrations using Aquadag were carried out several
Avions Français Instrumentés pour la Recherche en Envi-              times during the campaign, with the standard scaling fac-
ronnement (SAFIRE) ATR-42 aircraft are presented here.               tor of 0.75 applied to the calibration curve (Laborde et al.,
The ZSR technique has been used to estimate the HGF and              2012). Particle size distributions were measured by a Scan-
aerosol liquid water content based on chemical measure-              ning Mobility Particle Sizer (SMPS; TSI Inc.) on board the
ments.                                                               ATR-42 aircraft. This aircraft carried out DACCIWA flights
                                                                     during the same time period as the Twin Otter, including a
                                                                     significant number in the region of interest here (Brito et al.,
2   Data and methods                                                 2018). The SMPS determines particle sizes using electrical
                                                                     mobility, scanning through the diameter size range from 0.02
Data were obtained during the DACCIWA aircraft and                   to 0.5 µm. This produces an aerosol size distribution every
ground-based campaigns in southern West Africa during                120 s.
June and July 2016 (Flamant et al., 2018; Kalthoff et al.,              Observations were considered alongside RH profiles from
2018). The chemical data presented here were collected               a number of radiosonde soundings from the DACCIWA su-
by the British Antarctic Survey Twin Otter aircraft, from            persite in Savè (8.03◦ N, 2.48◦ E). Radiosonde releases were
11 flights carried out between 6 and 15 July. The Twin Ot-           carried out from the Savè supersite for a period of 2 months
ter’s operating area during the campaign was from 0.6◦ W             (June and July), with several releases being made each day.
to 2.7◦ E and from 5.4 to 8.0◦ N. During DACCIWA, air-               This allowed the compilation of a robust set of RH statistics.
borne measurements were made of aerosol properties with              The set-up of measurements and the overview of the diur-
a focus on both regional aerosol properties and the effects of       nal cycle of the atmospheric boundary layer conditions from
urban emissions. Flight patterns consisted of a series of pro-       the Savè ground site are presented in more detail by Kalthoff
files, and straight and level runs at different altitudes. The fo-   et al. (2018).
cus of the Twin Otter aircraft was on low-tropospheric mea-             In order to ensure that aircraft data were comparable with
surements, below 3 km. Instrumentation on board the aircraft         RH readings in this region, aircraft data have been included
measured submicron aerosol chemical composition, optical             here if collected further north than 6.4◦ N and further east
properties and physical properties.                                  than 1.3◦ E, as shown by the box in Fig. 1. The chemical
   An Aerodyne Compact Time-of-Flight Aerosol Mass                   aerosol data collected in this region were found to be rea-
Spectrometer (AMS; Aerodyne Research Inc., Billerica,                sonably invariant across the campaign period (medians and
MA, USA) (see Canagaratna et al., 2007; Drewnick et al.,             interquartile ranges are displayed in Fig. 2); thus, these data
2005) was used to measure the chemical composition of the            have been averaged in order to increase the robustness of
submicron non-refractory aerosol mass. Measurements of or-           results. As observations of RH were taken from the Savè
ganics, nitrate, sulfate and ammonium were collected; chlo-          ground site, results shown here apply to the atmosphere
ride concentrations were found to be consistently below the          above Savè. The Twin Otter flight tracks from the campaign
instrument’s detection limit and so are not included here.           are displayed in Fig. 1.
The ionisation efficiency of the instrument was calibrated
several times during the campaign using ammonium nitrate
and once with ammonium sulfate. A collection efficiency of

www.atmos-chem-phys.net/19/1505/2019/                                                 Atmos. Chem. Phys., 19, 1505–1520, 2019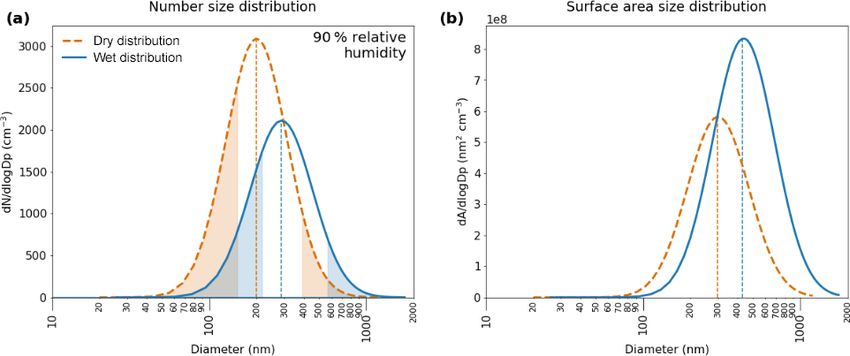
1508                                                                 S. Haslett et al.: Radiative effects from aerosol liquid water

                                                                       Table 1. Density, kappa values and refractive indices for aerosol
                                                                       species considered here.

                                                                               Species                 Density              κ    Refractive index
                                                                                                     (kg m−3 )                     (λ = 525 nm)
                                                                               NH4 NO3                   1725a       0.68f                1.6 − 0i a
                                                                               (NH4 )2 SO4               1769b       0.52f               1.53 − 0i i
                                                                               NH4 HSO4                  1780c       0.56f               1.47 − 0i c
                                                                               Organics                  1200d        0.1g          1.46 − 0.021i d
                                                                               Black carbon              1800e          0h            1.85 − 0.79i j
                                                                             a Weast (1985), in Morgan et al. (2010). b Penner et al. (1998), in Morgan
                                                                             et al. (2010). c Lowenthal et al. (2003). d Stelson (1990), in Taylor et al.
                                                                             (2015). e Bond and Bergstrom (2006), in Morgan et al. (2010). f Liu et al.
                                                                             (2014). g Suda et al. (2012). h Weingartner et al. (1997), in Jurányi et al.
                                                                             (2010). i Toon et al. (1976), in Morgan et al. (2010). j Bond and
                                                                             Bergstrom (2006).

                                                                       where εi represents the volume fraction of an individual
Figure 1. Map of the Twin Otter flight paths. The box represents
locations where data was used in this analysis to compare with ra-
                                                                       chemical component. This follows from the ZSR mixing rule
diosonde data from the Savè supersite.                                 described by Zdanovskii (1948) and Stokes and Robinson
                                                                       (1966). Once the value of κ has been determined for a given
                                                                       particle and if the RH is known, the relationship shown in
2.1    κ-Köhler theory and the ZSR mixing rule                         Eq. (1) can be used to calculate the particle’s expected HGF.

The single-parameter approach to describing a particle’s               2.2    Ion pairing
propensity to grow hygroscopically proposed by Petters and
Kreidenweis (2007) was employed here. This combines all                The AMS provides a time series of nitrate (NO−    3 ), sulfate
variables that depend on a particle’s chemical composition             (SO2−4  ) and ammonium    (NH +
                                                                                                     4 ) fragments. However,   quan-
into a single parameter, κ. The relationship between the               tities of complete neutral salts are needed in order for the
κ value and the HGF is expressed by Eq. (1):                           ZSR mixing rule described above to be used. Here, moles of
      RH              HGF3 − 1                                         neutral salts were established using the ion pairing scheme
        A
                =                    ,                        (1)      outlined by Gysel et al. (2007), as shown in Eq. (4). Calcu-
exp( Dd HGF )       HGF3 − (1 − κ)                                     lations for H2 SO4 and HNO3 are not included as the aerosol
where RH is the relative humidity expressed as a fraction,             was found to be in charge balance in all cases considered
HGF is the hygroscopic growth factor, Dd is the dry particle           here; the ZSR calculations returned zero for both of these
diameter and                                                           compounds.
    4σs/a Mw
A=           ,                                           (2)             nNH4 NO3 = nNO−
      RT ρw                                                                                     3

where σs/a is the surface tension at the solution–air interface,        nNH4 NSO4 = min(2nSO2− − nNH+ + nNO− , nNH+ − nNO− )
                                                                                                         4              4           3       4           3
Mw is the molar mass of water, R is the universal gas con-             n(NH4 )2 SO4 = max(nNH+ − nNO− − nSO2− , 0)                                          (4)
                                                                                                        4           3           4
stant, T is the absolute temperature and ρw is the density of
water. This equation is solved iteratively.                            2.3    Optical properties
   The value of κ increases with increasing hygroscopicity.
Thus, κ will be 0 for a non-hygroscopic particle, above 1 for          Aerosol optical properties were calculated using a Mie code,
more hygroscopic particles and up to around 1.5 for the most           based on a set of algorithms developed by Yang (2003),
hygroscopic particles such as NaCl. Typically, values for              which uses a supplied refractive index, wavelength of light
continental ambient aerosol fall between 0.1 and 0.4 (Pringle          and aerosol diameter to calculate properties including the ex-
et al., 2010). Values of κ used for the species considered here        tinction coefficient for a multi-layered sphere. The refractive
are listed in Table 1. If ambient aerosol is assumed to be in-         index used here was calculated by considering the weighted
ternally mixed, the κ values of the different components can           sum of the refractive indices of the individual chemical com-
be combined to provide a total κ value for the mixed particle,         pounds in a particle, again assuming volume mixing. This
using Eq. (3):                                                         technique does not account for some effects, including pos-
                                                                       sible lensing effects from the addition of water to particles or
      X
κ=        εi κi ,                                            (3)
       i                                                               the co-condensation of other volatile compounds with water.

Atmos. Chem. Phys., 19, 1505–1520, 2019                                                        www.atmos-chem-phys.net/19/1505/2019/
S. Haslett et al.: Radiative effects from aerosol liquid water 1509
The individual refractive indices of the components consid- Comparing aerosol profiles from different times of day did
ered are shown in Table 1. The effect of absorbed water on not reveal any up- or downwards trend in the aerosol concen-
the refractive indices was taken into account, with the refrac- trations as a function of the time of day, although there was
tive index for water of 1.33 − 0i being used. some variability in mass loadings from one day to the next.
Similarly, there was no evidence in the data for a trend in the
proportional distribution of aerosol species across the diurnal
3 Results cycle. For example, the average organic-to-sulfate ratio var-
ied by less than 10 % across the diurnal cycle. The boundary
3.1 Observations layer aerosol during the DACCIWA campaign was found to
have been significantly influenced by long-distance transport
Figure 2a shows the average chemical composition of sub- from biomass burning in central and southern Africa, which
micron aerosol in the region outlined by the box in Fig. 1. is likely to account for the homogeneity in aerosol properties
Data have been averaged to 500 m bins. Figure 2b shows the observed here. This phenomenon will be explored in future
relative proportions of each chemical species at each altitude work. All DACCIWA flights took place between the hours of
bin. As can be seen from Fig. 2b, the chemical distribution 07:00 and 19:00 and were therefore unable to provide infor-
of aerosol was reasonably constant in this region in the lower mation about potential changes in aerosol properties occur-
five bins, with the overall concentration decreasing with al- ring during the night.
titude. Organic aerosol contributed the largest proportion to As the objective of this work is to examine the effects of
the aerosol loading, making up over 50 % of the total mass. high RH, and given the lack of sufficient evidence in this
SO2−4 was around 20 % in all cases. Black carbon was just dataset suggesting a trend in aerosol concentrations over the
under 15 %. Contributions from NO− +
3 and NH4 were each diurnal cycle, a median aerosol profile and chemical compo-
less than 10 %. This proportional composition changes in sition are used here to explore the effects of changes in RH on
the 3000 m bin, with SO2− 4 becoming the most prominent the AOD. However, it is important to note that the resultant
and the NO− 3 contribution decreasing. It is likely this reflects calculations only provide an indication of the effect of RH on
the composition of aerosol immediately above the boundary the AOD and are unable to capture the true range of AOD that
layer top. However, since this altitude was only flown once would result from including variations in the aerosol loading,
during the morning of 15 July, it cannot be determined how which would scale the resulting AOD linearly.
representative this measurement is of the composition in gen- Figure 4 shows RH measurements from radiosondes re-
eral. If this were to be included in the profile it would only leased from the ground site in Savè. These plots show the
enhance the extinction at the top of the boundary layer, al- mean RH and standard deviations at every 100 m interval up
though the absolute concentrations are very small and make to 3 km, averaged across four times of day. These data show
a limited contribution to the total ambient AOD. a clear diurnal cycle in the RH, with a humid boundary layer
Figure 3 shows the normalised average number and sur- during the night and early morning becoming drier towards
face area size distributions of submicron aerosol in the region noon and into the evening. These features are characteristic
outlined by the box in Fig. 1, as measured by the SMPS on of the Gulf of Guinea maritime inflow (Adler et al., 2017;
board the ATR aircraft. Two distinct size modes can be seen, Deetz et al., 2018b), a coastal air mass that propagates in-
indicating that the region contains smaller, fresher aerosol land in the evening, bringing cool air to the southern West
with a mode at around 60 nm and a large accumulation mode African region. The increase of RH in the evening is mainly
containing more aged aerosol. The smaller Aitken mode was caused by cooling due to this cold air advection (Adler et al.,
highly variable, as can be seen by the large spread in the 2019; Babić et al., 2018). The RH in the pre-frontal region is
data in Fig. 3a. The accumulation mode, however, remained generally around 75 %, while post-frontal RH rises to be al-
present and relatively stable (with an interquartile range of most consistently above 90 % (Deetz et al., 2018a) and leads
±30 % of the median) throughout the campaign. An optical to low-level cloud formation in the night (Adler et al., 2019;
particle counter (Grimm, model 1.109) was present on the Babić et al., 2018).
Twin Otter aircraft during the campaign and did not measure The dataset of RH measurements used here is valuable, as
a significant coarse mode during these flights. We therefore models are often unable to replicate the vertical RH profile
limit this analysis to accumulation mode aerosol only and use (Hannak et al., 2017). This is due to the complex interplay
the extrapolated measured SMPS distribution for the remain- between shallow and deep convection, which changes the
der of this work. vertical distribution of water vapour and clouds. These fac-
Aircraft observations during the DACCIWA campaign pe- tors influence the surface energy budget, which can in turn
riod showed little variation in total aerosol concentration as create deep convection, in a feedback loop. The uptake of
a result of the diurnal cycle (see Fig. 2). When the data were water by aerosol particles adds another layer of complexity
sorted according to the time of day they were observed and to this picture.
considered in 2-hourly time bins, the largest deviation in the The time series panel gives insight into the day-to-day
bin means from the overall campaign mean was around 11 %. variability in RH. Four phases of the 2016 West African
www.atmos-chem-phys.net/19/1505/2019/ Atmos. Chem. Phys., 19, 1505–1520, 20191510 S. Haslett et al.: Radiative effects from aerosol liquid water Figure 2. (a) Average chemical composition of aerosol in the Savè region, as measured by the AMS and SP2 (black carbon). Results are displayed at standard temperature and pressure (STP) and altitude is above sea level (a.s.l.) The centre point indicates the median concentration and the bars the lower and upper quartiles. (b) The percentage contribution of each chemical species in each altitude bin. The 3000 m is shaded as data only exist at this altitude from 1 h on 15 July. monsoon have been defined by Knippertz et al. (2017) and erties of the column. The particles are larger due to the high are delineated by the vertical dashed lines in Fig. 4e. The RH, and these larger particles scatter sunlight more effec- first phase (pre-onset) was characterised by rainfall near the tively. coast, which moved inland during the second phase (post- Ceilometer observations from the DACCIWA ground site onset). This can be seen in the drier start to the period shown in Savè during the campaign have been explored by Babić in Fig. 4e. This was followed by a period of higher humid- et al. (2018). This instrument uses a laser to determine at- ity in phase 2, during which humidities rarely dropped below mospheric backscatter, which allows the determination of 80 %. The final week of the post-onset phase was slightly cloud base. A strong increase in backscatter was noted be- drier than those preceding it, which was associated with a cy- tween 18:00 and 00:00 UTC, which is thought to be related clonic system that passed Savè on 16 July, transporting dry to aerosol hygroscopic growth. The frequently high HGF lay- air northwards (Kalthoff et al., 2018). During phase 3, the ers shown here are consistent with this interpretation. rainfall maximum shifted again back to the coast and dur- The volume of absorbed water at high humidities can make ing phase 4, the recovery of the monsoon, the maximum was a significant difference to the composition and properties of once again found inland. aerosol particles. Figure 6a shows the percentage contribu- Using an average aerosol particle size of 200 nm (as mea- tion of the compounds being considered here to the parti- sured by the SMPS) and assuming an aerosol composition of cle volume at different relative humidities. Above around 52 % organic, 21 % sulfate, 14 % black carbon, 9 % ammo- 80 % RH, water contributes over half of the volume, and nium and 4 % nitrate (see Fig. 2b), it was possible to esti- above around 95 % RH, water contributes more than 80 % to mate the average HGF of particles at each of the altitudes the volume of an individual particle, both growing the par- and times of day in Fig. 4 using the method described in ticle substantially and changing its optical properties. The Sect. 2.1 and 2.2. The value of κ for this composition was decrease in aerosol refractive index as the particles grow is calculated using the method described in Sect. 2.1, assuming illustrated in Fig. 6b. the composition to be the same across the size distribution. This produced a value of κ = 0.22, which is typical for ambi- 3.2 Calculating aerosol optical depths ent aerosol (Pringle et al., 2010). These results are displayed in Fig. 5. The plots show the extent to which the diameter In order to establish the impact of humid layers on column of an average particle would be expected to grow under the optical properties, the sub-3 km aerosol optical depth (AOD) given conditions. The shape of the HGF profiles is governed was calculated for each of the 63 unsaturated radiosonde pro- by the RH statistics shown in Fig. 4. It can be seen that the files taken from the Savè ground site during the DACCIWA sensitivity to changes in RH is more pronounced where the campaign. The steps of the approach used to establish the humidity is high. In drier regions, for example at low alti- AOD are outlined below using a case study RH profile from tudes at 18:00 UTC, reasonably significant variation in RH 8 July at 10:57 UTC (local time = UTC+1 h). This approach produces very little change in particles’ hygroscopic growth. was then applied to all RH profiles in the dataset: This suggests that even thin layers of high RH are likely to 1. Establish the average aerosol profile. The median have a disproportionately large impact on the radiative prop- aerosol mass concentration in the area of interest was Atmos. Chem. Phys., 19, 1505–1520, 2019 www.atmos-chem-phys.net/19/1505/2019/
S. Haslett et al.: Radiative effects from aerosol liquid water                                                                           1511

Figure 3. The (a) number size distribution and (b) volume size distribution of submicron aerosol below 2500 m in the area outlined by the
box in Fig. 1. The dark blue lines show the median size distributions; the darker shading represents data between the 25th and 75th percentiles
(50 % of the data) and the lighter shading data between the 10th and 90th percentiles (80 % of the data). The thick black line represents a
log-normal curve fitted to the accumulation mode. The rapid drop-off at the high end of the surface area distribution is an artefact of the
SMPS size limit.

Figure 4. The mean and standard deviation of relative humidity measurements with altitude at (a) 06:00 UTC (n = 46), (b) 12:00 UTC
(n = 15), (c) 18:00 UTC (n = 20) and (d) 00:00 UTC (n = 15), from radiosondes launched from the Savè ground site. Altitudes are above
ground level (a.g.l.) (e) A time series of the RH at 1000 m. Dashed vertical lines indicate the four different monsoon phases, as defined by
Knippertz et al. (2017). (NB: local time in Benin is UTC+1 h.)

     calculated for each 100 m bin from 300 to 3000 m. Data                     (Aitken and accumulation mode) being identified. In
     were not collected from lower than this within this re-                    terms of aerosol hygroscopicity and changes to optical
     gion, so an average data point from further south was                      properties, the larger mode is the most significant as it
     used here to represent the 200 m bin. The resulting me-                    contains the vast majority of the aerosol surface area and
     dian profile can be seen in Fig. 7, alongside the in-                      is of a size comparable with incoming radiation, making
     terquartile range and 10th to 90th percentiles and the                     it the more optically active size range. The number dis-
     number of flights providing data in each bin. The me-                      tribution is dominated by the small, fresh Aitken mode
     dian profile was used to calculate the AOD for all of the                  aerosol, which shows a large degree of variation but
     radiosonde profiles.                                                       contributes little to the overall optical properties of the
                                                                                aerosol; therefore, the accumulation mode was isolated
  2. Establish an idealised aerosol size distribution at each                   here to calculate optical effects. It can be noted from
     altitude. Figure 3 shows the average aerosol size dis-                     Fig. 3 that there is little variation in the size and shape
     tribution at different altitudes, with two clear modes

www.atmos-chem-phys.net/19/1505/2019/                                                       Atmos. Chem. Phys., 19, 1505–1520, 2019
1512 S. Haslett et al.: Radiative effects from aerosol liquid water
Figure 5. The mean and standard deviation of estimated hygroscopic growth factors at (a) 06:00 UTC, (b) 12:00 UTC, (c) 18:00 UTC and
(d) 00:00 UTC. Where the upper value cannot be seen is where the air became saturated.
Figure 6. (a) The fractional composition of particles at different relative humidities and (b) the effect of the additional water volume on the
particle’s refractive index. These values have been calculated using the ZSR mixing rule.
of the accumulation mode across different altitudes. The of the same shape, but differing amplitudes at each alti-
aerosol frequencies at different diameters generally fall tude.
within around 40 % of one another. This strongly sug-
gests that a reasonably consistent accumulation mode 3. Grow the wet aerosol size distribution. At each altitude
can be expected, which will likely scale with the over- bin, HGFs were used to “grow” the dry size distribution
all aerosol mass. In order to test the assumption that (see Zieger et al., 2013). An HGF was established and
the Aitken mode does not contribute significantly to the applied to each bin in the idealised dry size distribution,
AOD, the relative contribution of the average Aitken which allowed the shape of the new, wet size distribu-
mode aerosol was calculated for a test case. The in- tion to be calculated. An example can be seen in Fig. 8
crease in AOD due to the addition of the Aitken mode for an idealised dry size distribution based on an aerosol
aerosol was approximately 2.5 %. Given its limited con- mass of 10 µg m−3 , assuming an RH of 90 %.
tribution, only the accumulation mode aerosol was con-
4. Calculate AOD. The chemical distribution, including
sidered here.
water, of aerosol particles in each bin of the wet size
distribution was used to calculate particles’ refrac-
The thick black lines in Fig. 3 show log-normal distri- tive indices. Their extinction coefficients were then
butions that have been fitted to the accumulation mode. calculated at λ = 525 nm using Mie code. The total ex-
The mode is at 200 nm. The shape and mode of the dis- tinction coefficient, measured per megametre (Mm−1 ),
tribution were assumed to remain constant across all al- at each altitude was determined by integrating these
titude bins and the amplitude was adjusted according to across the whole wet size distribution. This provides a
the median aerosol mass at a given altitude. This pro- quantification of the extent to which incoming radiation
duced an idealised accumulation mode size distribution would be attenuated at each altitude. Integrating these
Atmos. Chem. Phys., 19, 1505–1520, 2019 www.atmos-chem-phys.net/19/1505/2019/S. Haslett et al.: Radiative effects from aerosol liquid water 1513
Savè ground site. The sun photometer dataset includes 319
measurements taken between 8 June and 29 July 2016 as part
of the DACCIWA field campaign.
There is good general agreement between the AOD values
calculated here and those collected by sun photometer from
the Savè ground site over a similar period. The median AOD
is 0.36 for both datasets. Values of AOD in the early morn-
ing have a larger spread, being reasonably well distributed
between 0.3 and 0.7 in both cases, while AOD later in the
evening in both cases was distributed more normally around
the median. Both datasets have a high tail that is dominated
by data from the mornings and the highest value is around 0.7
in the calculated dataset and 0.8 from the sun photometers.
The assumption of a constant aerosol profile prevents the
model from capturing the full spread that would result from
variations in aerosol loadings. As a result, the sun photome-
ter dataset has a larger interquartile range of 0.14, compared
with 0.09 for the calculated dataset. The minimum value in
the sun photometer dataset was a little less than 0.2, while
that of the calculated dataset was closer to 0.3. This likely
Figure 7. The average aerosol concentration profile from the area of represents days with lower aerosol loadings, which are not
interest. Circles and bars represent the median and the interquartile captured by the model. The calculated dataset is based solely
range, and the grey shading represents all data between the 10th on observations in the lowest 3 km, and as such, any high-
and 90th percentiles. No flights went below 300 m in the dataset level aerosol layers are not taken into account. However, this
used here, so the open circle at 200 m is an estimation based on the does not appear to have significantly biased the calculated
median of data taken from flights further south. The histogram to AODs.
the right shows the number of flights contributing data to each bin. It is important to note that the calculated values here are
not expected to reproduce the real-world AOD for any given
RH profile. A number of values are assumed to be constant
with altitude gives the AOD of the column. In Fig. 9, here, including the shape and magnitude of the aerosol pro-
the total AOD for the example radiosonde RH profile file, the aerosol chemical composition, the shape of the ac-
and the representative aerosol concentration are shown cumulation mode size distribution and simplifications gener-
along with a profile of the dry and wet extinction ally assumed in Mie calculations, such as that particles are
coefficients at each altitude. The total AOD of the wet internally mixed spheres. A realistic calculation would re-
profile in this case is approximately 60 % larger than quire variation in such quantities to be taken into account.
that of the dry profile. This dataset, instead, gives an estimate of the variability in
the AOD measurements that is due entirely to changes in
This example shows the disproportionate contribution RH. Despite this limitation, this approach is able to replicate
towards AOD from layers of high humidity, such as that a large part of the measured AOD frequency distribution; in
highlighted in grey in this example. Although the wet particular, it is able to reproduce the high values of AOD ob-
extinction coefficients are higher than the dry ones at served during the mornings. While the inclusion of aerosol
every altitude, this effect is exaggerated in this humid variation would be necessary in order to recreate the full
layer. spectrum of AODs, there are no observations of aerosol con-
centrations from anywhere across the region that are suffi-
The approach outlined above has been used to calculate the ciently high enough to be the sole cause of the enhancements
AOD for all 63 unsaturated radiosonde RH profiles collected in the ambient AOD observed by sun photometers. Although
from Savè. Figure 10 shows a frequency plot of these calcu- the omission of variations in aerosol properties has resulted
lated AODs, which are coloured according to the time of day in a narrower spread of calculated values compared with di-
the sonde was released (±1 h). These values are calculated rect measurements, these results do show that the highly hu-
purely based on variations in RH. The frequency distribution mid layers are the root cause of the very highest AODs being
therefore quantifies an estimate of the variation in AOD due observed during the mornings.
entirely to RH; it does not show a true estimate of AOD for
each profile, which would require a larger number of varying
parameters. This plot is shown alongside a frequency distri-
bution of the AODs measured by sun photometer from the
www.atmos-chem-phys.net/19/1505/2019/ Atmos. Chem. Phys., 19, 1505–1520, 20191514 S. Haslett et al.: Radiative effects from aerosol liquid water
Figure 8. The dry and wet idealised (a) number and (b) volume size distributions based on an aerosol mass of 10 µg m−3 and an RH of 90 %.
Figure 9. The (a) relative humidity and (b) aerosol concentrations used to calculate AOD, and (c) the profile of dry and wet calculated
extinction coefficients for the case study RH profile example on 8 July. The solid black line shows ground level at Savè. The dashed grey
lines outline the humid layer with RH greater than 95 %. In the third panel, the darker filled shape shows the dry extinction coefficient in the
column and the lighter filled shape shows the wet extinction coefficient.
3.3 The effect of high-humidity layers on AOD high RH are present, this effect becomes more pronounced.
When humid layers with RH higher than 97 % are present,
In the example case study shown in Fig. 9, the humid the wet AOD is more than 1.5 times larger than the dry
layer between 500 and 900 m had a significant effect on AOD; with layers of RH greater than 98 %, the wet AOD
the calculated column AOD. In Fig. 11, the relationship be- can be almost 2 times greater or more than the dry. The use
tween highly humid layers and AOD is explored further. The of f (AODdry ) allows the potential for this value to be scaled
maximum RH below 3 km was used as a simple parame- according to the dry AOD from any aerosol profile.
ter to quantify the presence of humid layers and the level A curve of best fit has been added to Fig. 11 using Igor
of humidity within them for any given profile. The calcu- Pro’s iterative least-squares algorithm. The resulting formula
lated AOD has been plotted here as a function of dry AOD can be used to calculate an estimate of the f (AODdry ) from
(f (AODdry ) = AODwet /AODdry ) against the maximum RH the dry AOD and the maximum RH in the profile (Eq. 5):
for each of the 63 unsaturated RH profiles in Fig. 11. The
RHmax − 100
f (AODdry ) represents how much larger the calculated wet f (AODdry ) = AODdry 1.25 + 1.3 × exp , (5)
1.5
AOD is than the dry AOD, so a value of 1 is equal to the
dry AOD. This figure clearly shows an increase in wet AOD where RH is input as a value between 0 and 100. This is un-
above dry in all cases. However, when layers of extremely likely to be effective for values of RHmax significantly lower
Atmos. Chem. Phys., 19, 1505–1520, 2019 www.atmos-chem-phys.net/19/1505/2019/S. Haslett et al.: Radiative effects from aerosol liquid water 1515
3.4 The effects of aerosol variability
Aerosol profiles have been assumed to be identical in all
cases here. However, these loadings will in reality vary from
day to day, which will have a resulting impact on the AOD.
The extent of this impact can be estimated using the in-
terquartile range of the aerosol measurements in the region,
which are shown in Fig. 2. At all altitudes considered here,
the interquartile range of the total aerosol loading was within
0.5 µg m−3 of 3.4 µg m−3 . This is on average around a 27 %
increase or decrease in the total aerosol population in less or
more polluted circumstances, which would result in a similar
change in the final calculated AOD. The median calculated
AOD was 0.36; in this case, the less and more polluted cir-
cumstances would result in calculated AOD values of 0.26
and 0.46 respectively. This is a significant alteration in the
final value and explains the broader range of AODs observed
by the sun photometers.
The AOD scales directly with the aerosol loading, but
scales exponentially with increases in RH. Therefore, the ef-
Figure 10. The frequency distributions of calculated AODs from ra- fects of a humid layer on a day that is more polluted than
diosonde RHs, and AODs observed by sun photometers over Savé
average could have an even larger effect than those shown
during the DACCIWA campaign. Bars shown here are stacked. Val-
ues have not been calculated for 00:00 UTC as this is during the
here. The highest AOD values calculated in this study are
night. around 0.7; this could scale to almost 0.9 if a day is among
the 25 % most polluted. As anthropogenic emissions in the
region increase, the number of days reaching these very high
than those explored here. The factor of 1.25, which implies AOD values will increase. Furthermore, increased industrial-
an f (AODdry ) greater than the dry AOD when RH = 0, is isation can result in a higher proportion of inorganic, highly
likely an artefact created by the use of only the maximum hygroscopic aerosol particles being produced (e.g. Morgan
value of RH for each RH profile. This empirical relationship et al., 2009), which will exacerbate these effects.
could be useful for models that have no detailed treatment of These results suggest that the impact of highly humid lay-
aerosol chemistry. ers on AOD, especially on days with high aerosol loadings,
The frequency distribution displayed in Fig. 11 shows that could be similar to that of low-level cloud. Capturing the
the RH reaches these high values a significant proportion of presence of cloud in the region using satellites and other re-
the time. Of the RH profiles gathered from Savé, 23 % in- mote sensing techniques is known to be difficult in the south-
cluded layers below 3 km that were unsaturated but contained ern West African region; the detection of these sub-saturated
layers of greater than 98 % humidity. This represents 37 % of humid layers adds an additional challenge. Nonetheless, it is
the total number of unsaturated profiles. important for their presence to be taken into account if the
A model-based study of aerosol liquid water content dur- radiation balance in the region is to be fully understood.
ing the DACCIWA field campaign, carried out by Deetz et al. Due to the irregular nature of aircraft data and the focus of
(2018a), found a mean dry AOD of 0.2 in southern West this study on the impacts of RH, a number of limitations to
Africa, which increased to 0.7 when hygroscopic growth was the scope of this study must be acknowledged. First, results
taken into account. This mean dry aerosol is comparable with shown here are based on observations of aerosol from the
the dry AOD calculated here (0.25). The increase in AOD lowest 3 km of the atmosphere. In reality, some aerosol will
due to hygroscopic growth found here was slightly smaller: exist at higher altitudes. For example, intrusions of biomass
the median AOD calculated here was 0.36 (mean = 0.39) and burning are known to become advected into this region reg-
the median of the measured AOD from the sun photometers ularly between 3 and 4 km at this time of year (Mari et al.,
was 0.36 (mean = 0.38). The study by Deetz et al. (2018a) 2008). Second, the focus on accumulation mode aerosol nec-
considered a larger area, including regions further south and essarily excludes the impact from other size modes from the
closer to the sea, which could explain the higher modelled calculations. Although very little coarse mode aerosol was
hygroscopic growths in that study. observed by the Twin Otter aircraft during the DACCIWA
campaign, it must be noted that any present aerosol in this
mode would increase the region’s AOD. The Twin Otter flew
above 2750 m only once, but at this time, a higher concentra-
tion of sulfate aerosol was observed that this altitude. If this
www.atmos-chem-phys.net/19/1505/2019/ Atmos. Chem. Phys., 19, 1505–1520, 20191516 S. Haslett et al.: Radiative effects from aerosol liquid water
Figure 11. (a) The relationship between calculated AOD and the maximum sub-3 km RH in a profile, and (b) the frequency distribution of
maximum unsaturated sub-3 km RH values. Bars in (b) are stacked.
data point is representative of the altitude in general, then it observations at Savè using sun photometers. The shape of the
is likely that this study has underestimated the HGF at the AOD frequency distribution from the calculations was com-
higher altitudes. All of these factors together suggest that parable to that from sun photometer measurements, although
the AOD calculations provided here are likely to represent there was a greater spread in the sun photometer data due
a lower limit. to variations in aerosol concentration. It was shown that the
modest variations in aerosol properties observed cannot give
rise to the elevated AOD alone. It is the large variations in
4 Summary and conclusions RH that are required to account for many of the higher AOD
measurements.
Aircraft and radiosonde data collected during the DACCIWA The calculated dry AOD using the representative aerosol
field campaign were used to estimate the hygroscopic growth profile was 0.25. In all cases, the wet AOD was found to be
of aerosols under different RH conditions, based on aerosol at least 25 % greater than the AOD for dry particles, showing
chemical composition and using the ZSR mixing rule. A con- the substantial impact of hygroscopic growth on optical prop-
sistent aerosol composition and vertical profile was assumed erties. The rate of change of AOD with changes in RH was
across the region of interest, due to the relative homogeneity greater at higher RH. In particular, at values of RH greater
of aerosol observations from the Twin Otter aircraft in the re- than 98 %, the wet AOD was more than twice as large as the
gion. The RH profiles displayed a diurnal cycle, with higher dry AOD. This scenario occurred regularly in the field RH
RH generally observed during the night and early morning measurements, with 37 % of unsaturated profiles featuring a
and drier conditions in the afternoon. These are features as- humid layer of at least 98 % RH. These results are consis-
sociated with the Gulf of Guinea maritime inflow, described tent with model results presented by Deetz et al. (2018a),
by Adler et al. (2017) and Deetz et al. (2018b), which brings who found that hygroscopic growth increased the AOD in
cool air inland in the evening (Adler et al., 2019; Babić et al., the southern West African region from a dry value of 0.2 to
2018). Day-to-day variability was influenced by the different a wet value of 0.7.
phases of the West African monsoon (Knippertz et al., 2017), While aerosol loadings were assumed here to be constant,
which resulted in slightly more frequent high RH values dur- aircraft measurements in fact showed an interquartile range
ing the first few weeks of July. of ±27 %. Taking this variation into account would result in
By assuming a constant aerosol composition and vertical the average AOD varying between 0.26 and 0.46. It is im-
profile, it was possible to explore the effects of variations in portant to note that the increase in AOD due to an increase in
RH on the optical properties of aerosol in the region. Dry aerosol loading is linear, while that resulting from an increase
aerosol size distributions were grown according to the HGF, in RH is exponential. Thus, the presence of highly humid lay-
which had been calculated from the RH and the average ers in the column will substantially enhance any effect from
chemical composition. Mie code was then used to calculate increased aerosol loading. The highest AOD values would
extinction coefficients at λ = 525 nm. This allowed AODs to not be possible without this RH enhancement. Satellite-based
be calculated for each of 63 unsaturated RH profiles. retrievals of surface aerosol concentrations might thus be
The median AOD resulting from these calculations was highly biased when humid layers are present.
0.36. This compares with a median AOD of 0.36 found from
Atmos. Chem. Phys., 19, 1505–1520, 2019 www.atmos-chem-phys.net/19/1505/2019/S. Haslett et al.: Radiative effects from aerosol liquid water 1517
These results show that the presence of highly humid lay- References
ers during the monsoon season has a substantial impact on
the direct radiative effect of aerosols in the southern West Adler, B., Kalthoff, N., and Gantner, L.: Nocturnal low-level
African region. Furthermore, as anthropogenic emissions clouds over southern West Africa analysed using high-
resolution simulations, Atmos. Chem. Phys., 17, 899–910,
from large cities in coastal West Africa increase and industri-
https://doi.org/10.5194/acp-17-899-2017, 2017.
alisation increases the inorganic fraction, these humid layers Adler, B., Babić, K., Kalthoff, N., Lohou, F., Lothon, M.,
will serve to amplify their effects. While detecting these lay- Dione, C., Pedruzo-Bagazgoitia, X., and Andersen, H.: Noc-
ers and quantifying their effects on an ongoing basis is likely turnal low-level clouds in the atmospheric boundary layer
to provide a significant challenge for the research commu- over southern West Africa: an observation-based analysis of
nity, results shown here suggest that this will be necessary if conditions and processes, Atmos. Chem. Phys., 19, 663–681,
the radiation balance in the region is to be understood. https://doi.org/10.5194/acp-19-663-2019, 2019.
Aklilu, Y., Mozurkewich, M., Prenni, A. J., Kreidenweis, S. M.,
Alfarra, M. R., Allan, J. D., Anlauf, K., Brooks, J., Leaitch,
Data availability. All data used in this study are publicly available W. R., Sharma, S., Boudries, H., and Worsnop, D. R.: Hygro-
on the SErvice de DOnnées de l’OMP (SEDOO) database (Derrien scopicity of particles at two rural, urban influenced sites dur-
et al., 2016; Handwerker et al., 2016; Kohler et al., 2016; Wieser et ing Pacific 2001: Comparison with estimates of water uptake
al., 2016), which can be found at http://baobab.sedoo.fr/DACCIWA from particle composition, Atmos. Environ., 40, 2650–2661,
(last access: 1 February 2019). https://doi.org/10.1016/j.atmosenv.2005.11.063, 2006.
Babić, K., Adler, B., Kalthoff, N., Andersen, H., Dione, C., Lo-
hou, F., Lothon, M., and Pedruzo-Bagazgoitia, X.: The observed
Author contributions. SLH, JWT, KB, NK, AW, CD, FL, JB, RD diurnal cycle of nocturnal low-level stratus clouds over south-
and AS were involved in the collection, processing and analysis of ern West Africa: a case study, Atmos. Chem. Phys. Discuss.,
aircraft and ground site data during the DACCIWA campaign. SLH https://doi.org/10.5194/acp-2018-776, in review, 2018.
carried out the analysis for this study, with significant input from Bond, T. C. and Bergstrom, R. W.: Light Absorption by Carbona-
JWT, KD, BV, PZ and HC. The paper was prepared by SLH and all ceous Particles: An Investigative Review, Aerosol Sci. Tech., 40,
authors contributed to discussion and revision of the paper. 27–67, https://doi.org/10.1080/02786820500421521, 2006.
Boucher, O., Randall, D., Artaxo, P., Bretherton, C., Feingold, G.,
Forster, P., Kerminen, V.-M., Kondo, Y., Liao, H., Lohmann, U.,
Rasch, P., Satheesh, S. K., Sherwood, S., Stevesn, B., and Zhang,
Competing interests. The authors declare that they have no conflict
X. Y.: Clouds and aerosols, in: Clim. Chang. 2013 Phys. Sci.
of interest.
Basis. Contrib. Work. Gr. I to Fifth Assess. Rep. Intergov. Panel
Clim. Chang., edited by: Stocker, T. F., Qin, D., Plattner, G.-K.,
Tignor, M., Allen, S. K., Boschung, J., Nauels, A., Xia, Y., Bex,
Special issue statement. This article is part of the special issue “Re- V., and Midgley, P. M., Cambridge University Press, Cambridge,
sults of the project “Dynamics–Aerosol–Chemistry–Cloud Interac- United Kingdom and New York, NY, USA, chap. 7, 571–657,
tions in West Africa” (DACCIWA) (ACP/AMT inter-journal SI)”. 2013.
It is not associated with a conference. Brito, J., Freney, E., Dominutti, P., Borbon, A., Haslett, S. L., Baten-
burg, A. M., Colomb, A., Dupuy, R., Denjean, C., Burnet, F.,
Bourriane, T., Deroubaix, A., Sellegri, K., Borrmann, S., Coe,
Acknowledgements. The research leading to these results has H., Flamant, C., Knippertz, P., and Schwarzenboeck, A.: As-
received funding from the European Union 7th Framework sessing the role of anthropogenic and biogenic sources on PM1
Programme (FP7/2007-2013) under grant agreement no. 603502 over southern West Africa using aircraft measurements, Atmos.
(EU project DACCIWA: Dynamics–Aerosol–Chemistry–Cloud Chem. Phys., 18, 757–772, https://doi.org/10.5194/acp-18-757-
Interactions in West Africa). The lead author was supported by the 2018, 2018.
NERC Doctoral Training Programme (grant ref: NE/L002469/1). Canagaratna, M., Jayne, J., Jimenez, J., Allan, J., Alfarra, M.,
Thanks to the German Weather Service (DWD) for providing Zhang, Q., Onasch, T., Drewnick, F., Coe, H., Middlebrook, A.,
access to the ICON forecast data. We thank British Antarctic Delia, A., Williams, L., Trimborn, A., Northway, M., DeCarlo, P.,
Survey (BAS, operator of the Twin Otter aircraft), the Service des Kolb, C., Davidovits, P., and Worsnop, D.: Chemical and micro-
Avions Français Instrument’s pour la Recherche en Environnement physical characterization of ambient aerosols with the aerodyne
(SAFIRE) and the Deutsches Zentrum für Luft- und Raumfahrt for aerosol mass spectrometer, Mass Spectrom. Rev., 26, 185–222,
their support during the aircraft campaign. https://doi.org/10.1002/mas.20115, 2007.
Chen, J., Zhao, C. S., Ma, N., Liu, P. F., Göbel, T., Hallbauer, E.,
Edited by: Dominick Spracklen Deng, Z. Z., Ran, L., Xu, W. Y., Liang, Z., Liu, H. J., Yan,
Reviewed by: two anonymous referees P., Zhou, X. J., and Wiedensohler, A.: A parameterization of
low visibilities for hazy days in the North China Plain, At-
mos. Chem. Phys., 12, 4935–4950, https://doi.org/10.5194/acp-
12-4935-2012, 2012.
Deetz, K., Vogel, H., Haslett, S., Knippertz, P., Coe, H., and Vo-
gel, B.: Aerosol liquid water content in the moist southern West
www.atmos-chem-phys.net/19/1505/2019/ Atmos. Chem. Phys., 19, 1505–1520, 2019You can also read