Cloud macro-physical properties in Saharan-dust-laden and dust-free North Atlantic trade wind regimes: a lidar case study - DLR
←
→
Page content transcription
If your browser does not render page correctly, please read the page content below
Atmos. Chem. Phys., 19, 10659–10673, 2019
https://doi.org/10.5194/acp-19-10659-2019
© Author(s) 2019. This work is distributed under
the Creative Commons Attribution 4.0 License.

Cloud macro-physical properties in Saharan-dust-laden and
dust-free North Atlantic trade wind regimes: a lidar case study
Manuel Gutleben, Silke Groß, and Martin Wirth
Institut für Physik der Atmosphäre, Deutsches Zentrum für Luft- und Raumfahrt (DLR), 82234 Weßling, Germany

Correspondence: Manuel Gutleben (manuel.gutleben@dlr.de)

Received: 11 January 2019 – Discussion started: 5 February 2019
Revised: 15 July 2019 – Accepted: 26 July 2019 – Published: 23 August 2019

Abstract. The Next-generation Aircraft Remote-Sensing for           cloud top heights with increasing dust layer vertical extent as
Validation Studies (NARVAL) aimed at providing a better             well as aerosol optical depth is found.
understanding of shallow marine trade wind clouds and their
interplay with long-range-transported elevated Saharan dust
layers over the subtropical North Atlantic Ocean. Two air-
borne campaigns were conducted – the first one in Decem-            1   Introduction
ber 2013 (winter) and the second one in August 2016, the
latter one during the peak season of transatlantic Saharan          Saharan dust represents one of the main contributors to the
dust transport (summer). In this study airborne lidar mea-          atmospheres’ primary aerosol load. Huneeus et al. (2011)
surements in the vicinity of Barbados performed during both         estimate that every year 400–1000 Tg of Saharan mineral
campaigns are used to investigate possible differences be-          dust is mobilized and transported over the North Atlantic
tween shallow marine cloud macro-physical properties in             Ocean within an elevated atmospheric layer: the so-called
dust-free regions and regions comprising elevated Saharan           Saharan air layer (SAL; Carlson and Prospero, 1972; Pros-
dust layers as well as between different seasons. The cloud         pero and Carlson, 1972). Transatlantic Saharan dust trans-
top height distribution derived in dust-laden regions differs       port shows its maximum during the northern hemispheric
from the one derived in dust-free regions and indicates that        summer (Prospero and Lamb, 2003). In this period dust
there are less and shallower clouds in the dust-laden than in       particles are frequently transported westwards and arrive
dust-free trades. Additionally, a clear shift of the distribution   in the Caribbean after approximately 5 d (transport speed:
to higher altitudes is observed in the dust-free winter season,     1000 kmd−1 ; Huang et al., 2010). Sometimes Saharan dust
compared to the summer season. While during the summer              is even transported as far as the coast of Mexico and Florida
season most cloud tops are observed in heights ranging from         (Colarco, 2003; Wong et al., 2006).
0.5 to 1.0 km, most cloud tops in winter season are detected           During its long-range transport the SAL affects the Earth’s
between 2.0 and 2.5 km. Moreover, it is found that regions          radiation budget in two different ways. First, mineral dust
comprising elevated Saharan dust layers show a larger frac-         aerosols may act as ice-nucleating particles (INPs) or cloud
tion of small clouds and larger cloud-free regions, compared        condensation nuclei (CCN – only when being internally
to dust-free regions. The cloud fraction in the dust-laden          mixed with soluble material) in water and ice clouds, hence
summer trades is only 14 % compared to a fraction of 31 %           influencing cloud microphysics – this effect is referred to as
and 37 % in dust-free trades and the winter season. Drop-           “indirect” mineral dust aerosol effect (Twomey, 1974, 1977;
sonde measurements show that long-range-transported Saha-           Karydis et al., 2011; Bègue et al., 2015; DeMott et al., 2015;
ran dust layers come along with two additional inversions           Boose et al., 2016). Thus, cloud formation, lifetime and oc-
which counteract convective development, stabilize the strat-       currence as well as precipitation and ice formation may be
ification and may lead to a decrease in convection in those         manipulated by Saharan dust deposition into the cloud layer
areas. Moreover, a decreasing trend of cloud fractions and          (Mahowald and Kiehl, 2003; Seifert et al., 2010). Secondly,
                                                                    dust particles absorb and scatter solar radiation during day-

Published by Copernicus Publications on behalf of the European Geosciences Union.
10660                                           M. Gutleben et al.: Lidar measurements of cloud macro-physical properties

time and emit thermal radiation during nighttime. This so-            Satellites with an active remote sensing payload, e.g., the
called “direct” mineral dust radiative effect modifies the at-     Cloud-Aerosol Lidar and Infrared Pathfinder Satellite Ob-
mospheric temperature profile and impacts the evolution of         servation (CALIPSO; Winker et al., 2010) and CloudSat
atmospheric stratification, sea surface temperature, and cloud     (Stephens et al., 2002), provide vertically highly resolved
development (Carlson and Benjamin, 1980; Lau and Kim,              measurements of aerosol and cloud properties with nearly
2007).                                                             global coverage (Liu et al., 2008; Medeiros et al., 2010).
   A large number of field campaigns aimed at getting a bet-       Up to now, studies based on active remote-sensing satellite
ter understanding of the SAL as well as its interaction with       data with focus on cloud macro-physical properties concen-
clouds. The most extensive measurement series has proba-           trated on long-term and large-scale observations, e.g., low-
bly been performed within the Saharan Mineral Dust Experi-         latitude boundary layer cloud cover (Medeiros et al., 2010),
ment series SAMUM-1 (Heintzenberg, 2009) and SAMUM-                as the sensitivity of those instruments is too low to detect
2 (Ansmann et al., 2011) followed by the Saharan Aerosol           shallow marine clouds with high resolution. The upcom-
Long-range Transport and Aerosol-Cloud-Interaction Exper-          ing EarthCARE (Earth Clouds, Aerosols and Radiation Ex-
iment (SALTRACE; Weinzierl et al., 2017). Within this se-          plorer) satellite mission which is planned to be launched
ries of closure experiments, which included airborne and           in 2021 (Illingworth et al., 2015) might change that in fu-
ground-based in situ and remote sensing measurements as            ture due to its unique payload: a combination of lidar (at-
well as modeling efforts, microphysical, chemical and radia-       mospheric lidar – ATLID) and cloud profiling radar (CPR).
tive properties of dust were investigated at the beginning of      However, from spaceborne remote sensing in general it is
its long-range transport near the source regions as well as        hard to get an accurate aerosol retrieval during daylight con-
after its long-range transport in the vicinity of Barbados. Al-    ditions, which makes it difficult to study the interplay of SAL
though the interaction of Saharan dust layers and clouds has       and clouds.
already been a focus during these campaigns and other stud-           In addition to satellite observations, measurements from
ies, e.g., by investigating glaciation of mixed-phase clouds       long-range research aircraft provide a valuable alternative
(Ansmann et al., 2008; Seifert et al., 2010) or by explor-         to study the problem at hand. One such platform is the
ing the relationship between shallow cumulus precipitation         German High Altitude and Long Range Research Aircraft
rates and radar measurements in dust-laden and dust-free en-       HALO (Krautstrunk and Giez, 2012). With HALO it is possi-
vironments (Lonitz et al., 2015), the impact of long-range-        ble to perform measurements over both SAL-influenced and
transported elevated Saharan dust on cloud macro-physical          clear trade wind regions within the very same flight. Dur-
properties of subjacent trade wind clouds has not been stud-       ing the NARVAL field campaigns (Next-generation Aircraft
ied.                                                               Remote-Sensing for Validation Studies) HALO was used as
   Due to their occurrence at remote locations over the sub-       a flying aerosol and cloud observatory (Stevens et al., 2019).
tropical North Atlantic Ocean, it is difficult to study undis-     For this purpose it was equipped with a combined active and
turbed trade wind cloud regimes and their interplay with Sa-       passive remote sensing payload, including a radar and a li-
haran air layers in the course of field campaigns with lim-        dar system. In addition, dropsondes were deployed to get
ited spatial coverage. Satellite measurements can of course        information on the thermodynamic state of the atmosphere.
provide information in these regions. Dunion and Velden            The sensitivity of the radar system is not high enough to de-
(2004) used Geostationary Operational Environmental Satel-         tect small-scale shallow cumulus clouds as well as aerosol
lite (GOES) infrared imagery to study the structural and           layers. This is why this study only focuses on the retrieval
dynamical characteristics of the SAL. Wong and Dessler             of horizontal and vertical distributions of both aerosols and
(2005) used MODIS (Moderate Resolution Imaging Spec-               clouds from lidar measurements performed during the NAR-
troradiometer) satellite data to study the effect of the SAL       VAL field campaigns to study the impact of the SAL on
on deep convection. Both studies found a suppressing effect        subjacent marine cloud macro-physical properties (i.e., cloud
of the SAL on deep convection and tropical cyclone activity.       fraction, cloud top height, cloud length).
Wong and Dessler (2005) suggest that the convection barrier           Section 2 gives an overview of the NARVAL campaign
increases with SAL optical depth, especially over the east-        series and a description of the employed lidar instrument. In
ern North Atlantic Ocean. They argue that the warmer and           Sect. 3 the general measurement situation during NARVAL
dryer air associated with the SAL raises the lifting condensa-     is discussed and a detailed overview of the results is given.
tion level as well as the level of free convection and therefore   Moreover, the results are discussed and related to findings of
increases the energetic barrier to convection. These findings      other studies. A short summary along with the conclusion of
also suggest a suppression of shallow marine cloud develop-        this paper is presented in Sect. 4.
ment due to long-range-transported Saharan dust. Neverthe-
less, vertically resolved observations of suppressed marine
cloudiness below long-range-transported layers of Saharan
dust over the Atlantic Ocean are missing so far.

Atmos. Chem. Phys., 19, 10659–10673, 2019                                          www.atmos-chem-phys.net/19/10659/2019/
M. Gutleben et al.: Lidar measurements of cloud macro-physical properties 10661
2 Instruments and methods
2.1 NARVAL
In December 2013 and August 2016 the Next-generation
Aircraft Remote-Sensing for Validation Studies (NARVAL;
Klepp et al., 2014; Stevens et al., 2019) were conducted to
study the occurrence and formation of marine clouds during
the subtropical North Atlantic dry and wet seasons. As Saha-
ran dust transportation over the Atlantic Ocean occurs quite
frequently in northern hemispheric summer months, mea-
surements were also dedicated to investigate the influence of
the SAL on underlying shallow trade wind clouds.
During both NARVAL-I-South (here for simplicity re-
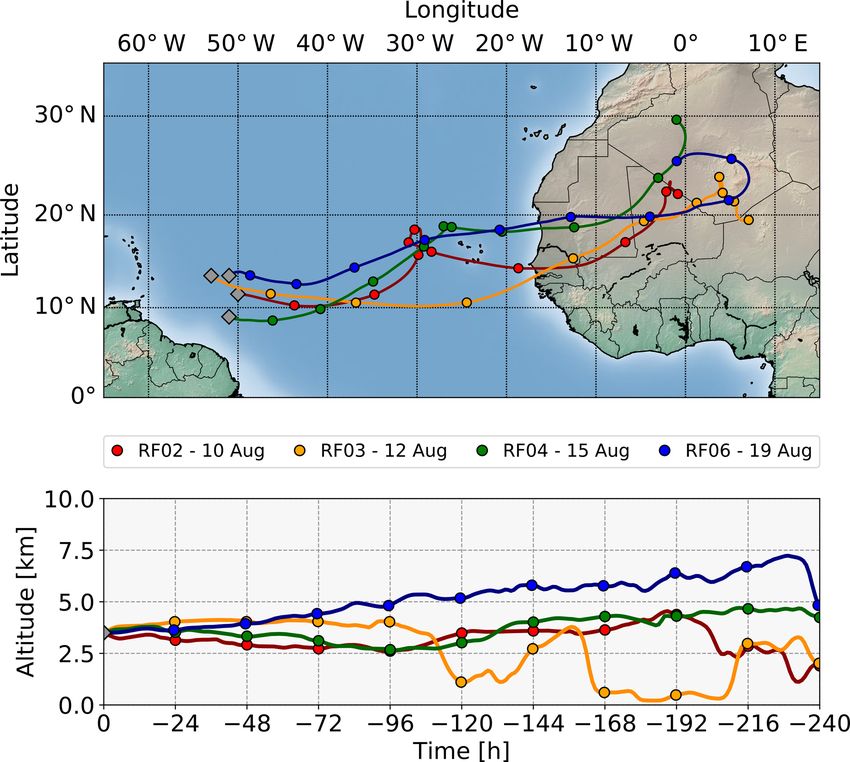
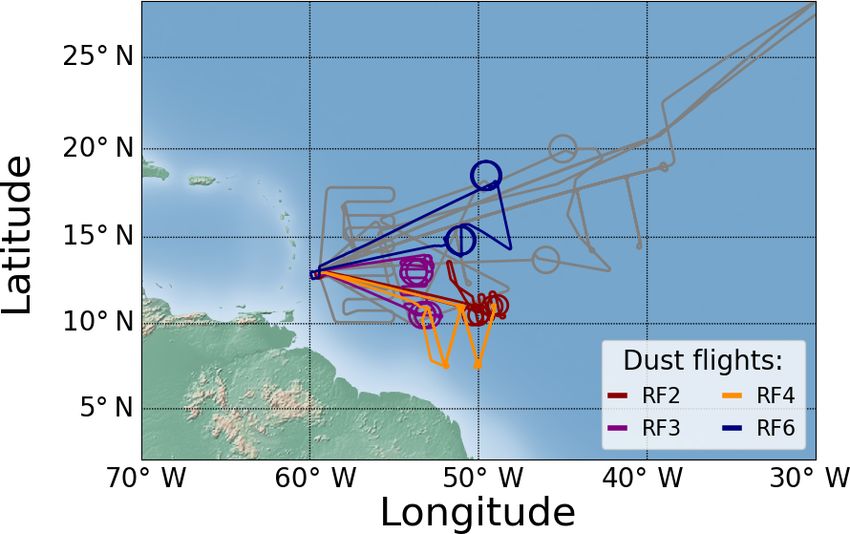
ferred to as NARVAL-I) and NARVAL-II, HALO was op- Figure 1. NARVAL research flight tracks: NARVAL-II dust-flights
(color coded) and NARVAL-I and NARVAL-II dust-free flights
erated eastward of Barbados. The aircraft has a maxi-
(grey).
mum range of more than 12 000 km and certified ceil-
ing of 15.545 km altitude (max altitudes: NARVAL-I: ∼
14 km; NARVAL-II: ∼ 15 km). During both campaigns it
In summary, 38 h of measurements during the summer sea-
was equipped with a combined active and passive remote
son (22 h of lidar measurements during dust-free times, 16 h
sensing payload including the lidar system WALES (Wirth
of lidar measurements with SAL present) and 44 h of mea-
et al., 2009), a 35.2 GHz cloud radar (Ewald et al., 2019), mi-
surements during the winter season are used to study differ-
crowave radiometers (Mech et al., 2014), a hyper spectral im-
ences in macro-physical cloud properties between the dust
ager (Ewald et al., 2016) and the Spectral Modular Airborne
and non-dust times and different seasons.
Radiation measurement System (SMART) instrument for ra-
diation measurements (Wendisch et al., 2001). Additionally
2.2 The WALES instrument
a large number of dropsondes were deployed to get informa-
tion on the atmospheric state (NARVAL-I: 71; NARVAL-II: The WALES instrument (Wirth et al., 2009) is a combined
218). airborne high spectral resolution (HSRL; Esselborn et al.,
From 8 to 30 August 2016, 10 research flights (RF) com- 2008) and water vapor differential absorption lidar system
prising a total of 85 flight hours were conducted (Fig. 1). (DIAL), built and operated by the Institute for Atmospheric
During four of those flights, flight patterns were specifically Physics of the German Aerospace Center (DLR). The system
designed for an investigation of Saharan air layers and their provides highly resolved information on the vertical distribu-
impact on subjacent marine trade wind cloud regimes. More- tion of water vapor mixing ratio from measurements at four
over, studying the large-scale atmospheric divergence was a wavelengths around 935 nm. Additionally, it is capable of
main objective of the campaign (Bony and Stevens, 2019). polarization-sensitive measurements at the 1064 and 532 nm
This is why the flight patterns show many circles, i.e., dur- wavelengths. The 532 nm channel is also equipped with high-
ing RF2, RF3, RF6–8 and RF10. Table 1 gives a detailed spectral-resolution lidar (HSRL) capability, which allows to
overview of all performed NARVAL-II research flights in- determine the extinction coefficient without assumption on
cluding the main research objectives. scattering properties of aerosol and cloud particles, hence en-
This study focuses on the dust-laden research flights RF2, abling an enhanced characterization of them.
RF3, RF4 and RF6 of NARVAL-II. Cloud macrophysi- WALES measurements are performed in near-nadir di-
cal properties measured during those flights are compared rection (2–3◦ off-nadir angle) and provide vertical profiles
to properties observed during dust-free NARVAL-II flights. of particle backscatter, linear depolarization and extinction
Datasets obtained during the NARVAL-II transfer flights from the aircraft down to the ground level. The vertical res-
from and to Germany (i.e., RF1 and RF10) are not included olution of the WALES aerosol and cloud data is 15 m. The
in the analysis because most measurements took place out- temporal resolution of the raw data is 5 Hz and is averaged to
side the trades and cirrus fields were present inside the trades. 1 Hz for a better signal-to-noise ratio. This results in a hor-
RF5 and RF7 are also excluded because cirrus fields covered izontal resolution of approximately 200 m at typical aircraft
most of the research area during RF5 and the objective of speed.
RF7 was to cross the Intertropical Convergence Zone (ITCZ) Depolarization data quality is ensured by frequent calibra-
for several times. NARVAL-I lidar measurements inside the tions following the ±45◦ method described by Freudenthaler
trades (10–20◦ N) are used to compare obtained results from et al. (2009). Remaining relative uncertainties in aerosol de-
the 2016 summer season to the 2013 winter season. polarization measurements are estimated to be in the range
from 10 % to 16 % (Esselborn et al., 2008) and are primarily
www.atmos-chem-phys.net/19/10659/2019/ Atmos. Chem. Phys., 19, 10659–10673, 2019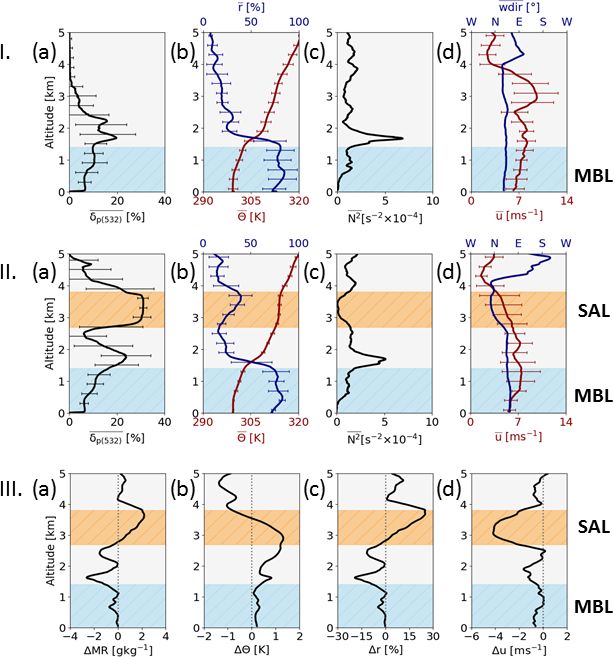
10662                                              M. Gutleben et al.: Lidar measurements of cloud macro-physical properties

Table 1. Overview of the conducted research flights during NARVAL-II in 2016 including dates, times of takeoff and landing, total duration
of flights, research objectives, and flight hours in SAL regions (all times given in UTC; note Atlantic standard time is UTC−4; TBPB:
Grantley Adams International Airport; EDMO: Airport Oberpfaffenhofen).

      Flight no.   Date           Takeoff (UTC)     Landing (UTC)      Total duration   Research objective                     Dust
      RF1          8 August      08:12 (EDMO)        18:51 (TBPB)             10:39 h   Transfer flight                            –
      RF2          10 August      11:52 (TBPB)       20:02 (TBPB)             08:10 h   Dust/no-dust flight and divergence   ∼ 2.3 h
      RF3          12 August      11:43 (TBPB)       19:37 (TBPB)             07:54 h   Dust flight/divergence               ∼ 6.5 h
      RF4          15 August      11:47 (TBPB)       19:46 (TBPB)             07:59 h   Dust/no-dust flight                  ∼ 2.7 h
      RF5          17 August      14:47 (TBPB)       23:08 (TBPB)             08:21 h   Satellite validation                       –
      RF6          19 August      12:28 (TBPB)       20:52 (TBPB)             08:24 h   Dust/no-dust flight and divergence   ∼ 4.5 h
      RF7          22 August      13:16 (TBPB)       20:57 (TBPB)             07:41 h   ITCZ/divergence                            –
      RF8          24 August      12:43 (TBPB)       20:55 (TBPB)             08:12 h   Tropical storm Garcon/divergence           –
      RF9          26 August      13:43 (TBPB)       20:54 (TBPB)             07:11 h   Tropical storm Garcon                      –
      RF10         30 August      09:42 (TBPB)      19:52 (EDMO)              10:10 h   Transfer flight/divergence                 –

                                                                        2009; Tesche et al., 2009; Groß et al., 2011). This value does
                                                                        not change for long-range-transported Saharan dust (Wieg-
                                                                        ner et al., 2011; Burton et al., 2015; Groß et al., 2015; Haarig
                                                                        et al., 2017). Thus δp532 is a good proxy to distinguish long-
                                                                        range-transported Saharan dust from less depolarizing ma-
                                                                        rine boundary layer aerosols which typically take values
                                                                        around 3 % (Sakai et al., 2010; Burton et al., 2012; Groß
                                                                        et al., 2013). To reduce signal noise biases, an additional filter
                                                                        to flag mineral dust layers for regions with 532 nm backscat-
                                                                        ter ratios (BSR532 ) equal to or higher than 1.2 is applied
                                                                        (BSR532 = 1 + βp532 /βm532 – where βp532 and βm532 are the
                                                                        particle and molecular backscatter coefficients). The origin
                                                                        of identified dust layers is further verified using calculated
                                                                        backward trajectories utilizing the HYbrid Single Particle
                                                                        Lagrangian Integrated Trajectory model (HYSPLIT model;
                                                                        Stein et al., 2015) with NCEP GDAS (National Centers for
                                                                        Environmental Prediction Global Data Assimilation System)
                                                                        data input. Starting times and locations are chosen to match
                                                                        the center of detected mineral dust layers in the lidar pro-
Figure 2. The 10 d backward trajectories with starting points at the    files. The reliability of the backward trajectory calculations
center of the respective Saharan air layers for the four NARVAL-II
                                                                        was checked by slightly modifying starting times and loca-
research flights leading over Saharan-dust-laden trade wind regions
(RF2, RF3, RF4 and RF6).
                                                                        tions.
                                                                           Once verified as transported Saharan dust layer, the
                                                                        WALES HSRL measurements are used to calculate the
caused by atmospheric variations during the calibration. For            aerosol optical depth at 532 nm of both the detected Saharan
backscatter and extinction measurements relative uncertain-             dust layers (τSAL(532) ) and the atmospheric column ranging
ties of less than 5 % and 10 %–20 % have to be considered,              from the aircraft down to ground level (τtot(532) ). Addition-
respectively.                                                           ally, the Saharan dust layer’s vertical extent 1zSAL is defined
                                                                        as the sum of all dust-flagged 15 m resolved height intervals
2.3   Dust layer detection                                              within each vertical lidar profile.

Based on the aerosol classification scheme described by Groß            2.4    Lidar-derived cloud macro-physical properties
et al. (2013), WALES measurements can be used to iden-
tify and characterize layers of long-range-transported Saha-            Lidar-derived cloud detection is usually performed using
ran dust. In this study the particle linear depolarization ra-          fixed signal thresholds (e.g., Medeiros et al., 2010; Nuijens
tio at 532 nm (δp532 ) is used as an indicator for nonspher-            et al., 2009, 2014) or by applying wavelet covariance meth-
ical dust particles. Saharan dust δp532 near-source regions             ods for the detection of sharp gradients to the backscattered
was found to take values around 30 % (Freudenthaler et al.,             signal (Gamage and Hagelberg, 1993). During NARVAL-II

Atmos. Chem. Phys., 19, 10659–10673, 2019                                                www.atmos-chem-phys.net/19/10659/2019/
M. Gutleben et al.: Lidar measurements of cloud macro-physical properties 10663 Figure 3. Overview of the four NARVAL-II research flights leading over Saharan-dust-laden trade wind regions. (a) Cross sections of measured BSR at 532 nm and (b) applied mineral dust mask. (c) The 10 min boxcar average of the calculated dust layer vertical extent 1zSAL . (d) The 10 min boxcar average of the derived total dust aerosol optical depth from aircraft to ground level τtot(532) (blue) and aerosol layer optical depth τSAL(532) (red). (e) Mean values and standard deviations of the measured 10 min averaged SAL particle linear depolarization ratio (δp532 ). it was found that BSR532 in the cloud-free marine trade wind fraction (CF) is defined as the number of all cloud-containing boundary layer as well as in the elevated SAL never ex- profiles divided by the total number of vertical lidar profiles. ceeds a ratio of 10. Marine trade wind water clouds are opti- For the calculation of cloud lengths along the flight path cally thick and thus take much larger values. Based on these neighboring cloud-flagged vertical profiles are connected. findings and to avoid potential miscategorizations of sharp The cloud length is then determined as a function of the aerosol gradients as cloud tops using wavelet transforms, a respective geolocations (aircraft latitude and longitude) and fixed threshold of BSR532 = 20 is used for the cloud or no- CTH using the haversine formula. Cloud gaps are calcu- cloud decision. lated analogously by connecting neighboring cloud-free pro- To determine the cloud top height (CTH), the BSR532 pro- files. Due to the instruments’ maximum horizontal resolution file is scanned from flight level downwards to 250 m altitude of approximately 200 m, it is possible to resolve minimum and the first range bin where BSR532 is greater than or equal cloud (gap) lengths of 200 m. It should be mentioned that not to the defined threshold is marked. Additionally, the whole the maximum cloud (gap) length of each individual cloud but profile is flagged as a “cloud-containing” profile. All cloud- the along-track cloud (gap) length is derived. As a result, the containing profiles with cloud top heights in a certain altitude amount of small clouds (gaps) in this study may be overesti- range are taken and divided by the total number of cloud- mated. flagged profiles to obtain the CTH fraction in the respective bin of the overall CTH distribution. Similar to that the cloud www.atmos-chem-phys.net/19/10659/2019/ Atmos. Chem. Phys., 19, 10659–10673, 2019
10664                                           M. Gutleben et al.: Lidar measurements of cloud macro-physical properties

3     Results

3.1    Dust measurements during NARVAL-II

In the following the measurement situation during the four
HALO flights used to characterize long-range-transported
Saharan dust layers (see Sect. 2.1) is summarized and their
influence on subjacent marine trade wind clouds is investi-
gated (Fig. 3). The Saharan origin of the observed dust lay-
ers is verified using 10 d backward trajectories with start-
ing points at the center of the respective Saharan air layers
(Fig. 2). All observed dust layers traveled for 5 to 10 d from
the Adrar–Hoggar–Aïr region in central Africa to the mea-
surement location over the western North Atlantic Ocean. In
                                                                    Figure 4. Flight track of RF6 on 19 August 2016 on top of the
central Africa the SAL is formed by intense surface heating         Terra MODIS (Moderate Resolution Imaging Spectroradiometer)
and dry convection, which mixes dust particles to altitudes of      true color image (a) and the MODIS aerosol optical depth (AOD)
up to 6 km (Gamo, 1996).                                            product (b) at 13:40 UTC. Launched dropsondes are marked by col-
   During RF2 on 10 August a thin Saharan dust layer                ored dots (red dots: mineral dust laden regions, blue: dust free re-
(1zSAL < 2 km) ranging from 2.5 to 5.0 km altitude was de-          gions).
tected during the whole flight. A mean δp532 of 30 % clearly
classifies this elevated layer as a mineral dust layer. τSAL(532)
took values around 0.15 – on average approximately 35 % of          3.2   Case study – 19 August 2016
the total column aerosol optical depth during this RF. Un-
fortunately, bright and strongly reflecting clouds in the lidar     RF6 on 19 August 2016 took place in the area between 48
field of view caused the safety circuit of the detector unit to     and 60◦ W and 13 and 19◦ N (Fig. 4). The ITCZ and associ-
shut down the device, causing some gaps in the continuous           ated deep convection were located 550 km south of the flight
lidar dataset.                                                      track at around 10◦ N and are not expected to have an influ-
   In contrast to RF2, a vertically and optically thick dust        ence on our analysis. RF6 was planned to cross a sharp gra-
layer was observed during the whole RF3 on 12 August.               dient between a dust-laden and a clear region at an altitude
δp532 of this layer ranged from 28 % to 30 %, thus confirm-         of approximately 8.25 km with about one-half of the mea-
ing the presence of Saharan mineral dust. The layer had a           surement time in dust-laden and the other half in dust-free
maximum vertical extent of ∼ 4 km, showed aerosol optical           regions. The circular patterns of the flight track were flown
depths around 0.2 and contributed on average with 60 % to           for dropsonde-based divergence measurements. Whereas the
the total column aerosol optical depth during that flight.          first pair of circles was performed over a heavily dust-laden
   While RF2 and RF3 were designed for measurements                 region in the southern part of the flight track, the second pair
solely in dust-laden regions, RF4 and RF6 on 15 and 19 Au-          was performed in the northern part over an almost dust-free
gust were planned for measurements in both dust-laden and           region. This is also seen in MODIS aerosol optical depth
dust-free regions within the very same research flight. Flight      imagery at 13:40 UTC in Fig. 4b where the region around
tracks were chosen to cross dust gradients frequently, result-      the southern circle shows a maximum aerosol optical depth
ing in multiple flight segments of dust and no dust along           greater than 0.4.
the flight track. Elevated aerosol layers showed mean δp532            Measured cross sections of BSR532 and the derived min-
of 30 % and could therefore be identified as SAL. While             eral dust mask (Fig. 3a, RF6 and b, RF6) show pronounced
the SAL during RF4 ranged on average from 2.5 to 4.5 km,            elevated mineral dust layers ranging from 2.5 to 5.0 km alti-
it reached higher to almost 6 km altitude during RF5. With          tude, horizontally alternating with dust-free profile regions.
τSAL(532) ≈ 0.1 the dust layer during RF4 contributed on av-        Due to the conducted divergence measurements, dropsondes
erage 25 % to τtot(532) . τSAL(532) during RF6 took higher val-     were launched frequently along the circular flight tracks and
ues of up to 0.4 and showed a mean contribution of 51 % to          are used to compare vertical profiles of meteorological pa-
τtot(532) .                                                         rameters in dust-laden regions to those in dust-free regions.
   The following case study presents a detailed description of      For this purpose mean profiles of potential temperature θ , rel-
RF6 including an analysis of dropsonde profiles in dust-laden       ative humidity and water vapor mass mixing ratio (r, MR) as
and dust-free regions.                                              well as wind speed and direction (u, wdir) of all dropsonde
                                                                    measurements in the respective dust-laden and dust-free re-
                                                                    gions are compared in Fig. 5 (panels Ib–d, IIb–d and IIIa–d).
                                                                    Additionally, lidar-derived δp532 is analyzed for both regimes
                                                                    (Fig. 5, Ia and IIa).

Atmos. Chem. Phys., 19, 10659–10673, 2019                                            www.atmos-chem-phys.net/19/10659/2019/
M. Gutleben et al.: Lidar measurements of cloud macro-physical properties 10665
Figure 5. Mean vertical WALES lidar profiles of δp532 and mean vertical dropsonde profiles of relative humidity (r), potential temperature
g d2
(θ ), squared Brunt–Väisälä frequency N 2 = 2 dz , and wind speed (u) and direction (wdir) in dust-free (I) and dust-laden (II) regions during
RF6 on 19 August 2016 (horizontal bars indicate standard deviations). (III) Differences in water vapor mass mixing ratio (MR), potential
temperature, relative humidity and wind speed between the two regions. Shaded regions mark the marine boundary layer (MBL, blue) and
the Saharan air layer (SAL, orange).
Inside the SAL-region a three-layer structure is present: dust-laden region (southern part of the flight track) which is
visible in the MODIS image (Fig. 4), is also evident in lidar
1. the marine boundary layer (MBL), reaching up to ap- measurements after the application of the described threshold
proximately 1.3 km height (δp532 smaller than 10 % in- method for cloud detection. Whereas a lot of cloud tops in
dicates that marine aerosols are the dominant contribu- heights ranging from 0.5 to 1.5 km altitude are detected in
tor to the aerosol composition of the MBL); the northern part of the flight track (after about 16:45 UTC),
almost no cloud is detected along the earlier southern flight
2. a transition or mixed layer extending from the MBL top
path – with the exception of the transition region to the dust-
to 2.8 km altitude with varying values of δp532 (10 % <
free area (cloud top heights at ∼ 1.5 km altitude).
δp532 < 20 %); and
This is also evident in the calculated cloud fractions. CF is
3. the elevated SAL, with typical δp532 for long-range- 20 % in dust-free regions. In the SAL region however, CF de-
transported Saharan dust (δp532 ∼ 30 %) ranging from creases to 11 % (including the clouds developing at the edges
2.8 to 3.8 km height. of the dust layer). Another characteristic of clouds in SAL
regions is that their CTH is rarely higher than approximately
The mean dust-free δp532 profile of the MBL and transition 1 km. However, in dust-free regions cloud top heights reach
layer looks quite similar to the mean dust-laden δp532 profile. almost twice as high and up to 2 km. Divergence measure-
However, no SAL signature is detected. The low CF in the
www.atmos-chem-phys.net/19/10659/2019/ Atmos. Chem. Phys., 19, 10659–10673, 201910666 M. Gutleben et al.: Lidar measurements of cloud macro-physical properties
ments discussed by Bony and Stevens (2019) and Stevens
et al. (2019) show that dynamical properties in the two re-
gions are different as well. They found that MBL vertical ve-
locity in the dust-free regime is directed upwards and could
explain the observed increased cloud top heights.
For an investigation of the question why vertical wind
speeds, cloud tops and cloud fractions are higher in the dust-
free regime than in the SAL regime, differences in meteo-
rological parameters between SAL regions and dust-free re-
gions are analyzed by discussing mean profiles of all drop-
sonde measurements in the respective regions. Both the dust-
laden and the dust-free regions clearly indicate the so-called
trade wind inversion (TWI) in an altitude range from 1.5 to
1.8 km height capping the moist MBL. The TWI is charac-
terized by a rapid temperature decrease of about 4 K within
400 m (not shown) and a strong hydrolapse (relative hu-
midity (r) drops from > 80 % to ∼ 30 %). In both regimes
the MBL itself can be divided into a sub-cloud layer which
extends from the ocean surface to 0.5–0.7 km and a cloud
layer (Groß et al., 2016) which extends from the sub-cloud Figure 6. Histograms of detected cloud top height fractions during
layer top to the TWI (0.5–1.8 km). Those two regions can NARVAL-I and NARVAL-II with bins of 0.5 km size. Red bars il-
be identified in profiles of 2 and humidity. Whereas the sub- lustrate the distribution of cloud top height fractions in SAL regions.
cloud layer is well mixed (2 = constant, MR = constant), the Blue bars represent the derived cloud top height distribution from
cloud layer shows a conditionally unstable lapse rate of 5– measurements in the dust-free trades during NARVAL-II. Grey bars
show the derived cloud top height in the dust-free winter season
7 K km−1 (saturated air parcels are unstable to vertical dis-
during NARVAL-I.
placement). Overall, measurements of 2 and humidity show
a stronger variation in the dust-free MBL than in the dust-
laden one, suggesting the presence of more boundary layer For a better visualization of atmospheric stability the
clouds in dust-free regions. squared Brunt–Väisälä frequency N 2 = 2 g d2
dz , with g being
Nuijens et al. (2009) and Nuijens and Stevens (2012)
the gravity of the Earth, is shown. N 2 shows regions of
found that high wind speeds near the surface correspond to
high atmospheric stability and thus strong restoring forces
an increase in boundary layer humidity leading to a deepen-
for a vertical air parcel displacement at the inversion alti-
ing of the cloud layer and increased area rainfall. Lonitz et al.
tudes. Enhanced atmospheric stability is found at the TWI
(2015) used large-eddy simulations to show how higher rela-
for both regimes. At higher altitudes N 2 profiles look dif-
tive humidities associated with observed dusty boundary lay-
ferent. In dust-laden regions the lower and upper boundaries
ers change the evolution of the cloud layer. However, when
of the SAL are characterized by two additional well-known
comparing boundary layer wind speed and humidity in the
inversions (Carlson and Prospero, 1972; Dunion and Velden,
two regimes no distinct differences can be observed, indicat-
2004; Ismail et al., 2010). Inside the layer N 2 is almost zero –
ing that some other mechanism must be responsible for the
indicating a well mixed SAL regime. Furthermore, 2 points
observed differences in vertical wind speed, cloud fraction
towards a neutral stratification in the interior of the SAL
and cloud top height. The MBL of both regimes is domi-
since it does not change with altitude. Altogether, a total of
nated by northeasterly winds with speeds around 7 ms−1 . In
three prominent inversion layers counteract convective devel-
dust-laden regions wind speeds in SAL altitudes are 4 ms−1
opment in dust-laden regions, whereas in dust-free regions
lower than in the dust-free regions. This suggests that the
just the trade wind inversion is present.
SAL represents a decoupled layer, which penetrates into the
In conclusion, one can suggest that the SAL potentially
trade-wind regime. Moreover, enhanced amounts of water
modifies radiative transfer, atmospheric stability and the evo-
vapor are observed inside the long-range-transported SAL.
lution of vertical velocities, hence representing a proxy for
Relative humidity and water vapor mass mixing ratio show
reduced amounts of clouds and lower cloud top heights. To
an increase of 2 g kg−1 in SAL regions compared to the dust-
discuss this hypothesis, differences in cloud macro-physical
free trade wind region. Such an increase has already been ob-
properties are investigated for the whole NARVAL field cam-
served by Jung et al. (2013). From radiosonde measurements
paign series.
they found that the SAL transports moisture from Africa to-
wards the Caribbean and gets moistened during transport by
upwelling surface fluxes.
Atmos. Chem. Phys., 19, 10659–10673, 2019 www.atmos-chem-phys.net/19/10659/2019/M. Gutleben et al.: Lidar measurements of cloud macro-physical properties 10667
3.3 Differences in cloud macro-physical properties
3.3.1 Cloud fraction and cloud top height
A first indicator for differences in marine trade wind cloud
occurrence is the cloud fraction CF. During NARVAL-II a to-
tal number of 3.2×10⁴ 1 s resolved cloud tops were detected
in trade wind regions (NCT(dust) = 8 × 10³ ; NCT(nodust) =
2.4×10⁴ ). They contribute to an overall observed CF of 24 %
within the measurement period. In dust-free regions a CF of
31 % was derived, while in SAL regions CF was smaller by
a factor of more than 2 (14 %). In winter (NARVAL-I) an al-
most 3 times higher CF of 37 % is derived. The next param-
eter to look for differences between the three regions is the
CTH distribution (Fig. 6). In the SAL regions only a small
fraction of clouds exceeds an altitude of 2 km and no cloud
top is found at altitudes greater 2.5 km. The majority of cloud
top heights (∼ 61 %) are found within the altitude range from
0.5 to 1.0 km in lower altitudes of the MBL-cloud layer. A
total of 26 % of all detected cloud top heights are located in
the 1.0–1.5 km height interval and only 11 % of that fraction
contributes to the interval from 1.5 to 2.0 km altitude.
Cloud tops in altitudes > 2.5 km including deeper-
reaching convection with maximum top heights of 6 km are
found in ∼ 16 % of all dust-free cloud profiles. Below around
3 km altitude the CTH distribution shows a two-modal struc-
ture with two local maxima ranging from 0.5 to 1.0 km Figure 7. Histograms of detected cloud lengths (a) and cloud gap
(∼ 35 %) and 1.5 to 2.0 km altitude (∼ 20 %). Several clouds lengths (b). Red bars illustrate the distribution of marine low cloud
were also detected in the lowermost 0.5 km of the atmosphere (gap) lengths located below Saharan dust layers. Blue bars represent
(∼ 1 %). Most likely those clouds are evolving or dissipating the distribution derived from measurements in the dust-free trades
clouds at the bottom of the cloud layer. during NARVAL-II. Grey bars show the derived distribution in the
dust-free winter season during NARVAL-I.
In the dust-free winter season a shift of the distribu-
tion to higher altitudes is observed since most cloud tops
were sampled in the interval from 2.0 to 2.5 km altitude (∼
39 %). However, no cloud was observed at altitudes greater of 3688 and 2355 clouds were observed in dust-free and dust-
3.5 km. This shift is caused by a slightly higher TWI in win- laden regions during NARVAL-II and 5010 clouds were de-
ter months, shown in Stevens et al. (2017), who compare tected during NARVAL-I in dust-free winter. In all three sam-
mean dropsonde profiles of water vapor mixing ratio during ples clouds with a horizontal extent of less than 0.5 km are
NARVAL-I and NARVAL-II. by far the most prominent ones. Whereas 72 % of all clouds
The statistical significance of observed differences in the in SAL regions are of this length, 65 % of clouds detected
distributions was checked by randomly resampling the re- in clear summer trade wind regions and 61 % in wintertime
spective datasets to smaller subsets and by comparing the measurements contribute to this length interval. Both regions
shapes of the resulting distributions to the shape of the over- show a decreasing trend in frequency of cloud length occur-
all distributions. The shapes of the resampled distributions rence for lengths of up to 5 km. Relative frequency drops to
showed no major differences compared to the overall distri- 17 % (dust-laden), 16 % (dust-free) and 16 % (NARVAL-I)
butions; thus it can be concluded that our NARVAL-II mea- in the length interval 0.5–1.0 km. Only 5 % of all clouds in
surements indicate the presence of less and shallower clouds dusty regions are observed to have a horizontal extent greater
in Saharan-dust-laden trade wind regions compared to dust- than 2.0 km. This fraction almost doubles to 9 % in dust-free
free regions. regions and in winter months. The main contributor to this
fraction are clouds with horizontal extents of more than 5 km
3.3.2 Cloud lengths and cloud gaps (4 % and 5 %). Clouds of this length are basically only found
outside dust-laden regions.
As a next step the cloud length and cloud gap length dis- Another important parameter to highlight differences of
tributions of marine trade wind clouds in SAL regions and cloudiness between SAL regions and dust-free regions is the
mineral-dust-free regions are investigated (Fig. 7a). A total cloud gap length (Fig. 7b). Similar to the distribution of cloud
www.atmos-chem-phys.net/19/10659/2019/ Atmos. Chem. Phys., 19, 10659–10673, 201910668 M. Gutleben et al.: Lidar measurements of cloud macro-physical properties
Figure 8. (a) Mean cloud top heights (middle) and cloud fraction (bottom) of clouds detected below Saharan dust layers as a function
of Saharan dust layer vertical extent (1zSAL ) – bin interval: 0.2 km. (b) Mean cloud top heights (middle) and cloud fraction (bottom) of
clouds detected below Saharan dust layers as a function of Saharan dust layer optical depth (τSAL(532) ) at 532 nm wavelength – bin interval:
0.015. Bars mark respective standard deviations of mean cloud top heights (1σ ). The uppermost graphs in (a) and (b) illustrate summed
measurement times in each interval.
lengths, cloud gap frequencies also decrease with increasing overlying mineral dust layers (Fig. 8). Cloud fractions and
cloud gap length. In all three regimes cloud gaps shorter than heights in dust-flagged profiles of all four research flights are
0.5 km dominate. They contribute with 45 % and 35 % to the grouped together with respect to similar 1zSAL (bin width:
total amount of observed cloud gaps in dust-free and dust- 0.2 km) and τSAL(532) (bin width: 0.015). During NARVAL-
laden regions during NARVAL-II and even with 48 % in win- II Saharan dust layers with maximum vertical extents of 4 km
ter months. A different picture emerges, when looking at the and maximum optical depths of 0.4 were observed (Fig. 3).
number of cloud gaps greater than 5 km. A fraction of 17 % However, below optically thick dust layers (τSAL(532) > 0.24;
is found to be greater than 5 km below dust layers, whereas zSAL > 3.8 km) no cloud has been detected.
in dust-free regions and winter months these gap sizes con- The distribution of CTH as a function of 1zSAL shows
tribute with 12 % and 14 % to the distribution. Cloud gap that up to a layer thickness of 1.8 km mean CTH decreases
fractions in range bins from 1.5 to 4.5 km decrease in both with increasing 1zSAL from 1.4 to 0.8 km altitude. For a
regions consistently with increasing cloud gap length. greater layer thickness (1zSAL > 1.8 km) this trend is not
The significance of the distribution properties was again evident anymore. A further increase in 1zSAL does not im-
double-checked by the comparison to randomly resampled ply a significant decrease in mean CTH – in some bin in-
sub-datasets. Overall, the cloud length and gap length dis- tervals the mean CTH even increases slightly. Mean cloud
tributions (Fig. 7) indicate that the dust-laden trade wind top heights vary strongly below vertically thin dust layers
regimes during NARVAL-II were characterized by a larger (σ = 0.5 km) – an indication for the presence of both shallow
number of small-scale clouds and slightly greater cloud gaps, developing convective clouds and higher-reaching trade wind
compared to the dust-free and winter regimes. clouds within the MBL. With increasing 1zSAL the variabil-
ity of mean CTH decreases to σ < 0.2 km for 1zSAL < 3 km.
3.3.3 Connecting dust and cloud properties This suggests that the cloud layer indeed lowers and that
the few evolving clouds are confined to low levels of the
As a further step the observed CTH and CF are related to MBL. The CF distribution as a function of 1zSAL does not
the geometrical and optical depth (1zSAL and τSAL(532) ) of show any distinct trend for geometrically thin layers. For
Atmos. Chem. Phys., 19, 10659–10673, 2019 www.atmos-chem-phys.net/19/10659/2019/M. Gutleben et al.: Lidar measurements of cloud macro-physical properties 10669
1zSAL 2.6 km. free regime and the winter season. These results are in good
Next, the CTH distribution as a function of dust layer opti- agreement with results of previous satellite remote sensing
cal depth τSAL(532) is analyzed. Up to a value of τSAL(532) ∼ studies (Dunion and Velden, 2004) and model studies (Wong
0.05 the mean CTH decreases with increasing optical depth and Dessler, 2005; Stephens et al., 2004), which also suggest
of the aerosol layer. The mean CTH drops from ∼ 1.3 km to a convection-suppressing characteristic of the SAL. Some of
∼ 1.0 km in this region. A further increase in τSAL(532) to a those studies suggest that the main player of the suppression
value of about 0.12 does not show any further decrease in characteristic is a dry anomaly in SAL altitudes. However,
mean CTH. This is in line with the observed decrease in CF all observed long-range-transported Saharan air layers during
as a function of dust layer optical depth in this range. The NARVAL-II were not found to come along with dry anoma-
observed CF increases slightly from 15 % to 20 % for small lies, but were rather showing enhanced humidities (compared
SAL optical depths (τSAL(532) < 0.12). At the upper tail of to the surrounding dry free trade wind atmosphere) in the
the distribution (0.12 < τSAL(532) ) the mean CTH as well as range from 2 to 4 gkg−1 . Saharan air layers frequently show
the CF decrease again. CF shows a steady decrease of about water vapor mixing ratios in this range over Africa (Marsham
20 % in the range from τSAL(532) = 0.12 to 0.24. Moreover, et al., 2008). During the transport towards the Caribbean
the variability of mean CTH in that range gets smaller, again the SAL conserves the received moisture and takes up ad-
indicating that higher-reaching convection is suppressed. ditional moisture from upwelling surface fluxes during trans-
For the interpretation of these distributions the accumu- port (Jung et al., 2013). Nevertheless, a suppressing charac-
lated measurement time in the respective intervals as well teristic of the SAL on subjacent marine clouds is evident as
as the contribution of different research flights have to be well.
taken into account. Mainly data collected in the course of Wong and Dessler (2005) also showed that the convection
RF3 contribute to SAL measurements in the ranges 0.09 < barrier increases with SAL aerosol optical depth. To investi-
τSAL(532) < 0.24 and 2 km < 1zSAL < 4 km (Fig. 3), thus gate a possible relation between SAL optical depth or layer
being the main contributor to observed increases in mean vertical extent and marine trade wind CTH, the CTH and
CTH and CF in regions of high τSAL(532) and 1zSAL . The CF distribution were analyzed as a function of SAL verti-
remaining research flights (RF2, RF4 and RF6) were char- cal extent and optical depth. It was found that mean CTH
acterized by thinner dust layers that were rather decoupled decreases with increasing layer vertical extent for vertically
from the MBL and contribute to regions of small τSAL(532) thin layers (< 1.5 km). Additionally, the mean CTH vari-
and 1zSAL . ability for these layers is high, indicating the occurrence of
Altogether, a decreasing trend of CTH and CF as a func- higher-reaching clouds in those regions. There is no signifi-
tion of dust layer optical depth and vertical extent was de- cant decrease in mean CTH for thicker dust layers, but a re-
tected during research flights over elevated and long-range- duction of CTH variability could be derived. Also a decrease
transported Saharan dust layers. However, RF3 showed a pre- in mean CTH variability with increasing dust layer optical
dominant and strongly pronounced transition layer that pos- thickness starting at τSAL(532) ≈ 1.2 could be detected. More-
sibly altered the cloud layer resulting in an increased CF and over, a decrease in CF comes along with this reduction in
CTH in the respective intervals of τSAL(532) and 1zSAL . variability of the mean CTH. Below optically thick dust lay-
ers with τSAL(532) > 0.24 not any cloud was detected. These
results indicate that optically and vertically thick elevated Sa-
4 Summary and conclusion haran dust layers have a greater suppressing effect on con-
vection below than optically and vertically thin layers. Drop-
In this study airborne lidar measurements performed on- sonde profiles of potential temperature θ and the squared
board the German High Altitude and Long Range Research Brunt–Väisälä frequency N 2 in dust-laden trade wind re-
Aircraft (HALO) during the NARVAL experiments over the gions indicate two inversions at the bottom and the top of
North Atlantic trade wind region were used to investigate the SAL, which additionally counteract convective develop-
whether marine low cloud macro-physical properties change ment. Those two SAL-related additional inversion layers are
in the presence of overlying long-range-transported Saharan an explanation for why there are fewer and shallower clouds
dust layers. Significant differences in the CTH distribution in SAL regions and why thick and pronounced dust layers in-
as well as in the cloud length and cloud gap length distri- troduce a more stable stratification to the trade wind regime
bution were found for flights in SAL-regions compared to than less pronounced ones.
the distributions derived from flights in dust-free regions. It
www.atmos-chem-phys.net/19/10659/2019/ Atmos. Chem. Phys., 19, 10659–10673, 201910670 M. Gutleben et al.: Lidar measurements of cloud macro-physical properties
Altogether, the NARVAL lidar measurements indicate that Financial support. The article processing charges for this open-
there is a strong correlation between the presence of elevated access publication were covered by a Research Centre of the
and long-range-transported Saharan dust layers and the oc- Helmholtz Association.
currence and macro-physical properties of subjacent marine
low clouds. It is shown that Saharan dust can be used as a
proxy for a decrease in subjacent trade wind cloud length Review statement. This paper was edited by Corinna Hoose and re-
and cloud top height. Further reaching questions regarding viewed by two anonymous referees.
changes in radiation caused by the dust layer and its mois-
ture, changes in the general circulation patterns or the settling
of dust particles into the cloud layer (Groß et al., 2016) could
not be addressed within the present work and are left to future References
studies and field campaigns, e.g., the upcoming EUREC4 A
field campaign (Elucidating the Role of Clouds–Circulation Ansmann, A., Tesche, M., Althausen, D., Müller, D., Seifert,
Coupling in Climate) in early 2020 (Bony et al., 2017). P., Freudenthaler, V., Heese, B., Wiegner, M., Pisani, G.,
Knippertz, P., and Dubovik, O.: Influence of Saharan dust
on cloud glaciation in southern Morocco during the Saha-
ran Mineral Dust Experiment, J. Geophys. Res., 113, D4,
Data availability. WALES and dropsonde data are made available
https://doi.org/10.1029/2007jd008785, 2008.
through the DLR Institute of Atmospheric Physics in the HALO
Ansmann, A., Petzold, A., Kandler, K., Tegen, I., Wendisch,
database (German Aerospace Center, 2016).
M., Müller, D., Weinzierl, B., Müller, T., and Heintzen-
berg, J.: Saharan Mineral Dust Experiments SAMUM-1 and
SAMUM-2: what have we learned?, Tellus B, 63, 403–429,
Author contributions. In the framework of the NARVAL-II field https://doi.org/10.1111/j.1600-0889.2011.00555.x, 2011.
experiment MW and SG carried out all airborne lidar measurements Bègue, N., Tulet, P., Pelon, J., Aouizerats, B., Berger, A.,
used in this study. MW did the initial data processing. MG per- and Schwarzenboeck, A.: Aerosol processing and CCN for-
formed all analytic computations, statistically analyzed the dataset mation of an intense Saharan dust plume during the EU-
and took the lead in writing the paper under consultation of SG. All CAARI 2008 campaign, Atmos. Chem. Phys., 15, 3497–3516,
authors discussed the results and contributed to the final paper. https://doi.org/10.5194/acp-15-3497-2015, 2015.
Bony, S. and Stevens, B.: Measuring Area-Averaged Verti-
cal Motions with Dropsondes, J. Atmos. Sci., 76, 767–783,
Competing interests. The authors declare that they have no conflict https://doi.org/10.1175/jas-d-18-0141.1, 2019.
of interest. Bony, S., Stevens, B., Ament, F., Bigorre, S., Chazette, P., Crewell,
S., Delanoë, J., Emanuel, K., Farrell, D., Flamant, C., Gross,
S., Hirsch, L., Karstensen, J., Mayer, B., Nuijens, L., Ruppert,
Special issue statement. This article is part of the special issue J. H., Sandu, I., Siebesma, P., Speich, S., Szczap, F., Totems,
“The Saharan Aerosol Long-range Transport and Aerosol-Cloud- J., Vogel, R., Wendisch, M., and Wirth, M.: EUREC4A: A
interaction Experiment (SALTRACE) (ACP/AMT inter-journal Field Campaign to Elucidate the Couplings Between Clouds,
SI)”. It is not associated with a conference. Convection and Circulation, Surv. Geophys., 38, 1529–1568,
https://doi.org/10.1007/s10712-017-9428-0, 2017.
Boose, Y., Sierau, B., García, M. I., Rodríguez, S., Alastuey,
Acknowledgements. The authors like to thank the staff members of A., Linke, C., Schnaiter, M., Kupiszewski, P., Kanji, Z.
the DLR HALO aircraft from DLR Flight Experiments for prepar- A., and Lohmann, U.: Ice nucleating particles in the Sa-
ing and performing the measurement flights. The data used in this haran Air Layer, Atmos. Chem. Phys., 16, 9067–9087,
publication were collected during the NARVAL (Next-generation https://doi.org/10.5194/acp-16-9067-2016, 2016.
Aircraft Remote-sensing for Validation Studies) campaign series Burton, S. P., Ferrare, R. A., Hostetler, C. A., Hair, J. W., Rogers, R.
and are made available through the DLR Institute for Atmospheric R., Obland, M. D., Butler, C. F., Cook, A. L., Harper, D. B., and
Physics. Moreover, the authors gratefully acknowledge all research Froyd, K. D.: Aerosol classification using airborne High Spectral
scientists who helped to launch the dropsondes and the two anony- Resolution Lidar measurements – methodology and examples,
mous referees who helped to improve this study. NARVAL was Atmos. Meas. Tech., 5, 73–98, https://doi.org/10.5194/amt-5-73-
funded with support of the Max Planck Society, the German Re- 2012, 2012.
search Foundation (DFG, Priority Program: HALO-SSP 1294) and Burton, S. P., Hair, J. W., Kahnert, M., Ferrare, R. A., Hostetler,
the German Aerospace Center (DLR). This study was financed by a C. A., Cook, A. L., Harper, D. B., Berkoff, T. A., Seaman, S.
DLR VO-R young investigator group within the Institute of Atmo- T., Collins, J. E., Fenn, M. A., and Rogers, R. R.: Observa-
spheric Physics. tions of the spectral dependence of linear particle depolariza-
tion ratio of aerosols using NASA Langley airborne High Spec-
tral Resolution Lidar, Atmos. Chem. Phys., 15, 13453–13473,
https://doi.org/10.5194/acp-15-13453-2015, 2015.
Carlson, T. N. and Benjamin, S. G.: Radia-
tive heating rates for Saharan dust, J. Atmos.
Atmos. Chem. Phys., 19, 10659–10673, 2019 www.atmos-chem-phys.net/19/10659/2019/M. Gutleben et al.: Lidar measurements of cloud macro-physical properties 10671 Sci., 37, 193–213, https://doi.org/10.1175/1520- Groß, S., Freudenthaler, V., Schepanski, K., Toledano, C., 0469(1980)0372.0.CO;2, 1980. Schäfler, A., Ansmann, A., and Weinzierl, B.: Optical prop- Carlson, T. N. and Prospero, J. M.: The Large-Scale Movement of erties of long-range transported Saharan dust over Barba- Saharan Air Outbreaks over the Northern Equatorial Atlantic, dos as measured by dual-wavelength depolarization Raman li- J. Appl. Meteorol., 11, 283–297, https://doi.org/10.1175/1520- dar measurements, Atmos. Chem. Phys., 15, 11067–11080, 0450(1972)0112.0.CO;2, 1972. https://doi.org/10.5194/acp-15-11067-2015, 2015. Colarco, P. R.: Saharan dust transport to the Caribbean dur- Groß, S., Gasteiger, J., Freudenthaler, V., Müller, T., Sauer, D., ing PRIDE: 1. Influence of dust sources and removal mech- Toledano, C., and Ansmann, A.: Saharan dust contribution anisms on the timing and magnitude of downwind aerosol to the Caribbean summertime boundary layer – a lidar study optical depth events from simulations of in situ and re- during SALTRACE, Atmos. Chem. Phys., 16, 11535–11546, mote sensing observations, J. Geophys. Res., 108, D19, https://doi.org/10.5194/acp-16-11535-2016, 2016. https://doi.org/10.1029/2002jd002658, 2003. Haarig, M., Ansmann, A., Althausen, D., Klepel, A., Groß, S., DeMott, P. J., Prenni, A. J., McMeeking, G. R., Sullivan, R. C., Freudenthaler, V., Toledano, C., Mamouri, R.-E., Farrell, D. A., Petters, M. D., Tobo, Y., Niemand, M., Möhler, O., Snider, J. Prescod, D. A., Marinou, E., Burton, S. P., Gasteiger, J., En- R., Wang, Z., and Kreidenweis, S. M.: Integrating laboratory and gelmann, R., and Baars, H.: Triple-wavelength depolarization- field data to quantify the immersion freezing ice nucleation activ- ratio profiling of Saharan dust over Barbados during SALTRACE ity of mineral dust particles, Atmos. Chem. Phys., 15, 393–409, in 2013 and 2014, Atmos. Chem. Phys., 17, 10767–10794, https://doi.org/10.5194/acp-15-393-2015, 2015. https://doi.org/10.5194/acp-17-10767-2017, 2017. Dunion, J. P. and Velden, C. S.: The Impact of the Saharan Air Layer Heintzenberg, J.: The SAMUM-1 experiment over Southern on Atlantic Tropical Cyclone Activity, B. Am. Meteorol. Soc., Morocco: overview and introduction, Tellus B, 61, 2–11, 85, 353–366, https://doi.org/10.1175/BAMS-85-3-353, 2004. https://doi.org/10.1111/j.1600-0889.2008.00403.x, 2009. Esselborn, M., Wirth, M., Fix, A., Tesche, M., and Ehret, G.: Air- Huang, J., Zhang, C., and Prospero, J. M.: African dust outbreaks: borne high spectral resolution lidar for measuring aerosol ex- A satellite perspective of temporal and spatial variability over tinction and backscatter coefficients, Appl. Opt., 47, 346–358, the tropical Atlantic Ocean, J. Geophys. Res.-Atmos, 115, D5, https://doi.org/10.1364/AO.47.000346, 2008. https://doi.org/10.1029/2009JD012516, 2010. Ewald, F., Kölling, T., Baumgartner, A., Zinner, T., and Mayer, B.: Huneeus, N., Schulz, M., Balkanski, Y., Griesfeller, J., Prospero, Design and characterization of specMACS, a multipurpose hy- J., Kinne, S., Bauer, S., Boucher, O., Chin, M., Dentener, F., perspectral cloud and sky imager, Atmos. Meas. Tech., 9, 2015– Diehl, T., Easter, R., Fillmore, D., Ghan, S., Ginoux, P., Grini, 2042, https://doi.org/10.5194/amt-9-2015-2016, 2016. A., Horowitz, L., Koch, D., Krol, M. C., Landing, W., Liu, Ewald, F., Groß, S., Hagen, M., Hirsch, L., Delanoë, J., X., Mahowald, N., Miller, R., Morcrette, J.-J., Myhre, G., Pen- and Bauer-Pfundstein, M.: Calibration of a 35 GHz air- ner, J., Perlwitz, J., Stier, P., Takemura, T., and Zender, C. S.: borne cloud radar: lessons learned and intercomparisons with Global dust model intercomparison in AeroCom phase I, At- 94 GHz cloud radars, Atmos. Meas. Tech., 12, 1815–1839, mos. Chem. Phys., 11, 7781–7816, https://doi.org/10.5194/acp- https://doi.org/10.5194/amt-12-1815-2019, 2019. 11-7781-2011, 2011. Freudenthaler, V., Esselborn, M., Wiegner, M., Heese, B., Tesche, Illingworth, A. J., Barker, H. W., Beljaars, A., Ceccaldi, M., M., Ansmann, A., Müller, D., Althausen, D., Wirth, M., Fix, A., Chepfer, H., Clerbaux, N., Cole, J., Delanoë, J., Domenech, Ehret, G., Knippertz, P., Toledano, C., Gasteiger, J., Garham- C., Donovan, D. P., Fukuda, S., Hirakata, M., Hogan, R. J., mer, M., and Seefeldner, M.: Depolarization ratio profiling Huenerbein, A., Kollias, P., Kubota, T., Nakajima, T., Naka- at several wavelengths in pure Saharan dust during SAMUM jima, T. Y., Nishizawa, T., Ohno, Y., Okamoto, H., Oki, R., 2006, Tellus B, 61, 165–179, https://doi.org/10.1111/j.1600- Sato, K., Satoh, M., Shephard, M. W., Velázquez-Blázquez, A., 0889.2008.00396.x, 2009. Wandinger, U., Wehr, T., and van Zadelhoff, G.-J.: The Earth- Gamage, N. and Hagelberg, C.: Detection and CARE Satellite: The Next Step Forward in Global Measurements Analysis of Microfronts and Associated Coher- of Clouds, Aerosols, Precipitation, and Radiation, B. Am. Me- ent Events Using Localized Transforms, J. At- teorol. Soc., 96, 1311–1332, https://doi.org/10.1175/bams-d-12- mos. Sci, 50, 750–756, https://doi.org/10.1175/1520- 00227.1, 2015. 0469(1993)0502.0.co;2, 1993. Ismail, S., Ferrare, R. A., Browell, E. V., Chen, G., Ander- Gamo, M.: Thickness of the dry convection and large-scale sub- son, B., Kooi, S. A., Notari, A., Butler, C. F., Burton, sidence above deserts, Bound.-Lay. Meteorol., 79, 265–278, S., Fenn, M., Dunion, J. P., Heymsfield, G., Krishnamurti, https://doi.org/10.1007/bf00119441, 1996. T. N., and Biswas, M. K.: LASE Measurements of Water Va- German Aerospace Center: HALO database, available at: https:// por, Aerosol, and Cloud Distributions in Saharan Air Lay- halo-db.pa.op.dlr.de/ (last access: 13 August 2019), 2016. ers and Tropical Disturbances, J. Atmos. Sci., 67, 1026–1047, Groß, S., Wiegner, M., Freudenthaler, V., and Toledano, C.: Li- https://doi.org/10.1175/2009JAS3136.1, 2010. dar ratio of Saharan dust over Cape Verde Islands: Assess- Jung, E., Albrecht, B., Prospero, J. M., Jonsson, H. H., and Krei- ment and error calculation, J. Geophys. Res.-Atmos, 116, D15, denweis, S. M.: Vertical structure of aerosols, temperature, and https://doi.org/10.1029/2010JD015435, 2011. moisture associated with an intense African dust event observed Groß, S., Esselborn, M., Weinzierl, B., Wirth, M., Fix, A., and Pet- over the eastern Caribbean, J. Geophys. Res.-Atmos., 118, 4623– zold, A.: Aerosol classification by airborne high spectral reso- 4643, https://doi.org/10.1002/jgrd.50352, 2013. lution lidar observations, Atmos. Chem. Phys., 13, 2487–2505, Karydis, V. A., Kumar, P., Barahona, D., Sokolik, I. N., and Nenes, https://doi.org/10.5194/acp-13-2487-2013, 2013. A.: On the effect of dust particles on global cloud condensation www.atmos-chem-phys.net/19/10659/2019/ Atmos. Chem. Phys., 19, 10659–10673, 2019
You can also read


