Identification of positive and negative regulators in the stepwise developmental progression towards infectivity in Trypanosoma brucei
←
→
Page content transcription
If your browser does not render page correctly, please read the page content below
www.nature.com/scientificreports
OPEN Identification of positive
and negative regulators
in the stepwise developmental
progression towards infectivity
in Trypanosoma brucei
Justin Y. Toh1,3, Agathe Nkouawa1,3, Saúl Rojas Sánchez1,3, Huafang Shi1,3,
Nikolay G. Kolev1 & Christian Tschudi1,2*
Trypanosoma brucei is a protozoan parasite that causes important human and livestock diseases
in sub-Saharan Africa. By overexpressing a single RNA-binding protein, RBP6, in non-infectious
procyclics trypanosomes, we previously recapitulated in vitro the events occurring in the tsetse fly
vector, namely the development of epimastigotes and infectious, quiescent metacyclic parasites. To
identify genes involved in this developmental progression, we individually targeted 86 transcripts
by RNAi in the RBP6 overexpression cell line and assessed the loss-of-function phenotypes on
repositioning the kinetoplast, an organelle that contains the mitochondrial genome, the expression
of BARP or brucei alanine rich protein, a marker for epimastigotes, and metacyclic variant surface
glycoprotein. This screen identified 22 genes that positively or negatively regulate the stepwise
progression towards infectivity at different stages. Two previously uncharacterized putative nucleic
acid binding proteins emerged as potent regulators, namely the cold shock domain-containing
proteins CSD1 and CSD2. RNA-Seq data from a selected group of cell lines further revealed that the
components of gene expression regulatory networks identified in this study affected the abundance of
a subset of transcripts in very similar fashion. Finally, our data suggest a considerable overlap between
the genes that regulate the formation of stumpy bloodstream form trypanosomes and the genes that
govern the development of metacyclic form parasites.
Trypanosoma brucei is a protozoan parasite that causes African sleeping sickness in humans and together with T.
congolense and T. vivax remains a public health concern in sub-Saharan Africa by afflicting livestock with nagana.
During its complex life cycle between the mammalian host and the blood-feeding tsetse fly vector (Glossina sp.),
T. brucei transitions through many distinct developmental forms to adapt to changing environments. In the
infected mammal, T. brucei is coated with a variant surface g lycoprotein1 (VSG) and exists as both a prolifera-
tive slender and a quiescent stumpy form. The transition from slender to stumpy form parasites is triggered in
a cell-density dependent manner through a quorum sensing m echanism2,3. Stumpy form parasites are primed
for survival in the tsetse fly as evident from the increased expression of mitochondrial proteins4, which prepares
parasites to exploit oxidative phosphorylation for ATP production and use of proline as the new carbon source
in the tsetse fly, and the protein associated with differentiation 1 (PAD1)5, which internalizes cis-aconitate and
citrate that act as signaling molecules to trigger development into procyclic parasites. Upon ingestion of blood-
stream form trypanosomes by the tsetse fly, the stumpy form parasites that withstand the digestive p roteases6,7,
8 9
insect immune system , and alkaline conditions found in the midgut will differentiate into procyclic forms
and lose mammalian i nfectivity1,10. This differentiation process is accompanied with major morphological and
metabolic changes that include repositioning of the kinetoplast (an organelle that contains the mitochondrial
genome) between the posterior pole and the nucleus, expansion of the mitochondrial cisternae for an oxidative
1
Department of Epidemiology of Microbial Diseases, Yale School of Public Health, New Haven, CT 06536,
USA. 2Department of Epidemiology of Microbial Diseases, Boyer Center for Molecular Medicine 136C, Yale School
of Public Health, 295 Congress Avenue, New Haven, CT 06536, USA. 3These authors contributed equally: Justin
Y. Toh, Agathe Nkouawa, Saúl Rojas Sánchez and Huafang Shi. *email: christian.tschudi@yale.edu
Scientific Reports | (2021) 11:5755 | https://doi.org/10.1038/s41598-021-85225-2 1
Vol.:(0123456789)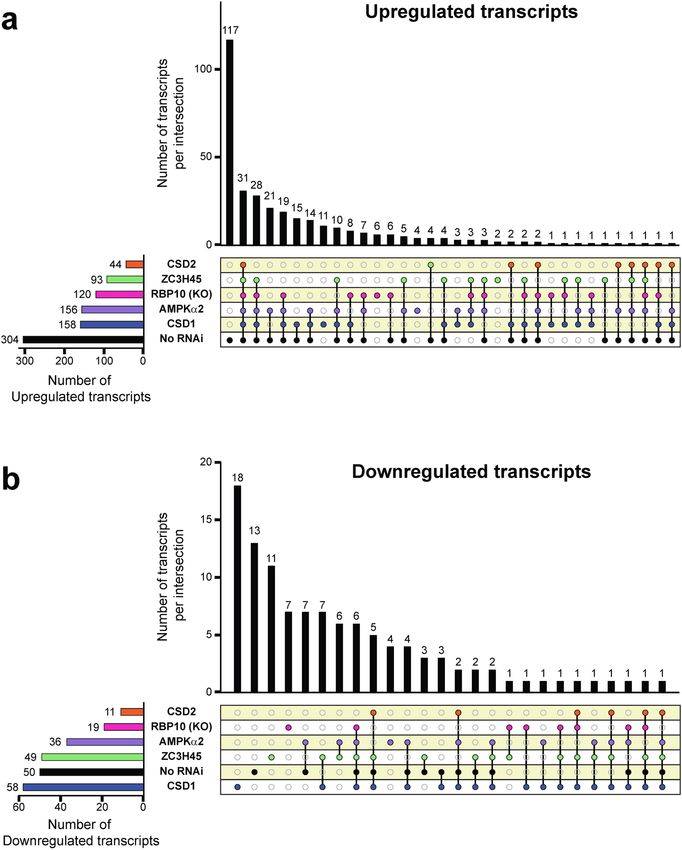
www.nature.com/scientificreports/
phosphorylation-dependent metabolism, loss of the VSG coat, and expression of a glycoprotein coat composed
mainly of procyclins rich in Gly-Pro-Glu-Glu-Thr repeats (GPEET) and procyclins rich in Glu-Pro repeats
(EP)1,11–13.
Procyclic parasites undergo an intricate developmental process known as metacyclogenesis, whereby non-
infectious trypanosomes develop into infectious metacyclic parasites, and regain mammalian infectivity through
the expression of a specific subset of VSGs known as metacyclic VSGs (mVSGs). As procyclic parasites transit
to a portion of the foregut in the tsetse fly known as the proventriculus, they elongate, reposition the kinetoplast
anterior to the nucleus, and become epimastigotes, which undergo asymmetric division to produce long and
short epimastigotes1. Epimastigotes travel to the salivary gland, where they express a family of alanine-rich sur-
face proteins known as brucei alanine rich protein (BARP)14. A subset of these epimastigotes will attach to the
epithelia of the salivary gland and gain the capacity to undergo either symmetric division to colonize the salivary
gland or asymmetric division to produce infectious, quiescent metacyclic p arasites1. Major morphological and
metabolic changes occur in metacyclic parasites, which include a morphologically regressed mitochondrion that
primes the parasite for a glycolysis-based metabolism15, increased endocytosis16, a repositioned kinetoplast at
the posterior end of the parasite1, and mVSG expression17 for survival in the mammalian host. The molecular
mechanisms underlying this developmental process remain largely unknown. Previously, this dearth of knowl-
edge was in part due to the lack of an in vitro differentiation system, which prevented the use of large-scale genetic
and biochemical experiments. This limitation was overcome with the establishment of an in vitro differentia-
tion system, where procyclic parasites overexpressing the RNA-binding protein 6 (RBP6) progress to become
metacyclic parasites18. This system recapitulates most of the T. brucei developmental processes from procyclic
to metacyclic parasite and captures many of the in vivo hallmarks of differentiation18. Since then two additional
in vitro differentiation systems have been developed. The overexpression of RBP6 with a single-point mutation
(Q109K) skipped the intermediate epimastigote stage and the resulting metacyclics were able to progress to
bloodstream forms in vitro19. In addition, RBP10 was shown to promote the bloodstream form differentiation
state, when overexpressed in procyclic p arasites20–22.
Among the three in vitro differentiation systems, the wild-type RBP6 overexpression system best reflects the
development of trypanosomes within the tsetse fly and has opened up a better understanding of metacyclogen-
esis. For instance, metacyclics obtained from this system are quiescent, i.e. they are non-dividing and display a
dramatic reduction in transcription, protein synthesis and the amount of ribosomal proteins23. Transcriptomic
and proteomic analysis revealed an increase in glycolytic proteins and their corresponding mRNAs in metacyclic
parasites relative to procyclic parasites, which is consistent with the progression to glycolysis as the primary mode
of ATP generation23. Furthermore, metacyclic parasites expressing one of the eight major T. brucei Lister 427
mVSGs24 were able to establish an infection in m ice18. Recently, mitochondrial metabolic changes in the proline
oxidation pathway and tricarboxylic acid (TCA) cycle have been documented using transcriptomic, proteomic,
and metabolomic approaches25. Upon RBP6 induction, there was an upregulation of proline catabolism and
components of the TCA cycle, which fuels oxidative phosphorylation-based ATP production. Changes in the
electron transport chain increased the levels of reactive oxygen species, which act as signaling molecules to drive
cellular differentiation from epimastigotes to metacyclic p arasites25. Utilizing this in vitro differentiation system,
we performed a targeted RNAi screen to identify genes involved in regulating metacyclogenesis. We individually
targeted 86 transcripts by RNAi in the inducible RBP6 overexpression cell line and assessed the loss-of-function
effects on kinetoplast repositioning, and BARP and mVSG expression, resulting in the identification of 22 genes
that positively or negatively regulate different steps of metacyclogenesis.
Results
RBP6 induction alters the mRNA translation landscape. The goal in this project was to identify
genes downstream of RBP6 that are involved in the developmental program transforming procyclic parasites
into quiescent, mammalian-infectious metacyclic parasites, also referred to as metacyclogenesis. In a first set of
experiments, we investigated the impact of RBP6 induction on changes in translation efficiencies, i.e. changes
which are not paralleled by corresponding changes in cytoplasmic mRNA levels. Un-induced and RBP6-induced
cells for 48 h were treated with the translation elongation inhibitor cycloheximide to immobilize ribosomes on
mRNA and cytosolic extracts were separated on 15–50% linear sucrose density gradients by ultracentrifuga-
tion to separate polysomes from monosomes, ribosomal subunits and messenger ribonucleoprotein particles
(mRNPs)26. This enables discrimination between efficiently translated from poorly translated mRNAs. The poly-
some profile derived from each sample (Fig. 1a,c) was used to determine the fractions that corresponded to
mRNPs (fractions 1–2), 40S (fractions 3–4), and ribosomal subunits 60S and 80S (fractions 5–7). Using the sedi-
mentation of α-tubulin mRNA, assayed by Northern blot (Fig. 1b,d), as a guide, we arbitrarily defined fractions
8–12 and 13–22 as light and heavy polysomes, respectively. Fractions containing heavy polysomes were pooled
and along with total RNA samples analyzed by RNA-Seq (see “Methods” section). We performed three biological
replicates and identified 990 and 12 transcripts whose polysome association was increased or decreased, respec-
tively, at least threefold relative to un-induced cells (Supplementary Table S1). The abundance of 304 transcripts
was upregulated at 48 h19 and 238 of these revealed increased polysome association. In contrast, 752 transcripts
with increased polysome association did not change transcript abundance levels (Supplementary Table S1), thus
highlighting translation as an important regulatory step.
Targeted RNAi screen identifies 22 genes that play a role in metacyclogenesis. Since we know
that the induction of RBP6 expression for only one day results in the generation of metacyclics (Supplemen-
tary Fig. S1), we hypothesized that RBP6 is triggering a cascade of gene expression, biochemical, and mor-
phological events. Initially, we attempted a genome-wide RNAi screen to identify genes downstream of RBP6,
Scientific Reports | (2021) 11:5755 | https://doi.org/10.1038/s41598-021-85225-2 2
Vol:.(1234567890)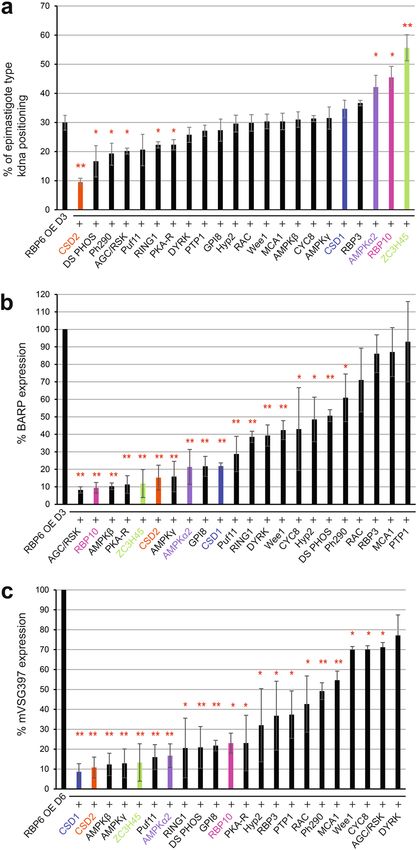
www.nature.com/scientificreports/
Figure 1. Polysome profiling. (a,c) Representative sucrose gradient absorbance profiles. Lysates obtained
from un-induced (a) and 48 h induced (c) RBP6 overexpression cells were loaded on a linear 15–50% sucrose
gradient and the absorbance was recorded at 254 nm. The positions of 40S, 60S, 80S and polysomes are
indicated. The six pooled gradient fractions are: 1–2 (free RNA), 3–4 (40S), 5–7 (60S and 80S)), 8–12 (light
polysomes), 13–22 (heavy polysomes). (b,d) Northern blot analyses for the polysomal distribution of α-tubulin
mRNA of un-induced (b) and 48 h induced (d) RBP6 overexpression cells. The fraction numbers from the
monosomes to the heavy polysomes that were loaded on the gel are indicated. The bottom panel in each shows
the methylene blue staining of the large ribosomal RNAs in the sucrose density gradient fractions. Full-length
blots of panels (b) and (d) are shown in Supplementary Fig. S9.
but encountered technical difficulties, likely due to an apparent interference between the RNAi library and the
RBP6 overexpression system. We therefore designed a targeted RNAi screen based mainly upon our available
transcriptomic19,23 and p
roteomic23 datasets that documented differential gene expression during the transfor-
mation from procyclic to epimastigote and, subsequently, into metacyclic parasites. We primarily chose candi-
dates that encode protein kinases, protein phosphatases, cell-cycle regulators, and DNA- and/or RNA-binding
proteins, because these categories of proteins are often associated with developmental regulation in eukaryotic
organisms3,27–30. We included 61 genes whose transcripts were at least two-fold upregulated after RBP6 overex-
pression for 24 h or in metacyclic parasites19. We also included 3 genes that increased in protein abundance by
arasites23. Additionally, 8 genes whose transcripts
at least two-fold in metacyclic parasites relative to procyclic p
were approximately two-fold downregulated in metacyclic parasites compared to procyclic parasites were added
to the screen, since these genes could be negative regulators of metacyclic d evelopment19. Finally, based on
the experiments described above, we included 25 genes whose transcripts increased in polysome association
by at least two-fold in RBP6-induced cells for 48 h when compared to un-induced parasites (Supplementary
Table S1). From this set of 97 RNAi targets, we eliminated 11 genes, whose down-regulation has been shown to
cause growth arrest or parasite death by a previous genome-wide RNAi screen for procyclic parasite fitness31. Of
the 86 total candidate genes (Supplementary Table S2), 15 genes were previously identified to play an important
role in the development of bloodstream parasites from slender to stumpy forms3. Since both short stumpy and
metacyclic parasites are quiescent and pre-adapted for transmission, we hypothesized that these genes required
for stumpy bloodstream form development may also be involved in the production of metacyclics.
Because T. brucei mRNA degradation by the RNAi machinery is efficiently and specifically triggered by
double-stranded RNA produced in vivo as a long hairpin32,33, we created plasmid constructs that utilize a tet-
racycline-inducible promoter to transcribe hairpins targeting the open reading frame. Our list included 4 gene
families where individual members were targeted simultaneously, namely genes coding for Proteins Associated
with Differentiation (PAD 1–8), two hexokinases (HK1-2), a gene family of protein phosphatases 1 (PP1 4–6),
and a gene family of NEK kinases (NEK17 1–3). The remaining transcripts were targeted individually, resulting
in a total of 74 RNAi cell lines. Each RNAi cassette was stably integrated in the non-transcribed 177-bp repeat
satellite DNA of T. brucei Lister 427 (29–13) cells, while the tetracycline-inducible RBP6 construct was stably
integrated in the non-transcribed rDNA spacer. Therefore, upon doxycycline exposure, each cell line simultane-
ously expressed RBP6 to trigger development from procyclic to metacyclic forms and a double-stranded RNA
hairpin targeting a transcript of interest for RNAi downregulation. In this screen, we did not monitor the efficacy
of RNAi depletion of the targeted transcripts, and thus, if an RNAi cell line did not display a phenotype, we can-
not conclude that the targeted gene is not involved in metacyclic development. Additionally, the degree of RNAi
Scientific Reports | (2021) 11:5755 | https://doi.org/10.1038/s41598-021-85225-2 3
Vol.:(0123456789)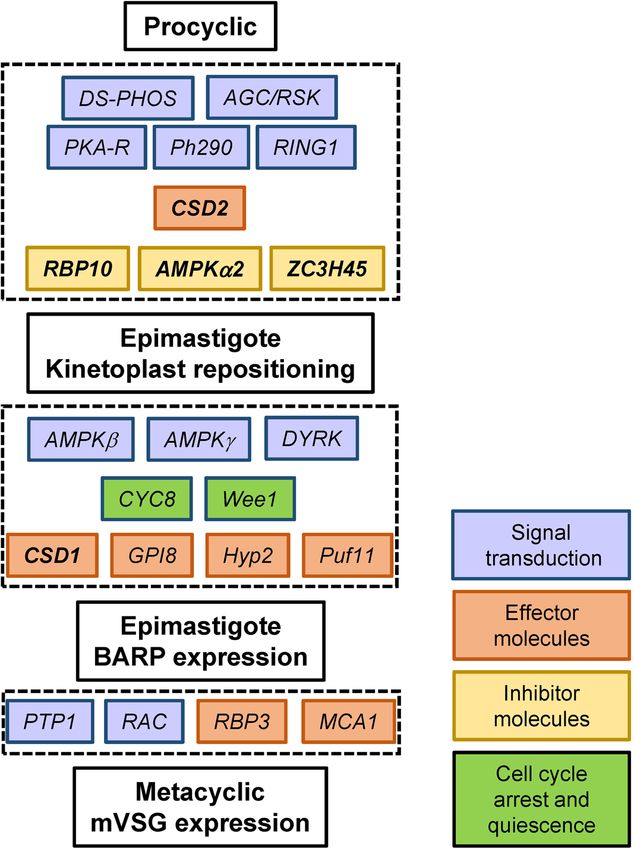
www.nature.com/scientificreports/
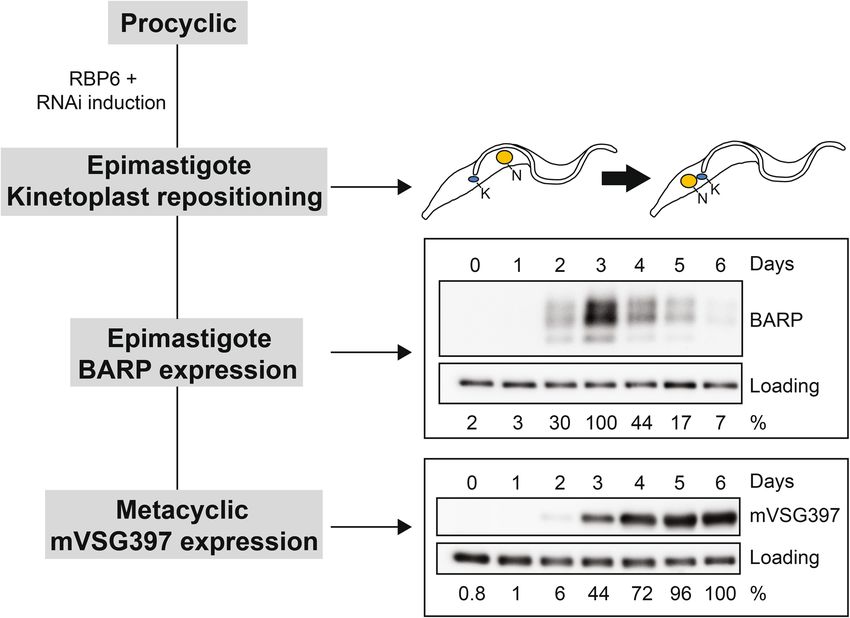
Figure 2. Targeted RNAi screen overview. BARP and mVSG397 are surface markers that serve as a positive
readout for epimastigote and metacyclic production, respectively. Epimastigotes were quantified on the third
day and metacyclics on the sixth day, since these are the times where BARP and mVSG397 expression was
highest in our 6-day time course. Each RNAi cell line was induced with doxycycline to overexpress RBP6 to
stimulate development and to express an RNAi hairpin that down-regulates a specific transcript of interest. After
three days of induction, cells were scored as epimastigotes, if their kinetoplast localized anterior to the nucleus
and these results were compared to the positive control, the wild-type RBP6 overexpression cell line. Induced
cells from the targeted RNAi screen and the positive control were also harvested on the third and sixth day of
doxycycline induction for Western blot analysis to quantify BARP and mVSG397 expression, respectively. Full-
length blots are shown in Supplementary Fig. S10.
efficiency for different mRNAs could influence the severity of the observed phenotype. Lastly, our experimental
design was aimed at analyzing genes acting downstream of RBP6, so any genes operating upstream will not be
detected, particularly because protein overexpression generally occurs more rapidly than RNAi in T. brucei.
The RBP6 overexpression system we use will result in approximately 30% of the cells developing into epimas-
tigotes after 2–3 days and approximately 50% of the cells will be infectious metacyclic parasites after 4–6 days.
We used two experimental methods to quantify the efficacy of this developmental program (Fig. 2). First, we
Hoechst stained the differentiating population and used fluorescent microscopy to distinguish and quantify
epimastigote parasites based on the relative position of the parasite’s kinetoplast to its nucleus. Whereas the
kinetoplast of both procyclic and metacyclic parasites is positioned posterior to the nucleus, the kinetoplast of
epimastigotes is localized anterior to the nucleus. Second, we used Western blot analysis to monitor the expres-
sion of specific surface proteins. Since epimastigotes express BARP14 and metacyclic parasites express one of
the eight major mVSGs, the expression of BARP and mVSG397, the most abundantly expressed mVSG and
present on approximately 50% of m etacyclics19,34, served as a positive readout for the quantity of epimastigote
and metacyclic parasites, respectively. Taken together, Fig. 2 illustrates our assays in a 6-day time course of RBP6
overexpression in procyclic parasites. The first event to happen is the repositioning of the kinetoplast and this
occurs before BARP expression, which peaks on the third day. Finally, mVSG397 expression is highest on the
6th day, which correlates with the morphological counts of metacyclics34.
Since we have previously observed that low levels of RBP6 expression inefficiently stimulate metacyclic
development18, we first assessed RBP6 expression levels in the generated RNAi cell lines after 24 h of doxycy-
cline induction. In comparison to the parental RBP6 expressing cell line, each of the RNAi cell lines expressed
RBP6 at a similar level (Supplementary Figs. S2 and S3). Next, we assessed whether RNAi affected the mor-
phological appearance of epimastigote parasites. The most severe phenotype we observed was caused by the
down-regulation of cold shock domain-containing protein 2 (CSD2; Tb927.4.4520) with a 66% reduction in
the number of epimastigote parasites, relative to the RBP6 overexpression cell line (Fig. 3a). Additionally, in
5 RNAi cell lines we observed a slight, but statistically significant effect on the morphological appearance of
Scientific Reports | (2021) 11:5755 | https://doi.org/10.1038/s41598-021-85225-2 4
Vol:.(1234567890)www.nature.com/scientificreports/
Figure 3. The targeted RNAi screen identified 22 genes that positively or negatively regulate a distinct step
of metacyclogenesis. (a) After 3 days of doxycycline induction, epimastigotes were scored if the kinetoplast
localized anterior to the nucleus in the positive control, the wild-type RBP6 overexpression cell line, and RNAi
cell lines. (b) Three days post-induction, BARP expression was quantified using Western blot against BARP
and compared to the positive control. (c) mVSG397 expression was quantified six days post-induction by
Western blot against mVSG397. The positive control expression of BARP and mVSG397 is set to 100% and the
expression of BARP and mVSG397 in each RNAi cell line is a percentage ratio of the positive control. Three
independent replicates were performed with means ± standard deviation (std). The P value was calculated from
a two-tailed student’s t-test. *Denotes P values from 0.05 to 0.01, while **Denotes P values < 0.01. RNAi cell lines
that were used for downstream RNA-Seq analysis are color coded.
epimastigotes (Fig. 3a). The 5 genes responsible for this phenotype encode a dual-specificity phosphatase (DS
PHOS, Tb927.7.7160), a phosphatase and tensin homolog (Ph290, Tb927.11.290), a AGC/RSK family kinase
(AGC/RSK, Tb927.3.2690), a ring finger domain containing protein (RING1, Tb927.7.6190), and the protein
kinase A-regulatory subunit (PKA-R, Tb927.11.4610). Interestingly, the down-regulation of AMP-activated pro-
tein kinase α2 subunit (AMPKα2, Tb927.3.4560), RBP10 (Tb927.8.2780), and zinc finger domain containing
protein 45 (ZC3H45, Tb927.11.8470) increased the appearance of epimastigote parasites by at least 40% relative
to the parental strain. The specificity of the RNAi constructs against AMPKα2 and AMPKα1 was confirmed
by the differential abundance of the phosphorylated form of the proteins during the induction (Supplementary
Scientific Reports | (2021) 11:5755 | https://doi.org/10.1038/s41598-021-85225-2 5
Vol.:(0123456789)www.nature.com/scientificreports/
Fig. S4). Taken together, we identified 6 positive and 3 negative effectors of kinetoplast repositioning in the initial
phase of the developmental program.
Next, we evaluated by Western blotting which of the 74 RNAi cell lines affected BARP expression after three
days of RBP6 overexpression. The RNAi-induced down-regulation of 18 individual transcripts resulted in a
statistically significant decrease in BARP expression relative to the 3-day induced RBP6 overexpression cell
line (Fig. 3b, Supplementary Fig. S5 and Supplementary Table S3). Among these 18 genes were the 9 RNAi cell
lines we have shown above to positively or negatively affect the morphological appearance of epimastigotes. In
addition, we identified 9 cell lines that displayed normal kinetoplast repositioning, but BARP expression was
decreased by approximately 40% (Fig. 3b, Supplementary Fig. S5 and Supplementary Table S3). These 8 genes
code for a GPI-anchor transamidase subunit 8 (GPI8, Tb927.10.13860), a Pumillio/PUF RNA-binding protein
11 (Puf11, Tb927.11.10810), a hypothetical protein 2 (Hyp2, Tb927.9.4080), an AMP-activated protein kinase β
subunit (AMPKβ, Tb927.8.2450), an AMP-activated protein kinase γ subunit (AMPKγ, Tb927.10.3700), a cold
shock domain-containing protein 1 (CSD1, Tb927.8.7820), a cyclin 8 (CYC8, Tb927.7.1390), a Wee1-like protein
kinase (Wee1, Tb927.4.3420), and a DYRK protein kinase (DYRK, Tb927.10.15020).
Finally, we monitored each of the 74 RNAi cell lines by Western blotting for their ability to express mVSG397
after 6 days of RBP6 overexpression (Fig. 3c, Supplementary Fig. S5 and Supplementary Table S3). We identi-
fied at total of 18 cell lines that displayed at least a 50% reduction in mVSG397 expression, when compared to
the 6-day induced RBP6 overexpression cell line. Downregulation of AGC/RSK, CYC8, and Wee1 only resulted
in a slight, but statistically significant decrease in mVSG397 expression (Fig. 3c, Supplementary Fig. S5 and
Supplementary Table S3). In contrast, RNAi reduction of the remaining identified 14 transcripts that affected
epimastigote kinetoplast repositioning and/or BARP expression impaired mVSG397 expression up to 90%. This
final phenotypic analysis also revealed four cell lines with normal kinetoplast repositioning and BARP expres-
sion, but decreased mVSG397 expression. The four targeted transcripts encode RNA binding protein 3 (RBP3,
Tb927.11.530), protein tyrosine phosphatase 1 (PTP1, Tb927.10.6690), a rac serine-threonine kinase (RAC,
Tb927.6.2550), and a metacaspase (MCA1, Tb927.11.3220), and these proteins are likely to play a role in the later
step(s) of the developmental progression to metacyclics. Unexpectedly, we noticed that the down-regulation of
DYRK, which displayed normal kinetoplast repositioning (Fig. 3a and Supplementary Table S3), but reduced
BARP expression (Fig. 3b, Supplementary Fig. S5 and Supplementary Table S3), did not result in a significant
reduction of mVSG397 expression.
RNA‑seq analysis of selected cell lines. The targeted RNAi screen described above identified 22 genes,
which are required at different steps in the development of infectious metacyclics (Fig. 5 and Supplementary
Table S3). To begin to gain an understanding of the specific role(s) these genes play, we concentrated on RNA/
DNA binding proteins and a signal transducer and performed RNA-Seq on the RNAi cell lines of AMPKα2,
ZC3H45, CSD1, and CSD2, and the RBP10 KO cell line. It is important to note that the initial phenotypic
analysis for RBP10 was done with the RNAi cell line. The subsequent establishment of an RBP10 KO cell line in
the RBP6 overexpression background confirmed the RNAi results (Supplementary Tables S4 and S5) and thus
we used the KO cell line in subsequent analyses. Three biological replicates of un-induced, day 1-, 2-, 3-, 4- and
6-induced cells were processed (Supplementary Tables S6, S7, S8, S9 and S10), and their transcriptomes were
compared to the parental RBP6 over-expressing cell line. To minimize potential secondary effects of RNAi-
induced down-regulation, we restricted the analysis reported here to days 1 and 2. During this time period over-
expression of RBP6 revealed 304 transcripts with a more than two-fold higher abundance, as compared to un-
induced cells, and 50 transcript had a lower abundance19. In our initial screen, CSD2 down-regulation displayed
the most severe phenotype affecting the early repositioning of the kinetoplast (Fig. 3a) and this was reflected in
the RNA-Seq data with only 44 and 11 transcripts having a higher and lower abundance, respectively (Fig. 4 and
Supplementary Table S11). Most interestingly, during the first two days the abundance of 5 mVSG transcripts
(mVSG397, mVSG653, mVSG1954, mVSG531, mVSG639) increased to levels comparable to the parental RBP6
cell line, indicating that CSD2 does not play a major direct role in mVSG activation. In contrast, in the RBP10
KO cell line the 5 mVSG transcripts were downregulated (Supplementary Table S12), indicating that RBP10 may
have a role in stabilizing mVSG transcripts. The mVSG abundance did not change in the CSD1 (Supplementary
Table S13), AMPKα2 (Supplementary Table S14) and ZC3H45 RNAi cells (Supplementary Table S15) when
compared to un-induced cells, suggesting that these three proteins play a role in mVSG activation directly or
indirectly.
There are several additional conclusions we can draw from the RNA-Seq data. The effect on the landscape
of upregulated transcripts by the various RNAi cell lines was largely restricted to transcripts changing in the
parental cell line, i.e. a very limited number of additional transcripts were upregulated (Fig. 4a) and the number
of mRNAs uniquely upregulated in individual RNAi cell lines was surprisingly low (Table 1). In contrast, the
downregulated transcripts revealed potential new targets of regulation, including the mVSGs discussed above,
since they were only downregulated in the RNAi cell lines (Fig. 4b and Table 2). Of particular interest is the
down-regulation of two families of proteins containing META domains in the ZC3H45 RNAi cell line (Sup-
plementary Table S15). These gene families are clustered at the beginning of a polycistronic transcription unit
on chromosome 5 and encode either a 446 aa-long protein with two predicted META domains (Tb927.5.2190,
2220, 2250) or a 116 aa-long protein with a single predicted META domain (Tb927.5.2160, 2170, 2200, 2230,
2260). The META domain of about 100 aa has been described in secreted bacterial proteins that are implicated in
motility35–37. In addition, the syntenic protein meta-1 in Leishmania major was localized in the flagellar p ocket38,
was mainly expressed in infective metacyclics 38,39
and overexpression in L. amazonensis increased v irulence40.
The abundance of the T. brucei transcripts of both families did not change during m etacyclogenesis19, but the
transcripts were significantly downregulated in purified metacyclics as compared to procyclics (between 8.6- and
Scientific Reports | (2021) 11:5755 | https://doi.org/10.1038/s41598-021-85225-2 6
Vol:.(1234567890)www.nature.com/scientificreports/
Figure 4. Differentially expressed genes shared across selected RNAi cell lines and RBP10 KO cells in the
background of the RBP6 expression at day 1 and 2 after induction. (a) UpSet48 visualization of upregulated
genes. While each row of the combination matrix shows a set of all upregulated genes per experimental (RBP10
KO or RNAi against AMPKα2, CSD1, CSD2 and ZC3H45) and control (No RNAi) groups, columns correspond
to intersections, meaning upregulated genes shared between sets. The upper bar graph shows the number of
upregulated genes per intersection, while the lateral bar graph shows the number of upregulated genes per set. If
a set is participating in an intersection, the corresponding matrix cell is filled with a distinctive color and a black
line connecting the participating intersections is displayed (e.g., 31 genes are upregulated in all the compared
sets). Upregulated genes found only in one set are depicted with filled cells but no connecting lines (e.g., 117
genes were upregulated exclusively in the “No RNAi” control group). (b) UpSet48 visualization of downregulated
genes. Legends as in panel (a) but showing the corresponding analysis for downregulated genes. Website link:
https://gehlenborglab.shinyapps.io/upsetr/.
11-fold23), which was also evident at the protein level23, suggesting that ZC3H45 has a role in stabilizing these
transcripts during metacyclogenesis.
In addition, in the CSD1 RNAi cell line 58 transcripts were downregulated and this included 29 novel tran-
scripts that are potentially regulated by CSD1 through mRNA stability (Supplementary Table S13). The analysis
of the coding region and the 3′ UTR of these 29 transcripts by MEME (Multiple Em for Motif Elicitation) iden-
tified a purine-rich element (RARGARRAKV), but further analysis will be required to investigate a potential
interaction of CSD1 with these transcripts. The motif did not match any previously identified sequences involved
in the developmental regulation of T. brucei genes and Gene Ontology analysis did not reveal any significant
enrichment. Finally, the differentially regulated transcripts that appeared multiple times across the RNAi and
KO cell lines (Fig. 4) did not expose specific gene expression regulatory networks.
Scientific Reports | (2021) 11:5755 | https://doi.org/10.1038/s41598-021-85225-2 7
Vol.:(0123456789)www.nature.com/scientificreports/
Cell line Gene ID Product description Gene name
Tb927.1.5060 Variant surface glycoprotein (VSG)-related, putative Null
Tb927.11.11740 Membrane-bound acid phosphatase, putative Null
AMPKα2
Tb927.11.2400 Flabarin-like protein Null
Tb927.5.4000 Hypothetical protein Null
Tb927.10.11970 Glutamine aminotransferase (GlnAT) GlnAT
Tb927.10.12580 Hypothetical protein Null
Tb927.10.4050 Serine palmitoyltransferase, putative Null
Tb927.10.4350 Hypothetical protein Null
Tb927.2.4200 CMGC/CLK family protein kinase, putative Null
Glycosyl hydrolase family 65 central catalytic domain/Haloacid dehalogenase-like
CSD1 Tb927.4.2410 Null
hydrolase, putative
Tb927.6.370 Hypothetical protein, conserved Null
Tb927.6.550 Hypothetical protein Null
Tb927.7.4110 Kinesin, putative Null
Tb927.7.6330 Hypothetical protein Null
Tb927.8.5350 Hypothetical protein, conserved Null
Tb927.10.2500 Hypothetical protein, conserved Null
Tb927.11.11400 Hypothetical protein Null
Tb927.7.1940 Hypothetical protein Null
RBP10 (KO)
Tb927.7.3250 Expression site-associated gene 6 (ESAG6) protein, putative Null
Tb927.7.3260 Expression site-associated gene 7 (ESAG7) protein, putative Null
Tb927.9.9370 PSP1 C-terminal conserved region, putative Null
Tb927.1.3710 Hypothetical protein, conserved Null
ZC3H45
Tb927.11.900 Isocitrate dehydrogenase, putative IDH
Table 1. Uniquely upregulated transcripts in individual RNAi and KO cell lines.
Discussion
Developmental progression to infectious metacyclic trypanosomes in the tsetse fly is a critical factor for the
transmission of African sleeping sickness and nagana. We gained insight into the regulation of this process with
a targeted RNAi screen which revealed genes governing different steps of the metacyclogenesis pathway. Both
positive and negative regulators emerged from our assays, and additionally, genes involved in controlling the
transition of bloodstream forms to stumpy forms, as well as the differentiation from stumpy to procyclic forms
had an effect on metacyclic cell production. Thus, the generation of metacyclics relies on a combination of factors
that are required for two distinct processes in bloodstream form trypanosome biology: (i) transition to quies-
cence and (ii) differentiation from bloodstream to procyclic forms. The likely explanation for this observation
is that in addition to establishment of q uiescence23, metacyclic cells also thoroughly remodel their surface with
the synthesis of a VSG coat and their transcriptome largely resembles the bloodstream form t ranscriptome23,41.
The dominant group of genes that exhibited effects on metacyclogenesis in our RNAi screen were signal trans-
ducers (Fig. 5). DYRK, PKA-R, AMPKα2, AMPKβ, AMPKγ protein kinases and DS-PHOS protein phosphatase
have been implicated in quorum sensing during the development of stumpy bloodstream f orms3 and all had
a pronounced effect on the generation of metacyclics. Genes that have been shown to regulate bloodstream to
procyclic form differentiation were also represented by signal transducers and effectors. The protein phosphatase
PTP142, a key component of the signaling cascade during this transition, had an effect on mVSG coat synthesis,
whereas RBP10, a protein largely responsible for the establishment and maintenance of bloodstream-form-type
transcriptome20–22 and a strong inhibitor of the bloodstream to procyclic d ifferentiation20–22, did exhibit a posi-
tive effect on metacyclogenesis. Additionally, our RNA-Seq data revealed that repressor of differentiation kinase
2 (RDK2) was affected in all of the analyzed RNAi cell lines (Supplementary Table S16). This kinase has been
identified as a critical regulator of the differentiation from bloodstream to procyclic forms43 and it is the most
upregulated kinase in metacyclics compared to p rocyclics23.
Two previously uncharacterized putative nucleic acid binding proteins emerged as potent regulators of meta-
cyclogenesis. The cold shock domain-containing proteins CSD1 and CSD2 exhibited very strong effects on
metacyclogenesis upon RNAi knockdown, albeit at different steps of the process. Additionally, CSD1 RNAi
resulted in the largest number of downregulated mRNAs, exposing a number of transcripts potentially regulated
by CSD1 through stabilization (Supplementary Table S13).
Mitochondrial metabolism has a pronounced effect on trypanosome development and it was previously
shown to affect the type of procyclin on the surface of procyclic c ells44, as well as the generation of metacyclics
in vitro by inducible RBP6 e xpression25. Alternative oxidase channels electrons directly to oxygen and severely
limits ATP production by oxidative phosphorylation. It is highly upregulated in both metacyclics and blood-
stream forms and it was recently shown that it contributes to the generation of reactive oxygen species (ROS)
which play a major role in the control of metacyclic p roduction25. Surprisingly, the mRNA for alternative oxidase
was not affected in any of the RNAi or KO cell lines for which we performed RNA-Seq and showed normal
Scientific Reports | (2021) 11:5755 | https://doi.org/10.1038/s41598-021-85225-2 8
Vol:.(1234567890)www.nature.com/scientificreports/
Cell line Gene ID Product description Gene name
Tb927.1.4970 Hypothetical protein Null
Tb927.11.17040 Procyclic-enriched flagellar receptor adenylate cyclase 1 ACP1
AMPKα2
Tb927.6.2160 Hypothetical protein, conserved Null
Tb927.9.13200 Hypothetical protein Null
Tb927.10.10010 mRNA turnover protein 4 homolog, putative MRT4
Tb927.10.12080 Hypothetical protein, conserved Null
Tb927.10.12170 RAB-interacting protein, putative Null
Tb927.10.2450 Hypothetical protein Null
Tb927.10.6570 TPR repeat, putative Null
Tb927.10.8470 Glucose transporter, putative THT1-
Tb927.11.12700 Hypothetical protein, conserved Null
Tb927.11.1310 NADH-cytochrome b5 reductase, putative B5R
Tb927.11.16130 Nucleoside diphosphate kinase NDPK
CSD1
Tb927.11.3610 Nucleobase/nucleoside transporter 8.1 NT8.1
Tb927.11.3620 Nucleobase/nucleoside transporter 8.2 NT8.2
Tb927.11.4440 Hypothetical protein Null
Tb927.2.5140 Hypothetical protein, conserved Null
Tb927.2.6090 60S ribosomal protein L44 RPL44
Tb927.5.1460 Possible lysine decarboxylase, putative Null
Tb927.5.2180 Hypothetical protein, conserved Null
Tb927.8.2080 Fungal tRNA ligase phosphodiesterase domain containing protein, putative Null
Tb927.9.12030 Hypothetical protein, conserved Null
Tb927.11.13740 Procyclic-enriched flagellar receptor adenylate cyclase 5 ACP5
Tb927.11.18430 Variant surface glycoprotein (VSG), putative Null
Tb927.8.7350 Trans-sialidase, putative Null
RBP10 (KO) mVSG 1954 Metacyclic variant surface glycoprotein 1954 Null
mVSG 397 Metacyclic variant surface glycoprotein 397 Null
mVSG 531 Metacyclic variant surface glycoprotein 531 Null
mVSG 639 Metacyclic variant surface glycoprotein 639 Null
Tb927.10.12780 Zinc finger CCCH domain-containing protein 37 ZC3H37
Tb927.10.8500 Glucose transporter, putative THT2-
Tb927.10.9550 Hypothetical protein Null
Tb927.4.1560 Hypothetical protein, conserved Null
Tb927.5.2190 META domain/Domain of unknown function (DUF1935), putative Null
ZC3H45 Tb927.5.2220 META domain/Domain of unknown function (DUF1935), putative Null
Tb927.5.2230 Conserved protein Null
Tb927.5.2240 Hypothetical protein, conserved Null
Tb927.5.2250 META domain/Domain of unknown function (DUF1935), putative Null
Tb927.5.3320 Pseudokinase, putative Null
Tb927.9.14940 SLACS reverse transcriptase, putative Null
Table 2. Uniquely downregulated transcripts in individual RNAi and KO cell lines.
up-regulation (Table 3). However, metacyclogenesis in these cell lines was diminished greatly. This indicates
that ROS may be required, but they are not sufficient to trigger efficient developmental progression. One clear
example of a mRNA which was affected in all of the tested RNAi cell lines (Supplementary Table S16) is coding
for the mitochondrial malic enzyme (Tb927.11.5450). In T. brucei this enzyme is believed to convert l-malate
to pyruvate irreversibly and its down-regulation has a strong growth phenotype45. As pyruvate is the main end
product of metabolism in bloodstream form trypanosomes, this suggests that the balance between L-malate
and pyruvate (and/or the balance of NADP+ , the cofactor in the malic enzyme reaction, and NADPH in the
mitochondrion) could possibly play an important role in regulating generation of metacyclics in addition to ROS.
This is supported by the observation that pyruvate dehydrogenase E1α subunit (Tb927.10.12700) showed fourfold
higher phosphorylation in metacyclics relative to p rocyclics23, which in other organisms has been demonstrated
to inhibit enzyme function, i.e. pyruvate is blocked from entering the TCA cycle and it is likely to be the end
product of metabolism in developing metacyclics.
Our targeted RNAi screen was focused primarily on nucleic-acid-binding proteins and protein kinases and
phosphatases. Interestingly, the RNA-Seq data from selected group of these cell lines revealed that these com-
ponents of gene expression regulatory networks are able to affect the abundance of a subset of transcripts very
Scientific Reports | (2021) 11:5755 | https://doi.org/10.1038/s41598-021-85225-2 9
Vol.:(0123456789)www.nature.com/scientificreports/
Figure 5. Schematic of identified components regulating metacyclogenesis in T. brucei. The order of
components at each step and the position of pathway inhibitors is unknown. Those in bold italics were analyzed
by RNA-Seq.
similarly. This suggests that different post-transcriptional regulons intersect in a defined pool of mRNAs, which
exhibit developmentally regulated changes in expression and are under the direct or indirect control of these
different RBPs. It is very likely that most or all of these transcripts are the direct targets for several of the RBPs
studied here. Interestingly, among this subset is the mRNA for hnRNP F/H, yet another protein with a role in
regulating the trypanosome life cycle. HnRNP F/H is highly upregulated in m etacyclic23 and bloodstream form
parasites46 in comparison to procyclics and has been shown to influence the efficiency of pre-mRNA trans-
splicing and mRNA stability in a life-cycle-dependent m anner46.
In conclusion, our data suggest a considerable overlap between the genes that regulate the formation of stumpy
bloodstream form trypanosomes and the genes that govern the development of metacyclic form parasites. This
indicates that the vast majority of these gene expression regulators affect processes associated with cell-cycle
arrest and decrease in biosynthetic capacity in cells transitioning to quiescence, a state of T. brucei development
strongly correlated with transmission in either direction between the tsetse fly vector and the mammalian host.
Methods
Polysome analysis and RNA‑seq. The RBP6 overexpression cell line18 was induced for 48 h with doxycy-
cline at a final concentration of 10 μg/μl. Un-induced and 48 h induced cells were incubated with cycloheximide
at a final concentration 0.1 μg/μl for 1 h. Cytoplasmic extracts were prepared using detergent lysis and manual
homogenization with polysome buffer (120 mM KCl, 20 mM Tris, pH 7.4, 2 mM M gCl2, 1 mM dithiothreitol,
10 μg/ml leupeptin and 0.1 μg/μl cycloheximide), containing 40 Units of RNase inhibitor and 1.2% Nonidet
P-40. The cellular lysates were cleared by centrifugation at 14,000 rpm for 4 min. The concentration of nucleic
acid in the lysate was measured by absorbance at 260 nm. The supernatants corresponding to 80 OD260 were
layered onto 15–50% linear sucrose gradients with 0.1 μg/μl cycloheximide in polysome buffer and centrifuged
for 2 h at 36,000 rpm in a Beckman SW-41 rotor at 4 °C. The A254 profile was recorded using the ISCO UA-6
detector. Fractions of 500 μl were manually collected from the gradient and prior to RNA extraction, 5 ng of
in vitro transcribed firefly luciferase (Promega) were added to each fraction to allow for normalization. Each
fraction was supplemented with 200 μg/ml of proteinase K, 1% SDS, 10 mM EDTA and incubated at 65 °C for
30 min, followed by RNA isolation using the phenol–chloroform method. Based on the sucrose gradient profile,
Scientific Reports | (2021) 11:5755 | https://doi.org/10.1038/s41598-021-85225-2 10
Vol:.(1234567890)www.nature.com/scientificreports/
Gene ID Product description Gene name
Tb927.10.7090 Alternative oxidase, mitochondrial AOX
Tb927.4.3990 Amino acid transporter, putative Null
Tb927.6.5020 Cyclin 7, putative CYC7
Tb927.10.10770 Generative cell specific 1 protein, putative GCS1
Tb927.10.13410 Hypothetical protein Null
Tb927.2.1290 Hypothetical protein Null
Tb927.4.140 Hypothetical protein Null
Tb927.6.110 Hypothetical protein Null
Tb927.7.7560 Hypothetical protein Null
Tb927.10.14900 Hypothetical protein, conserved Null
Tb927.2.5290 Hypothetical protein, conserved Null
Tb927.2.5300 Hypothetical protein, conserved Null
Tb927.2.5320 Hypothetical protein, conserved Null
Tb927.2.5350 Hypothetical protein, conserved Null
Tb927.2.5360 Hypothetical protein, conserved Null
Tb927.10.13400 Phosphatidic acid phosphatase, putative Null
Tb927.2.5530 Present in the outer mitochondrial membrane proteome 22–1 POMP22-1
Tb927.2.5610 Present in the outer mitochondrial membrane proteome 22B POMP22B
Tb927.7.5960 Protein associated with differentiation 4, putative PAD4
Tb927.7.5980 Protein associated with differentiation 6, putative PAD6
Tb927.7.6000 Protein associated with differentiation 8, putative PAD8
Tb927.2.160 Protein of unknown function (DUF1181), putative Null
Tb927.6.220 purine nucleoside transporter TbNT9
Tb927.4.300 RETROTRANSPOSON HOT SPOT PROTEIN 3 (RHS3), PUTATIVE RHS3
Tb927.1.70 RETROTRANSPOSON HOT SPOT PROTEIN 4 (RHS4), PUTATIVE RHS4
Tb927.2.240 RETROTRANSPOSON HOT SPOT PROTEIN 5 (RHS5), PUTATIVE RHS5
Tb927.7.2010 RETROTRANSPOSON HOT SPOT PROTEIN 7 (RHS7), PUTATIVE RHS7
Tb927.1.2160 Small kinetoplastid calpain-related protein 1–5 SKCRP1-5
Tb927.7.2180 T. brucei spp.-specific protein, T. brucei spp.-specific protein, putative Null
Tb927.5.3990 Variant surface glycoprotein (VSG, atypical), putative Null
Table 3. Transcripts not affected in any of the RNAi and KO cell lines.
fractions corresponding to monosomes and those with heavy polyribosomes were pooled separately. Three bio-
logical replicates were processed by RNA-Seq.
Plasmid constructions. To obtain inducible hairpin RNAi constructs, we followed the single-cloning-step
procedure for generating RNAi p lasmids33. First, we created a suitable RNAi vector. The phleomycin resistant
construct that integrates at the 177-bp repeat, pLew100.v5-Ble-177-bp rep, was digested with HindIII and PstI to
remove the 3′UTR of aldolase. Two oligonucleotides (“GCATCATCTAGACAATCA” and “ACGTCGTAGTAG
ATCTGTTAGTTCGA”) were annealed exposing the PstI and HindIII sticky ends. The annealed oligonucleo-
tides were ligated into the digested pLew100.v5 (Ble) plasmid. This plasmid contains three restriction sites that
are suitable for the single-cloning-step protocol, which are XbaI, HindIII, and PstI. We called this construct
pXHPHP and prepped this vector for ligation by individually digesting it with either XbaI or HindIII. Next, we
prepared inserts for our RNAi construct, where a 400 to 600 base pair region of the coding sequence of one gene
was PCR amplified. This amplicon contained either a HindIII or XbaI restriction site at the 5′ end, while the 3′
end contained approximately 50 base pairs of random sequences and an EcoRI restriction site. The amplicon was
digested with EcoRI and self-ligated to form a stuffer-containing inverted repeat insert. The self-ligated insert
was digested with either HindIII or XbaI and ligated into the HindIII or XbaI digested pXHPHP vector. These
constructs were confirmed by restriction enzyme digest and DNA sequencing. The construct was linearized
with NotI prior to transfection. The entire list of primers used for RNAi plasmid construction is available in
Supplementary Table S17.
T. brucei cell culture and transfection. The T. brucei Lister 427 (29–13) strain that carries the inducibly-
expressed RBP6 (Tb927.3.2930) transgene at the rDNA spacer (pLew100.v5-BSD) was cultured at 28 °C and 5%
CO2 in Cunningham’s media supplemented with 10% Tet-system approved heat-inactivated Fetal Bovine Serum
(FBS) and 2 mM l-glutamine, 100 units/ml penicillin, 100 μg/ml streptomycin, 50 μg/ml gentamicin, 15 μg/ml
G418, 50 μg/ml hygromycin B, and 10 μg/ml blasticidin. A total of 1 × 10⁸ of the RBP6 overexpression cells were
used to transfect an inducible hairpin RNAi construct. Cells were centrifuged at 3500 RPM for 6 min, washed in
Cytomix (20 mM KCl, 0.15 mM CaCl2, 10 mM K2HPO4, 25 mM 4-(2-hydroxyethyl)piperazine-1-ethanesulfonic
Scientific Reports | (2021) 11:5755 | https://doi.org/10.1038/s41598-021-85225-2 11
Vol.:(0123456789)www.nature.com/scientificreports/
acid (Hepes), 2 mM ethylenediaminetetraacetic acid (EDTA) and 5 mM MgCl2, pH7.6), and resuspended in
500 μl Cytomix. Subsequently, 25 μg of linearized plasmid DNA was mixed with the solution and cells were
pulsed twice at 1600 V with a time constant of 0.6 ms using a GenePulser Xcell (BioRad, Hercules, CA, USA).
The selective drug, phleomycin, was added to the culture medium 24 h after electroporation at a final concentra-
tion of 2.5 μg/ml.
Scoring epimastigotes and metacyclic cells. After 72 h of doxycycline induction of an RNAi cell line,
epimastigote parasites were scored from a mixed population after DNA staining by Hoechst. These quantifica-
tions were performed with 4% paraformaldehyde fixed cells and/or live cells. Different trypanosome cell types
were determined by their size, shape, and position of the kinetoplast relative to the nucleus and the posterior
end of the cell.
Western blot analysis. Western blots were performed as described previously47. To stabilize the BARP
protein, 0.5 mM of the metalloprotease inhibitor bathophenanthroline disulphonic acid (Acros Organics, cata-
logue no. AC164050050) was added to each 48-h RBP6 induced cell line and incubated for 24 h. These cells were
then harvested for Western blot analysis. Rabbit antiserum against RBP6, BARP, and mVSG397 as well as mouse
antiserum against paraflagellar rod (PFR) or elongation factor 1-alpha (EF-1α, clone CBP-KK1 from Sigma-
Aldrich) was used at a 1:1000 dilution. Either PFR or EF-1α was used as a loading control for each Western blot.
Pierce Protease and Phosphatase Inhibitor Mini Tablets (Thermofisher, catalog no. A32959) was dissolved into
the lysis buffer following manufacturer’s instruction and Western blots were probed with the rabbit polyclonal
anti-p-AMPK (1:1000) antibody (Phospho-AMPKα (Thr172) (40H9) Rabbit mAb #2535, Cell Signaling tech-
nologies). The horseradish peroxidase-conjugated secondary antibody (Roche) was used at a 1:5000 dilution.
RNA preparation, RNA‑Seq, read processing, and data analysis. Total RNA was prepared from
approximately 2 × 10⁷ to 5 × 10⁷ un-induced cells, 1-, 2-, 3-, 4-, and 6-day induced cells that express both RBP6,
as well as a RNAi hairpin against either AMPKα2, ZC3H45, CSD1, and CSD2, or are KO for RBP10. Three bio-
logical replicates were performed at least one week apart, and the RNA was prepared using the TRIzol reagent
from Invitrogen according to the manufacturer’s instructions. Isolation of poly(A)+ mRNA, library preparation
and sequencing on an Illumina HiSeq2500 platform were performed at the Yale Center for Genome Analysis as
described previously19. Read processing and data analysis was performed as described19.
Data availability
RNA-Seq data from this study have been submitted to the NCBI Sequence Read Archive—SRA at http://www.
ncbi.nlm.nih.gov/Traces/sra/sra.cgi with accession numbers: PRJNA657432, PRJNA656316, PRJNA656556,
PRJNA657048 and PRJNA657089.
Received: 21 October 2020; Accepted: 25 February 2021
References
1. Sharma, R. et al. The heart of darkness: Growth and form of Trypanosoma brucei in the tsetse fly. Trends Parasitol. 25, 517–524.
https://doi.org/10.1016/j.pt.2009.08.001 (2009).
2. Rojas, F. et al. Oligopeptide signaling through TbGPR89 drives trypanosome quorum sensing. Cell 176, 306–317. https://doi.
org/10.1016/j.cell.2018.10.041 (2019).
3. Mony, B. M. et al. Genome-wide dissection of the quorum sensing signalling pathway in Trypanosoma brucei. Nature 505, 681–685.
https://doi.org/10.1038/nature12864 (2014).
4. Tyler, K. M., Matthews, K. R. & Gull, K. The bloodstream differentiation-division of Trypanosoma brucei studied using mitochon-
drial markers. Proc. Biol. Sci. 264, 1481–1490. https://doi.org/10.1098/rspb.1997.0205 (1997).
5. Dean, S., Marchetti, R., Kirk, K. & Matthews, K. R. A surface transporter family conveys the trypanosome differentiation signal.
Nature 459, 213–217. https://doi.org/10.1038/nature07997 (2009).
6. Lonsdale-Eccles, J. D. et al. Trypanosomatid cysteine protease activity may be enhanced by a kininogen-like moiety from host
serum. Biochem. J. 305(Pt 2), 549–556. https://doi.org/10.1042/bj3050549 (1995).
7. Siqueira-Neto, J. L. et al. Cysteine proteases in protozoan parasites. PLoS Negl. Trop. Dis. 12, e0006512. https://doi.org/10.1371/
journal.pntd.0006512 (2018).
8. Abubakar, L. U., Bulimo, W. D., Mulaa, F. J. & Osir, E. O. Molecular characterization of a tsetse fly midgut proteolytic lec-
tin that mediates differentiation of African trypanosomes. Insect. Biochem. Mol. Biol. 36, 344–352. https://doi.org/10.1016/j.
ibmb.2006.01.010 (2006).
9. Liniger, M. et al. Cleavage of trypanosome surface glycoproteins by alkaline trypsin-like enzyme(s) in the midgut of Glossina
morsitans. Int. J. Parasitol. 33, 1319–1328. https://doi.org/10.1016/s0020-7519(03)00182-6 (2003).
10. Dyer, N. A., Rose, C., Ejeh, N. O. & Acosta-Serrano, A. Flying tryps: Survival and maturation of trypanosomes in tsetse flies. Trends
Parasitol. 29, 188–196. https://doi.org/10.1016/j.pt.2013.02.003 (2013).
11. Richardson, J. S. & Richardson, D. C. Amino acid preferences for specific locations at the ends of alpha helices. Science 240,
1648–1652. https://doi.org/10.1126/science.3381086 (1988).
12. Roditi, I. et al. Procyclin gene expression and loss of the variant surface glycoprotein during differentiation of Trypanosoma brucei.
J. Cell Biol. 108, 737–746. https://doi.org/10.1083/jcb.108.2.737 (1989).
13. Vassella, E. et al. A major surface glycoprotein of Trypanosoma brucei is expressed transiently during development and can be
regulated post-transcriptionally by glycerol or hypoxia. Genes Dev. 14, 615–626 (2000).
14. Urwyler, S., Studer, E., Renggli, C. K. & Roditi, I. A family of stage-specific alanine-rich proteins on the surface of epimastigote
forms of Trypanosoma brucei. Mol. Microbiol. 63, 218–228. https://doi.org/10.1111/j.1365-2958.2006.05492.x (2007).
15. Vickerman, K. Polymorphism and mitochondrial activity in sleeping sickness trypanosomes. Nature 208, 762–766. https://doi.
org/10.1038/208762a0 (1965).
16. Natesan, S. K., Peacock, L., Matthews, K., Gibson, W. & Field, M. C. Activation of endocytosis as an adaptation to the mammalian
host by trypanosomes. Eukaryot. Cell 6, 2029–2037. https://doi.org/10.1128/EC.00213-07 (2007).
Scientific Reports | (2021) 11:5755 | https://doi.org/10.1038/s41598-021-85225-2 12
Vol:.(1234567890)www.nature.com/scientificreports/
17. Tetley, L., Turner, C. M., Barry, J. D., Crowe, J. S. & Vickerman, K. Onset of expression of the variant surface glycoproteins of
Trypanosoma brucei in the tsetse fly studied using immunoelectron microscopy. J. Cell Sci. 87(Pt 2), 363–372 (1987).
18. Kolev, N. G., Ramey-Butler, K., Cross, G. A., Ullu, E. & Tschudi, C. Developmental progression to infectivity in Trypanosoma
brucei triggered by an RNA-binding protein. Science 338, 1352–1353. https://doi.org/10.1126/science.1229641 (2012).
19. Shi, H., Butler, K. & Tschudi, C. A single-point mutation in the RNA-binding protein 6 generates Trypanosoma brucei metacyclics
that are able to progress to bloodstream forms in vitro. Mol. Biochem. Parasitol. 224, 50–56. https://doi.org/10.1016/j.molbiopara
.2018.07.011 (2018).
20. Mugo, E. & Clayton, C. Expression of the RNA-binding protein RBP10 promotes the bloodstream-form differentiation state in
Trypanosoma brucei. PLoS Pathog. 13, e1006560. https://doi.org/10.1371/journal.ppat.1006560 (2017).
21. Mugo, E., Egler, F. & Clayton, C. Conversion of procyclic-form Trypanosoma brucei to the bloodstream form by transient expres-
sion of RBP10. Mol. Biochem. Parasitol. 216, 49–51. https://doi.org/10.1016/j.molbiopara.2017.06.009 (2017).
22. Wurst, M. et al. Expression of the RNA recognition motif protein RBP10 promotes a bloodstream-form transcript pattern in
Trypanosoma brucei. Mol. Microbiol. 83, 1048–1063. https://doi.org/10.1111/j.1365-2958.2012.07988.x (2012).
23. Christiano, R. et al. The proteome and transcriptome of the infectious metacyclic form of Trypanosoma brucei define quiescent
cells primed for mammalian invasion. Mol. Microbiol. 106, 74–92. https://doi.org/10.1111/mmi.13754 (2017).
24. Muller, L. S. M. et al. Genome organization and DNA accessibility control antigenic variation in trypanosomes. Nature 563,
121–125. https://doi.org/10.1038/s41586-018-0619-8 (2018).
25. Dolezelova, E. et al. Cell-based and multi-omics profiling reveals dynamic metabolic repurposing of mitochondria to drive devel-
opmental progression of Trypanosoma brucei. PLoS Biol. 18, e3000741. https://doi.org/10.1371/journal.pbio.3000741 (2020).
26. Djikeng, A., Shi, H., Tschudi, C., Shen, S. & Ullu, E. An siRNA ribonucleoprotein is found associated with polyribosomes in
Trypanosoma brucei. RNA 9, 802–808. https://doi.org/10.1261/rna.5270203 (2003).
27. Gustin, M. C., Albertyn, J., Alexander, M. & Davenport, K. MAP kinase pathways in the yeast Saccharomyces cerevisiae. Microbiol.
Mol. Biol. Rev. 62, 1264–1300 (1998).
28. Simon, M. N., Pelegrini, O., Veron, M. & Kay, R. R. Mutation of protein kinase A causes heterochronic development of Dictyos-
telium. Nature 356, 171–172. https://doi.org/10.1038/356171a0 (1992).
29. Krivega, M. V. et al. Cyclin E1 plays a key role in balancing between totipotency and differentiation in human embryonic cells.
Mol. Hum. Reprod. 21, 942–956. https://doi.org/10.1093/molehr/gav053 (2015).
30. Kolev, N. G., Ullu, E. & Tschudi, C. The emerging role of RNA-binding proteins in the life cycle of Trypanosoma brucei. Cell
Microbiol. 16, 482–489. https://doi.org/10.1111/cmi.12268 (2014).
31. Alsford, S. et al. High-throughput phenotyping using parallel sequencing of RNA interference targets in the African trypanosome.
Genome Res. 21, 915–924. https://doi.org/10.1101/gr.115089.110 (2011).
32. Wang, Z., Morris, J. C., Drew, M. E. & Englund, P. T. Inhibition of Trypanosoma brucei gene expression by RNA interference using
an integratable vector with opposing T7 promoters. J. Biol. Chem. 275, 40174–40179. https://doi.org/10.1074/jbc.M008405200
(2000).
33. Atayde, V. D., Ullu, E. & Kolev, N. G. A single-cloning-step procedure for the generation of RNAi plasmids producing long stem-
loop RNA. Mol. Biochem. Parasitol. 184, 55–58. https://doi.org/10.1016/j.molbiopara.2012.04.003 (2012).
34. Ramey-Butler, K., Ullu, E., Kolev, N. G. & Tschudi, C. Synchronous expression of individual metacyclic variant surface glycoprotein
genes in Trypanosoma brucei. Mol. Biochem. Parasitol. 200, 1–4. https://doi.org/10.1016/j.molbiopara.2015.04.001 (2015).
35. Lu, S. et al. CDD/SPARCLE: The conserved domain database in 2020. Nucleic Acids Res. 48, D265–D268. https://doi.org/10.1093/
nar/gkz991 (2020).
36. Zanotti, G. & Cendron, L. Structural and functional aspects of the Helicobacter pylori secretome. World J. Gastroenterol. 20,
1402–1423. https://doi.org/10.3748/wjg.v20.i6.1402 (2014).
37. Naqvi, A. A. et al. Sequence analysis of hypothetical proteins from Helicobacter pylori 26695 to identify potential virulence factors.
Genom. Inform. 14, 125–135. https://doi.org/10.5808/GI.2016.14.3.125 (2016).
38. Nourbakhsh, F., Uliana, S. R. & Smith, D. F. Characterisation and expression of a stage-regulated gene of Leishmania major. Mol.
Biochem. Parasitol. 76, 201–213. https://doi.org/10.1016/0166-6851(95)02559-6 (1996).
39. Puri, V., Goyal, A., Sankaranarayanan, R., Enright, A. J. & Vaidya, T. Evolutionary and functional insights into Leishmania META1:
Evidence for lateral gene transfer and a role for META1 in secretion. BMC Evol. Biol. 11, 334. https://doi.org/10.1186/1471-2148-
11-334 (2011).
40. Uliana, S. R., Goyal, N., Freymuller, E. & Smith, D. F. Leishmania: overexpression and comparative structural analysis of the stage-
regulated meta 1 gene. Exp. Parasitol. 92, 183–191. https://doi.org/10.1006/expr.1999.4410 (1999).
41. Vigneron, A. et al. Single-cell RNA sequencing of Trypanosoma brucei from tsetse salivary glands unveils metacyclogenesis and
identifies potential transmission blocking antigens. Proc. Natl. Acad. Sci. USA 117, 2613–2621. https: //doi.org/10.1073/pnas.19144
23117(2020).
42. Szoor, B., Ruberto, I., Burchmore, R. & Matthews, K. R. A novel phosphatase cascade regulates differentiation in Trypanosoma
brucei via a glycosomal signaling pathway. Genes Dev. 24, 1306–1316. https://doi.org/10.1101/gad.570310 (2010).
43. Jones, N. G. et al. Regulators of Trypanosoma brucei cell cycle progression and differentiation identified using a kinome-wide RNAi
screen. PLoS Pathog. 10, e1003886. https://doi.org/10.1371/journal.ppat.1003886 (2014).
44. Vassella, E. et al. Expression of a major surface protein of Trypanosoma brucei insect forms is controlled by the activity of mito-
chondrial enzymes. Mol. Biol. Cell 15, 3986–3993. https://doi.org/10.1091/mbc.e04-04-0341 (2004).
45. Allmann, S. et al. Cytosolic NADPH homeostasis in glucose-starved procyclic Trypanosoma brucei relies on malic enzyme and the
pentose phosphate pathway fed by gluconeogenic flux. J. Biol. Chem. 288, 18494–18505. https://doi.org/10.1074/jbc.M113.46297
8 (2013).
46. Gupta, S. K. et al. The hnRNP F/H homologue of Trypanosoma brucei is differentially expressed in the two life cycle stages of the
parasite and regulates splicing and mRNA stability. Nucleic Acids Res. 41, 6577–6594. https://doi.org/10.1093/nar/gkt369 (2013).
47. Shi, H., Djikeng, A., Tschudi, C. & Ullu, E. Argonaute protein in the early divergent eukaryote Trypanosoma brucei: Control of
small interfering RNA accumulation and retroposon transcript abundance. Mol. Cell Biol. 24, 420–427. https://doi.org/10.1128/
mcb.24.1.420-427.2004 (2004).
48. Lex, A., Gehlenborg, N., Strobelt, H., Vuillemot, R. & Pfister, H. UpSet: Visualization of intersecting sets. IEEE Trans. Vis. Comput.
Graph 20, 1983–1992. https://doi.org/10.1109/TVCG.2014.2346248 (2014).
Acknowledgements
We acknowledge the Yale Center for Genome Analysis for Illumina sequencing. We thank Dr. Diane McMahon-
Pratt for the anti-PFR antibody and Dr. Isabel Roditi for the anti-BARP antibody. This work was supported by
National Institutes of Health (http://www.nih.gov) grants AI028798 and AI110325 to C.T. J.Y.T. was supported in
part by a training grant from the National Institute of Allergy and Infectious Diseases of the National Institutes
of Health (T32 AI007404 to C.T.).
Scientific Reports | (2021) 11:5755 | https://doi.org/10.1038/s41598-021-85225-2 13
Vol.:(0123456789)You can also read


