A 1-year characterization of organic aerosol composition and sources using an extractive electrospray ionization time-of-flight mass spectrometer ...
←
→
Page content transcription
If your browser does not render page correctly, please read the page content below
Atmos. Chem. Phys., 20, 7875–7893, 2020
https://doi.org/10.5194/acp-20-7875-2020
© Author(s) 2020. This work is distributed under
the Creative Commons Attribution 4.0 License.

A 1-year characterization of organic aerosol composition and
sources using an extractive electrospray ionization time-of-flight
mass spectrometer (EESI-TOF)
Lu Qi1,2 , Alexander L. Vogel1,a , Sepideh Esmaeilirad1 , Liming Cao3 , Jing Zheng4 , Jean-Luc Jaffrezo5 , Paola Fermo6 ,
Anne Kasper-Giebl7 , Kaspar R. Daellenbach1,b , Mindong Chen2 , Xinlei Ge2 , Urs Baltensperger1 , André S. H. Prévôt1 ,
and Jay G. Slowik1
1 Laboratory   of Atmospheric Chemistry, Paul Scherrer Institute (PSI), 5232 Villigen, Switzerland
2 Collaborative   Innovation Center of Atmospheric Environment and Equipment Technology,
Nanjing University of Information Science & Technology, Nanjing, 210044, China
3 Key Laboratory for Urban Habitat Environmental Science and Technology, School of Environment and Energy,

Peking University Shenzhen Graduate School, Shenzhen, 518055, China
4 State Key Joint Laboratory of Environmental Simulation and Pollution Control, College of Environmental Sciences

and Engineering, Peking University, Beijing, 100871, China
5 University Grenoble Alpes, CNRS, IGE, 38000 Grenoble, France
6 Department of Chemistry, University of Milan, 20133 Milan, Italy
7 Institute of Chemical Technologies and Analytics, Vienna University of Technology, 1060 Vienna, Austria
a now at: Institute for Atmospheric and Environmental Sciences, Goethe University, Frankfurt am Main, Germany
b now at: Institute for Atmospheric and Earth System Research, University of Helsinki, Helsinki, Finland

Correspondence: Jay G. Slowik (jay.slowik@psi.ch) and André S. H. Prévôt (andre.prevot@psi.ch)

Received: 18 December 2019 – Discussion started: 10 January 2020
Revised: 17 May 2020 – Accepted: 8 June 2020 – Published: 8 July 2020

Abstract. The aerosol mass spectrometer (AMS), combined         for EESI-TOF measurements of 1 year of 24 h filter sam-
with statistical methods such as positive matrix factoriza-     ples collected approximately every fourth day throughout
tion (PMF), has greatly advanced the quantification of pri-     2013 at an urban site. The nebulized water extracts were
mary organic aerosol (POA) sources and total secondary or-      measured simultaneously with an AMS. The application of
ganic aerosol (SOA) mass. However, the use of thermal va-       positive matrix factorization (PMF) to EESI-TOF spectra
porization and electron ionization yields extensive thermal     resolved seven factors, which describe water-soluble OA:
decomposition and ionization-induced fragmentation, which       less and more aged biomass burning aerosol (LABBEESI
limit chemical information needed for SOA source appor-         and MABBEESI , respectively), cigarette-smoke-related or-
tionment. The recently developed extractive electrospray ion-   ganic aerosol, primary biological organic aerosol, biogenic
ization time-of-flight mass spectrometer (EESI-TOF) pro-        secondary organic aerosol, and a summer mixed oxygenated
vides mass spectra of the organic aerosol fraction with a       organic aerosol factor. Seasonal trends and relative contri-
linear response to mass and no thermal decomposition or         butions of the EESI-TOF OA sources were compared with
ionization-induced fragmentation. However, the costs and        AMS source apportionment factors, measured water-soluble
operational requirements of online instruments make their       ions, cellulose, and meteorological data. Cluster analysis was
use impractical for long-term or spatially dense monitoring     utilized to identify key factor-specific ions based on PMF.
applications. This challenge was overcome for AMS mea-          Both LABB and MABB contribute strongly during winter.
surements by measuring re-nebulized water extracts from         LABB is distinguished by very high signals from C6 H10 O5
ambient filter samples. Here, we apply the same strategy        (levoglucosan and isomers) and C8 H12 O6 , whereas MABB is

Published by Copernicus Publications on behalf of the European Geosciences Union.
7876                                     L. Qi et al.: A 1-year characterization of organic aerosol composition and sources

characterized by a large number of Cx Hy Oz and Cx Hy Oz N        strument, improving comparability; (4) the capability of par-
species of two distinct populations: one with low H : C and       ticle composition measurement outside the size-dependent
high O : C and the other with high H : C and low O : C.           transmission range of the measuring instrument (e.g., coarse-
Two oxygenated summertime SOA sources were attributed to          mode particles in the AMS); (5) and that the expense of ad-
terpene-derived biogenic SOA, a major summertime aerosol          ditional sample analysis by newly developed instruments is
source in central Europe. Furthermore, a primary biological       low once the filter sampling infrastructure is installed. On the
organic aerosol factor was identified, which was dominated        other hand, drawbacks of the filter sampling and offline mea-
by plant-derived fatty acids and correlated with free cel-        surement strategy include possible positive or negative arti-
lulose. The cigarette-smoke-related factor contained a high       facts due to condensation or evaporation of semi-volatile or-
contribution of nicotine and high abundance of organic ni-        ganics or aging during sampling, while compound-dependent
trate ions with low m/z.                                          extraction efficiencies make quantification more challenging.
                                                                     The general analytical strategy outlined above, specifically
                                                                  the application of online instrumentation capable of highly
                                                                  time-resolved measurements to offline analysis of collected
1   Introduction                                                  samples, has two key advantages relative to traditional of-
                                                                  fline techniques. First, the entire OA fraction can be analyzed
Organic aerosol (OA) has significant but highly uncertain         in comparison to the extracted one for the offline analysis
effects on climate and human health (Heal et al., 2012;           (64 %–76 % in the case of Switzerland, Daellenbach et al.,
Kelly et al., 2012). OA is either directly emitted (primary       2016). Second, sources that are tightly correlated on the 24 h
organic aerosol, POA) or formed in the atmosphere by gas-         timescales typical of filter measurement techniques may be
phase oxidation of anthropogenic and natural volatile or-         more easily resolved at higher time resolution; real-world
ganic compounds, followed by condensation or nucleation           source profiles from online measurements can therefore be
of less volatile products (secondary organic aerosol, SOA).       used in advanced factor analysis of offline techniques to im-
The Aerodyne aerosol mass spectrometer (AMS) provides             prove source separation (Daellenbach et al., 2016; Bozzetti
online measurements of OA composition and in combina-             et al., 2017).
tion with statistical methods such as positive matrix factor-        While the offline AMS technique has proven successful
ization (PMF) has greatly advanced the quantification of pri-     in characterizing POA sources and SOA mass, the AMS
mary organic aerosol (POA) sources and total secondary or-        chemical resolution is limited by substantial thermal decom-
ganic aerosol (SOA) mass, although individual SOA sources         position and ionization-induced fragmentation of the ana-
are not typically separable (Jimenez et al., 2003; DeCarlo        lyte molecules. This problem is especially severe for the
et al., 2008; Lanz et al., 2007; Ulbrich et al., 2009; Crippa     highly oxygenated, multifunctional molecules prevalent in
et al., 2013a; Elser et al., 2016; Zhang et al., 2011). How-      SOA, and, in most cases, prevents identification of source-
ever, the AMS cost and operational requirements make its          specific SOA factors. In contrast, the recently developed ex-
use impractical for long-term or spatially dense monitoring       tractive electrospray ionization time-of-flight mass spectrom-
applications. A few solutions were developed to overcome          eter (EESI-TOF) is capable of online measurements at high
these shortcomings; e.g., the robust, less expensive, Aerosol     time resolution without thermal decomposition or ionization-
Chemical Speciation Monitor (ACSM, Ng et al., 2007) and           induced fragmentation (Lopez-Hilfiker et al., 2019). The
the Time-of-Flight (TOF)-ACSM were developed for long-            EESI-TOF has been successfully deployed in several labora-
term campaigns (Fröhlich et al., 2013, 2015); however, the        tory (Pospisilova et al., 2020) and field (Qi et al., 2019; Ste-
low mass resolution of these instruments reduces their util-      fenelli et al., 2019) campaigns. It yields signals that are linear
ity. Traditional offline techniques like gas chromatography–      with mass (albeit with ion-dependent response factors), mak-
mass spectrometry (GC-MS) or liquid chromatography–               ing it suitable for source apportionment.
mass spectrometry (LC-MS) are chemically highly specific             Here we present the first offline EESI-TOF source appor-
but measure only a fraction the total organic aerosol. An-        tionment analysis, conducted on 1 year of PM10 filter sam-
other solution to this problem is the application of online in-   ples collected in Zurich, Switzerland, and complemented by
strumentation to extracted and re-aerosolized material from       AMS measurements. This analysis describes the sources and
particle filter samples routinely collected at ambient monitor-   processes governing the water-soluble fraction of OA. The
ing stations (Daellenbach et al., 2016). Compared to online       chosen site is very well characterized, with multiple source
measurements, there are a few advantages: (1) the practical-      apportionment studies by online measurements with an AMS
ity of long-term measurements; (2) the practicality of mak-       in different seasons (Lanz et al. 2010), an Aerosol Chemical
ing simultaneous measurements across multiple sites (possi-       Speciation Monitor (ACSM) during a full year (Canonaco et
bly including sites where access or infrastructure restrictions   al., 2013, 2015), and an EESI-TOF during summer and win-
make the deployment of high-end instrumentation challeng-         ter (Qi et al., 2019; Stefenelli et al., 2019), as well as offline
ing); (3) that such multi-site measurements can be performed      measurements with an AMS and 14 C analyses (Daellenbach
with not only the same instrument type but even a single in-      et al., 2016, 2017; Zotter et al., 2014).

Atmos. Chem. Phys., 20, 7875–7893, 2020                                             https://doi.org/10.5194/acp-20-7875-2020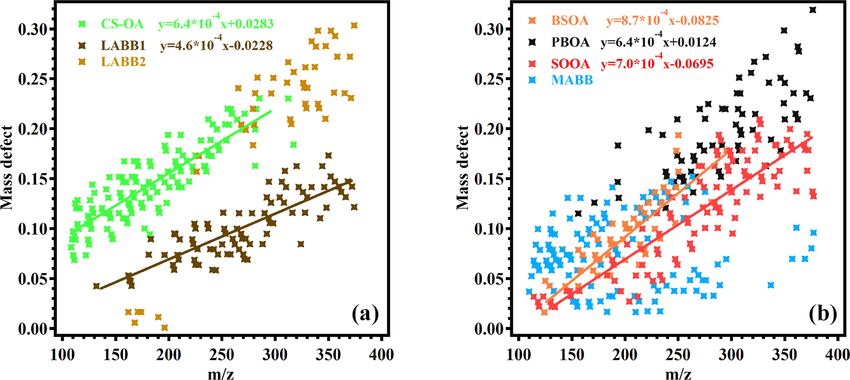
L. Qi et al.: A 1-year characterization of organic aerosol composition and sources                                              7877

2     Methods                                                       (HR-ToF-AMS). The total measurement time of each sam-
                                                                    ple was 5 min. Before and after each sample, a measurement
2.1    Site description and sample collection                       blank was generated by sampling nebulized ultrapure water
                                                                    for 10 min. Field blanks were measured following the same
Sampling was conducted at the NABEL station in Zurich               extraction procedure as the collected filter samples, yielding
(47◦ 220 N, 8◦ 330 E), described in detail elsewhere (Canonaco      a signal not statistically different from that of nebulized ul-
et al., 2013; Lanz et al., 2007). Briefly, this station is an ur-   trapure water. Each blank sample was recorded for 480 s.
ban location, situated in the Kaserne Park in the city center.
In addition to sources characteristic of urban areas, local in-     2.2.1   Offline AMS analysis
fluences from nearby restaurants, traffic, and human activi-
ties (e.g., cigarette smoking) are sometimes observed (Qi et        The offline AMS analysis followed the methodology devel-
al., 2019; Stefenelli et al., 2019). Meteorological parameters,     oped by Daellenbach et al. (2016). The offline AMS oper-
including temperature, relative humidity (RH), wind speed           ation was similar to other AMS measurements (Hu et al.,
(WS), wind direction (WD), and global radiation, as well as         2013; DeCarlo et al., 2006). HR-TOF-AMS data were pro-
concentrations of gas-phase species, including sulfur dioxide       cessed using the software SQUIRREL (SeQUential Igor data
(SO2 ), nitrogen dioxide (NO2 ), and nitrogen oxide (NO), are       RetRiEvaL; D. Sueper, University of Colorado, Boulder, CO,
recorded by the monitoring station.                                 USA) v.1.57 and PIKA (Peak Integration by Key Analysis)
   PM10 samples (91 filters) were collected every fourth            v.1.16 for the IGOR Pro software package (Wavemetrics,
day for 24 h throughout the year 2013 on quartz fiber fil-          Inc., Portland, OR, USA). The high-resolution mass spectral
ters (14.7 cm diameter) using high-volume samplers (Digitel         analysis was performed for each m/z (mass to charge) in the
DHA80, 500 L min−1 ). Before sampling, the filters were pre-        range of 12–120 at AMS V mode and yielded a dataset con-
baked at 800 ◦ C for 8 h. After collection, filters were wrapped    sisting of 257 ions (excluding isotopes and CO2 -dependent
in aluminum foil or lint-free paper, sealed in polyethylene         ions). The interference of NH4 NO3 on the CO+     2 signal was
bags, and stored at −20 ◦ C. Field blanks were collected and        corrected (Pieber et al., 2016) as follows:
stored following the same procedure (Bozzetti et al., 2017;
                                                                                               CO2,meas

Daellenbach et al., 2017).                                          CO2,real = CO2,meas −
                                                                                               NO3,meas NH4 NO3 ,pure
2.2    Offline measurements                                                 · NO3,real ,                                           (1)

                                                                                CO
The filters used for the present analysis were investigated         where the NO2,meas
                                                                                   3,meas
                                                                                                          correction factor was deter-
                                                                                          NH4 NO3 ,pure
by offline AMS PMF in a previous study (Daellenbach et              mined based on the measurement period and varied between
al., 2017). Here, to optimize comparison between the of-            1 % and ∼ 5 %.
fline AMS and offline EESI-TOF techniques, we produced                 The AMS data were rescaled to the ambient concentration
a new aerosol extract, which was then nebulized for new si-         by normalizing the measured signal to the estimated water-
multaneous AMS and EESI-TOF measurements. In this way,              soluble organic matter (WSOM) concentration, which was
we avoided differences due to extraction or nebulizer per-          calculated as the product of the measured water-soluble or-
formance, filter aging during storage, system background or         ganic carbon (WSOC) multiplied by the OM : OC ratios de-
contamination, handling artifacts, etc., which might occur if       termined from the offline AMS results. This method and the
the current EESI-TOF analyses were to be compared with              associated uncertainties are described in detail by Daellen-
the original offline AMS study. As a consequence, the AMS           bach et al. (2016, 2017). Note that because we do not attempt
dataset presented here is not completely identical to that of       to correct for the water extraction efficiency of OM compo-
Daellenbach et al. (2017), although the observed differences        nents, the analysis presented herein describes the source ap-
are small.                                                          portionment of AMS WSOM.
   For each analyzed filter sample, one 16 mm diameter fil-
ter punch was subjected to ultrasonic extraction in 10 mL of        2.2.2   Extractive Electrospray Ionization Time-of-flight
ultrapure water (18.2 M cm at 25 ◦ C, total organic carbon                 Mass Spectrometer (EESI-TOF)
(TOC)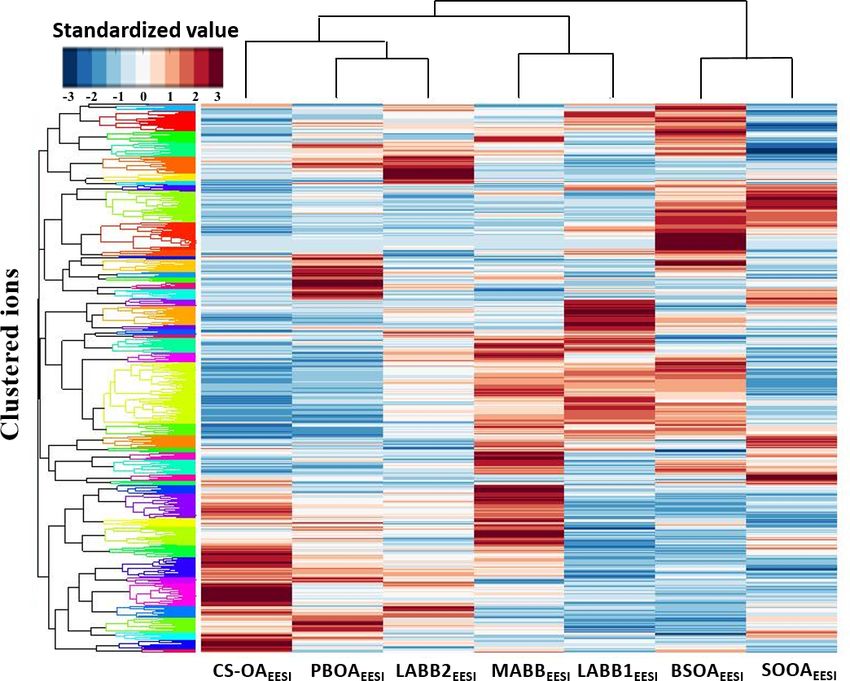
7878                                     L. Qi et al.: A 1-year characterization of organic aerosol composition and sources

ponents are extracted. The droplets are evaporated gently,        Levoglucosan measurements (Piazzalunga et al., 2013) were
yielding ions that are detected by the TOF-MS. The electro-       performed with a high-performance anion exchange chro-
spray working solution is a 50 : 50 water : methanol (MeOH,       matographer (HPAEC) with pulsed amperometric detection
UHPLC-MS, LiChrosolv) mixture with 100 ppm NaI (99 %,             (PAD) using an ion chromatograph (Dionex ICS-1000). Free
Sigma-Aldrich) as a charge carrier. Organic components are        cellulose was determined using an enzymatic conversion to
detected as adducts with Na+ . Spectra are recorded in posi-      d-glucose and subsequent determination of glucose with an
tive ion mode at 5 s time resolution. In normal operation, the    HPAEC.
EESI-TOF alternates between direct sampling of aerosol and
sampling through a particle filter to provide a background        2.3   Source apportionment techniques
measurement; however, the filter was not used in this study.
Instead, the measurement blanks (nebulized ultrapure wa-          The EESI-TOF PMF input data matrices included 91 filter
ter) were used to determine the background. The EESI-TOF          samples. The input errors σij were calculated as the uncer-
data were processed in Tofware 2.5.7 (Tofwerk AG, Thun,           tainty related to ion counting statistics and ion-to-ion sig-
Switzerland).                                                     nal variability at the detector (δi,j ), which were added in
   We report the signal measured by the EESI-TOF in terms         quadrature to the blank variability background (βij ) (Qi et
of mass flux of ions to the microchannel plate detector           al., 2019).
(ag s−1 , neglecting the mass of Na+ ), calculated as shown
                                                                         q
                                                                  σij = δij2 + βij2                                         (3)
in Eq. (2).
                                                                     We applied a minimum error corresponding to the mea-
Mx = Ix · (MWx − MWcc )                                    (2)
                                                                  surement of a single ion during the 5 s averaging period.
   Here Mx is the mass flux of ions in units of attograms per     Variables with a low signal-to-noise ratio (SNR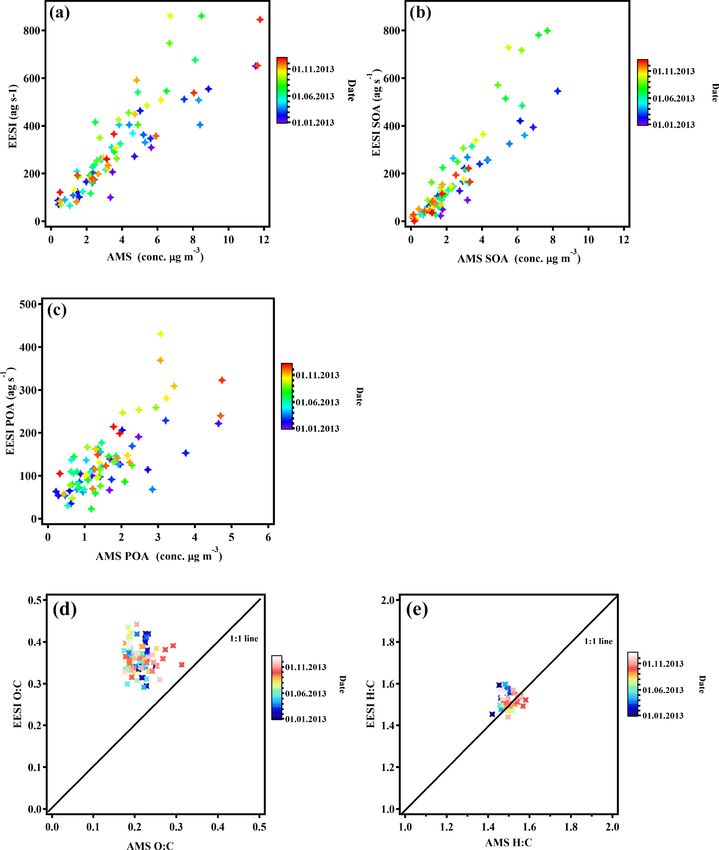
L. Qi et al.: A 1-year characterization of organic aerosol composition and sources                                            7879

where σi,j represents entries in the input uncertainty matrix.       3     Results and discussions
   The ME-2 implementation of the PMF algorithm offers
an efficient exploration of the solution space by allowing the       3.1    Interpretation of AMS-PMF factors
model to be directed towards environmentally meaningful ro-
tations. Here this was done by constraining the factor profile       Here we summarize the results of the AMS-PMF analysis
elements fi,k for one or more factors (Canonaco et al., 2013),       on the WSOM fraction, comprising comprised 58 % of the
implemented using the a value method, where the output fi,k          total OM, which as noted in Sect. 2.2 are very similar to
for each constrained factor is required to satisfy Eq. (6):          those of Daellenbach et al. (2017) conducted on different ex-
                                                                     tracts from the same ambient filter samples. HOAAMS and
         0          0                                                COAAMS mass profiles were constrained using anchor pro-
fi,k = fi,k ± a · fi,k .                                      (6)
                                                                     files obtained from winter in Paris (Crippa et al., 2013b)
        0 represents a predetermined anchor profile and the
Here, fi,k                                                           with a values of 0.1 and 0.2, respectively. A six-factor so-
scalar a (0 ≤ a ≤ 1) determines the tightness of constraint.         lution was selected as the best representation for the AMS
Anchor profiles may be obtained by several methods, in-              PMF analysis, yielding factors identified as hydrocarbon-
cluding prior studies, laboratory measurements of known              like OA (HOAAMS ), cooking OA (COAAMS ), biomass burn-
sources, or analysis of a subset of the current dataset, and         ing OA (BBOAAMS ), winter oxygenated OA (WOOAAMS ),
are discussed on a case-by-case basis in Sect. 3.1 (AMS) and         summer oxygenated OA (AMS ), and sulfur-containing OA
3.2 (EESI-TOF) (Canonaco et al., 2015).                              (SCOAAMS ). The methods of factor classification and fac-
                                                                     tor selection for the AMS PMF results are similar to Dael-
2.4   Identification of source-specific ions                         lenbach et al. (2017), although a detailed sensitivity analy-
                                                                     sis was not repeated. Figures 1 and S1 in the Supplement
To determine ions characteristic of individual factors (or           show the mass spectra and the time series of the AMS
groups of related factors), agglomerative hierarchical cluster-      factors, respectively. The main characteristics of the AMS
ing was conducted on the EESI-TOF matrix of PMF profiles.            PMF factors are summarized below. BBOAAMS exhibits high
A dendrogram is used to show relationships between mem-              contributions from C2 H4 O+  2 (m/z 60), a characteristic ion
bers of a group. A more detailed description is found in Qi et       from the fragmentation of anhydrosugars such as levoglu-
al. (2019).                                                          cosan (Sun et al., 2013; Takahama et al., 2013; Lin et al.,
   Here, we summarize the steps as follows: (1) calculation          2016). The BBOAAMS time series shows the expected sea-
of the standardized value (z score) is performed along the           sonal variation with elevated concentrations in winter, sup-
ions by using Eq. (7):                                               porting the identification of this factor. The oxygenated OA
      x −µ                                                           factors are resolved based on the differences in their seasonal
z=         .                                                  (7)    behavior: SOOAAMS (elevated in summer) and WOOAAMS
        σ
                                                                     (elevated in winter). This season-based separation of OOA
The µ is the mean value, σ is the standard deviation, and Z          factors is typical of offline AMS analysis (Bozzetti et al.,
represents the distance between the raw score and the mean           2016; Daellenbach et al., 2017) but contrasts with typi-
value in units of the standard deviation. (2) Formation of           cal results from PMF analysis of highly time-resolved data
groups of the new calculated data is performed by using the          from short-term measurements, where OOA factors are more
Euclidean distance (Eq. 8):                                          likely to be separated by volatility and/or photochemical age
                 s                                                   (Zhang et al., 2011; Jimenez et al., 2009). Even though AMS
                  Xn  xim − xj m 2                                has a high contribution in summer and shows an increase
σ dist xi , xj =      m=1
                                         .               (8)         with rising temperature, it also contributes, to a lesser de-
                               σm
                                                                     gree, during the other seasons (Fig. S1, Daellenbach et al.,
   Here, i = (1, . . . , m) and j = (1, . . . , m), (3) clustering   2017). The mass spectrum of SCOAAMS is dominated by
is performed along the columns (producing row-clustered              the fragment CH3 SO+   2 , which was found to derive from a
groups of factors) and along the rows (producing the clus-           sulfur-containing compound other than methanesulfonic acid
tered ions to each group). The calculation and the generation        (MSA) (Daellenbach et al., 2017). This factor is believed
of the dendrogram were performed with MATLAB R2017b                  to derive from primary traffic-related sources, and in size-
(Qi et al., 2019).                                                   resolved analyses at other sites it has been found mainly in
                                                                     the coarse mode (Vlachou et al., 2018). The meteorological
                                                                     data, ion data, and the factor comparison between EESI-TOF
                                                                     and AMS are presented in Sect. 3.2.2.

https://doi.org/10.5194/acp-20-7875-2020                                              Atmos. Chem. Phys., 20, 7875–7893, 2020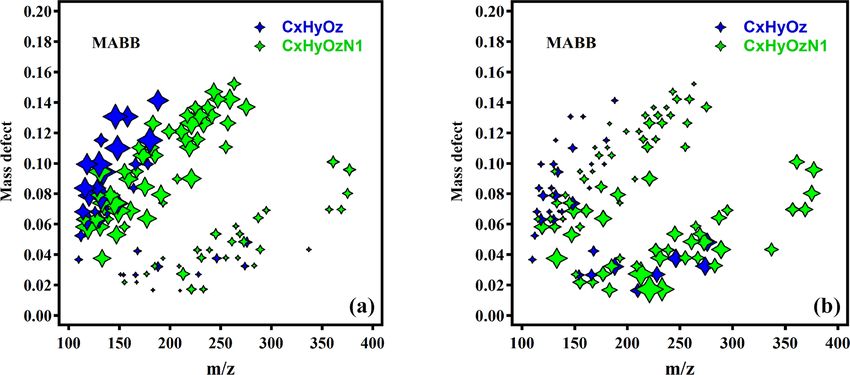
7880 L. Qi et al.: A 1-year characterization of organic aerosol composition and sources
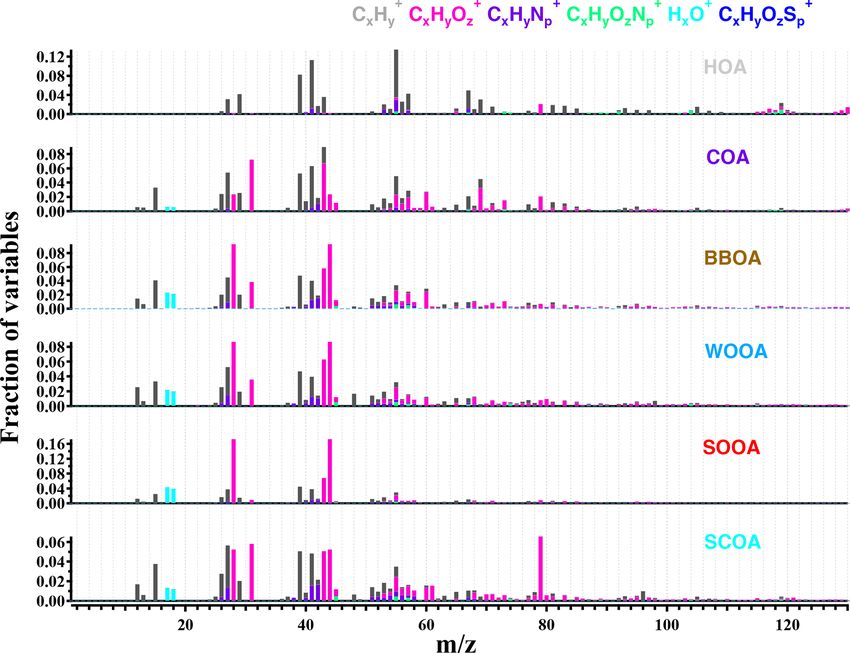
Figure 1. Factor profiles for the six-factor solution for AMS results with HOAAMS and COAAMS constrained by a = 0.1. The total signal
of each factor is normalized to unity, and the y axis presents the fractional contributions of the variables to the total signal of the fac-
tor (HOAAMS : hydrocarbon OA: COAAMS : cooking-related OA; BBOAAMS : biomass burning OA; WOOAAMS : winter oxygenated OA;
SOOAAMS : summer oxygenated OA; SCOAAMS , sulfur-containing oxygenated OA).
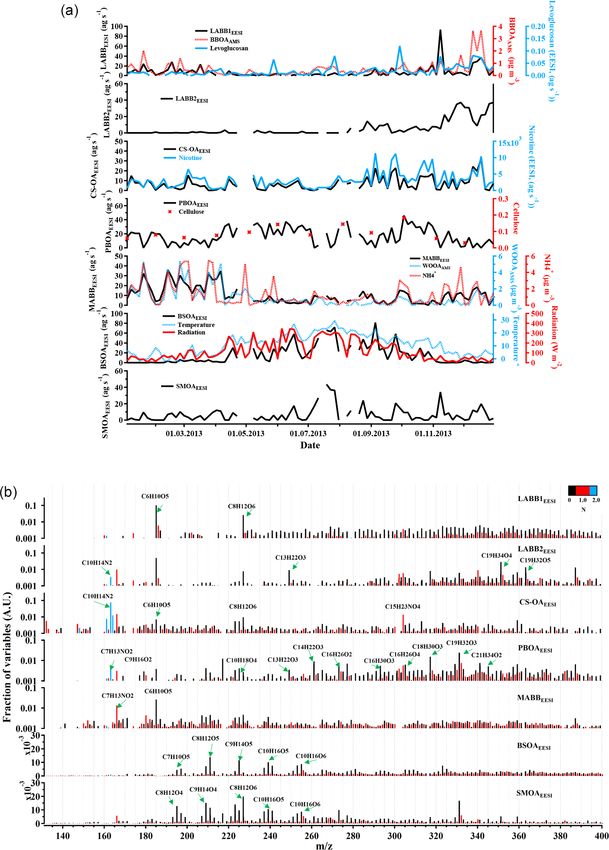
3.2 EESI-TOF source apportionment ion m/z 185.04 (C6 H10 O5 Na+ , C6 H10 O5 , levoglucosan, and
its isomers). In the following text, the neutral formula is used
3.2.1 EESI-TOF solution selection to represent ions and exhibits high contributions over the last
few months of the year, while a more aged biomass burn-
ing (MABBEESI ) is elevated during both winters. These two
Selection of an appropriate number of factors is a critical
factors are distinguished by their mass spectra, as discussed
component of any PMF analysis. Increasing the number of
further in Sect. 3.2.2. A biogenic secondary organic aerosol
factors gives the model more freedom to explain subtle vari-
(BSOAEESI ) factor contributes during the warm season and
ations in the data, but too many factors may force the model
has a negligible contribution from C6 H10 O5 . The primary bi-
to split a physically meaningful factor into nonmeaningful
ological organic aerosol (PBOAEESI ) factor has a different
ones. In this section, we present how we selected the number
time series that has no correlation with other external tracers.
of PMF factors based on the residual analysis and the so-
The last factor seems to be mixed due to the two major peaks
lution interpretability. The offline EESI-TOF PMF analysis
at m/z 163.12 and m/z 185.04. Based on the unique ion of
was performed for solutions with 1 to 10 factors. Solutions
m/z 163.12 in the factor mass spectrum, which is tentatively
were assessed based on the internal consistency of the fac-
explained by nicotine (C10 H15 N+ 2 ), we denote it here as the
tor mass spectra, and comparison of factor time series with
“163.12” factor.
offline AMS PMF solutions, external tracers, and auxiliary
In the six-factor solution (Fig. S4), the LABBEESI ,
data. The Q normalized by its expected value (Q/Qexp ) be-
MABBEESI , BSOAEESI , and PBOAEESI factors are qualita-
tween the various runs was around 2.4 for the six-factor so-
tively similar to their counterparts in the five-factor solution.
lution and higher (Fig. S2). Here we present a brief overview
However, the “163.12” factor is separated into a cigarette-
of the retrieved solutions as a function of the number of fac-
smoke-related OA (CS-OAEESI ) factor retaining the promi-
tors. Characteristics of the factors, including justifications for
nent peak at 163.12 and a less aged biomass burning factor
their assigned labels, are presented in Sect. 3.2.2.
(LABB2EESI ) with a strong contribution from C6 H10 O5 and
The five-factor solution is largely driven by differences be-
a high correlation with BBOAAMS .
tween the winter and summer seasons (Fig. S3). The solution
Increasing the number of factors to seven yields an ad-
includes two factors related to biomass combustion. A less
ditional factor, described as summer oxygenated organic
aged biomass burning (LABBEESI ) factor, dominated by the
Atmos. Chem. Phys., 20, 7875–7893, 2020 https://doi.org/10.5194/acp-20-7875-2020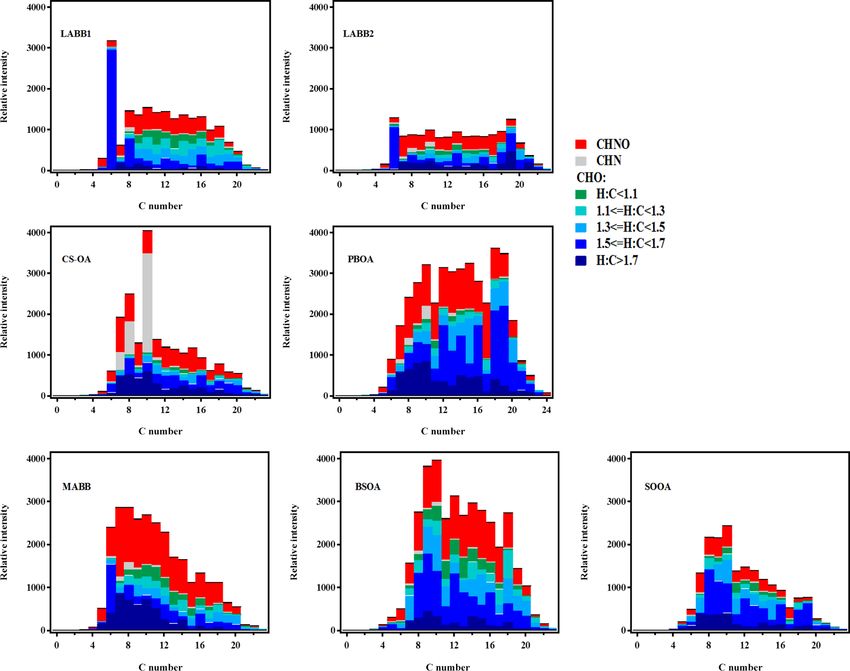
L. Qi et al.: A 1-year characterization of organic aerosol composition and sources 7881
aerosol (SMOAEESI ), which exhibits a high peak in summer tered based on having a similar z score pattern across the
but also has a significant contribution throughout the year factors and the resulting tree is shown on the left, colored
(Fig. 2). The time series correlates with AMS , and the pro- subjectively to guide the eye. Clearly, the dendrogram di-
file is similar to that of photochemically generated, biogenic- vides the factors into three main groups: one group including
dominated SOA identified from online measurements at the CS-OAEESI , PBOAEESI , and LABB2EESI ; a biomass burn-
same site (Stefenelli et al., 2019), as discussed in Sect. 3.2.2. ing group (LABB1EESI and MABBEESI ); and a biogenic OA
As discussed in Sect. 3.3, SOAAEESI evidences a more re- group (BSOAEESI and SMOAEESI ). Key ions are defined as
gional and mixed composition than BSOAEESI . those having a z score >1.5 for a given factor. These ions
When eight factors are assumed, the profile of the new fac- are shown in Fig. 5 as stacked histograms binned by the
tor points to an additional more aged biomass burning factor number of carbon atoms, with colors denoting chemical fam-
(MABB2EESI ) (Fig. S5) with two high peaks at m/z 165.09 ily (Cx Hy N, Cx Hy NOz , and Cx Hy Oz , with the latter further
(C7 H13 NO2 ) and m/z 185.04 (C6 H10 O5 ). Adding this factor separated by the H : C ratio). The left column displays these
alters the time series of other factors, decreasing their corre- ions in terms of their relative intensity within each factor pro-
lation with relevant tracer. Further, its time series has no clear file, while the right column shows the number of identified
seasonal trend or correlation with other reference, so it does ions. A full list of the identified key ions is given in Table S1
not provide further source information and is therefore dis- in the Supplement.
regarded. Increasing the number of factors beyond 8 yielded Overall, for all the EESI-TOF factors, the assigned ions
additional split or mixed factors without adding any new in- exhibit systematic patterns supporting the above identifica-
terpretable factors. We therefore selected the seven-factor so- tion. Figure 6a and b show the mass defect, defined as the
lution for the analysis below. exact m/z minus the nearest integer m/z, as a function of
m/z for the uniquely assigned ions for the seven factors.
3.2.2 Overview of EESI-TOF source apportionment For several displayed factors, linear correlations or clusters
of points are observed. Figure 6a shows the majority of
An overview of the EESI-TOF source apportionment the distinguished molecules (defined as factor-specific ions)
analysis is presented in this section, with the fac- of LABB1EESI and CS-OAEESI factors spread tightly from
tors discussed in detail in Sect. 3.3. Figure 2a shows m/z 100 to 400, while the factor of LABB2EESI clusters from
the time series of the seven EESI-TOF PMF fac- m/z 300 to 400 with a few additional points from m/z 150
tors (LABB1EESI , LABB2EESI , CS-OAEESI , PBOAEESI , to 200. The mass defects of the LABB1EESI -factor-specific
MABBEESI , BSOAEESI , SMOAEESI ) over the entire year, to- ions are lower than the CS-OAEESI - and LABB2EESI -factor-
gether with relevant AMS PMF factors, meteorological con- specific ions, which indicates that there are more aromatic
ditions, and other ancillary measurements. The retrieved fac- ions (with a lower H : C ratio) in the LABB1 factor. The
tors are analyzed in terms of their composition, correlation slope for the LABB1EESI factor of 4.6 × 10⁻⁴ is consistent
with markers, and relationship to offline AMS factors re- with addition of CH groups, which yield a slope of 6 × 10⁻⁴
trieved over the same period. Figure 2b presents the fac- (mass of CH is 13.00783, so slope corresponds to mass defect
tor mass spectra, with ions colored by number of nitrogen. of 0.00783 added over 13 m/z). It is also consistent with the
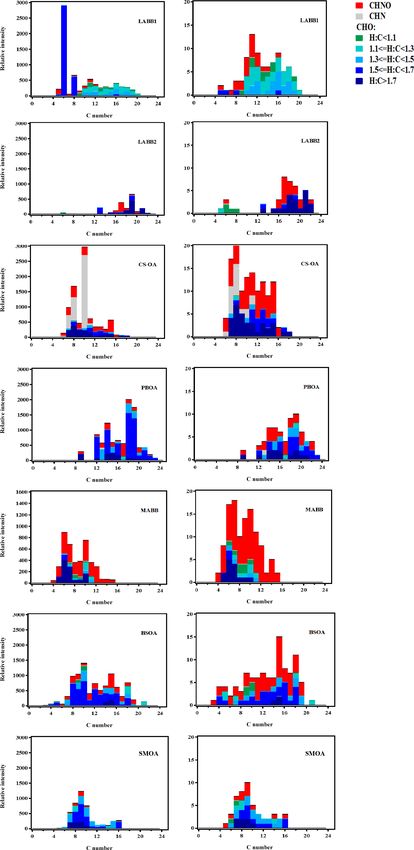
Figure 3 presents the spectra as stacked histograms accord- slope of the primary biomass burning source from a Zurich
ing to the chemical family, binned by the number of carbon field campaign (with a slope of 4.9 × 10⁻⁴ , Qi et al., 2019).
atoms, with the vertical axis representing the relative sig- Here, the slope of the CS-OAEESI factor is 6.4 × 10⁻⁴ , while
nal intensity. We define three chemical families: Cx Hy Nz Ok , the slope of the CS-OA factor from the Zurich field campaign
Cx Hy Nz , and Cx Hy Oz , with the latter further separated into is 8 × 10⁻⁴ . As shown in Fig. 6b, the mass of the markers
five groups by atomic H : C ratios: H : C 1.7. a high mass defect. A general trend is that the mass defect
As evidenced from the previous section and Figs. 2 and value of the BSOAEESI factor is a slightly higher than of the
3, many of the dominant ions in the EESI-TOF PMF anal- SMOAEESI factor. Both the slopes of BSOAEESI (8.7×10⁻⁴ )
ysis are shared by multiple factors. Here, we utilize a clus- and SMOAEESI (7.0 × 10⁻⁴ ) are consistent with the addi-
ter analysis to identify ions unique or nearly unique to a tion of CHO functional groups, which would yield a slope
single factor or group of factors, as described in detail in of 1 × 10⁻³ (mass defect of 0.00274 over 29 m/z).
Sect. 2.4. Figure 4 shows the results of this analysis as a
clustergram. Colors denote the z score of each factor–ion 3.3 EESI-TOF source apportionment factors
combination. Hierarchical agglomerative clustering was per-
formed independently on (1) the z score profile of each ion Cigarette-smoke-related OA (CS-OAEESI )
across all factors (vertical axis) and (2) the factor profile
across all ion z scores (horizontal axis). The outcomes of The CS-OAEESI time series lacks a clear seasonal trend.
these cluster analyses are represented as dendrograms on the However, as shown in Fig. 2a, it correlates strongly with the
vertical and horizontal axes, respectively. The ions are clus- EESI-TOF nicotine ion (R = 0.89). As a reduced nitrogen
https://doi.org/10.5194/acp-20-7875-2020 Atmos. Chem. Phys., 20, 7875–7893, 2020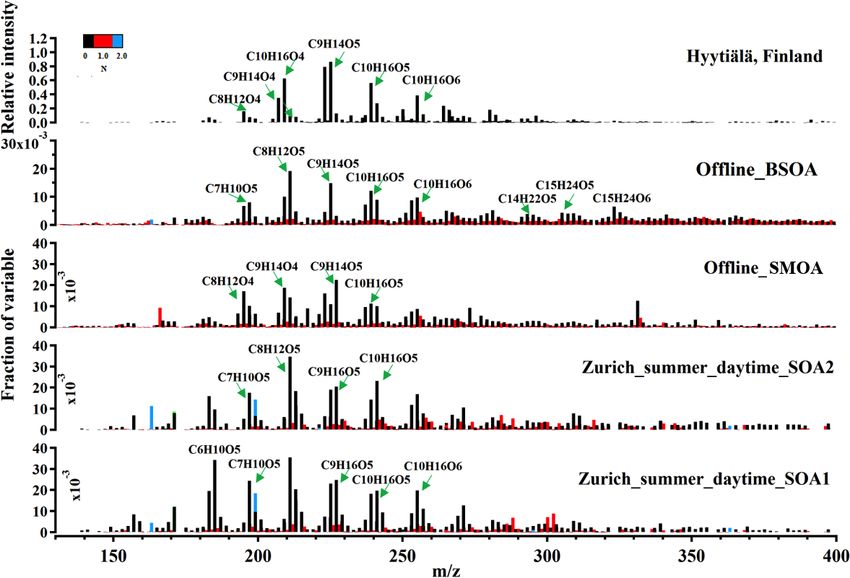
7882                                       L. Qi et al.: A 1-year characterization of organic aerosol composition and sources

Figure 2. (a) Time series of the EESI-TOF PMF analysis for the seven-factor solution, along with ancillary data. (b) Corresponding factor
profiles. For all y axes, EESI-TOF data are shown as mass flux (ag s−1 ), AMS data are shown in µg m−3 , and other units are given.

Atmos. Chem. Phys., 20, 7875–7893, 2020                                                  https://doi.org/10.5194/acp-20-7875-2020
L. Qi et al.: A 1-year characterization of organic aerosol composition and sources                                                    7883

Figure 3. Stacked histogram binned by carbon number of ions, showing the apportioned intensity of each bin to each factor. Colors correspond
to seven families.

compound, nicotine likely forms a stable ion by abstracting             Primary biological organic aerosol (PBOAEESI )
a hydrogen from water, leading to the observed cation. The
stacked histogram of the CS-OA factor (Fig. 3) is unique                The mass spectrum of the PBOAEESI factor is shown in
among the resolved factors in having strong contributions               Fig. 2b. Strong contributions from slightly oxygenated ions
from the CHN family. Other significant contributions come               with high carbon number and high H : C ratios, such as
from C6 H10 O5 and C8 H12 O6 (Fig. 2b). As discussed above,             C19 H32 O3 , C18 H30 O3 , C14 H22 O3 , C16 H26 O2 , and C9 H16 O2 ,
these species are also prevalent in biomass combustion and              are consistent with fatty acids identified from plants (http:
may occur in this factor due to combustion of biomass in the            //plantfadb.org, last access: 19 December 2019) (Tervahattu
cigarette.                                                              et al., 2005; Schilling et al., 2016). As shown in Fig. 3, the
   Oxidized nitrogen (ON) species (Cx Hy Oz N1 and                      overall mass spectrum of the PBOAEESI factor is shifted to-
Cx Hy Oz N2 ) are significant in the CS-OAEESI factor, as               wards ions with a higher carbon number (i.e., C12 to C20 )
shown in Fig. S6c. It is only slightly oxygenated, with                 relative to the other factors. Figure 4 shows that the ions
an O : C ratio below 0.2, and has a high H : C ratio of                 with high z score in PBOAEESI are mostly unique to this
approximately 1.9. The field measurements at the same                   factor. These ions are characterized by high carbon number
site had identified a cigarette smoke factor with a spectral            and high H : C ratio, as shown in Fig. 5. Of all the factors,
fingerprint similar to C10 H14 N2 (Qi et al., 2019; Stefenelli          only LABB2EESI (discussed below) has unique ions with a
et al., 2019). As shown in Fig. 5, the factor-specific ions of          comparably high carbon number distribution; however, the
the CS-OA factor from cluster analysis have high abundance              factor-specific ions of these two factors are not overlapping
of CHNO, CHN and a high H : C ratio (>1.5), which is                    Fig. 5).
consistent with our discussion that the factor is primary and              The PBOAEESI factor is observed throughout the year,
dominated by the nitrogen-containing species.                           with slightly higher contributions during summer (Figs. 2a,
                                                                        S9). PBOA typically consists of solid airborne particles de-
                                                                        rived from biological organisms, including microorganisms
                                                                        and fragments of biological materials such as plant debris

https://doi.org/10.5194/acp-20-7875-2020                                                   Atmos. Chem. Phys., 20, 7875–7893, 2020
7884 L. Qi et al.: A 1-year characterization of organic aerosol composition and sources
data are available. Without this strong temporal feature, COA
may contribute too little to the variability of the EESI-TOF
dataset to be resolved. A detailed comparison of the retrieved
PBOAEESI profile with previously obtained EESI-TOF COA
factors shows that dominant PBOAEESI ions are different
from the major components of cooking-related EESI-TOF
factors obtained from source apportionment of online sum-
mer and winter mass data, e.g., C16 H30 O3 , C18 H34 O2 (Ste-
fenelli et al., 2019; Qi et al., 2019). Further, we note that
the time series of the PBOAEESI and COAAMS factors are
not well correlated, suggesting different sources and thus a
unique source for PBOAEESI unrelated to cooking emissions.
Less aged biomass burning factors (LABB1EESI and
LABB2EESI )
Two factors were attributed to relatively fresh biomass burn-
Figure 4. Standardized matrix of individual EESI-TOF ions vs. ing emissions, denoted here as less aged biomass burning
EESI-TOF PMF factors, colored by z score. Ions and factors are type 1 and 2 (LABB1EESI and LABB2EESI , respectively).
sorted according to the results of their respective hierarchical clus- LABB1EESI displays many characteristics that are similar
tering analysis; the resulting dendrograms are shown on the respec- to primary or slightly aged wood burning emissions from
tive axes. The color of the compounds’ groups in the dendrogram previous EESI-TOF and AMS source apportionment stud-
are chosen to make groupings convenient to read (dendrogram col- ies. The time series of the LABB1EESI factor is correlated
ors are chosen arbitrarily to aid the eye). with the BBOAAMS factor (R = 0.6, Fig. 2a). LABB1EESI
also correlates with the C6 H10 O5 ion measured by the EESI-
TOF (R = 0.43), corresponding to levoglucosan and its iso-
and animal dander (Després et al., 2012). PBOA has been mers, which are well-known tracers of biomass combustion.
observed previously as a significant source of coarse aerosol LABB1EESI shows a pronounced yearly cycle with high con-
organic matter (OM, aerodynamic diameter >2.5 µm) in centration during both winters, consistent with previous stud-
Switzerland (Després et al., 2012; Bozzetti et al., 2016; Vla- ies identifying biomass burning as a major source of winter-
chou et al., 2018). The most frequently occurring biopolymer time OA in Zurich and central Europe (Crippa et al., 2013a,
in terrestrial environments is cellulose, as around 50 % of dry 2014; Bozzetti et al., 2016; Bruns et al., 2016). The factor
weight cellulose is from leaves (Sánchez-Ochoa et al., 2007; profile is dominated by the ions of C6 H10 O5 and C8 H12 O6
Jaenicke, 2005). Atmospheric “free cellulose” has been de- as shown in Fig. 2b, similar to fresh wood burning emissions
termined as a proxy for plant debris. As shown in Fig. 2a, cel- resolved by source apportionment of online EESI-TOF data
lulose correlates with the PBOAEESI time series (R =0.83) (Qi et al., 2019). Although the EESI-TOF provides only a
much more strongly than with any other EESI-TOF factor molecular formula and not structural information, we note
(RL. Qi et al.: A 1-year characterization of organic aerosol composition and sources 7885 Figure 5. Stacked histogram binned by carbon number and colored by chemical family of key ions derived from clustergram analysis of factor mass spectra. Two representations are shown, with the stacked height denoting ion intensity (left column) or number of identified ions (right column). https://doi.org/10.5194/acp-20-7875-2020 Atmos. Chem. Phys., 20, 7875–7893, 2020
7886                                        L. Qi et al.: A 1-year characterization of organic aerosol composition and sources

Figure 6. Mass defect plots of factor-specific ions (identified from the cluster analysis) for selected EESI-TOF POA (a) and SOA (b) factors.

ions unique to LABB1EESI consist almost entirely of ions                 from C6 H10 O5 is also observed, suggesting that the factor
with H : C
L. Qi et al.: A 1-year characterization of organic aerosol composition and sources                                                    7887

Figure 7. Mass defect plot of factor-specific ions for the MABBEESI factor colored by nitrogen number and sized by H : C ratio (a) and O : C
ratio (b).

Figure 8. Comparison of the offline summer factor profiles with mass spectra from the Hyytiälä field campaign and the online summer
factors. The total signal of each factor is normalized to unity.

nonzero contribution in winter. Figure S11 (Fig. S13) shows             of compounds from other sources, whereas BSOAEESI repre-
the correlation of the three factors with the ambient temper-           sents rather pure biogenic SOA.
ature. While the SMOAEESI factor does not show a clear de-                 Figure 2b shows that the ions with the highest sig-
pendency on temperature, BSOAEESI increases exponentially               nal in BSOAEESI are C7 H10 O5 , C8 H12 O5 , C9 H14 O5 ,
with temperature, consistent with the known relationship for            C10 H16 O5 , and C10 H16 O6 , while other ions, i.e., C14 H22 O5 ,
terpene emissions and biogenic aerosol in terpene-dominated             C15 H22 O5 , C15 H24 O5 , and C15 H22 O6 , are tentatively identi-
regions. While SOOAAMS stems largely from biogenic pre-                 fied as sesquiterpene oxidation products. This differs slightly
cursors, this factor likely also includes a smaller proportion          from SMOAEESI , where C8 H12 O4 , C9 H14 O4 , C9 H16 O5 ,
                                                                        C10 H16 O4 , and C10 H16 O5 show the strongest signals. Fig-

https://doi.org/10.5194/acp-20-7875-2020                                                   Atmos. Chem. Phys., 20, 7875–7893, 2020
7888 L. Qi et al.: A 1-year characterization of organic aerosol composition and sources Figure 9. Comparison of EESI-TOF and AMS: total EESI-TOF mass flux (ag s−1 ) as a function of AMS OA, points are colored by date (a); total EESI-TOF SOA mass flux (ag s−1 ) as a function of AMS SOA, points are colored by date (b); total EESI-TOF POA mass flux (ag s−1 ) as a function of AMS POA, points are colored by date (c); the EESI-TOF and AMS comparison in terms of O : C (d) and H : C (e), points are colored by date. ure 3 shows that the BSOAEESI factor contains more organic and C10 ), likely includes both monoterpene oxidation prod- nitrogen species than the SMOAEESI factor. Figure S7b and ucts (e.g., C10 H16 O4 , C10 H16 O5 ) and ring-opening oxidation c show Van Krevelen plots for these two factors. BSOAEESI products of light aromatics. This is consistent with our tem- has a higher O : C ratio than SMOAEESI (1–1.2 vs. 0.4–0.6). perature comparison above that BSOAEESI factor is likely The two factors are compared in more detail in Fig. 5 with SOA from pure biogenic emissions and that the SMOAEESI the factor-specific ions. The range of H : C ratios is between factor is likely mixed and regional. 1.1 and 1.5 for the marker ions in both factors (except for Figure 8 compares these factor mass spectra with a fac- the CHNO family). The carbon numbers of factor-specific tor dominated by terpene SOA (“Daytime SOA2, Daytime ions in BSOAEESI factor are spread from C8 to C21. The SOA1”) derived from PMF analysis of a summer field cam- high C numbers are consistent with the presence of sesquiter- paign at the same site in Zurich, as well as a mass spectrum pene oxidation products and terpene dimers. The SMOAEESI from field measurements during spring in Hyytiälä, Finland, factor, mostly with less than 10 carbon atoms (C7 , C8 , C9 located in a remote boreal forest (Stefenelli et al., 2019; Qi Atmos. Chem. Phys., 20, 7875–7893, 2020 https://doi.org/10.5194/acp-20-7875-2020
L. Qi et al.: A 1-year characterization of organic aerosol composition and sources                                            7889

et al., 2019; Pospisilova et al., 2020). This comparison shows
the BSOAEESI factor and the SMOAEESI factors to be qual-
itatively similar to terpene-derived SOA. Additionally, the
terpene-derived biogenic SOA has already been identified as
a major summertime aerosol source in central Europe (Zhang
et al., 2018; Claeys et al., 2007; Ng et al., 2007; Canonaco et
al., 2015; Daellenbach et al., 2017).

3.4   EESI-TOF and AMS comparison

For the comparison of EESI-TOF and AMS results, no rel-
ative sensitivity corrections were applied to the EESI-TOF
data, although it is known that compound-dependent differ-
ences exist (Lopez-Hilfiker et al., 2019). Figure 9a shows
the total ion signal (ag s−1 ) measured by the EESI-TOF as
a function of the OA concentration measured by the AMS,
with the points colored by date. Agreement is generally good,
except during winter, where the ratio of EESI-TOF to AMS
is lower. This corresponds to high fractional contributions
from the EESI biomass burning factors, especially the SOA-
dominated MABBEESI . The apparently reduced EESI-TOF
response is thus likely driven by the lower EESI-TOF sen-
sitivity to SOA from light aromatics compared to terpenes
(Lopez-Hilfiker et al., 2019). Figure 9b shows the mass flux
                                                                   Figure 10. Comparison between AMS factors and EESI factors:
of EESI-TOF SOA signal (MABB + BSOA + SMOA) as a                   time series of the concentrations of the AMS PMF factor (a) and
function of AMS SOA mass, colored by date, while Fig. 9c           mass flux of EESI PMF factor (b). Pie charts of source apportion-
shows the comparison between EESI-TOF POA and AMS                  ment results from the EESI (c) and AMS (d).
POA, correlating well with each other. Similar to Fig. 9a,
the SOA-dominated period toward the winter exhibits a
lower relative sensitivity for the EESI-TOF than the terpene-
dominated summer season.                                              Overall, the sum of the primary factors of LABB1EESI
   Figures 9d and e show the O : C and H : C atomic ra-            (12 %) and LABB2EESI (6.5 %) contributes 18.5 % of the
tios, respectively, for the EESI-TOF vs. those of the AMS.         EESI-TOF signal and compares with the BBOAAMS factor
The estimated O : C ratios by the EESI-TOF (around 0.3–            (12 %). The fraction of secondary MABBEESI (20.3 %) fac-
0.45, again with no ion-dependent response factors applied)        tor is a bit lower than the WOOAAMS factor (22 %). The
are systematically higher than those measured by the AMS           source of CS-OAEESI contributes to 9.3 %, which must have
(around 0.2–0.3). This bias is similar to that observed in on-     contributions from some AMS factors, e.g., from wood burn-
line data for winter and summer aerosol in Zurich (Stefenelli      ing and cooking. The secondary factors BSOAEESI (19.7 %)
et al., 2019; Qi et al., 2019). On the other hand, the H : C ra-   and SMOAEESI (9.9 %) contribute 29.6 % of the EESI-TOF
tios of these two instruments show fair consistency with val-      signal compared to 37.6 % of the total apportioned mass for
ues around 1.5 for the EESI-TOF and AMS analyses. This is          the AMS summer factor SOOA. The relatively good agree-
not consistent with our observations for summer and winter         ment between related factors across instruments suggests that
aerosol in Zurich and for aging experiments of wood burning        compound-dependent sensitivities do not result in a major
emissions in an environmental chamber, where all measured          distortion of the EESI-TOF source apportionment results.
H : C ratios were higher for the EESI-TOF than for the AMS.           The PBOAEESI factor exhibits the strongest difference,
Note also that unlike the comparison of total EESI-TOF and         with 22.3 % in the EESI-TOF, while PBOA is not resolved
AMS signals, there are no seasonally dependent differences         at all in the AMS. Daellenbach et al. (2017) did not sep-
in the measured H : C or O : C ratio.                              arate a PBOA factor in their AMS PMF analysis, either
   Figure 10 shows the stacked time series of the AMS PMF          when unconstrained or when using the mass spectral signa-
factors and EESI-TOF PMF factors. Also shown are pie               ture from Bozzetti et al. (2016). Three methods (based on
charts of the mean EESI-TOF factor contributions (Fig. 10c)        factor profiles, coarse OC, and cellulose) were used to es-
and the mean AMS factor contributions (Fig. 10d) over the          timate the influence of PBOA in Bozzetti et al. (2016), re-
entire measurement period. As discussed earlier, this appor-       porting that offline measurement is with a factor of 3 to 10
tionment specifically describes the WSOM fraction, as no           times lower PBOA in the warm season. Here, the EESI-TOF
WSOM-to-OM correction factors are applied.                         measurement shows the advantage of measuring the samples

https://doi.org/10.5194/acp-20-7875-2020                                            Atmos. Chem. Phys., 20, 7875–7893, 2020
7890 L. Qi et al.: A 1-year characterization of organic aerosol composition and sources
at molecular level, enabling the separation of PBOAEESI and Author contributions. LQ was the main author. LQ, ALV, SE, LC,
CS-OAEESI factors from PMF analysis. JZ, JLJ, PF, AKG, and KRD conducted the experiment, MC, XG,
JGS, ASHP, and UB were the supervisors. All authors contributed
to the corrections of the paper.
4 Conclusions
In this study, we analyzed 91 filters collected at the NABEL Competing interests. The authors declare that they have no conflict
monitoring station at Kaserne Park in Zurich, an urban back- of interest.
ground site. These filters were collected for 24 h each, ap-
proximately every fourth day throughout 2013, and then
measured by utilizing the offline AMS method (water ex- Acknowledgements. Carlo Bozzetti is acknowledged for SoFi train-
traction followed by re-nebulization and measurement) to ing. Felipe Lopez-Hilfiker and Veronika Pospisilova are acknowl-
the EESI-TOF. It is the first offline work to characterize the edged for initial EESI training.
secondary organic aerosol sources and composition using a
new developed instrument extractive electrospray ionization
time-of-flight mass spectrometer (EESI-TOF). The increased Financial support. This research has been supported by the Swiss
chemical specificity of the EESI-TOF allows for additional, National Science Foundation (grant no. BSSGI0_155846), the
Swiss National Science Foundation (grant no. 200021_169787),
meaningful factors to be resolved relative to the AMS.
the International ST cooperation program of China (grant
Positive matrix factorization (PMF) analysis was con-
no. 2014DFA90780), and the National Natural Science Foundation
ducted on the offline EESI-TOF data, yielding seven factors of China (grant no. 21976093).
describing water-soluble organic material (WSOM): two less
aged biomass burning factors (LABB1EESI and LABB2EESI )
indicating a strong aromatic influence, cigarette smoke or- Review statement. This paper was edited by John Liggio and re-
ganic aerosol (CS-OAEESI , characterized by the contri- viewed by two anonymous referees.
bution from nicotine), primary biological organic aerosol
(PBOAEESI ) identified by fatty acids from plants, more aged
biomass burning (MABBEESI ) characterized by the key fea-
ture from wood burning chamber measurement, biogenic
secondary organic aerosol (BSOAEESI ), and summer mixed References
oxygenated organic aerosol (SMOAEESI ) showing enhanced
contribution from ions characteristic of monoterpene oxida- Bertrand, A., Stefenelli, G., Jen, C. N., Pieber, S. M., Bruns, E. A.,
tion. The offline EESI-TOF PMF retrieved a PBOAEESI fac- Ni, H., Temime-Roussel, B., Slowik, J. G., Goldstein, A. H., El
Haddad, I., Baltensperger, U., Prévôt, A. S. H., Wortham, H., and
tor, separated less aged and more aged factors from biomass
Marchand, N.: Evolution of the chemical fingerprint of biomass
burning, and presented winter- and summer-dominated emis- burning organic aerosol during aging, Atmos. Chem. Phys., 18,
sions, features that are not possible for AMS PMF analysis. 7607–7624, https://doi.org/10.5194/acp-18-7607-2018, 2018.
We performed cluster analysis of the EESI-TOF ions fol- Bruns, E., El Haddad, I., Slowik, J., Kilic, D., Klein, F.,
lowed by correlation with the resolved factors, which iden- Baltensperger, U., and Prévôt, A. S. H.: Identification of
tifies factor-specific ions of each factor. These characteristic significant precursor gases of secondary organic aerosols
ions represent potential markers for future studies. from residential wood combustion, Sci. Rep., 6, 27881,
Overall, the EESI-TOF analysis was supported and cor- https://doi.org/10.1038/srep27881, 2016.
roborated by the AMS PMF analysis. This work highlights Bozzetti, C., Daellenbach, K. R., Hueglin, C., Fermo, P., Sciare,
the potential of offline, highly chemically resolved data pro- J., Kasper-Giebl, A., Mazar, Y., Abbaszade, G., El Kazzi, M.,
vided by an EESI-TOF for identification of the key sources Gonzalez, R., Shuster-Meiseles, T., Flasch, M., Wolf, R., Kre-
pelova, A., Canonaco, F., Schnelle-Kreis, J., Slowik, J. G.,
over a long time period.
Zimmermann, R., Rudich, Y., Baltensperger, U., El Haddad,
I., and Prevot, A. S.: Size-resolved identification, characteriza-
tion, and quantification of primary biological organic aerosol at
Data availability. Data are available from the Zenodo online repos- a european rural site, Environ. Sci. Technol., 50, 3425–3434,
itory hosted by CERN (https://doi.org/10.5281/zenodo.3930871; Qi https://doi.org/10.1021/acs.est.5b05960, 2016.
et al., 2020). Bozzetti, C., Sosedova, Y., Xiao, M., Daellenbach, K. R., Ulevi-
cius, V., Dudoitis, V., Mordas, G., Byčenkienė, S., Plauškaitė,
K., Vlachou, A., Golly, B., Chazeau, B., Besombes, J.-L., Bal-
Supplement. The supplement related to this article is available on- tensperger, U., Jaffrezo, J.-L., Slowik, J. G., El Haddad, I., and
line at: https://doi.org/10.5194/acp-20-7875-2020-supplement. Prévôt, A. S. H.: Argon offline-AMS source apportionment of
organic aerosol over yearly cycles for an urban, rural, and ma-
rine site in northern Europe, Atmos. Chem. Phys., 17, 117–141,
https://doi.org/10.5194/acp-17-117-2017, 2017.
Atmos. Chem. Phys., 20, 7875–7893, 2020 https://doi.org/10.5194/acp-20-7875-2020L. Qi et al.: A 1-year characterization of organic aerosol composition and sources 7891 Canonaco, F., Crippa, M., Slowik, J. G., Baltensperger, U., fline aerosol mass spectrometry, Atmos. Meas. Tech., 9, 23–39, and Prévôt, A. S. H.: SoFi, an IGOR-based interface for https://doi.org/10.5194/amt-9-23-2016, 2016. the efficient use of the generalized multilinear engine (ME- Daellenbach, K. R., Stefenelli, G., Bozzetti, C., Vlachou, A., 2) for the source apportionment: ME-2 application to aerosol Fermo, P., Gonzalez, R., Piazzalunga, A., Colombi, C., mass spectrometer data, Atmos. Meas. Tech., 6, 3649–3661, Canonaco, F., Hueglin, C., Kasper-Giebl, A., Jaffrezo, J.-L., https://doi.org/10.5194/amt-6-3649-2013, 2013. Bianchi, F., Slowik, J. G., Baltensperger, U., El-Haddad, I., Canonaco, F., Slowik, J. G., Baltensperger, U., and Prévôt, A. S. and Prévôt, A. S. H.: Long-term chemical analysis and organic H.: Seasonal differences in oxygenated organic aerosol composi- aerosol source apportionment at nine sites in central Europe: tion: implications for emissions sources and factor analysis, At- source identification and uncertainty assessment, Atmos. Chem. mos. Chem. Phys., 15, 6993–7002, https://doi.org/10.5194/acp- Phys., 17, 13265–13282, https://doi.org/10.5194/acp-17-13265- 15-6993-2015, 2015. 2017, 2017. Cavalli, F., Viana, M., Yttri, K. E., Genberg, J., and Putaud, J. P.: DeCarlo, P. F., Kimmel, J. R., Trimborn, A., Northway, M. J., Jayne, Toward a standardised thermal-optical protocol for measuring at- J. T., Aiken, A. C., Gonin, M., Fuhrer, K., Horvath, T., Docherty, mospheric organic and elemental carbon: the EUSAAR protocol, K. S., Worsnop, D. R., and Jimenez, J. L.: Field-deployable, Atmos. Meas. Tech., 3, 79–89, https://doi.org/10.5194/amt-3-79- high-resolution, time-of-flight aerosol mass spectrometer, Anal. 2010, 2010. Chem., 78, 8281–8289, https://doi.org/10.1021/Ac061249n, Claeys, M., Szmigielski, R., Kourtchev, I., Van der Veken, P., 2006. Vermeylen, R., Maenhaut, W., Jaoui, M., Kleindienst, T. E., DeCarlo, P. F., Dunlea, E. J., Kimmel, J. R., Aiken, A. C., Lewandowski, M., Offenberg, J. H., and Edney, E. O.: Hy- Sueper, D., Crounse, J., Wennberg, P. O., Emmons, L., Shi- droxydicarboxylic acids: markers for secondary organic aerosol nozuka, Y., Clarke, A., Zhou, J., Tomlinson, J., Collins, D. R., from the photooxidation of α-pinene, Environ. Sci. Technol., 41, Knapp, D., Weinheimer, A. J., Montzka, D. D., Campos, T., 1628–1634, https://doi.org/10.1021/es0620181, 2007. and Jimenez, J. L.: Fast airborne aerosol size and chemistry Crippa, M., Canonaco, F., Slowik, J. G., El Haddad, I., De- measurements above Mexico City and Central Mexico during Carlo, P. F., Mohr, C., Heringa, M. F., Chirico, R., Marchand, the MILAGRO campaign, Atmos. Chem. Phys., 8, 4027–4048, N., Temime-Roussel, B., Abidi, E., Poulain, L., Wiedensohler, https://doi.org/10.5194/acp-8-4027-2008, 2008. A., Baltensperger, U., and Prévôt, A. S. H.: Primary and sec- Després, V., Huffman, J. A., Burrows, S. M., Hoose, C., Safa- ondary organic aerosol origin by combined gas-particle phase tov, A., Buryak, G., Fröhlich-Nowoisky, J., Elbert, W., Andreae, source apportionment, Atmos. Chem. Phys., 13, 8411–8426, M., Pöschl, U., and Jaenicke, R.: Primary biological aerosol https://doi.org/10.5194/acp-13-8411-2013, 2013a. particles in the atmosphere: a review, Tellus B, 64, 15598, Crippa, M., DeCarlo, P. F., Slowik, J. G., Mohr, C., Heringa, M. https://doi.org/10.3402/tellusb.v64i0.15598, 2012. F., Chirico, R., Poulain, L., Freutel, F., Sciare, J., Cozic, J., Di Elser, M., Huang, R.-J., Wolf, R., Slowik, J. G., Wang, Q., Marco, C. F., Elsasser, M., Nicolas, J. B., Marchand, N., Abidi, Canonaco, F., Li, G., Bozzetti, C., Daellenbach, K. R., Huang, E., Wiedensohler, A., Drewnick, F., Schneider, J., Borrmann, Y., Zhang, R., Li, Z., Cao, J., Baltensperger, U., El-Haddad, I., S., Nemitz, E., Zimmermann, R., Jaffrezo, J. L., Prévôt, A. S. and Prévôt, A. S. H.: New insights into PM2.5 chemical composi- H., and Baltensperger, U.: Wintertime aerosol chemical compo- tion and sources in two major cities in China during extreme haze sition and source apportionment of the organic fraction in the events using aerosol mass spectrometry, Atmos. Chem. Phys., 16, metropolitan area of Paris, Atmos. Chem. Phys., 13, 961–981, 3207–3225, https://doi.org/10.5194/acp-16-3207-2016, 2016. https://doi.org/10.5194/acp-13-961-2013, 2013b. Fröhlich, R., Cubison, M. J., Slowik, J. G., Bukowiecki, N., Prévôt, Crippa, M., Canonaco, F., Lanz, V. A., Äijälä, M., Allan, J. D., Car- A. S. H., Baltensperger, U., Schneider, J., Kimmel, J. R., Go- bone, S., Capes, G., Ceburnis, D., Dall’Osto, M., Day, D. A., nin, M., Rohner, U., Worsnop, D. R., and Jayne, J. T.: The DeCarlo, P. F., Ehn, M., Eriksson, A., Freney, E., Hildebrandt ToF-ACSM: a portable aerosol chemical speciation monitor Ruiz, L., Hillamo, R., Jimenez, J. L., Junninen, H., Kiendler- with TOFMS detection, Atmos. Meas. Tech., 6, 3225–3241, Scharr, A., Kortelainen, A. M., Kulmala, M., Laaksonen, A., https://doi.org/10.5194/amt-6-3225-2013, 2013. Mensah, A. A., Mohr, C., Nemitz, E., O’Dowd, C., Ovadnevaite, Fröhlich, R., Crenn, V., Setyan, A., Belis, C. A., Canonaco, F., J., Pandis, S. N., Petäjä, T., Poulain, L., Saarikoski, S., Sellegri, Favez, O., Riffault, V., Slowik, J. G., Aas, W., Aijälä, M., K., Swietlicki, E., Tiitta, P., Worsnop, D. R., Baltensperger, U., Alastuey, A., Artiñano, B., Bonnaire, N., Bozzetti, C., Bressi, and Prévôt, A. S. H.: Organic aerosol components derived from M., Carbone, C., Coz, E., Croteau, P. L., Cubison, M. J., Esser- 25 AMS data sets across Europe using a consistent ME-2 based Gietl, J. K., Green, D. C., Gros, V., Heikkinen, L., Herrmann, source apportionment approach, Atmos. Chem. Phys., 14, 6159– H., Jayne, J. T., Lunder, C. R., Minguillón, M. C., Močnik, G., 6176, https://doi.org/10.5194/acp-14-6159-2014, 2014. O’Dowd, C. D., Ovadnevaite, J., Petralia, E., Poulain, L., Priest- Cuccia, E., Massabo, D., Ariola, V., Bove, M. C., Fermo, P., Pi- man, M., Ripoll, A., Sarda-Estève, R., Wiedensohler, A., Bal- azzalunga, A., and Prati, P.: Size-resolved comprehensive char- tensperger, U., Sciare, J., and Prévôt, A. S. H.: ACTRIS ACSM acterization of airborne particulate matter, Atmos. Environ., 67, intercomparison – Part 2: Intercomparison of ME-2 organic 14–26, https://doi.org/10.1016/j.atmosenv.2012.10.045, 2013. source apportionment results from 15 individual, co-located Daellenbach, K. R., Bozzetti, C., Křepelová, A., Canonaco, F., aerosol mass spectrometers, Atmos. Meas. Tech., 8, 2555–2576, Wolf, R., Zotter, P., Fermo, P., Crippa, M., Slowik, J. G., Sose- https://doi.org/10.5194/amt-8-2555-2015, 2015. dova, Y., Zhang, Y., Huang, R. J., Poulain, L., Szidat, S., Bal- Heal, M. R., Kumar, P., and Harrison, R. M.: Particles, air quality, tensperger, U., El Haddad, I., and Prévôt, A. S. H.: Character- policy and health, Chem. Soc. Rev., 41, 6606–6630, 2012. ization and source apportionment of organic aerosol using of- https://doi.org/10.5194/acp-20-7875-2020 Atmos. Chem. Phys., 20, 7875–7893, 2020
You can also read