Zeppelin-led study on the onset of new particle formation in the planetary boundary layer
←
→
Page content transcription
If your browser does not render page correctly, please read the page content below
Atmos. Chem. Phys., 21, 12649–12663, 2021
https://doi.org/10.5194/acp-21-12649-2021
© Author(s) 2021. This work is distributed under
the Creative Commons Attribution 4.0 License.

Zeppelin-led study on the onset of new particle formation in the
planetary boundary layer
Janne Lampilahti1 , Hanna E. Manninen2 , Tuomo Nieminen1 , Sander Mirme3 , Mikael Ehn1 , Iida Pullinen4 ,
Katri Leino1 , Siegfried Schobesberger1,4 , Juha Kangasluoma1 , Jenni Kontkanen1 , Emma Järvinen5 ,
Riikka Väänänen1 , Taina Yli-Juuti4 , Radovan Krejci6 , Katrianne Lehtipalo1,7 , Janne Levula1 , Aadu Mirme3 ,
Stefano Decesari8 , Ralf Tillmann9 , Douglas R. Worsnop1,4,10 , Franz Rohrer9 , Astrid Kiendler-Scharr9 ,
Tuukka Petäjä1,11 , Veli-Matti Kerminen1 , Thomas F. Mentel9 , and Markku Kulmala1,11,12
1 Institute for Atmospheric and Earth System Research/Physics, Faculty of Science, University of Helsinki, Helsinki, Finland
2 CERN,    1211 Geneva, Switzerland
3 Institute of Physics, University of Tartu, Tartu, Estonia
4 Department of Applied Physics, University of Eastern Finland, Kuopio, Finland
5 National Center for Atmospheric Research, Boulder, CO, USA
6 Department of Environmental Science and Bolin Centre for Climate research, Stockholm University, Stockholm, Sweden
7 Finnish Meteorological Institute, Helsinki, Finland
8 Istituto di Scienze dell’Atmosfera e del Clima, CNR, Bologna, Italy
9 Institute for Energy and Climate Research, IEK-8, Forschungszentrum Jülich GmbH, Jülich, Germany
10 Aerodyne Research Inc, Billerica, MA, USA
11 Joint International Research Laboratory of Atmospheric and Earth System Sciences, Nanjing University, Nanjing, China
12 Aerosol and Haze Laboratory, Beijing Advanced Innovation Center for Soft Matter Science and Engineering,

Beijing University of Chemical Technology, Beijing, China

Correspondence: Janne Lampilahti (janne.lampilahti@helsinki.fi)

Received: 2 April 2021 – Discussion started: 16 April 2021
Revised: 14 July 2021 – Accepted: 16 July 2021 – Published: 26 August 2021

Abstract. We compared observations of aerosol particle for-      taking place above the ML. In Po Valley we observed NPF
mation and growth in different parts of the planetary bound-     that was limited to a specific air mass.
ary layer at two different environments that have frequent
new particle formation (NPF) events. In summer 2012 we
had a campaign in Po Valley, Italy (urban background), and
in spring 2013 a similar campaign took place in Hyytiälä,        1   Introduction
Finland (rural background). Our study consists of three case
studies of airborne and ground-based measurements of ion         The boundary layer (BL) is the lowest layer of the earth’s
and particle size distribution from ∼ 1 nm. The airborne         atmosphere (Stull, 1988). The BL is an interface control-
measurements were performed using a Zeppelin inside the          ling the exchange of mass and energy between atmosphere
boundary layer up to 1000 m altitude. Our observations show      and surface. Ground-based measurements are often used as
the onset of regional NPF and the subsequent growth of           representative observations for the whole BL. However, they
the aerosol particles happening almost uniformly inside the      cannot cover vertical internal variability of BL, and this can
mixed layer (ML) in both locations. However, in Hyytiälä we      be addressed only by airborne observations.
noticed local enhancement in the intensity of NPF caused by         Figure 1 show the typical BL evolution over land during
mesoscale boundary layer (BL) dynamics. Additionally, our        the time span of 1 d. Shortly after sunrise, convective mix-
observations indicate that in Hyytiälä NPF was probably also     ing creates a mixed layer (ML) that rapidly grows during the
                                                                 morning by entraining air from above and can reach an alti-

Published by Copernicus Publications on behalf of the European Geosciences Union.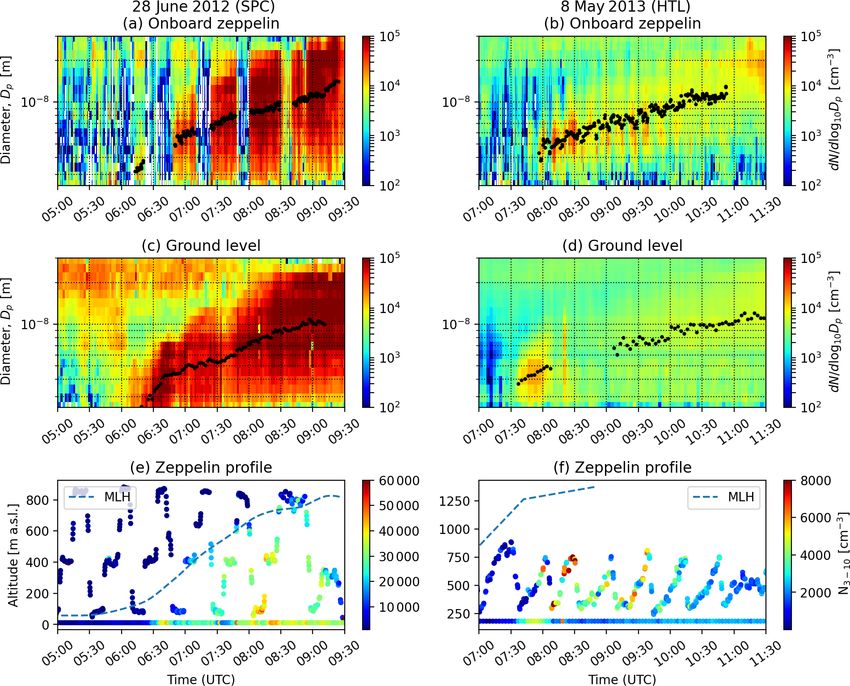
12650                                        J. Lampilahti et al.: Zeppelin-led study on the onset of new particle formation

                                                                      Airborne measurements of nanoparticles from different
                                                                   environments show that NPF occurs in many parts of the
                                                                   BL. Multiple observations from central Europe suggest that
                                                                   aerosol particles are formed on top of a shallow ML (Platis
                                                                   et al., 2015; Siebert et al., 2004; Chen et al., 2018) or inside
                                                                   the RL (Stratmann et al., 2003; Wehner et al., 2010). Other
                                                                   results come from a boreal forest environment in southern
                                                                   Finland. Lampilahti et al. (2021a) showed evidence that NPF
                                                                   may occur in the interface between the RL and the FT.
                                                                   O’Dowd et al. (2009) observed the first signs of NPF in the
                                                                   surface ML, and Leino et al. (2019) showed that sub-3 nm
                                                                   particles have a higher concentration close to the surface.
                                                                   Laakso et al. (2007) performed hot-air balloon measurements
                                                                   and concluded that NPF either took place throughout the ML
                                                                   or in the lower part of the ML. Measurements by Schobes-
                                                                   berger et al. (2013) suggested that NPF was more intense in
                                                                   the top parts of a developed ML. More measurements are
Figure 1. A schematic diagram of different atmospheric layers in   needed in order to understand these mixed results.
the lower troposphere and their development during the morning
                                                                      Here we present NPF measurements on board a Zeppelin
hours. A generic Zeppelin measurement profile (dashed gray line)
                                                                   airship carried out during the EU-supported PEGASOS (Pan-
is displayed on top. The figure is adapted from Stull (1988).
                                                                   European Gas-AeroSOls climate interaction Study) project.
                                                                   The Zeppelin flights were used to observe radicals, trace
tude of ∼ 1–2 km above the surface. The ML is capped by a          gases and aerosol particles inside the lower troposphere over
stable layer at the top. Above the BL is the free troposphere      Europe in several locations during 2012–2013.
(FT), which is decoupled from the surface. Here we define             By using a Zeppelin NT (Neue Technologie) airship, we
BL to mean all the layers below the FT. Around sunset, con-        were able to sample up to 1000 m above sea level (a.s.l.).
vective mixing and turbulence diminishes, and the ML be-           The high payload capacity of the Zeppelin enabled us to
comes what is known as the residual layer (RL). During the         carry state-of-the-art instrumentation, specifically designed
night a stable boundary layer develops due to interaction with     to collect information on the feedback processes between
the ground surface. This layer has only weak intermittent tur-     the chemical compounds and the smallest aerosol particles
bulence, and it smoothly blends into the RL.                       to better estimate their role in climate and air quality.
   We studied where new particle formation (NPF) occurs               The NPF focused campaigns presented here were per-
in the BL and how it relates to BL evolution, comparing            formed in Po Valley, Italy, and Hyytiälä, Finland. At both lo-
two different environments. NPF refers to the formation of         cations NPF events happen frequently. Po Valley represents
nanometer-sized clusters from low-volatility vapors present        urban background conditions where anthropogenic emis-
in the atmosphere and their subsequent growth to larger            sions are an important source of gaseous precursors for NPF
aerosol particles (Kulmala et al., 2013). Understanding NPF        (e.g. Kontkanen et al., 2016). Hyytiälä represents rural back-
better is of major interest, since it is a dominant source of      ground conditions where organic vapors from the surround-
cloud condensation nuclei in the atmosphere and therefore          ing forests play a major role in NPF (e.g. Dada et al., 2017).
can have important indirect effects on climate (Dunne et al.,         Here we combine comprehensive ground-based and air-
2016; Gordon et al., 2017; Pierce and Adams, 2009; Yu and          borne measurements from the Zeppelin to investigate two
Luo, 2009).                                                        NPF cases from Po Valley and one case from Hyytiälä. The
   Nilsson et al. (2001) studied NPF in a boreal forest envi-      Zeppelin allowed us to repeatedly profile the lowest 1 km of
ronment and observed that in addition to increased solar ra-       the atmosphere, providing a full picture of what is happening
diation the onset of turbulence appears to be a necessary trig-    in the BL during the onset of NPF. We will show in which
ger for NPF. Several explanations for this connection were         part or parts of the BL the onset of NPF and the subsequent
proposed: NPF might be starting in the RL or at the top of         particle growth occurred at the two measurement sites as well
the shallow ML, from where the aerosol particles are mixed         as determine formation and growth rates for the aerosol par-
to the surface as the ML starts to grow. NPF starts in the         ticles.
ML due to dilution of pre-existing aerosol and drop in vapor
sink. Convective mixing brings different precursor gases, one
present in the RL and the other in the ML, into contact with       2   Methods
each other, initiating NPF inside the ML.
                                                                   The two ground-based measurement sites that were stud-
                                                                   ied here were San Pietro Capofiume in Po Valley, Italy, and

Atmos. Chem. Phys., 21, 12649–12663, 2021                                          https://doi.org/10.5194/acp-21-12649-2021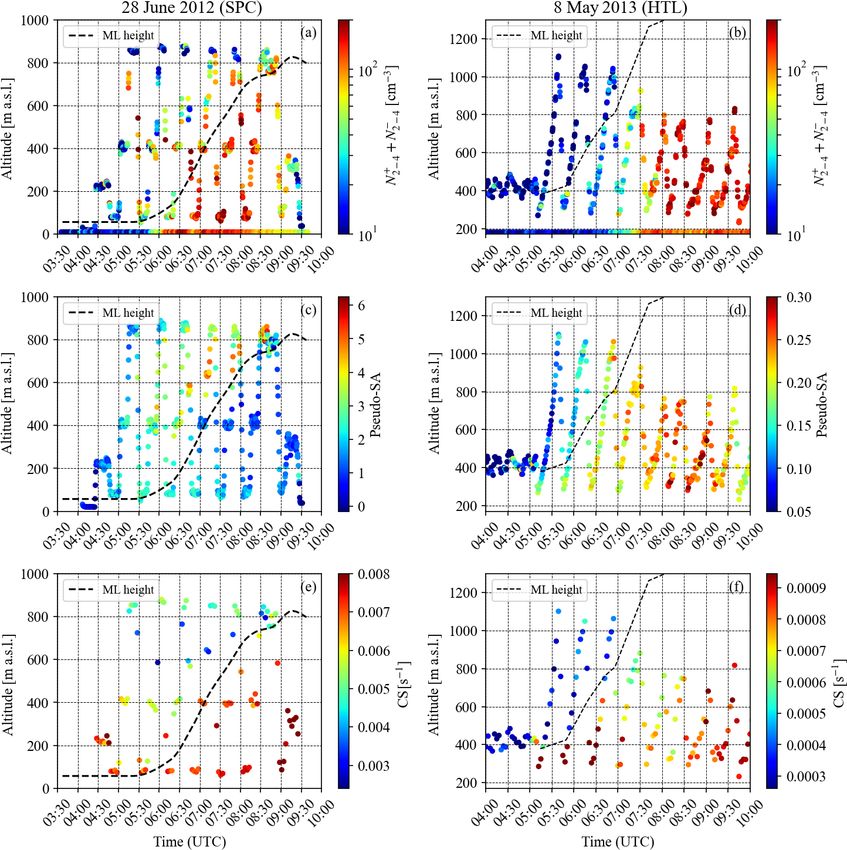
J. Lampilahti et al.: Zeppelin-led study on the onset of new particle formation                                          12651

Hyytiälä in southern Finland. The vertical measurement pro-       forecast tool was developed to aid the planning of research
files analyzed in this study were performed in a close prox-      flights (Nieminen et al., 2015).
imity to the ground-based measurement sites. All times in
this paper are given in UTC time unless stated otherwise.         2.3   Zeppelin NT airship

2.1   San Pietro Capofiume, Italy                                 A Zeppelin NT airship was used for monitoring the atmo-
                                                                  sphere below 1 km. The aerosol particles and trace gases
San Pietro Capofiume (SPC; 44◦ 390 N, 11◦ 370 E; 11 m a.s.l.)     were sampled with instrumentation installed inside the Zep-
is located in the eastern part of Po Valley, Italy, between the   pelin’s cabin. The Zeppelin operated with three different in-
cities of Bologna and Ferrara. Po Valley is considered a pol-     strument layouts. A specific layout was chosen according to
lution hot spot, although the station itself is surrounded by     the flight plan and scientific aim of the flight.
vast agricultural fields away from point sources. Thus the           Here we analyzed data from measurement flights that car-
aerosol concentration and composition at SPC reflect the Po       ried the so-called nucleation layout. Instruments specific to
Valley regional background. NPF is frequently observed in         this layout were the atmospheric pressure interface time-of-
SPC (36 % of days) with maxima in May and July (Hamed             flight mass spectrometer (APi-TOF; Junninen et al., 2010),
et al., 2007; Laaksonen et al., 2005).                            used for measuring the elemental composition of naturally
   The instruments measuring the aerosol particle number          charged ions, and the NAIS for particle and ion number size
size distribution were a scanning mobility particle sizer         distributions. We also used the aerosol number size distribu-
(SMPS, 10–700 nm, 5 min time resolution; Wiedensohler             tion data from the SMPS (10–400 nm, 4 min time resolution)
et al., 2012) and a neutral cluster and air ion spectrom-         and PSM running in scanning mode, which were on board
eter (NAIS, particles: ∼ 2–40 nm, ions: 0.8–40 nm, 4 min          during all the measurement flights. The size range and time
time resolution; Mirme and Mirme, 2013). We used the              resolution of the onboard NAIS and PSM were the same as
NAIS’s positive polarity for the particle number size distri-     for the instruments in HTL (see Sect. 2.1).
bution data. The ML height was determined from ceilome-              During a measurement flight, the Zeppelin did multiple
ter (Lufft CHM 15k) measurements. Basic meteorology and           vertical profiles over a small area (∼ 10 km2 ). The profiling
SO2 gas concentration data (Thermo 43iTLE monitor) were           spot was picked typically downwind from the measurement
also available at surface level (2–3 m above ground level).       site in order to not compromise the ground-based measure-
                                                                  ments with any emissions. The vertical extent of the profiles
2.2   Hyytiälä, Finland                                           was ∼ 100–1000 m above the ground. The airspeed during
                                                                  measurement was ∼ 20 m s−1 , and the vertical speeds during
In Finland the ground-based measurements were performed           ascent and descent were ∼ 0.5 and ∼ 3 m s−1 , respectively.
at the SMEAR II (Station for Measuring Forest Ecosystem–
                                                                  2.4   Cessna 172 airplane
Atmosphere Relations II) station located in Hyytiälä, Finland
(HTL; 61◦ 510 N, 24◦ 170 E; 181 m a.s.l.; Hari and Kulmala,       During the PEGASOS northern mission in spring 2013, a
2005). The station is equipped with extensive facilities to       Cessna 172 airplane carrying scientific instrumentation was
measure the forest ecosystem and the atmosphere. The mea-         deployed to measure aerosol particles, trace gases and mete-
surement site is surrounded by coniferous boreal forest.          orological variables in the lower troposphere alongside the
   The forest emits biogenic volatile organic compounds           Zeppelin. The measurement setup and instrumentation on
(Hakola et al., 2003), which can be oxidized in the atmo-         board have been described in previous studies (Lampilahti
sphere to form low-volatility vapors that contribute to aerosol   et al., 2020b; Schobesberger et al., 2013; Leino et al., 2019;
particle formation and growth (Ehn et al., 2014; Mohr et          Väänänen et al., 2016)
al., 2019). NPF is frequently observed in HTL (23 % of all           Basic meteorological variables (temperature, pressure, rel-
days), especially in spring and autumn (Dal Maso et al.,          ative humidity) were measured on board. Particle number
2005; Nieminen et al., 2014).                                     size distribution was measured using a SMPS (10–400 nm
   Aerosol particle and ion number size distributions were        size range, 2 min time resolution) and the number concen-
measured by the station’s differential mobility particle sizer    tration of >3 nm particles was measured using an ultrafine
(DMPS, 3–1000 nm, 10 min time resolution; Aalto et al.,           condensation particle counter (UF-CPC, TSI model 3776) at
2001) and the NAIS (Manninen et al., 2009). Sub-3 nm par-         1 s time resolution. The altitude range of the airplane was
ticle number size distribution was measured by a particle         ∼ 100–3000 m above ground, and the measurement airspeed
size magnifier running in scanning mode (PSM, 1.2–2.5 nm,         was 36 m s−1 .
10 min time resolution; Vanhanen et al., 2011). Also a PSM
measured at SPC but we were not able to reliably calcu-
late formation rates from the data. Basic meteorological vari-
ables, radiation and SO2 were measured from the station’s
mast at 16.8 m above ground. In addition, a supporting NPF

https://doi.org/10.5194/acp-21-12649-2021                                       Atmos. Chem. Phys., 21, 12649–12663, 2021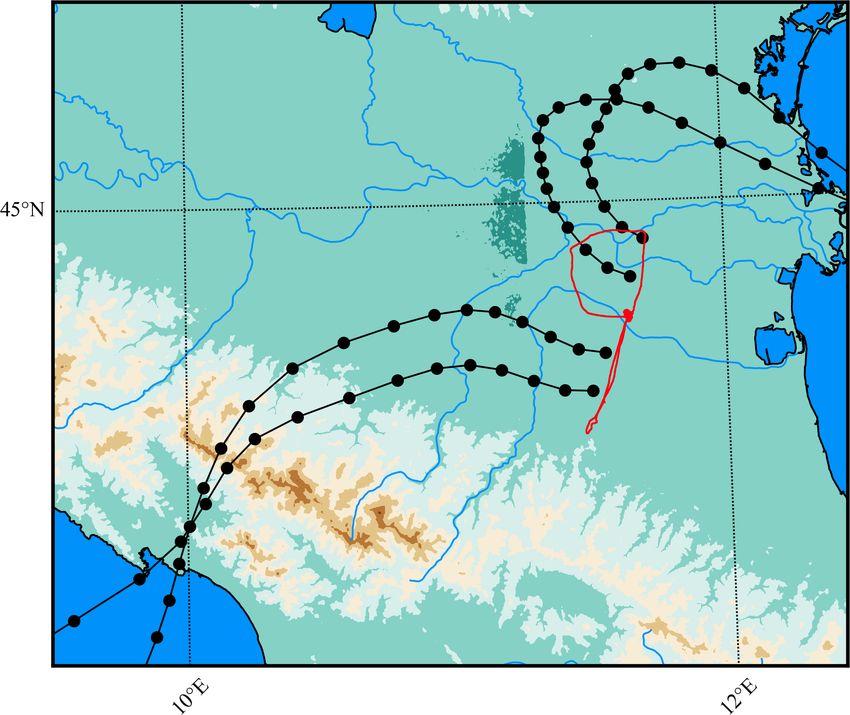
12652                                        J. Lampilahti et al.: Zeppelin-led study on the onset of new particle formation

2.5   Flight profiles and atmospheric conditions                  (Kulmala et al., 2012). The formation rate of 3 nm particles
                                                                  and ions was determined from the NAIS data. Coagulation
Our measurements focused on the time of BL development            sinks were calculated from the SMPS or DMPS data. Con-
from sunrise until noon (Fig. 1). This is the time when the on-   densation sink for sulfuric acid was calculated from the Zep-
set of NPF is typically observed at the ground level. The ver-    pelin’s onboard SMPS.
tical profile measurements represent the particle and gas con-       Sulfuric acid (SA) is a key compound in atmospheric nu-
centrations in the lower parts of the atmosphere: the mixed       cleation (Sipilä et al., 2010). As we did not have direct mea-
layer, the residual layer and the nocturnal boundary layer.       surements of SA concentration, we used [HSO−         4 ] from the
At the same time, the ground-based measurements recorded          APi-TOF measurements as a qualitative indicator of [H2 SO4 ]
conditions in the surface layer. Here we consider the BL to       and named it pseudo-SA. To determine this pseudo-SA, we
include all the atmospheric layers below the free troposphere.    summed up all ions containing HSO−        4 , e.g. the ion itself
   The basic conditions for the Zeppelin flights in both Italy    but also larger clusters, like (H2 SO4 )n · HSO− 4 . We assumed
and Finland were clear sky and low wind speed. Under these        steady-state conditions and that the concentration of SA-
conditions, the sun heats the surface during the morning,         containing ions is much lower than the total ion concentra-
which drives intense vertical mixing.                             tion. Under these conditions, [HSO−   4 ] (including all clusters
                                                                  where this ion was present) can be considered close to a lin-
2.6   Data analysis                                               ear function of [H2 SO4 ] (Eisele and Tanner, 1991). At the
                                                                  highest SA loadings, ions with HSO−      4 can be a dominant
The onset of NPF occurs when low-volatility vapors in the         fraction of the total ions (Ehn et al., 2010), in which case
atmosphere form nanometer-sized clusters that continue to         the linearity no longer holds. In addition, this assumes a con-
grow to larger aerosol particles (Kulmala et al., 2013).          stant concentration of ions, although, for example, the sinks
    We determined the onset of a NPF event visually from the      for ions can vary by an increased particle concentration. As
initial increase in the number concentration of intermediate      such, the pseudo-SA parameter should indeed only be con-
(2–4 nm) air ions at the beginning of the NPF event. An in-       sidered a qualitative indicator for SA.
crease in the intermediate ion concentration has been identi-        In SPC the ML height was derived from the ceilometer
fied as a good indicator for NPF (Leino et al., 2016). This is    measurements. However, in HTL, weak scattering signal pre-
because an increase in the number concentration of interme-       vented reliable determination of ML height using the on-site
diate ions is usually due to NPF and otherwise the number         lidar. For this reason in HTL the ML height was determined
concentration is extremely low (below 5 cm−3 ).                   from vertical profiles of meteorological variables and aerosol
    Particle growth rates (GRs), formation rates and coagula-     particle concentrations on board the Zeppelin and the Cessna
tion sinks were calculated in different size ranges according     172 airplane. In these profiles the top of the ML was revealed
to the methods described by Kulmala et al. (2012). For parti-     by the maximum positive gradient in potential temperature
cles and ions in the 1–2 and 2–3 nm size ranges, the GR was       and minimum negative gradient in humidity and total parti-
determined from the ion number size distribution measured         cle number concentration (Stull, 1988).
by the NAIS. During NPF the number concentration in each             The origin of the air masses was investigated using back-
size channel increased sequentially as the freshly formed par-    trajectory analysis. The trajectories were calculated with the
ticles grew larger. We determined the time when the number        HYSPLIT (HYbrid Single-Particle Lagrangian Integrated
concentration began to rise in each size bin by fitting a sig-    Trajectory; Stein et al., 2015) model using the GDAS (Global
moid function to the rising concentration edge and finding        Data Assimilation System) archived data sets.
the point where the sigmoid reached 75 % of its maximum
value (appearance time method; Lehtipalo et al., 2014). The
corresponding diameter in each size bin was the bin’s geo-        3     Results and discussion
metric mean diameter. Before the fitting procedure, the num-
                                                                  3.1    Case study description
ber concentrations were averaged using a 15 min median and
after that divided by the maximum concentration value in          During the campaigns, there were a limited number of flights
each size channel.                                                with the nucleation instrument payload (Po Valley: 19, 27,
    For larger particles and ions (3–7 and 7–20 nm) the GR        28, 29 and 30 June 2012; Hyytiälä: 6 May, 8 May, 16 May,
was determined by fitting a log-normal distribution over the      3 June, 8 June and 10 June 2013). Here we present a side-
growing nucleation mode at each time step and assigning the       by-side comparison of two case studies: one from SPC
fitted curve’s peak value as the corresponding mode diameter.     (28 June 2012) and the other from HTL (8 May 2013). On
In each size range a value for the GR was obtained as the         these days the NPF event was fully captured during the Zep-
slope of a linear least squares fit to the time–diameter value    pelin measurement. In addition the horizontal extent of NPF
pairs.                                                            in SPC was investigated by studying the measurement flight
    The formation rate of 1.5 nm particles and ions was deter-    from 30 June 2012.
mined from the PSM data and the NAIS ion data, respectively

Atmos. Chem. Phys., 21, 12649–12663, 2021                                          https://doi.org/10.5194/acp-21-12649-2021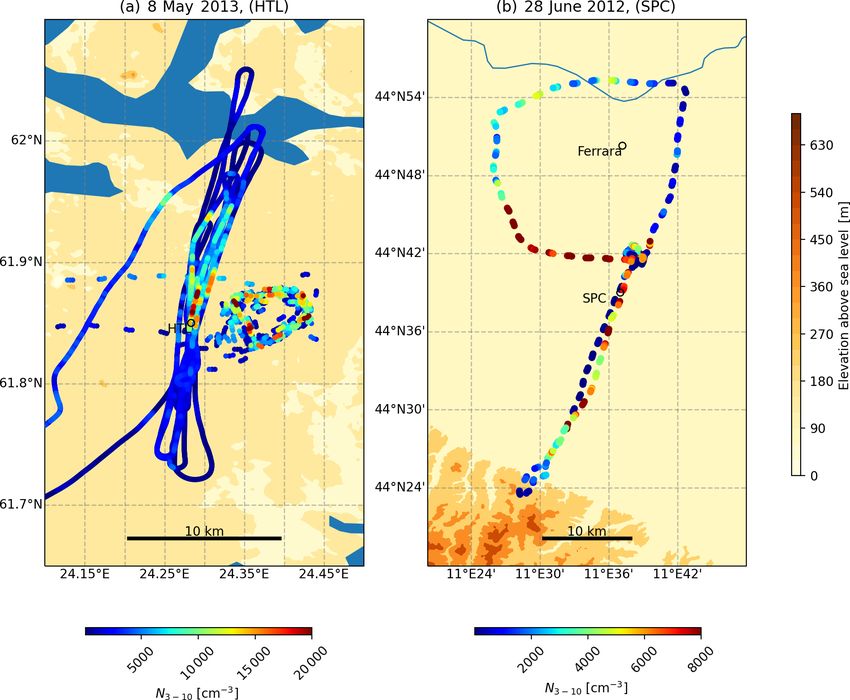
J. Lampilahti et al.: Zeppelin-led study on the onset of new particle formation 12653
The 28 June 2012 was a hot and sunny day in Po Val- ning of boundary layer growth. Around this time the Zep-
ley. The 24 h back-trajectories arriving to SPC during the pelin was profiling the layers above the ML. “Pockets” of
morning revealed that the incoming air masses circulated elevated intermediate ion concentration were present inside
from central Europe and over the Adriatic Sea before arriv- the RL (e.g. around 700 m at 05:15). These pockets were not
ing to SPC from the southwest (Fig. 2a). Figure 3 shows the linked to the NPF event inside the ML. When the Zeppelin
time series for some environmental parameters on the NPF later entered the ML at around 06:45, NPF was already tak-
event days from SPC and HTL. In SPC temperature and RH ing place throughout the developing ML and seemed to be
showed a large diurnal variation; the temperature increased confined to it.
from 16 to 32 ◦ C during the morning while the RH decreased In HTL, the number concentration of intermediate ions be-
from 87 % to 39 %. The mean wind speed at 10 m height gan to increase at around 06:47 on the ground level. The ML
was 2.0 m s−1 . These meteorological conditions and air mass at this point had grown to around 600 m above ground, which
histories are common during NPF event days in Po Valley allowed us to better resolve the onset of NPF vertically. In
(Hamed et al., 2007; Sogacheva et al., 2007). HTL there was no increase in intermediate ion concentration,
The 8 May 2013 in HTL was a sunny and warm day with indicating no NPF was observed above the ML on board the
clear skies marked by broad diurnal variation in temperature Zeppelin. Before 06:40 there was no sign of NPF inside the
and RH. During the morning the temperature increased from growing ML. Between 06:40 and 07:00 the Zeppelin briefly
5 to 17 ◦ C, and the RH decreased from 82 % to 25 %. The measured in the RL and re-entered the ML at 07:00. At this
mean wind speed at 33.6 m height was 3.5 m s−1 . The air point the intermediate ion concentration was already increas-
masses originated from the North Atlantic Ocean, arriving ing on board similar to the ground level, indicating the onset
to HTL from the northwest via Scandinavia and the Gulf of of NPF.
Bothnia (Fig. 2b). Most NPF event days in HTL are clear- Figure 5 shows the intermediate ion number concentration
sky days with the arriving air masses spending most of their as a function of time from the Zeppelin and the SMEAR II
time in the northwest sector (Dada et al., 2017; Nilsson et al., station. At the beginning of the NPF event, between 07:00–
2001; Sogacheva et al., 2008). 07:15, the Zeppelin ascended from 300 to 800 m. During
In SPC the solar radiation began to increase after 04:00 the ascent the intermediate ion concentrations increased at
and according to the ceilometer measurements the ML a similar rate and stayed at similar values on board the Zep-
started to increase in height around 06:00, at the same time pelin and at the ground level. The lack of vertical gradient in
the SO2 concentration and N>10 (number concentration of the number concentration suggests that the aerosol particles
particles larger than 10 nm) began to increase. This is likely were forming homogeneously throughout the ML. However,
explained by the entrainment of pollutants from the RL and intense turbulent mixing and strong updrafts moving up at
the onset of NPF. CS is higher during the night and decreases roughly the same rate as the Zeppelin might have also re-
slightly during the day, which is likely due to dilution related sulted in a homogeneous number concentration, even if the
to ML growth. aerosol particles were formed close to the surface.
At HTL after sunrise the SO2 concentration and N>10 de- Figure 4c and d show the Zeppelin’s measurement pro-
creased probably due to the dilution caused by the grow- files colored with the pseudo-SA. In SPC, the highest amount
ing ML coupled with the lack of pollution sources. While of pseudo-SA appears to be in the residual layer above the
SO2 concentration remained low the whole day, N>10 and growing morning ML (also observed on 27 June 2012) af-
CS began to increase later during the day because of the ter sunrise. This is in line with the observation that the SO2
NPF event. The average SO2 , N>10 and CS in SPC were concentration increases at the surface when the ML starts to
0.57 ppb, 8102 cm−3 and 0.0128 s−1 , respectively. While in grow (Fig. 3b), indicating that the SO2 was entrained from
HTL the corresponding values were 0.02 ppb, 3293 cm−3 the RL. The entrainment of SO2 from the residual layer is
and 0.0007 s−1 . also supported by previous observations (Kontkanen et al.,
2016). The increased pseudo-SA in the residual layer was
3.2 Onset of NPF not associated with NPF in the residual layer.
In SPC the nighttime SO2 concentration at the surface is
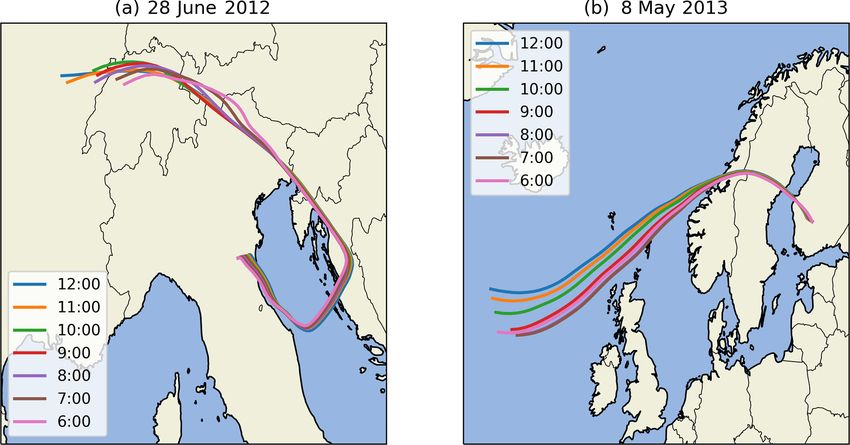
Figure 4a and b show the altitude of the Zeppelin as a func- low likely due to deposition (Kontkanen et al., 2016). How-
tion of time colored by the number concentration of inter- ever ammonia concentration can be high (>30 µg m−3 ) at the
mediate ions measured by the NAIS at SPC and HTL. The surface due to agricultural activities, and the concentration
plots also show the number concentration of intermediate has been observed to peak during the night and early morn-
ions measured on the ground as well as the ML height. ing (Sullivan et al., 2016). In addition oxidized VOCs are im-
In SPC, the intermediate ion concentration began to in- portant for aerosol particle growth (Ehn et al., 2014). VOCs
crease on the ground at 05:48, which coincides with the be- were measured on board the Zeppelin in Po Valley in 2012,
ginning of convective mixing and the breakup of the noctur- and the results showed higher VOC concentrations close to
nal surface layer. Similarly, Kontkanen et al. (2016) observed ground (Jäger, 2014). This may at least partly explain why
that in Po Valley the onset of NPF coincided with the begin- we measured increased concentrations of intermediate ions
https://doi.org/10.5194/acp-21-12649-2021 Atmos. Chem. Phys., 21, 12649–12663, 2021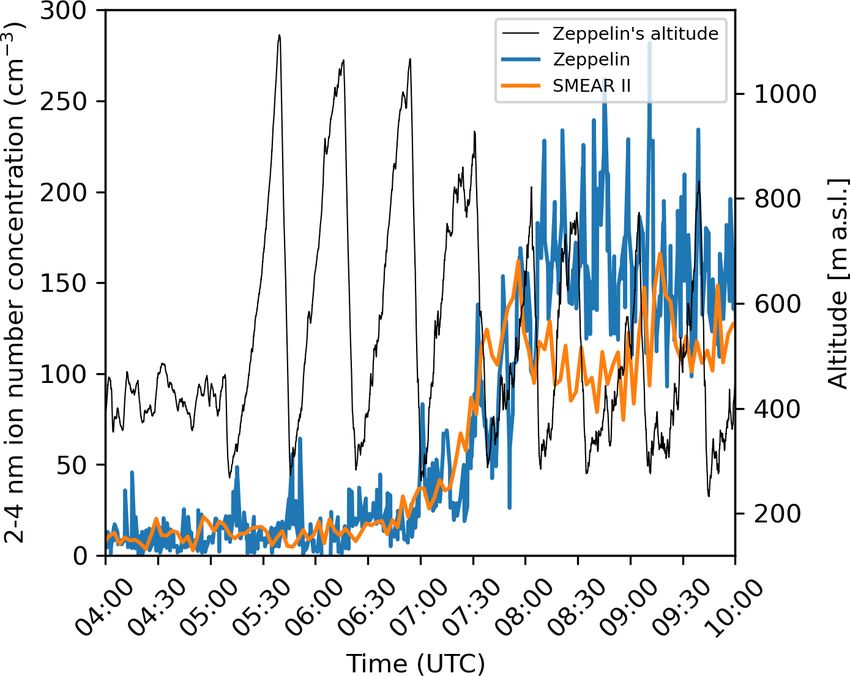
12654                                          J. Lampilahti et al.: Zeppelin-led study on the onset of new particle formation

Figure 2. Air mass backward trajectories to (a) SPC during the morning of 28 June 2012 and (b) HTL during the morning of 8 May 2013.
The legend shows the hour of air mass arrival in UTC. The arrival altitude was set to 100 m above ground.

Figure 3. Ground-based measurements of diurnal variation in (a) temperature and relative humidity, (b) global radiation and SO2 concentra-
tion, (c) >10 nm particle number concentration and condensation sink (CS), and (d) mixed layer height in SPC on 28 June 2012 and in HTL
on 8 May 2013.

in the RL but they did not appear to grow to larger sizes in              In SPC the pseudo-SA layer closely corresponded to a
any significant quantities.                                            layer of reduced condensation sink (CS). In low-CS regions
   Since in SPC the onset of NPF coincides with the begin-             more SA is in the gas phase and therefore detected by the
ning of ML growth, it is possible that the entrainment of SA           APi-TOF (Fig. 4e and f), which probably explains why the
from the residual layer into the growing ML, where ammonia             layer is there. In addition, the CS is also a sink for ions, which
and likely also amines from agricultural activities are present,       means that the pseudo-SA is likely decreased even more than
can lead to stabilization of the SA clusters by the ammonia            SA, assuming that the loss rate is higher for ions than for SA
and amines as well as subsequent NPF (e.g. Almeida et al.,             molecules. By contrast, in HTL the amount of pseudo-SA is
2013; Kirkby et al., 2011).                                            higher inside the ML than above it. The pseudo-SA concen-

Atmos. Chem. Phys., 21, 12649–12663, 2021                                                https://doi.org/10.5194/acp-21-12649-2021
J. Lampilahti et al.: Zeppelin-led study on the onset of new particle formation                                               12655

Figure 4. Time evolution of selected variables as a function of height in SPC on 28 June 2012 and HTL on 8 May 2013. Panels (a) and
(b) show the intermediate ion number concentration from SPC and HTL. Ground-based measurements as well as measurements from the
Zeppelin are shown. Panels (c) and (d) show the pseudo-SA from SPC and HTL. Panels (e) and (f) show the CS. Height of the mixed layer
is shown in all panels.

tration increases on board throughout the morning and peaks          3.3   Particle formation and growth rates
at roughly 09:00 and decreases afterwards.
   In SPC pockets of intermediate ions and a layer of pseudo-
SA were observed in the RL, whereas at HTL intermediate              Figure 6 shows the number size distributions measured by the
ion concentrations and pseudo-SA remained low in the RL.             NAIS on board the Zeppelin and on the ground from SPC and
This is likely related to the relatively larger anthropogenic        HTL. The black dots are the mean mode diameters obtained
emissions in the Po Valley region compared to HTL. In pre-           by fitting a log-normal distribution over the growing particle
vious studies NPF has been observed inside the RL in cen-            mode.
tral Europe (Wehner et al., 2010), and primary nanoparticles           In SPC, the number size distributions measured on board
may be released into the RL from upwind pollution sources            and on the ground with the NAIS (Fig. 6a and c) were similar
(Junkermann and Hacker, 2018).                                       when the Zeppelin was measuring inside the ML. When the
                                                                     Zeppelin measured above the ML, the number concentration
                                                                     decreased, and the growing mode of freshly formed particles

https://doi.org/10.5194/acp-21-12649-2021                                          Atmos. Chem. Phys., 21, 12649–12663, 2021
12656 J. Lampilahti et al.: Zeppelin-led study on the onset of new particle formation
Kontkanen et al. (2016) obtained formation rates of 23.5,
9.5, 0.1 cm and 0.08 cm−3 s−1 for 1.5 nm particles, 2 nm par-
ticles, 2 nm positive ions and 2 nm negative ions, respec-
tively, for the 28 June 2012 NPF event at the ground level.
These values are in line with our values for the same day re-
ported in Table 1 (J3 = 6.8 cm−3 s−1 , J3− = 0.04 cm−3 s−1 ,
J3+ = 0.03 cm−3 s−1 ). The higher formation rates in SPC
compared to HTL are characteristic of polluted environ-
ments (Kerminen et al., 2018). The calculated GRs for the
larger particle sizes as seen in Table 1 were similar on board
the Zeppelin (HTL: GR7–20 = 2.4 nm h−1 , SPC: GR7–20 =
3.0 nm h−1 ) and on the ground (HTL: GR7–20 = 2.1 nm h−1 ,
SPC: GR7–20 = 2.8 nm h−1 ).
On 8 May 2013 in HTL almost the whole NPF event was
captured by the Zeppelin measuring inside the ML. How-
ever, in contrast to SPC the number size distributions mea-
sured on board the Zeppelin (Fig. 6b) and on the ground
Figure 5. Time series of intermediate (2–4 nm) ion number concen- (Fig. 6d) show differences, particularly in the growing nu-
tration on board the Zeppelin and the SMEAR II station and the
cleation mode particles. At different times on board the Zep-
Zeppelin’s altitude in HTL on 8 May 2013.
pelin when it was measuring inside the ML, the particle
number concentration in the growing mode momentarily in-
Table 1. Calculated particle formation and growth rates. + and − creased up to eightfold compared to the background num-
superscripts refer to positive and negative ions, respectively. The ber concentration, suggesting an enhancement in the parti-
Zeppelin missed the beginning of the NPF event in SPC and because cle formation rate. On board the Zeppelin this can be seen as
of that some values are missing. concentrated “vertical stripes” in the number size distribution
between 08:00–10:00. On the other hand, at the ground sta-
HTL (8 May 2013) SPC (28 June 2012) tion an increase of concentration of freshly formed particles
Zeppelin Ground Zeppelin Ground was observed between 07:30–08:00. This inhomogeneity is
further discussed in Sect. 3.3.
J1.5 , [cm−3 s−1 ] 1.5 0.9 – –
In the ground-based NAIS data a pool of sub-6 nm par-
J3 , [cm−3 s−1 ] 0.2 0.3 – 6.8
ticles was present during the NPF event, while on board
J3− , [cm−3 s−1 ] 0.04 0.04 – 0.04
the Zeppelin no such pool was observed. This can be seen
J3+ , [cm−3 s−1 ] 0.04 0.04 – 0.03
most clearly between 10:00–11:30 when the median parti-
GR1–2 , [nm h−1 ] 0.8 0.7 – 0.5
GR2–3 , [nm h−1 ] 1.4 1.5 1.8 1.5
cle number concentration between 2–4 nm on the ground was
GR3–7 , [nm h−1 ] 1.7 1.6 2.9 2.0 1400 cm−3 , whereas on board the Zeppelin it was 570 cm−3 .
GR7–20 , [nm h−1 ] 2.4 2.1 3.0 2.8 Similarly Leino et al. (2019) observed that the number con-
centration of sub-3 nm particles decreases as a function of
altitude at HTL. This may be linked to increased concentra-
tion of low-volatility vapors on the surface near the sources
was not observed. The pockets of intermediate ions in the compared to aloft.
RL did not grow to larger sizes. This can be seen as sudden Despite the differences in the ground-based and airborne
disappearances of the particles, e.g. at around 06:40, 07:15 number size distributions in HTL, a continuous, growing nu-
and 08:00. The observations suggests that the NPF event was cleation mode was observed in the “background” both on
limited to the ML where it was taking place homogeneously. the ground (alongside the pool of sub-6 nm particles) and on
We calculated the formation and growth rates in SPC and board the Zeppelin during the NPF event. When averaged
HTL for particles and ions on board the Zeppelin and on the over the total duration of the NPF event, the growth rates
ground. The results are summarized in Table 1. In SPC the and formation rates on board the Zeppelin and on the ground
onset of NPF happened when the ML was still very shallow, were similar on this day. This would indicate that the ground-
and the Zeppelin was not measuring significant amount of based measurements represent the NPF event in the whole
time at this low altitude (this was a problem on other NPF ML quite well. However locally increased number concen-
event days from SPC as well); consequently, the beginning trations, indicating enhanced NPF, were observed inside the
of the NPF event was not fully observed on board. Because ML, and if the enhancement is not detected with the ground-
of this, we were unable to reliably calculate the formation based measurements we may underestimate the intensity of
rates and the growth rate between 1–2 nm from the Zeppelin NPF within the ML based on ground-based data alone.
data.
Atmos. Chem. Phys., 21, 12649–12663, 2021 https://doi.org/10.5194/acp-21-12649-2021J. Lampilahti et al.: Zeppelin-led study on the onset of new particle formation 12657
Figure 6. Time evolution of particle number size distributions measured by the NAIS (positive polarity) on board the Zeppelin (a, b) and at
the ground level (c, d) in HTL and in SPC on the 2 case study days. The black dots are the mean mode diameters found by fitting a log-normal
distribution over the growing mode. The panels (e) and (f) show the 3–10 nm particle number concentration as a function of time and altitude
on board the Zeppelin and at the ground-based station. The ML height during the measurement flights is also shown.
3.4 Vertical and horizontal distribution of the freshly of the free troposphere. Figure 7 shows the vertical profile
formed particles of 3–10 nm particle number concentration between 07:00–
10:00 UTC calculated by subtracting the total SMPS num-
ber concentration from the UF-CPC number concentration
Next we investigated how the freshly formed particles were on board the Cessna. Also the water vapor concentration and
distributed spatially in the BL. Figure 6e shows the parti- temperature are shown. A temperature inversion and a large
cle number concentration between 3–10 nm measured by the negative gradient in water vapor concentration and in the par-
NAIS and the ML height from SPC as a function of time and ticle number concentration indicated that the top of the ML
altitude. The freshly formed particles were distributed homo- was present between 1300–1400 m.
geneously throughout the growing ML but were not found in On average the number concentration inside the ML re-
the RL. The 3–10 nm number concentration inside the ML mained roughly constant (N3–10 ∼ 1000 cm−3 ) as a function
was ∼ 20 000 cm−3 , while in the residual layer it was only of altitude; however, there was substantial variation (∼ 200–
∼ 200 cm−3 . The pockets of increased intermediate ion con- 3000 cm−3 ). The strongest variation came from a narrow sec-
centration, indicating NPF in the nocturnal boundary layer tor roughly at the center of the measurement area, which is
and residual layer (Fig. 4a), were not observed in the 3– discussed below. The NPF did not extend to the RL where
10 nm size range, suggesting that the particles did not grow the number concentrations were reduced to below 100 cm−3 .
to the 3–10 nm size range in any significant numbers. However at 2000 m a layer of sub-10 nm particles was ob-
At HTL the Zeppelin was measuring in the lower half served. The 3–10 nm number concentration increased from
of the developed ML; however, the Cessna profiled the en- less than 100 cm−3 to ∼ 400 cm−3 . Lampilahti et al. (2021a)
tire depth of the ML all the way up to the lower parts
https://doi.org/10.5194/acp-21-12649-2021 Atmos. Chem. Phys., 21, 12649–12663, 202112658 J. Lampilahti et al.: Zeppelin-led study on the onset of new particle formation
sector grew at approximately the same rate with the back-
ground NPF event particles, which also suggests that the par-
ticles were formed simultaneously inside the long and narrow
sector. Lampilahti et al. (2020b) showed that these types of
NPF events, or local enhancements of regional NPF events,
are common in HTL and that they are linked to roll vortices,
which are a specific mode of organized convection in the BL.
On 28 June 2012 in SPC the Zeppelin flew the measure-
ment profiles over a small area; therefore, it was difficult to
infer the horizontal extent of the NPF event. However, on
30 June 2012 the Zeppelin measured over a larger area in or-
der to find the edges of the air mass where the NPF event was
taking place. The flight on 30 June 2012 lasted from 05:00
to 10:00 UTC. Figure 9b shows that the NPF event was ob-
served to occur in the sector of the Po Valley comprised be-
tween Ozzano (just north of the Apennine foothills) and the
city of Ferrara (just south of the Po river). The area in be-
tween experienced westerly winds, from the inner Po Valley
towards the Adriatic sea, which is a common feature of the
Po Valley wind breeze system in the early morning.
Farther north of the Po river, an easterly breeze was devel-
oping and no NPF was observed (off the map in Fig. 8b; see
Fig. 9). Nocturnal northeasterly breezes are often observed
over the Tre Venezie region as a result of a low-level jet (Ca-
muffo et al., 1979). The variability in local wind fields may
Figure 7. Vertical profile of 3–10 nm particle number concentration
(black dots), temperature (blue line) and water vapor concentration
generate chemical gradients in the atmospheric surface layer
(red line) measured on board the Cessna between 07:00–10:00 on within the Po Valley, hence segregating air masses which can
8 May 2013 in HTL. be active or inactive with respect to NPF, in complete absence
of orographic forcings (i.e. over a completely flat terrain).
Probably the air masses with an easterly component reach-
ing the Zeppelin from the Venetian Plain picked up pollution
showed evidence that NPF frequently takes place in the in- (e.g. CO, NOx ) from urban sources, but we can also specu-
terface between the residual layer and the free troposphere, late that, for example, ammonia and amines were much lower
disconnected from the ML. Precursor gases may be trans- than in the westerly air masses flowing south of the Po river,
ported to these altitudes, and the mixing over the interface which had crossed the areas between Emilia and Lombardy
layer could initiate nucleation. where most agricultural activities take place (see Fig. 9). A
Figure 8a shows the particle number concentration be- chemical transport model run, predicting NH3 concentrations
tween 3–10 nm on board the Zeppelin and the airplane as a with adequate resolution and using them as a tracer for the
function of longitude and latitude from HTL on 8 May 2013. actual precursors for NPF, might clarify this point. However,
The particle number concentration was elevated right over modeling atmospheric transport at this scale in an environ-
HTL in a narrow sector perpendicular to the mean wind di- ment like Po Valley can have substantial uncertainties (Vogel
rection. Vertically the sector extended throughout the depth and Elbern, 2021).
of the ML. The number concentration in the sector increased
2–8 fold compared to the surrounding background number
concentration. The mean wind speed in the ML was about 4 Conclusions
4 m s−1 , and the particle sector was observed throughout the
Flight measurements are essential to evaluate the representa-
whole measurement flight for at least 2.5 h. This suggests that
tiveness of the ground-based in situ measurements. In many
the particle sector was probably at least 35 km long along the
cases it may be impossible to tell from only ground-based
mean wind direction.
data what drives the observed NPF, especially when the ef-
The concentrated vertical stripes over the growing nucle-
fect of BL dynamics is important. Atmospheric models re-
ation mode in Fig. 6b were caused by the Zeppelin period-
quire field observations for validation and constraints. Air-
ically flying through the particle sector. The sector slowly
borne measurements such as the ones reported here provide
moved perpendicular to the mean wind towards northeast,
valuable data for this purpose.
and when passing over HTL it was seen as the plume of par-
ticles in Fig. 6d between 07:30–08:00. The particles in the
Atmos. Chem. Phys., 21, 12649–12663, 2021 https://doi.org/10.5194/acp-21-12649-2021J. Lampilahti et al.: Zeppelin-led study on the onset of new particle formation 12659 Figure 8. (a) The flight tracks of the Zeppelin (circular track) and the airplane (track with back and fourth segments) colored by 3–10 nm par- ticle number concentration from HTL on 8 May 2013. (b) The flight track of the Zeppelin colored by 3–10 nm particle number concentration from SPC on 30 June 2012. The Zeppelin flight track has gaps, because the NAIS was measuring in the ion mode during that time. We compared case studies from two different environ- were observed to grow to larger sizes at the same rate within ments where NPF occurs frequently: a suburban area in Po the ML. However, in HTL we observed local enhancements Valley, Italy, and a boreal forest in Hyytiälä, Finland. We in NPF that were induced by roll vortices in the BL. aimed to answer in which part of the BL the onset of NPF In addition a separate layer of sub-10 nm particles was and the growth of the freshly formed particles took place and observed above the ML in HTL. Lampilahti et al. (2021a) to study the vertical and horizontal extent of NPF. showed that such layers in HTL are likely the result of NPF To detect directly the very first steps of NPF in the BL, in the topmost part of the RL. Furthermore it was estimated we used airborne Zeppelin and airplane measurements, sup- that around 42 % of the NPF events observed in HTL at the ported by ground-based in situ measurements. The Zeppelin surface are entrained from such elevated layers. In SPC we measurements allowed us to study the vertical extent of NPF observed how NPF could be happening in one air mass but in the BL. The high time resolution and low cut-off size of be completely absent in an adjacent air mass with a different the instruments on board allowed us to observe the starting origin. time, location and altitude of an NPF event. The conditions on our case study days represent the typ- Within the limits of the Zeppelin’s vertical profiling speed ical conditions in these locations when NPF events usually (∼ 0.5 m s−1 ascent) and the time resolution of the NAIS, we occur. That is to say, a sunny day with the air masses origi- observed that the onset of NPF happened simultaneously in- nating from a certain area during a specific time of the year side the ML. However particles formed close to the surface (May in HTL and June in SPC) when NPF is common. Nev- could probably still be mixed by strong updrafts fast enough ertheless it is not certain that our case studies represent a typ- so that the number concentrations measured on board the ical NPF event day. NPF events also occur under different Zeppelin appear homogeneous. The newly formed particles kinds of conditions. The growing nucleation mode particles https://doi.org/10.5194/acp-21-12649-2021 Atmos. Chem. Phys., 21, 12649–12663, 2021
12660                                               J. Lampilahti et al.: Zeppelin-led study on the onset of new particle formation

                                                                            Acknowledgements. The Finnish Cultural Foundation is gratefully
                                                                            acknowledged. The Zeppelin is accompanied by an international
                                                                            team of scientists and technicians. They are all warmly acknowl-
                                                                            edged.

                                                                            Financial support. This research has been supported by the Eu-
                                                                            ropean Commission, Seventh Framework Programme (PEGASOS
                                                                            (grant no. 265148)), the Academy of Finland (grant nos. 272041
                                                                            and 1118615), the European Research Council, FP7 Ideas: Euro-
                                                                            pean Research Council (ATMNUCLE (grant no. 227463)), and the
                                                                            Eurostars Programme (contract no. E!6911).

                                                                            Open-access funding was provided by the Helsinki
                                                                            University Library.

                                                                            Review statement. This paper was edited by Lynn M. Russell and
                                                                            reviewed by two anonymous referees.
Figure 9. Air mass back-trajectories (black dotted lines) arriving
to the Zeppelin’s measurement area at 08:00 UTC (when the NPF
event started) over northern Italy on 30 June 2012. The arrival al-
titude of the trajectories is 400 m a.s.l. The separation between the       References
dots along the trajectories is 1 h. The red line is the Zeppelin’s flight
track.                                                                      Aalto, P., Hämeri, K., Becker, E., Weber, R., Salm, J., Mäkelä, J.
                                                                              M., Hoell, C., O’Dowd, C. D., Hansson, H.-C., Väkevä, M., Ko-
                                                                              ponen, I. K., Buzorius, G., and Kulmala, M.: Physical characteri-
originating from NPF do not always grow smoothly and con-                     zation of aerosol particles during nucleation events, Tellus B, 53,
tinuously in the measured size distribution like in our cases                 344–358, https://doi.org/10.3402/tellusb.v53i4.17127, 2001.
but may have large variation and discontinuities, which may                 Almeida, J., Schobesberger, S., Kürten, A., Ortega, I. K.,
reflect the vertical and horizontal variability in NPF.                       Kupiainen-Määttä, O., Praplan, A. P., Adamov, A., Amorim, A.,
                                                                              Bianchi, F., Breitenlechner, M., David, A., Dommen, J., Don-
                                                                              ahue, N. M., Downard, A., Dunne, E., Duplissy, J., Ehrhart, S.,
Data availability. Data used in this study are available from dif-            Flagan, R. C., Franchin, A., Guida, R., Hakala, J., Hansel, A.,
ferent sources: ground-based meteorological, radiation, gas and               Heinritzi, M., Henschel, H., Jokinen, T., Junninen, H., Kajos, M.,
particle size distribution data from HTL (https://smear.avaa.csc.fi/;         Kangasluoma, J., Keskinen, H., Kupc, A., Kurtén, T., Kvashin,
Junninen et al., 2009); the Cessna dataset (https://doi.org/10.5281/          A. N., Laaksonen, A., Lehtipalo, K., Leiminger, M., Leppä,
zenodo.3688471; Lampilahti et al., 2020a); and the rest of the data           J., Loukonen, V., Makhmutov, V., Mathot, S., McGrath, M. J.,
(https://doi.org/10.5281/zenodo.4660145, Lampilahti et al., 2021b)            Nieminen, T., Olenius, T., Onnela, A., Petäjä, T., Riccobono, F.,
are available.                                                                Riipinen, I., Rissanen, M., Rondo, L., Ruuskanen, T., Santos, F.
                                                                              D., Sarnela, N., Schallhart, S., Schnitzhofer, R., Seinfeld, J. H.,
                                                                              Simon, M., Sipilä, M., Stozhkov, Y., Stratmann, F., Tomé, A.,
Author contributions. HEM, TN, SM, ME, IP, SiS, JKa, JLe, EJ,                 Tröstl, J., Tsagkogeorgas, G., Vaattovaara, P., Viisanen, Y., Vir-
TYJ, RK, KLeh, SD, AM, RT, DRW, FR, TP, TFM and MK co-                        tanen, A., Vrtala, A., Wagner, P. E., Weingartner, E., Wex, H.,
ordinated the Zeppelin campaign. RV carried out the Cessna mea-               Williamson, C., Wimmer, D., Ye, P., Yli-Juuti, T., Carslaw, K.
surements. JLa, TN, HEM, JKo, KLei and VMK analyzed and in-                   S., Kulmala, M., Curtius, J., Baltensperger, U., Worsnop, D. R.,
terpreted the data. JLa and HEM prepared the article, with contri-            Vehkamäki, H., and Kirkby, J.: Molecular understanding of sul-
butions from all coauthors.                                                   phuric acid-amine particle nucleation in the atmosphere, Nature,
                                                                              502, 359–363, https://doi.org/10.1038/nature12663, 2013.
                                                                            Camuffo, D., Tampieri, F., and Zambon, G.: Local mesoscale
Competing interests. The authors declare that they have no conflict           circulation over Venice as a result of the mountain-
of interest.                                                                  sea interaction, Bound.-Lay. Meteorol., 16, 83–92,
                                                                              https://doi.org/10.1007/BF02220408, 1979.
                                                                            Chen, H., Hodshire, A. L., Ortega, J., Greenberg, J., McMurry, P. H.,
                                                                              Carlton, A. G., Pierce, J. R., Hanson, D. R., and Smith, J. N.: Ver-
Disclaimer. Publisher’s note: Copernicus Publications remains
                                                                              tically resolved concentration and liquid water content of atmo-
neutral with regard to jurisdictional claims in published maps and
                                                                              spheric nanoparticles at the US DOE Southern Great Plains site,
institutional affiliations.
                                                                              Atmos. Chem. Phys., 18, 311–326, https://doi.org/10.5194/acp-
                                                                              18-311-2018, 2018.

Atmos. Chem. Phys., 21, 12649–12663, 2021                                                     https://doi.org/10.5194/acp-21-12649-2021
J. Lampilahti et al.: Zeppelin-led study on the onset of new particle formation 12661 Dada, L., Paasonen, P., Nieminen, T., Buenrostro Mazon, S., Kon- a boreal coniferous forest, Atmos. Environ., 37, 1623–1634, tkanen, J., Peräkylä, O., Lehtipalo, K., Hussein, T., Petäjä, https://doi.org/10.1016/S1352-2310(03)00014-1, 2003. T., Kerminen, V.-M., Bäck, J., and Kulmala, M.: Long-term Hamed, A., Joutsensaari, J., Mikkonen, S., Sogacheva, L., Dal analysis of clear-sky new particle formation events and non- Maso, M., Kulmala, M., Cavalli, F., Fuzzi, S., Facchini, M. C., events in Hyytiälä, Atmos. Chem. Phys., 17, 6227–6241, Decesari, S., Mircea, M., Lehtinen, K. E. J., and Laaksonen, https://doi.org/10.5194/acp-17-6227-2017, 2017. A.: Nucleation and growth of new particles in Po Valley, Italy, Dal Maso, M., Kulmala, M., Riipinen, I., Wagner, R., Hussein, T., Atmos. Chem. Phys., 7, 355–376, https://doi.org/10.5194/acp-7- Aalto, P. P., and Lehtinen, K. E.: Formation and growth of fresh 355-2007, 2007. atmospheric aerosols: eight years of aerosol size distribution data Hari, P. and Kulmala, M.: Station for measuring ecosystem- from SMEAR II, Hyytiälä, Finland, Boreal Environ. Res., 10, atmosphere relations (SMEAR II), Boreal Environ. Res., 10, 323–336, 2005. 315–322, 2005. Dunne, E. M., Gordon, H., Kürten, A., Almeida, J., Duplissy, Jäger, J.: Airborne VOC measurements on board the Zeppelin NT J., Williamson, C., Ortega, I. K., Pringle, K. J., Adamov, A., during the PEGASOS campaigns in 2012 deploying the im- Baltensperger, U., Barmet, P., Benduhn, F., Bianchi, F., Breit- proved Fast-GC-MSD System, dissertation, Forschungszentrum enlechner, M., Clarke, A., Curtius, J., Dommen, J., Donahue, Jülich GmbH, ISBN 978-3-89336-936-2, 2014. N. M., Ehrhart, S., Flagan, R. C., Franchin, A., Guida, R., Junkermann, W. and Hacker, J. M.: Ultrafine Particles in the Lower Hakala, J., Hansel, A., Heinritzi, M., Jokinen, T., Kangasluoma, Troposphere: Major Sources, Invisible Plumes, and Meteorolog- J., Kirkby, J., Kulmala, M., Kupc, A., Lawler, M. J., Lehti- ical Transport Processes, B. Am. Meteorol. Soc., 99, 2587–2602, palo, K., Makhmutov, V., Mann, G., Mathot, S., Merikanto, https://doi.org/10.1175/BAMS-D-18-0075.1, 2018. J., Miettinen, P., Nenes, A., Onnela, A., Rap, A., Reddington, Junninen, H., Lauri, A., Keronen, P., AaIto, P., HiItunen, V., Hari, P., C. L. S., Riccobono, F., Richards, N. A. D., Rissanen, M. P., and KuImaIa, M.: Smart-SMEAR: on-line data exploration and Rondo, L., Sarnela, N., Schobesberger, S., Sengupta, K., Simon, visualization tool tor SMEAR stations, Boreal Environ. Res., 14, M., Sipilä, M., Smith, J. N., Stozkhov, Y., Tomé, A., Tröstl, 447–457, 2009 (data available at: https://smear.avaa.csc.fi/, last J., Wagner, P. E., Wimmer, D., Winkler, P. M., Worsnop, D. access: 25 August 2021). R., and Carslaw, K. S.: Global atmospheric particle formation Junninen, H., Ehn, M., Petäjä, T., Luosujärvi, L., Kotiaho, T., Kos- from CERN CLOUD measurements, Science, 354, 1119–1124, tiainen, R., Rohner, U., Gonin, M., Fuhrer, K., Kulmala, M., and https://doi.org/10.1126/science.aaf2649, 2016. Worsnop, D. R.: A high-resolution mass spectrometer to mea- Ehn, M., Junninen, H., Petäjä, T., Kurtén, T., Kerminen, V.-M., sure atmospheric ion composition, Atmos. Meas. Tech., 3, 1039– Schobesberger, S., Manninen, H. E., Ortega, I. K., Vehkamäki, 1053, https://doi.org/10.5194/amt-3-1039-2010, 2010. H., Kulmala, M., and Worsnop, D. R.: Composition and tem- Kerminen, V.-M., Chen, X., Vakkari, V., Petäjä, T., Kulmala, M., poral behavior of ambient ions in the boreal forest, Atmos. and Bianchi, F.: Atmospheric new particle formation and growth: Chem. Phys., 10, 8513–8530, https://doi.org/10.5194/acp-10- review of field observations, Environ. Res. Lett., 13, 103003, 8513-2010, 2010. https://doi.org/10.1088/1748-9326/aadf3c, 2018. Ehn, M., Thornton, J. A., Kleist, E., Sipilä, M., Junninen, H., Kirkby, J., Curtius, J., Almeida, J., Dunne, E., Duplissy, J., Ehrhart, Pullinen, I., Springer, M., Rubach, F., Tillmann, R., Lee, B., S., Franchin, A., Gagné, S., Ickes, L., Kürten, A., Kupc, A., Met- Lopez-Hilfiker, F., Andres, S., Acir, I.-H., Rissanen, M., Joki- zger, A., Riccobono, F., Rondo, L., Schobesberger, S., Tsagko- nen, T., Schobesberger, S., Kangasluoma, J., Kontkanen, J., georgas, G., Wimmer, D., Amorim, A., Bianchi, F., Breitenlech- Nieminen, T., Kurtén, T., Nielsen, L. B., Jørgensen, S., Kjaer- ner, M., David, A., Dommen, J., Downard, A., Ehn, M., Fla- gaard, H. G., Canagaratna, M., Maso, M. D., Berndt, T., gan, R. C., Haider, S., Hansel, A., Hauser, D., Jud, W., Junni- Petäjä, T., Wahner, A., Kerminen, V.-M., Kulmala, M., Worsnop, nen, H., Kreissl, F., Kvashin, A., Laaksonen, A., Lehtipalo, K., D. R., Wildt, J., and Mentel, T. F.: A large source of low- Lima, J., Lovejoy, E. R., Makhmutov, V., Mathot, S., Mikkilä, J., volatility secondary organic aerosol, Nature, 506, 476–479, Minginette, P., Mogo, S., Nieminen, T., Onnela, A., Pereira, P., https://doi.org/10.1038/nature13032, 2014. Petäjä, T., Schnitzhofer, R., Seinfeld, J. H., Sipilä, M., Stozhkov, Eisele, F. L. and Tanner, D. J.: Ion-assisted tropospheric Y., Stratmann, F., Tomé, A., Vanhanen, J., Viisanen, Y., Vrtala, OH measurements, J. Geophys. Res.-Atmos., 96, 9295–9308, A., Wagner, P. E., Walther, H., Weingartner, E., Wex, H., Win- https://doi.org/10.1029/91JD00198, 1991. kler, P. M., Carslaw, K. S., Worsnop, D. R., Baltensperger, U., Gordon, H., Kirkby, J., Baltensperger, U., Bianchi, F., Breit- and Kulmala, M.: Role of sulphuric acid, ammonia and galac- enlechner, M., Curtius, J., Dias, A., Dommen, J., Donahue, tic cosmic rays in atmospheric aerosol nucleation, Nature, 476, N. M., Dunne, E. M., Duplissy, J., Ehrhart, S., Flagan, R. 429–433, https://doi.org/10.1038/nature10343, 2011. C., Frege, C., Fuchs, C., Hansel, A., Hoyle, C. R., Kul- Kontkanen, J., Järvinen, E., Manninen, H. E., Lehtipalo, K., Kan- mala, M., Kürten, A., Lehtipalo, K., Makhmutov, V., Molteni, gasluoma, J., Decesari, S., Gobbi, G. P., Laaksonen, A., Petäjä, U., Rissanen, M. P., Stozkhov, Y., Tröstl, J., Tsagkogeor- T., and Kulmala, M.: High concentrations of sub-3nm clus- gas, G., Wagner, R., Williamson, C., Wimmer, D., Winkler, ters and frequent new particle formation observed in the Po P. M., Yan, C., and Carslaw, K. S.: Causes and importance Valley, Italy, during the PEGASOS 2012 campaign, Atmos. of new particle formation in the present-day and preindus- Chem. Phys., 16, 1919–1935, https://doi.org/10.5194/acp-16- trial atmospheres, J. Geophys. Res.-Atmos., 122, 8739–8760, 1919-2016, 2016. https://doi.org/10.1002/2017JD026844, 2017. Kulmala, M., Petäjä, T., Nieminen, T., Sipilä, M., Manninen, Hakola, H., Tarvainen, V., Laurila, T., Hiltunen, V., Hellén, H., and H. E., Lehtipalo, K., Dal Maso, M., Aalto, P. P., Junninen, Keronen, P.: Seasonal variation of VOC concentrations above H., Paasonen, P., Riipinen, I., Lehtinen, K. E. J., Laakso- https://doi.org/10.5194/acp-21-12649-2021 Atmos. Chem. Phys., 21, 12649–12663, 2021
You can also read