Simulating the effects of weather and climate on large wildfires in France - Nat. Hazards Earth Syst. Sci.
←
→
Page content transcription
If your browser does not render page correctly, please read the page content below
Nat. Hazards Earth Syst. Sci., 19, 441–454, 2019
https://doi.org/10.5194/nhess-19-441-2019
© Author(s) 2019. This work is distributed under
the Creative Commons Attribution 4.0 License.

Simulating the effects of weather and climate
on large wildfires in France
Renaud Barbero, Thomas Curt, Anne Ganteaume, Eric Maillé, Marielle Jappiot, and Adeline Bellet
Irstea, Mediterranean ecosystems and risks, Aix-en-Provence, France

Correspondence: Renaud Barbero (renaud.barbero@irstea.fr)

Received: 3 October 2018 – Discussion started: 24 October 2018
Accepted: 15 February 2019 – Published: 1 March 2019

Abstract. Large wildfires across parts of France can cause          1   Introduction
devastating damage which puts lives, infrastructure, and the
natural ecosystem at risk. In the climate change context, it        Large wildfires in France have received much attention re-
is essential to better understand how these large wildfires re-     cently due to the threat they pose to ecosystems, society,
late to weather and climate and how they might change in            property, and the economy. In the Mediterranean region,
a warmer world. Such projections rely on the development            large wildfires threaten many of the ecosystems components
of a robust modeling framework linking large wildfires to           and their recurrence can induce a loss of resilience (Pausas
present-day atmospheric variability. Drawing from a MODIS           et al., 2008), potential shifts in plant composition and struc-
product and a gridded meteorological dataset, we derived a          ture (Vennetier and Ripert, 2009; Frejaville et al., 2013) or
suite of biophysical and fire danger indices and developed          soil losses. Additionally, the growth of the wildland–urban
generalized linear models simulating the probability of large       interface (WUI) has increased wildfire risk, the cost of sup-
wildfires ( > 100 ha) at 8 km spatial and daily temporal reso-      pression, and our vulnerability across the region (Lampin-
lutions across the entire country over the last two decades.        Maillet et al., 2011; Modugno et al., 2016; Ruffault and
The models were able to reproduce large-wildfire activity           Mouillot, 2017; Fox et al., 2018), and will continue to do
across a range of spatial and temporal scales. Different sen-       so given future demographic trends. Although wildfire extent
sitivities to weather and climate were detected across differ-      does not systematically reflect wildfire intensity and the re-
ent environmental regions. Long-term drought was found to           lated impacts (Tedim et al., 2018), large wildfires are usually
be a significant predictor of large wildfires in flammability-      the most destructive for both ecosystems and infrastructure.
limited systems such as the Alpine and southwestern regions.           Wildfire ignitions in Europe were strongly related to a
In the Mediterranean, large wildfires were found to be associ-      range of human activities (Ganteaume et al., 2013), with
ated with both short-term fire weather conditions and longer-       arson and negligence being the main causes in the French
term soil moisture deficits, collectively facilitating the occur-   Mediterranean (Ganteaume and Jappiot, 2013; Curt et al.,
rence of large wildfires. Simulated probabilities on days with      2016; Ganteaume and Guerra, 2018). Despite the accidental
large wildfires were on average 2–3 times higher than normal        and unintentional nature of most wildfire ignitions, wildfire
with respect to the mean seasonal cycle, highlighting the key       spread in the French Mediterranean is generally enabled and
role of atmospheric variability in wildfire spread. The model       driven by a range of weather-to-climate processes operating
has wide applications, including improving our understand-          at different timescales such as long-term drought (Hernandez
ing of the drivers of large wildfires over the historical period    et al., 2015b; Turco et al., 2017) and favorable large-scale
and providing a basis on which to estimate future changes to        weather conditions including synoptic blocking (Hernandez
large wildfires from climate scenarios.                             et al., 2015a) or the Atlantic ridge weather type (Ruffault
                                                                    et al., 2017). These large-scale weather patterns are known
                                                                    to facilitate wildfire spread through different mechanisms:
                                                                    wind speed (for the Atlantic ridge) and anomalously warm
                                                                    conditions (for the synoptic blocking) (Ruffault et al., 2016).

Published by Copernicus Publications on behalf of the European Geosciences Union.
442                            R. Barbero et al.: Simulating the effects of weather and climate on large wildfires in France

While wind-induced wildfires may arise due to strong winds          2     Data and methods
that accelerate the rate of spread in a specific direction, heat-
induced wildfires (also called plume-driven wildfires) arise        2.1    Wildfire data
due to anomalously warm conditions that increase fuel dry-
ness and flammability and facilitate wildfire spread in all
                                                                    We used the Moderate Resolution Imaging Spectroradiome-
directions (Lahaye et al., 2017), contingent on topography
                                                                    ter (MODIS) Firecci v5.0 product developed within the
and fuel structure. Collectively, heatwave, wind speed, and
                                                                    framework of the European Space Agency’s Climate Change
drought conditions during previous months have been shown
                                                                    Initiative (CCI) program and available in the period 2001–
to enhance the potential for large wildfires (Hernandez et al.,
                                                                    2016 (Chuvieco et al., 2016). This product is based on
2015a, b; Ruffault et al., 2018). However, most of these pre-
                                                                    MODIS on board of the Terra polar heliosynchronous or-
vious efforts have exploited regional datasets of burned ar-
                                                                    biting satellite. The burned-area algorithm combined tem-
eas across parts of southeastern France commencing in early
                                                                    poral changes in near-infrared MERIS-corrected reflectances
1970s, and little attention has been devoted to understanding
                                                                    based on MOD09GQ of the MODIS sensor at 250 m spa-
processes in other regions except in the Alps (Dupire et al.,
                                                                    tial resolution with active fire detection from the standard
2017).
                                                                    MODIS thermal anomalies product, following a two-phase
   Over the long-term, a substantial reduction in wildfire ac-
                                                                    algorithm (Alonso-Canas and Chuvieco, 2015). Complemen-
tivity was observed in the 1990s across the French Mediter-
                                                                    tary to the surface reflectance product, the daily MOD09GA
ranean due to suppression and prevention strategies (Ruf-
                                                                    Collection 6 product was also used to extract information on
fault and Mouillot, 2015; Curt and Frejaville, 2017), de-
                                                                    the quality of the data. Although small wildfires are generally
coupling wildfire trends from climate expectations (Fréjav-
                                                                    difficult to detect with satellite observations due to the timing
ille and Curt, 2017). However, the 2003 heatwave induced
                                                                    of the scan or cloud-cover impairment of remote sensing, our
wildfire-prone meteorological conditions across the region,
                                                                    focus on large wildfires is expected to minimize this uncer-
impeding suppression efforts and putting 2003 as one of the
                                                                    tainty.
most extreme years in terms of burned area over the last six
                                                                       We excluded MODIS fires located within agricultural
decades (Ganteaume and Barbero, 2018). The continued in-
                                                                    lands using CORINE Land Cover 2012 data (https://land.
tensification and increased frequency of heatwaves in the fu-
                                                                    copernicus.eu/pan-european/corine-land-cover, last access:
ture due to climate change (Vautard et al., 2013; Guerreiro
                                                                    28 Febuary 2019) as well as prescribed fires related to pas-
et al., 2018), alongside the gradual precipitation deficit sim-
                                                                    toral practices during the cool season (November–March),
ulated by climate models across southern Europe during the
                                                                    since these fires are generally under control and do not put
fire season (Abatzoglou et al., 2018; Cramer et al., 2018),
                                                                    infrastructure or ecosystems at risk. Spatially and temporally
raises legitimate concerns about the sustainability of current
                                                                    adjacent MODIS pixels were aggregated using the location
fire policies and strategies. Additionally, the accumulation of
                                                                    and the date of the first detection to form consistent wildfire
fuel loads due to past wildfire suppression efforts within a
                                                                    events. Pixels belonging to the same wildfire event were re-
long-term forest recovery context across the Mediterranean
                                                                    quired to be within a maximum distance of 4 pixels (to min-
(Abadie et al., 2017) is widely thought to have created favor-
                                                                    imize inaccuracies in burned-area detection within a pixel)
able ground conditions for wildfire spread and the occurrence
                                                                    and to have adjacent burning dates. The 22 785 MODIS pix-
of large wildfires (Curt and Frejaville, 2017).
                                                                    els extracted from 2001 to 2016 across France were found to
   In this context, it is essential to develop a modeling frame-
                                                                    form 894 distinct wildfire events. We then defined large wild-
work resolving the complex relationships linking weather-to-
                                                                    fires as exceeding 100 ha (N = 156 large wildfires) following
climate variability to the occurrence of large wildfires. Such
                                                                    Ganteaume and Barbero (2018), a threshold corresponding
a model is still lacking due to observational inhomogeneities
                                                                    here to the 83th percentile of the distribution of wildfire area.
in wildfire detection across the country, hampering the com-
                                                                    The average large-wildfire area was found to be 398 ha, with
pilation of a homogeneous database. Drawing from a global
                                                                    the largest wildfire reaching 7675 ha. Finally, we regridded
remote-sensing database of burned area, we sought here to
                                                                    this information onto an 8 km resolution grid to facilitate the
develop a nationwide statistical model including wildfire-
                                                                    comparison with meteorological data (see Sect. 2.2).
prone regions overlooked in previous studies. The model
is expected to advance our understanding of processes and
drivers of large wildfires and to provide guidance on how           2.2    Weather and climate data
weather and climate variability may increase the occurrence
of large wildfires in France under a warmer climate.                Meteorological variables were obtained from the quality-
                                                                    controlled SAFRAN (Système d’Analyse Fournissant des
                                                                    Renseignements Atmosphériques a la Neige; Analysis sys-
                                                                    tem providing data for the snow model) reanalyses, provid-
                                                                    ing minimum and maximum temperature, relative humid-
                                                                    ity, precipitation, and wind speed over France from 2001 to

Nat. Hazards Earth Syst. Sci., 19, 441–454, 2019                              www.nat-hazards-earth-syst-sci.net/19/441/2019/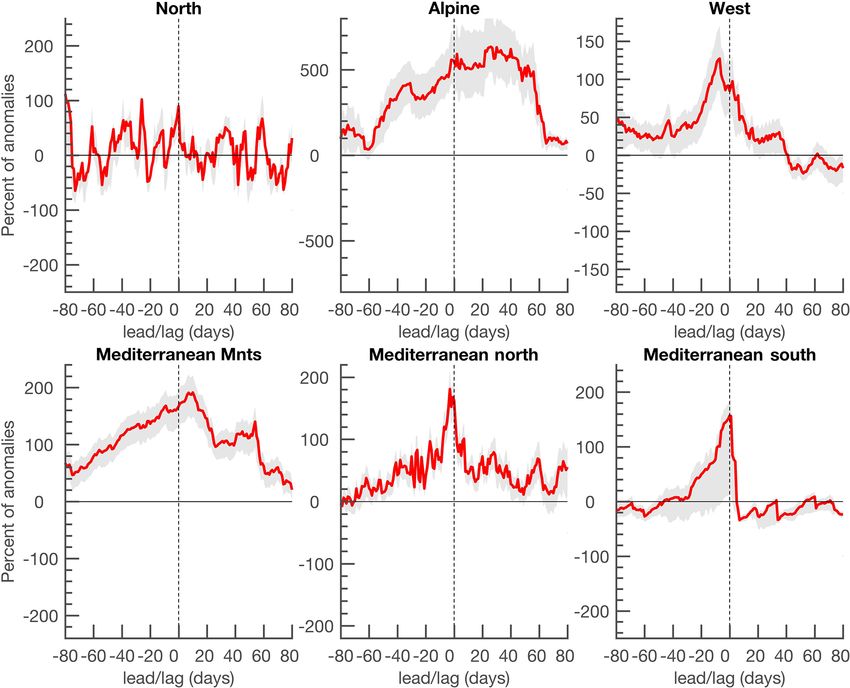
R. Barbero et al.: Simulating the effects of weather and climate on large wildfires in France                                  443

Table 1. Candidate variables in the modeling framework.            parametric framework (Farahmand and AghaKouchak, 2015)
                                                                   and computed on 6-month windows to detect a long-term
       Name                                    Acronym             precipitation deficit. The SPI has already shown some skill
       1. Fine fuel moisture code              FFMC
                                                                   in predicting burned area across different parts of the globe
       2. Duff moisture code                   DMC                 (Turco et al., 2018). Finally, we used the more sophisticated
       3. Drought code                         DC                  soil wetness index (SWI) developed by CNRM (Centre Na-
       4. Initial-spread index                 ISI                 tional de la Recherche Météorologique). This last index was
       5. Build-up index                       BUI                 derived from ISBA (Noilhan and Mahfouf, 1996), a soil–
       6. Fire-weather index                   FWI                 biosphere–atmosphere interaction model based on soil char-
       7. Forest McArthur Fire Danger Index    FFDI                acteristics across France, reflecting the moisture available for
       8. F-Index                              FINDEX              the plants. The SWI integrates the propagation of moisture
       9. Nesterov Fire Danger Index           NFDI                from the superficial surface layer to the root zone (Barbu
       10. Fosberg Fire Weather Index          FFWI                et al., 2011).
       11. Effective drought index             EDI
       12. Potential evapotranspiration        PET                 2.3   Environmental stratification
       13. Standardized precipitation index    SPI
       14. Soil wetness index                  SWI                 The relationship between weather-to-climate and wildfire ac-
                                                                   tivity in France is mediated through vegetation and the com-
                                                                   plex topography of the region (Fig. 1a) alongside human
2016 (Vidal et al., 2010a, b; Vidal et al., 2012) on a daily ba-   factors (Fréjaville and Curt, 2015; Ganteaume and Long-
sis and over an 8 km grid.                                         Fournel, 2015; Ganteaume and Guerra, 2018). Given the
   Drawing from the SAFRAN data, we derived a suite                compounding influence of these environmental factors, we
of fire-weather and drought indices (see Table 1) in-              developed separate models using an environmental stratifi-
tended to reflect different timescales of variability that are     cation (Fig. 1b) based on climate data, topography, and ge-
widely thought to facilitate wildfire spread from synoptic         ographical position (Metzger et al., 2005; Jongman et al.,
(weather) to interannual (climate) scales (Barbero et al.,         2006), assuming that the weather-to-climate forcing on large
2015a; Nogueira et al., 2017). Fire-weather variables in-          wildfires is relatively consistent within each of these re-
cluded the Canadian Forest Fire Weather Index system (fine         gions. Only a brief description of these environmental units
fuel moisture code (FFMC), build-up index (BUI), duff mois-        is given here. The northern region (Atlantic central in Met-
ture code (DMC), initial spread index (ISI), drought code          zger et al., 2005), the less fire-prone region (Table 2), corre-
(DC), and fire-weather index (FWI)) (Van Wagner, 1987).            sponds to a temperate climate in which average summer tem-
Although these indices were empirically calibrated for es-         peratures are relatively low. The Alpine region spans high-
timating whether atmospheric conditions and fuel moisture          mountain conditions typical of the alpine ranges of south-
content are prone to wildfire development in a jack pine           ern Europe, which are dominated by conifer forests at high
forest of Canada (Van Wagner, 1987), the FWI system has            elevation and broadleaf forest at low elevation. The west-
proven useful in Mediterranean regions (Dimitrakopoulos            ern region (Lusitanean in Metzger et al., 2005), corresponds
et al., 2011; Fox et al., 2018; Lahaye et al., 2017) as well       to the southern Atlantic climate characterized by warm and
as in Alpine environments (Dupire et al., 2017). We also in-       dry summers coupled with mild and humid winters. Fur-
cluded in our analysis other fire-weather indices that have        ther south, the Mediterranean area is stratified into three
been shown to be useful for estimating fire danger conditions      distinct environmental regions: the Mediterranean moun-
across parts of the world including the Forest McArthur Fire       tains (labeled “Mnts” in the figures), which combine the in-
Danger Index (Dowdy et al., 2010), the F-Index (Sharples           fluence of both Mediterranean and mountain climates (in-
et al., 2009), the Nesterov Fire Danger Index (Nesterov,           cluding various species such as Fagus sylvatica, Pinus sp.,
1949) and the Fosberg Fire Weather Index (Fosberg, 1978).          Quercus pubescens), the Mediterranean north, which contain
Further information on each of these fire-weather variables        holm-oak- and cork-oak-dominated vegetation (Quercus ilex,
and how they relate to wildfire activity can be found in the       Quercus suber, Pinus sp.) and the Mediterranean south, a
literature.                                                        low-elevation area (Fig. 1a) spanning the Rhône delta. The
   Additionally, we used a series of fast- and slow-reacting       spatial extent of each region allows for the pooling of a de-
drought indices to detect flash and chronic droughts that are      cent number of MODIS wildfires needed to develop robust
often associated with large wildfires. These indices include       models. We however acknowledge the existence of subre-
potential evapotranspiration (PET) based on the Penman–            gional variations in human factors (e.g., ignition and suppres-
Monteith equation, the effective drought index (EDI) (Byun         sion) and that other biogeographic units with homogeneous
and Wilhite, 1999), here integrating precipitation over the        attributes with respect to wildfire regime and climatic condi-
last 30 days to detect a short-term precipitation deficit, and     tions may yield different results (Fréjaville and Curt, 2015).
the standardized precipitation index (SPI) based on a non-

www.nat-hazards-earth-syst-sci.net/19/441/2019/                             Nat. Hazards Earth Syst. Sci., 19, 441–454, 2019
444                              R. Barbero et al.: Simulating the effects of weather and climate on large wildfires in France

Figure 1. (a) Orography in France. The red contour shows the outlines of the investigated French region. (b) Environmental stratification
based on climate data, data on the ocean influence and geographical position (Metzger et al., 2005; Jongman et al., 2006). Abbreviations
are NTH – north (Atlantic central in Metzger et al., 2005), ALP – Alpine, WST – west (Lusitanean in Metzger et al., 2005), MDM –
Mediterranean mountains, MDN – Mediterranean north, and MDS – Mediterranean south.

Table 2. This table provides, for each environmental region, the number of wildfires, the number of large wildfires (> 100 ha), the contribution
of large wildfires to regional burned area and the contribution of large wildfires to national burned area.

        Environment region          No. wildfires    No. large wildfires    Contribution to regional BA        Contribution to national BA
        North                                  49                      6                         61.8 %                             1.9 %
        Alpine                                 41                      8                         69.1 %                             2.3 %
        West                                  101                     19                         63.6 %                             5.4 %
        Mediterranean mountains               289                     51                         83.9 %                            34.8 %
        Mediterranean north                   309                     59                         75.9 %                            25.7 %
        Mediterranean south                   105                     13                         72.4 %                             7.1 %

2.4     The modeling framework                                                We used generalized linear models (GLMs) with a step-
                                                                           wise regression using all predictors listed in Table 1. GLMs
2.4.1    Generalized linear models                                         have already been used to simulate the occurrences of large
                                                                           wildfires in other regions of the world (Stavros et al., 2014a,
Empirical models linking weather and climate to wildfires                  b; Barbero et al., 2014, 2015b) given their ability to model
have received much attention in the climate change context                 the relationship between a dichotomous variable (presence
(Riley and Thompson, 2017) and multiple model specifica-                   or absence of large wildfires) and a set of predictor variables.
tions have been introduced in the literature to simulate wild-             For each day of the MODIS period (2001–2016) and each
fire activity (Boulanger et al., 2018). We sought here to de-              cell of the 8 km grid, the binomial predictand (y) was coded
velop separate models for each environmental region to sim-                as 1 if a large wildfire was observed, and 0 otherwise. This
ulate the probability of a large wildfire (given an ignition)              binary response is modeled as the probability (P ) of observ-
at 8 km spatial and daily resolutions, based purely on the                 ing a large wildfire via a logistic model with a logit link such
weather-to-climate forcing. Simulating the day-to-day vari-                as
ability has the advantage of detecting short-duration syn-
optic conditions, otherwise masked in monthly or seasonal                                     exp(β 0 x)
                                                                           P (y = 1|x) =                   ,
timescales.                                                                                 1 + exp(β 0 x)

Nat. Hazards Earth Syst. Sci., 19, 441–454, 2019                                    www.nat-hazards-earth-syst-sci.net/19/441/2019/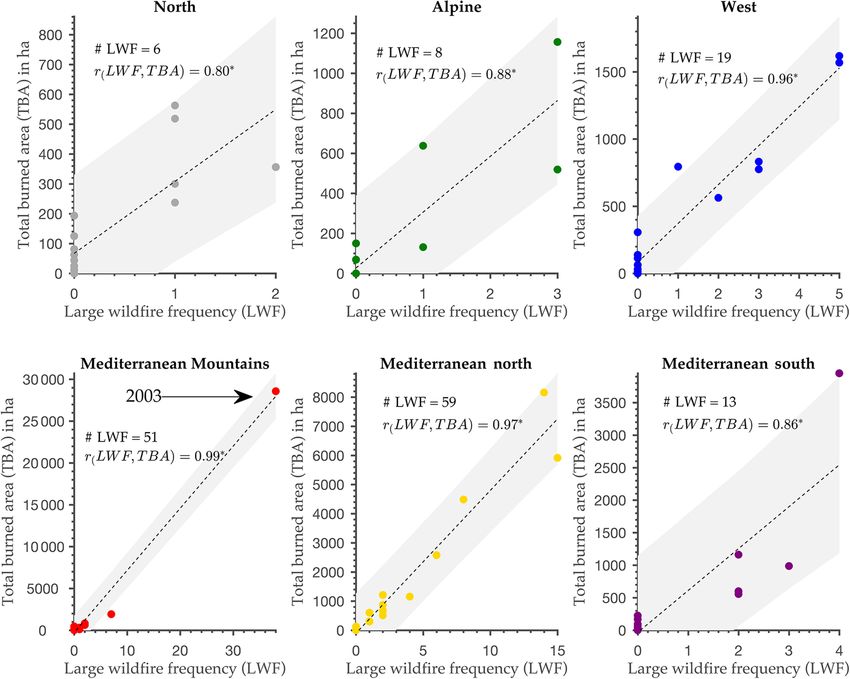
R. Barbero et al.: Simulating the effects of weather and climate on large wildfires in France                                      445

where β 0 = (β0 , β1 , . . .βp ) is a vector of coefficients relating   probabilities in a given region reflects the total number of
the probability of wildfires to p covariates via the relation-          large wildfires observed.
ship β 0 x = β0 +β1 x1 +. . .+βp xp . P is intrinsically bounded           Receiver-operating characteristic (ROC) plots was used to
in the interval [0,1]. We considered each observation of the            evaluate the model performance, as ROC statistics provide
predictor variables as independent samples despite the inher-           information for a range of possible threshold values to clas-
ent spatial autocorrelation and serial correlation. This vio-           sify a grid cell on a specific day as “prone to large wildfire”
lates the assumption of independence between samples and                and rapidly gives an overall idea of model skill. The ROC
overestimates the number of degrees of freedom. However,                curve shows the false-positive rate vs. the true-positive rate
these effects are mitigated with the use of a random sam-               and the area under the ROC curve ranges from 0.5 (random
pling design in model development (see below), although it is           prediction) to 1.0 (perfect prediction). Also, we examined
not intended to completely remove the true spatial autocorre-           simulated probabilities expressed as anomalies with respect
lation. Predictor variables that did not significantly improve          to the mean annual cycle both 80 days prior to and 80 days
the model were discarded from stepwise model selection pro-             following observed large-wildfire days at the 8 km grid cell
cedure using the Bayesian information criterion (BIC) since             level. This allows us to determine whether simulated proba-
the penalty for additional parameters is higher in BIC than             bilities on large-wildfire days were locally higher than what
in Akaike information criterion (AIC), consequently favor-              we would expect from the seasonal forcing alone and how
ing more parsimonious models (Murtaugh, 2009). Also, we                 fast these large-wildfire-prone conditions develop.
did not allow interactive and nonlinear terms in logistic equa-
tions.
                                                                        3     Results and discussion
2.4.2   Model selection uncertainty
                                                                        3.1    Large-wildfire contribution to total burned area
While a model may be developed using all 8 km grid                      In each region, the annual frequency of large wildfires
cells available through the period and the region, numer-               strongly shaped interannual variations in annual burned area
ous caveats arise that limit the model robustness, particularly         (Fig. 2), with an overall contribution in total burned area
given the huge imbalance between 0 (absence) and 1 (pres-               from 2001 to 2016, ranging from 62 % (north) to 84 %
ence). Selecting the “best” approximating model from one                (Mediterranean mountains) (Table 2). Large wildfires in the
single sample would raise the following question: would the             Mediterranean north and Mediterranean mountains were the
same model be selected with another sample? The model se-               strongest contributors to national total burned area (Table 2).
lection uncertainty is of primary importance (Burnham and               Note that the Mediterranean mountain region has experi-
Anderson, 2002), especially when competing models exist to              enced a dramatic increase in large wildfires and annual
describe the unknown state of the complex climate–wildfire              burned area in response to the 2003 heatwave. It is thus read-
relationship (Podschwit et al., 2018). The use of replications          ily apparent that a few large wildfires are responsible for the
in logistic regressions allows avoiding instability in the re-          majority of the burned area and that a better understanding
sults due to sampling bias and helps reduce structural uncer-           of drivers and processes of these specific events is of utmost
tainty. We used resampling methods combining the strength               importance.
of probabilistic and statistical methods (Guns and Vanacker,
2012) to assess model stability and to achieve a proper                 3.2    Model selection and regional variability
tradeoff between bias and variance (Burnham and Anderson,
2002). To do this, we conducted a case control experiment               Most models showed high skill (Fig. 3). The area under the
(Keating and Cherry, 2004) and generated 1000 bootstrap                 curve (AUC) was the highest for the Mediterranean north,
samples to estimate model selection frequencies (πi ). Each             which is also the region with the largest sample of large wild-
sample includes all large-wildfire occurrences (1) as well as           fires, while the Mediterranean south model had the lowest
50 000 randomly chosen nonoccurrences (0). Each of the re-              predictive power. In this region, a true-positive rate hardly
sampled data corresponds to a specific grid cell on a specific          exceeding 0.8 was associated with a false-negative rate ex-
day. The maximum likelihood theory provides estimates of                ceeding 0.7, indicating that large wildfires in that region are
the parameters β 0 and the BIC-best model is found for each             less related to the weather-to-climate forcing.
bootstrap sample. Finally, the model selection relative fre-               Table 3 shows the best model selected in each environ-
quencies (πi ) are computed as the sums of the frequencies              mental region alongside the relative model selection frequen-
where model i was selected as the best, divided by the total            cies (πi ) from applying BIC to each of the 1000 bootstrap
number of bootstraps. We used the model with the highest                samples. In five out of the six regions, models were se-
πi from these bootstraps in subsequent modeling as we con-              lected as the best in > 90 % of the simulations. However, the
sidered this model to represent the most stable relationships           Mediterranean mountains model had much lower selection
in a given region. Note that the simulated probabilities were           frequencies (36 %). Note that a lower frequency of selection
derived using all data available so that the sum of simulated           does not mean that the model has a lower skill, but rather

www.nat-hazards-earth-syst-sci.net/19/441/2019/                                    Nat. Hazards Earth Syst. Sci., 19, 441–454, 2019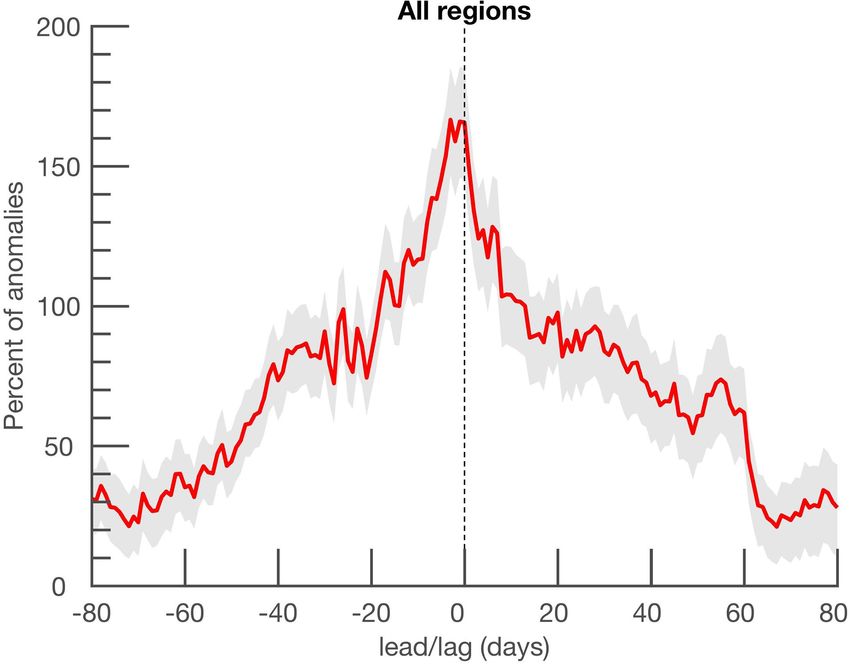
446                             R. Barbero et al.: Simulating the effects of weather and climate on large wildfires in France

Figure 2. Interannual relationships between the annual frequency of large wildfires (> 100 ha) and the total annual burned area. The total
number of large wildfires as well as Pearson correlations are indicated for each region. The symbol ∗ indicates significant correlations at the
95 % confidence level. The linear fitting and the 95 % confidence intervals are also shown.

Table 3. Equations describing daily large-wildfire (> 100 ha) probabilities at 8 km for each environmental region. The second column indi-
cates the number of large wildfires observed from 2001 to 2016. The third column gives the β 0 x parameters and the last column indicates the
model selection frequencies, i.e., the percent of bootstraps for which there was agreement.

                                                              exp(β 0 x)
         Environment region           No. large wildfires    1+exp(β 0 x)                                               Bootstrap πi

         North                                          6    β 0 x = −20.674 + FFMC × 0.0767                                     100
         Alpine                                         8    β 0 x = −14.828 + SPI × (−1.9868)                                    98
         West                                          19    β 0 x = −16.242 + DC × 0.0054                                       100
         Mediterranean mountains                       51    β 0 x = −9.3825 + DMC × 0.0165 + SWI × (−7.4097)                     36
         Mediterranean north                           59    β 0 x = −8.7438 + FWI × 0.067 + SWI × (−13.036)                      92
         Mediterranean south                           13    β 0 x = −11.932 + DMC × 0.0183                                      100

that other combinations of predictors are possible. The ta-                 ranean regions, where FFMC quickly saturates in early sum-
ble also shows the different predictor variables selected in                mer due to overall low soil moisture conditions, this index
the stepwise procedure and indicates how the weather-to-                    seems to be useful for tracking large-wildfire potential in
climate forcing can affect large wildfires very differently de-             more humid climates where fine fuels dominate. By contrast,
pending on what kinds of environmental conditions predom-                   the best models for Alpine and western regions are based
inate, as already shown in previous works across the USA                    on slow-reacting indices (SPI for the Alpine region and DC
(Stavros et al., 2014a; Barbero et al., 2014; Podschwit et al.,             for the western region), both reflecting chronic soil moisture
2018). Table A1 in Appendix A provides the typical range of                 deficit and low fuel moisture levels (Dupire et al., 2017). This
each explanatory variable on days with large wildfires. In the              suggests that large wildfires in these more humid and more
north, the best model uses only FFMC, an index reflecting the               flammability-limited systems are mainly enabled by slow-
flammability of litter and fine fuels. As opposed to Mediter-               evolving drought. The picture is slightly more complex in

Nat. Hazards Earth Syst. Sci., 19, 441–454, 2019                                     www.nat-hazards-earth-syst-sci.net/19/441/2019/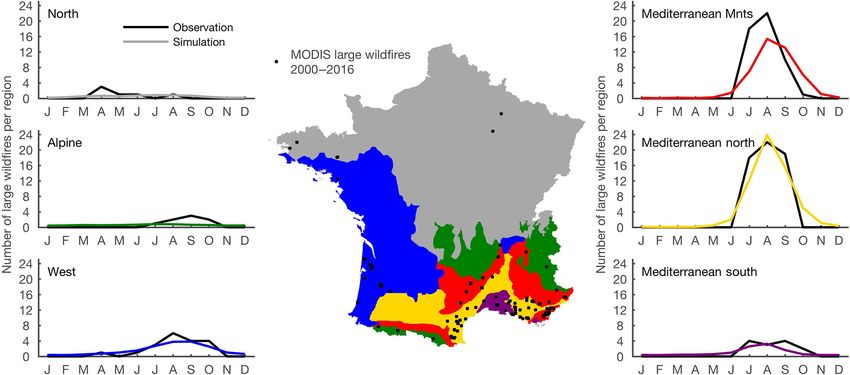
R. Barbero et al.: Simulating the effects of weather and climate on large wildfires in France                                    447

                                                                    Table 4. Spearman rank correlations between large wildfires (>
                                                                    100 ha) observed and that expected from simulated probabilities
                                                                    at the monthly (second column) and interannual (third column)
                                                                    timescales. The symbol ∗ indicates significant correlation at the
                                                                    95 % confidence level.

                                                                          Environment region          Monthly      Interannual
                                                                                                      variations   variations
                                                                          North                       0.56         0.45
                                                                          Alpine                      0.58∗        0.23
                                                                          West                        0.73∗        0.58∗
                                                                          Mediterranean mountains     0.68∗        0.45
                                                                          Mediterranean north         0.73∗        0.65∗
                                                                          Mediterranean south         0.67∗        0.22

                                                                    spring and in September in the north and Alpine regions re-
                                                                    spectively, a feature that is not reproduced in the model ei-
Figure 3. Area under the curve (AUC) illustrating the performance   ther due to sample size limitations or other human factors
of each model. Mnts stands for mountains.                           not included in the models. Figure 5 shows the spatiotempo-
                                                                    ral patterns of mean daily simulated probabilities from May
both the Mediterranean mountains and Mediterranean north.           to October. The potential for large wildfires emerges in the
For instance, the best model in the Mediterranean north com-        Mediterranean south first and then propagates northwards
bines the information provided by the FWI (fire-weather met-        into the Mediterranean mountains and along the west coast
ric) with the SWI (soil moisture content metric). In fact, a        before slowly decaying in October. An animation of daily
strong decrease in the SWI in summer, corresponding to a            simulated probabilities from 2001 to 2016 is available in the
reduction in plant-available soil moisture level, accelerates       Supplement (VideoS1.mov).
the desiccation and may lead to vegetation mortality (Barbu            Models were also able to simulate, to some extent, inter-
et al., 2011), which in turn facilitates wildfire spread. Be-       annual variations in large wildfires (Fig. 6 and Table 4), in-
sides, an increase in the FWI, which also integrates the ex-        cluding the exceptional 2003 outbreak in the Mediterranean
pected rate of spread in response to wind speed, once again         mountains. As expected, interannual variance in simulated
underlines the strong role of wind speed in wildfire spread         probabilities was much lower than that of large wildfires ob-
in the Mediterranean north. In other words, large wildfires         served (Fig. 6) due to the continuous nature of probabilities
occur when multiple conditions are gathered, namely high            (in contrast to the strongly intermittent nature of large wild-
winds, dry fuel and low soil moisture levels. This illustrates      fire), thereby underestimating (overestimating) the probabil-
how complementary fire-weather and soil moisture indices            ity of very likely (unlikely) events and resulting in a variance
are, and how they may, collectively, improve the ability to         deflation.
track the potential for large wildfires.
   It is noteworthy that the effect of wind speed on large wild-    3.4   Local simulated probabilities
fires is only revealed through the FWI in the Mediterranean
north. The absence of wind speed as a significant factor in         Figure 7 shows simulated probabilities expressed as anoma-
other regions may arise due to the temperature decrease as-         lies with respect to the mean local seasonal cycle during a
sociated with wind spells in the French Mediterranean (Ruf-         period spanning 80 days before to 80 days after large wild-
fault et al., 2017), with contrasting effects on commonly used      fires pooled over the entire country. It is readily apparent that
fire-weather indices that were designed to increase with tem-       simulated probabilities progressively increased until the days
perature. This may also indicate the stronger role of fuel          with large wildfire, reaching values 2–3 times higher than
moisture in these regions in response to slower climatic vari-      normal and then slowly decaying towards normal conditions.
ations, regardless of what short-term fire weather does.            This temporal pattern was, however, variable across environ-
                                                                    mental regions (Fig. 8) depending on the predictor variables
3.3   Seasonal and interannual variability in observed              selected (Table 2). In fact, the slowly increasing probabilities
      and simulated large wildfires                                 evident in the Alpine region and the Mediterranean moun-
                                                                    tains mimic the slow variations of the SPI and the SWI, re-
The mean seasonal cycle, featuring a peak in August in most         spectively, and align with global change-type drought (Bres-
regions, is well reproduced in the simulations (Fig. 4 and Ta-      hears et al., 2005; Ruffault et al., 2018). By contrast, faster-
ble 4). However, some large wildfires were also seen in the         increasing probabilities in the Mediterranean north on days

www.nat-hazards-earth-syst-sci.net/19/441/2019/                              Nat. Hazards Earth Syst. Sci., 19, 441–454, 2019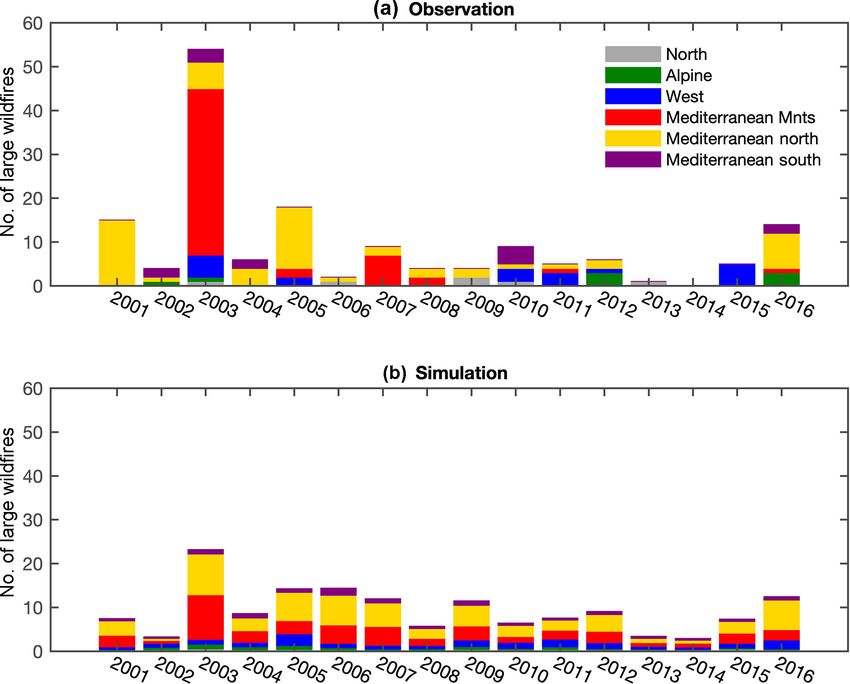
448                           R. Barbero et al.: Simulating the effects of weather and climate on large wildfires in France

Figure 4. Observed (black) and simulated (color) total number of large wildfires (> 100 ha) per month in each environmental region. The
middle panel shows the location of large wildfires during the April–October season from 2001 to 2016. Mnts is mountains.

Figure 5. Daily large-wildfire (> 100 ha) probabilities across months averaged from 2001 to 2016. Note the highly nonlinear color bar
(probabilities in the highest class are > 582 times higher than those in the first class).

Nat. Hazards Earth Syst. Sci., 19, 441–454, 2019                               www.nat-hazards-earth-syst-sci.net/19/441/2019/
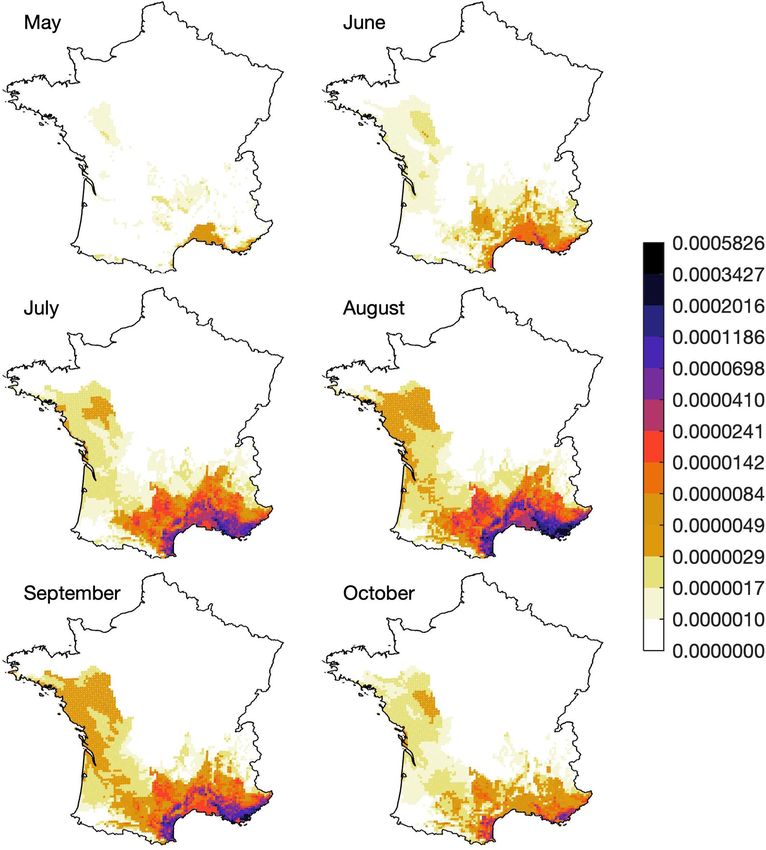
R. Barbero et al.: Simulating the effects of weather and climate on large wildfires in France                                           449

Figure 6. Observed (a) and simulated (b) total number of large wildfires (> 100 ha) per year in each environmental region. Mnts is mountains.

with large wildfires reflect the role of short-term fire-weather
conditions, again highlighting different generating mecha-
nisms across the regions.

3.5   Potential applications and limitations

This modeling framework has multiple potential applica-
tions. First, it could be implemented in a real-time fashion
using meteorological forecasts. This may complement tradi-
tional forecasts based on FWI only. Indeed, the FWI only
measures the potential intensity of wildfire and this quantity
is not always straightforward in the real world. In this regard,
our model translates a series of fire-weather and drought in-
dices into a probability of the occurrence of large wildfires
that could be useful in decision-making. Second, our model
may serve as a basis on which to simulate future changes
to large wildfires based on future climate projections from
the EURO-Cordex project. Such projections will help better
understand future changes and will provide the information               Figure 7. Composites of local simulated probabilities (expressed as
decision makers need for successful adaptation to climate                percent with respect to the mean seasonal cycle, i.e., 100 % indi-
change.                                                                  cates that probabilities are two times higher than normal) relative
   However, several caveats and well-known limitations ap-               to the large-wildfire (> 100 ha) days. The 95 % confidence inter-
ply to our modeling framework. First, our model is based                 vals of the composite means are computed using 1000 bootstrapped
purely on weather and climate and ignores human activi-                  datasets. The envelope of confidence indicates the 2.5 and 97.5 per-
ties (ignition or suppression). Indeed, drought is one com-              centiles of the composite means obtained from the bootstrapped
ponent of a complicated wildfire system (Littell, 2018) and              datasets.
our modeling framework is obviously contingent on ignition
and fuels. Although human activities add a less understood

www.nat-hazards-earth-syst-sci.net/19/441/2019/                                    Nat. Hazards Earth Syst. Sci., 19, 441–454, 2019
450                             R. Barbero et al.: Simulating the effects of weather and climate on large wildfires in France

Figure 8. Same as Fig. 7 but for specific regions. Note the different ranges on the y axis. Mnts is mountains.

and therefore less predictable component (Littell, 2018), in-            4    Conclusions
cluding human factors (Costafreda-Aumedes et al., 2017). as
well as causes of wildfire ignition (Ganteaume and Guerra,               This study provides a statistical modeling framework of large
2018) may improve model skill. All these factors should be               wildfires from the weather-to-climate forcing. The model
considered in the more complex context of risk assessment.               simulates the daily probability of large wildfires onto an 8 km
Second, the environmental stratification used here (Metzger              grid across the country. The best explanatory variables differ
et al., 2005) has proven useful to aggregate large wildfires             from one region to another, indicating that the atmosphere–
and develop different models (and should be considered in                large-wildfire coupling is strongly mediated by environmen-
future pan-European climate–wildfire modeling efforts) but               tal conditions. Long-term drought was found to be a signifi-
we acknowledge that this stratification is likely, as is any             cant predictor of large wildfires in flammability-limited sys-
other stratification, to mix up large wildfires with different           tems such as the Alpine and southwestern regions. In the
human causes and different climate drivers. Third, informa-              Mediterranean, large wildfires were found to be associated
tion on fuel connectivity could also improve model skill and             with both short-term fire-weather conditions and longer-term
help target the regions at risk. A recent study has shown that           soil moisture deficits, collectively facilitating the occurrence
wildfire spread in the French Mediterranean is severely lim-             of large wildfires. In this regard, the SWI based on soil char-
ited by fuel connectivity in some regions (Ganteaume and                 acteristics and reflecting the soil moisture available for the
Barbero, 2018). Finally, developing a statistical model with             plant appears to be a useful metric for tracking large wildfires
a very limited number of large wildfires is a major limita-              and may complement traditional fire-weather indices. This
tion in some regions. This limitation is obviously inherent              modeling framework once again highlights the strong con-
to the modeling of extreme events and was partly overcome                trol that atmospheric variability exerts over the occurrence of
with the use of a resampling approach. Nonetheless, a longer             large wildfires across a range of timescales.
record of wildfires would certainly allow for the stabilization
of the equations.
                                                                         Data availability. The Safran database was provided by Météo-
                                                                         France and is available upon request. The Fire_cci v5.0 product can
                                                                         be accessed at https://geogra.uah.es/fire_cci/ (last access: 28 Febru-
                                                                         ary 2019; Chuvieco et al., 2016).

Nat. Hazards Earth Syst. Sci., 19, 441–454, 2019                                   www.nat-hazards-earth-syst-sci.net/19/441/2019/
R. Barbero et al.: Simulating the effects of weather and climate on large wildfires in France 451
Appendix A
Table A1. Typical range of explanatory variables on a day with large wildfires. The range indicates the 2.5 and 97.5 percentiles (95 %
confidence interval) of the composite means obtained from 1000 bootstrapped datasets.
Environment region Predictor 1 (95 % CI) Predictor 2 (95 % CI)
North FFMC (76.7; 82.5)
Alpine SPI (−2.0; −1.1)
West DC (661.6; 767.4)
Mediterranean mountains DMC (86.1; 108.9) SWI (0.14; 0.18)
Mediterranean north FWI (26.9; 30.9) SWI (0.12; 0.14)
Mediterranean south DMC (77.2; 131.2)
www.nat-hazards-earth-syst-sci.net/19/441/2019/ Nat. Hazards Earth Syst. Sci., 19, 441–454, 2019452 R. Barbero et al.: Simulating the effects of weather and climate on large wildfires in France
Supplement. The supplement related to this article is available geosciences, 8, 1971–1986, https://doi.org/10.5194/bg-8-1971-
online at: https://doi.org/10.5194/nhess-19-441-2019-supplement. 2011, 2011.
Boulanger, Y., Parisien, M.-A., and Wang, X.: Model-specification
uncertainty in future area burned by wildfires in Canada, Int. J.
Author contributions. RB carried out the analysis and wrote the pa- Wildland Fire, 27, 164–175, https://doi.org/10.1071/WF17123,
per. TC, AG, EM, MJ, and AB contributed to the design of the 2018.
methodology. All authors discussed the results and contributed to Breshears, D. D., Cobb, N. S., Rich, P. M., Price, K. P., Allen,
writing the paper. C. D., Balice, R. G., Romme, W. H., Kastens, J. H., Floyd,
M. L., Belnap, J., Anderson, J. J., Myers, O. B., and Meyer,
C. W.: Regional vegetation die-off in response to global-change-
Competing interests. The authors declare that they have no conflict type drought, P. Natl. Acad. Sci. USA, 102, 15144–15148,
of interest. https://doi.org/10.1073/pnas.0505734102, 2005.
Burnham, K. P. and Anderson, D. R.: Model Selection and Mul-
timodel Inference: a Practical Information-Theoretic Approach,
2nd Edn., Springer-Verlag, New York, 2002.
Special issue statement. This article is part of the special issue
Byun, H. R. and Wilhite, D. A.: Objective quan-
“Spatial and temporal patterns of wildfires: models, theory, and re-
tification of drought severity and duration, J. Cli-
ality”. It is a result of the conference EGU 2017, Vienna, Austria,
mate, 12, 2747–2756, https://doi.org/10.1175/1520-
23–28 April 2017.
0442(1999)0122.0.CO;2, 1999.
Chuvieco, E., Yue, C., Heil, A., Mouillot, F., Alonso-Canas,
I., Padilla, M., Pereira, J. M., Oom, D., and Tansey, K.:
Acknowledgements. The authors appreciate the constructive A new global burned area product for climate assess-
reviews by Dennis Fox and an anonymous reviewer who helped ment of fire impacts, Global Ecol. Biogeogr., 25, 619–629,
improve the quality of this manuscript. https://doi.org/10.1111/geb.12440, 2016 (data available at: https:
//geogra.uah.es/fire_cci/, last access: 28 February 2019).
Edited by: Mário Pereira Costafreda-Aumedes, S., Comas, C., and Vega-Garcia, C.: Human-
Reviewed by: Dennis Fox and one anonymous referee caused fire occurrence modelling in perspective: A review, Int. J.
Wildland Fire, 26, 983–998, https://doi.org/10.1071/WF17026,
2017.
Cramer, W., Guiot, J., Fader, M., Garrabou, J., Gattuso, J.-P., Igle-
sias, A., Lange, M. A., Lionello, P., Llasat, M. C., Paz, S., Peñue-
References las, J., Snoussi, M., Toreti, A., Tsimplis, M. N., and Xoplaki, E.:
Climate change and interconnected risks to sustainable develop-
Abadie, J., Dupouey, J.-L., Avon, C., Rochel, X., Tatoni, T., ment in the Mediterranean, Nature Climate Change, 8, 972–980,
and Bergès, L.: Forest recovery since 1860 in a Mediter- https://doi.org/10.1038/s41558-018-0299-2, 2018.
ranean region: drivers and implications for land use and Curt, T. and Frejaville, T.: Wildfire Policy in Mediterranean France:
land cover spatial distribution, Landscape Ecol., 33, 289–305, How Far is it Efficient and Sustainable?, Risk Analysis, 38, 472–
https://doi.org/10.1007/s10980-017-0601-0, 2017. 488, https://doi.org/10.1111/risa.12855, 2017.
Abatzoglou, J. T., Williams, A. P., and Barbero, R.: Curt, T., Fréjaville, T., and Lahaye, S.: Modelling the spatial pat-
Global emergence of anthropogenic climate change in terns of ignition causes and fire regime features in southern
fire weather indices, Geophys. Res. Lett., 46, 326–336, France: Implications for fire prevention policy, Int. J. Wildland
https://doi.org/10.1029/2018GL080959, 2018. Fire, 25, 785–796, https://doi.org/10.1071/WF15205, 2016.
Alonso-Canas, I. and Chuvieco, E.: Global burned area mapping Dimitrakopoulos, A. P., Bemmerzouk, A. M., and Mitsopoulos,
from ENVISAT-MERIS and MODIS active fire data, Remote I. D.: Evaluation of the Canadian fire weather index system in
Sens. Environ., https://doi.org/10.1016/j.rse.2015.03.011, 2015. an eastern Mediterranean environment, Meteorol. Appl., 18, 83–
Barbero, R., Abatzoglou, J., Steel, E., and Larkin, N.: Modeling 93, https://doi.org/10.1002/met.214, 2011.
very large-fire occurrences over the continental United States Dowdy, A. J., Mills, G. A., Finkele, K., and de Groot, W.: Index
from weather and climate forcing, Environ. Res. Lett., 9, 124009, sensitivity analysis applied to the Canadian Forest Fire Weather
https://doi.org/10.1088/1748-9326/9/12/124009, 2014. Index and the McArthur Forest Fire Danger Index, Meteorol.
Barbero, R., Abatzoglou, J., Kolden, C., Hegewisch, K., Larkin, N., Appl., 17, 298–312, https://doi.org/10.1002/met.170, 2010.
and Podschwit, H.: Multi-scalar influence of weather and climate Dupire, S., Curt, T., and Bigot, S.: Spatio-temporal trends in fire
on very large-fires in the Eastern United States, Int. J. Climatol., weather in the French Alps, Sci. Total Environ., 595, 801–817,
35, 2180–2186, https://doi.org/10.1002/joc.4090, 2015a. https://doi.org/10.1016/j.scitotenv.2017.04.027, 2017.
Barbero, R., Abatzoglou, J., Larkin, N., Kolden, C., and Stocks, B.: Farahmand, A. and AghaKouchak, A.: A generalized
Climate change presents increased potential for very large fires in framework for deriving nonparametric standardized
the contiguous United States, Int. J. Wildland Fire, 24, 892–899, drought indicators, Adv. Water Resour., 76, 140–145,
https://doi.org/10.1071/WF15083, 2015b. https://doi.org/10.1016/j.advwatres.2014.11.012, 2015.
Barbu, A. L., Calvet, J.-C., Mahfouf, J.-F., Albergel, C., and Lafont, Fox, D., Carrega, P., Ren, Y., Caillouet, P., Bouillon, C., and Robert,
S.: Assimilation of Soil Wetness Index and Leaf Area Index into S.: How wildfire risk is related to urban planning and Fire
the ISBA-A-gs land surface model: grassland case study, Bio-
Nat. Hazards Earth Syst. Sci., 19, 441–454, 2019 www.nat-hazards-earth-syst-sci.net/19/441/2019/R. Barbero et al.: Simulating the effects of weather and climate on large wildfires in France 453 Weather Index in SE France (1990–2013), Sci. Total Environ., Lampin-Maillet, C., Long-Fournel, M., Ganteaume, A., Jappiot, 621, 120–129, https://doi.org/10.1016/j.scitotenv.2017.11.174, M., and Ferrier, J. P.: Land cover analysis in wildland- 2018. urban interfaces according to wildfire risk: A case study in Fréjaville, T. and Curt, T.: Spatiotemporal patterns of changes in fire the South of France, Forest Ecol. Manag., 261, 2200–2213, regime and climate: defining the pyroclimates of south-eastern https://doi.org/10.1016/j.foreco.2010.11.022, 2011. France (Mediterranean Basin), Climatic Change, 129, 239–251, Littell, J. S.: Drought and Fire in the Western USA: Is Cli- https://doi.org/10.1007/s10584-015-1332-3, 2015. mate Attribution Enough?, Current Climate Change Reports, 1– Fréjaville, T. and Curt, T.: Seasonal changes in the human alteration 11, https://doi.org/10.1007/s40641-018-0109-y, Springer Inter- of fire regimes beyond the climate forcing, Environ. Res. Lett., national Publishing, 2018. 12, 035006, https://doi.org/10.1088/1748-9326/aa5d23, 2017. Metzger, M. J., Bunce, R. G., Jongman, R. H., Mücher, C. A., Frejaville, T., Curt, T., and Carcaillet, C.: Bark flammability as a and Watkins, J. W.: A climatic stratification of the envi- fire-response trait for subalpine trees, Front. Plant Sci., 4, 466, ronment of Europe, Global Ecol. Biogeogr., 14, 549–563, https://doi.org/10.3389/fpls.2013.00466, 2013. https://doi.org/10.1111/j.1466-822X.2005.00190.x, 2005. Ganteaume, A. and Barbero, R.: Contrasting large fire regimes in Modugno, S., Balzter, H., Cole, B., and Borrelli, P.: Mapping the French Mediterranean, Nat. Hazards Earth Syst. Sci. Dis- regional patterns of large forest fires in WildlandeUrban In- cuss., https://doi.org/10.5194/nhess-2018-263, in review, 2018. terface areas in Europe, J. Environ. Manage., 172, 112–116, Ganteaume, A. and Guerra, F.: Explaining the spatio- https://doi.org/10.1016/j.jenvman.2016.02.013, 2016. seasonal variation of fires by their causes: The case Murtaugh, P. A.: Performance of several variable-selection meth- of southeastern France, Appl. Geogr., 90, 69–81, ods applied to real ecological data, Ecol. Lett., 12, 1061–1068, https://doi.org/10.1016/j.apgeog.2017.11.012, 2018. https://doi.org/10.1111/j.1461-0248.2009.01361.x, 2009. Ganteaume, A. and Jappiot, M.: What causes large fires Nogueira, J., Rambal, S., Barbosa, J., and Mouillot, F.: Spa- in Southern France, Forest Ecol. Manage., 294, 76–85, tial Pattern of the Seasonal Drought/Burned Area Relation- https://doi.org/10.1016/j.foreco.2012.06.055, 2013. ship across Brazilian Biomes: Sensitivity to Drought Metrics Ganteaume, A. and Long-Fournel, M.: Driving factors and Global Remote-Sensing Fire Products, Climate, 5, 42, of fire density can spatially vary at the local scale in https://doi.org/10.3390/cli5020042, 2017. south-eastern France, Int. J. Wildland Fire, 24, 650–664, Noilhan, J. and Mahfouf, J. F.: The ISBA land surface pa- https://doi.org/10.1071/WF13209, 2015. rameterisation scheme, Global Planet. Change, 13, 145–159, Ganteaume, A., Camia, A., Jappiot, M., San-Miguel-Ayanz, J., https://doi.org/10.1016/0921-8181(95)00043-7, 1996. Long-Fournel, M., and Lampin, C.: A review of the main driving Pausas, J. G., Llovet, J., Rodrigo, A., and Vallejo, R.: Are wildfires factors of forest fire ignition over Europe, Environ. Manage., 51, a disaster in the Mediterranean basin? A review, Int. J. Wildand 651–662, https://doi.org/10.1007/s00267-012-9961-z, 2013. Fire, 17, 713–723, https://doi.org/10.1071/WF07151, 2008. Guerreiro, S. B., Dawson, R. J., Kilsby, C., Lewis, E., and Ford, A.: Podschwit, H. R., Larkin, N. K., Steel, E. A., Cullen, A., and Future heat-waves, droughts and floods in 571 European cities, Alvarado, E.: Multi-Model Forecasts of Very-Large Fire Oc- Environ. Res. Lett., 13, 034009, https://doi.org/10.1088/1748- curences during the End of the 21st Century, Climate, 6, 100, 9326/aaaad3, 2018. https://doi.org/10.3390/cli6040100, 2018. Guns, M. and Vanacker, V.: Logistic regression applied to Riley, K. and Thompson, M.: An Uncertainty Analysis of Wildfire natural hazards: rare event logistic regression with repli- Modeling, in: Natural Hazard Uncertainty Assessment: Model- cations, Nat. Hazards Earth Syst. Sci., 12, 1937–1947, ing and Decision Support, Washington, D.C., American Geo- https://doi.org/10.5194/nhess-12-1937-2012, 2012. physical Union, https://doi.org/10.1002/9781119028116.ch13, Hernandez, C., Drobinski, P., and Turquety, S.: How much John Wiley & Sons, Hoboken, New Jersey, 2017. does weather control fire size and intensity in the Ruffault, J. and Mouillot, F.: How a new fire-suppression policy can Mediterranean region?, Ann. Geophys., 33, 931–939, abruptly reshape the fire-weather relationship, Ecosphere, 6, 1– https://doi.org/10.5194/angeo-33-931-2015, 2015a. 19, https://doi.org/10.1890/ES15-00182.1, 2015. Hernandez, C., Keribin, C., Drobinski, P., and Turquety, S.: Statisti- Ruffault, J. and Mouillot, F.: Contribution of human and biophysical cal modelling of wildfire size and intensity: a step toward mete- factors to the spatial distribution of forest fire ignitions and large orological forecasting of summer extreme fire risk, Ann. Geo- wildfires in a French Mediterranean region, Int. J. Wildland Fire, phys., 33, 1495–1506, https://doi.org/10.5194/angeo-33-1495- 26, 498–508, https://doi.org/10.1071/WF16181, 2017. 2015, 2015b. Ruffault, J., Moron, V., Trigo, R. M., and Curt, T.: Objective iden- Jongman, R. H., Bunce, R. G., Metzger, M. J., Mücher, C. A., tification of multiple large fire climatologies: an application to Howard, D. C., and Mateus, V. L.: Objectives and applications a Mediterranean ecosystem, Environ. Res. Lett., 11, 075006, of a statistical environmental stratification of Europe, Landscape https://doi.org/10.1088/1748-9326/11/7/075006, 2016. Ecol., 21, 409–419, https://doi.org/10.1007/s10980-005-6428-0, Ruffault, J., Moron, V., Trigo, R. M., and Curt, T.: Daily synoptic 2006. conditions associated with large fire occurrence in Mediterranean Keating, K. A. and Cherry, S.: Use and Interpretation of Logistic France: evidence for a wind-driven fire regime, Int. J. Climatol., Regression in Habitat-Selection Studies, J. Wildlife Manage., 68, 37, 524–533, https://doi.org/10.1002/joc.4680, 2017. 774–789, 2004. Ruffault, J., Curt, T., Martin-StPaul, N. K., Moron, V., and Trigo, Lahaye, S. A., Curt, T. D., and Fre, T.: What are the drivers of dan- R. M.: Extreme wildfire events are linked to global-change- gerous fires in Mediterranean France ?, Int. J. Wildland Fire, 27, type droughts in the northern Mediterranean, Nat. Hazards Earth 155–163, https://doi.org/10.1071/WF17087, 2017. www.nat-hazards-earth-syst-sci.net/19/441/2019/ Nat. Hazards Earth Syst. Sci., 19, 441–454, 2019
454                              R. Barbero et al.: Simulating the effects of weather and climate on large wildfires in France

   Syst. Sci., 18, 847–856, https://doi.org/10.5194/nhess-18-847-         Vautard, R., Gobiet, A., Jacob, D., Belda, M., Colette, A., Déqué,
   2018, 2018.                                                              M., Fernández, J., García-Díez, M., Goergen, K., Güttler, I.,
Sharples, J. J., McRae, R. H., Weber, R. O., and                            Halenka, T., Karacostas, T., Katragkou, E., Keuler, K., Kot-
   Gill, A. M.: A simple index for assessing fire dan-                      larski, S., Mayer, S., van Meijgaard, E., Nikulin, G., Patarčić,
   ger rating, Environ. Modell. Softw., 24, 764–774,                        M., Scinocca, J., Sobolowski, S., Suklitsch, M., Teichmann, C.,
   https://doi.org/10.1016/j.envsoft.2008.11.004, 2009.                     Warrach-Sagi, K., Wulfmeyer, V., and Yiou, P.: The simulation
Stavros, E. N., Abatzoglou, J., Larkin, N. K., Mckenzie, D., and            of European heat waves from an ensemble of regional climate
   Steel, E. A.: Climate and very large wildland fires in the               models within the EURO-CORDEX project, Clim. Dynam., 41,
   contiguous western USA, Int. J. Wildland Fire, 23, 899–914,              2555–2575, https://doi.org/10.1007/s00382-013-1714-z, 2013.
   https://doi.org/10.1071/WF13169, 2014a.                                Vennetier, M. and Ripert, C.: Forest flora turnover with
Stavros, E. N., Abatzoglou, J. T., McKenzie, D., and Larkin,                climate change in the Mediterranean region: A case
   N. K.: Regional projections of the likelihood of very large              study in Southeastern France, Forest Ecol. Manag.,
   wildland fires under a changing climate in the contigu-                  https://doi.org/10.1016/j.foreco.2009.09.015, 2009.
   ous Western United States, Climatic Change, 126, 455–468,              Vidal, J.-P., Martin, E., Franchistéguy, L., Habets, F., Soubeyroux,
   https://doi.org/10.1007/s10584-014-1229-6, 2014b.                        J.-M., Blanchard, M., and Baillon, M.: Multilevel and multiscale
Tedim, F., Leone, V., Amraoui, M., Bouillon, C., Coughlan, M. R.,           drought reanalysis over France with the Safran-Isba-Modcou hy-
   Delogu, G. M., Fernandes, P. M., Ferreira, C., McCaffrey, S.,            drometeorological suite, Hydrol. Earth Syst. Sci., 14, 459–478,
   McGee, T. K., Parente, J., Paton, D., Pereira, M. G., Ribeiro,           https://doi.org/10.5194/hess-14-459-2010, 2010a.
   L. M., Viegas, D. X., and Xanthopoulos, G.: Defining Extreme           Vidal, J. P., Martin, E., Franchistéguy, L., Baillon, M., and Soubey-
   Wildfire Events: Difficulties, Challenges, and Impacts, Fire, 1, 9,      roux, J. M.: A 50-year high-resolution atmospheric reanalysis
   https://doi.org/10.3390/fire1010009, 2018.                               over France with the Safran system, Int. J. Climatol., 30, 1627–
Turco, M., von Hardenberg, J., AghaKouchak, A., Llasat, M. C.,              1644, https://doi.org/10.1002/joc.2003, 2010b.
   Provenzale, A., and Trigo, R. M.: On the key role of droughts          Vidal, J.-P., Martin, E., Kitova, N., Najac, J., and Soubeyroux, J.-
   in the dynamics of summer fires in Mediterranean Europe,                 M.: Evolution of spatio-temporal drought characteristics: valida-
   Sci. Rep.-UK, 7, 81, https://doi.org/10.1038/s41598-017-00116-           tion, projections and effect of adaptation scenarios, Hydrol. Earth
   9, 2017.                                                                 Syst. Sci., 16, 2935–2955, https://doi.org/10.5194/hess-16-2935-
Turco, M., Jerez, S., Doblas-Reyes, F. J., AghaKouchak, A., Llasat,         2012, 2012.
   M. C., and Provenzale, A.: Skilful forecasting of global fire activ-
   ity using seasonal climate predictions, Nat. Commun., 9, 2718,
   https://doi.org/10.1038/s41467-018-05250-0, 2018.
Van Wagner, C. E.: Development and structure of the Cana-
   dian forest fire weather index system, available at: http:
   //scholar.google.com/scholar?hl=en&btnG=Search&q=intitle:
   Development+and+Structure+of+the+Canadian+Forest+Fire+
   Weather+Index+System#0 (last access: 28 February 2019),
   1987.

Nat. Hazards Earth Syst. Sci., 19, 441–454, 2019                                    www.nat-hazards-earth-syst-sci.net/19/441/2019/
You can also read