Surface display of HFBI and DewA hydrophobins on Saccharomyces cerevisiae modifies tolerance to several adverse conditions and biocatalytic ...
←
→
Page content transcription
If your browser does not render page correctly, please read the page content below
Applied Microbiology and Biotechnology
https://doi.org/10.1007/s00253-021-11090-8

    APPLIED GENETICS AND MOLECULAR BIOTECHNOLOGY

Surface display of HFBI and DewA hydrophobins on Saccharomyces
cerevisiae modifies tolerance to several adverse conditions
and biocatalytic performance
Cecilia Andreu 1 & Javier Gómez-Peinado 2 & Lex Winandy 3 & Reinhard Fischer 3 & Marcel li del Olmo 2

Received: 29 October 2020 / Revised: 14 December 2020 / Accepted: 3 January 2021
# The Author(s), under exclusive licence to Springer-Verlag GmbH, DE part of Springer Nature 2021

Abstract
Hydrophobins are relatively small proteins produced naturally by filamentous fungi with interesting biotechnological and
biomedical applications given their self-assembly capacity, efficient adherence to natural and artificial surfaces, and to introduce
modifications on the hydrophobicity/hydrophilicity of surfaces. In this work we demonstrate the efficient expression on the S.
cerevisiae cell surface of class II HFBI of Trichoderma reesei and class I DewA of Aspergillus nidulans, a hydrophobin not
previously exposed, using the Yeast Surface Display a-agglutinin (Aga1-Aga2) system. We show that the resulting modifications
affect surface properties, and also yeast cells’ resistance to several adverse conditions. The fact that viability of the engineered
strains increases under heat and osmotic stress is particularly interesting. Besides, improved biocatalytic activity toward the
reduction of ketone 1-phenoxypropan-2-one takes place in the reactions carried out at both 30 °C and 40 °C, within a concen-
tration range between 0.65 and 2.5 mg/mL. These results suggest interesting potential applications for hydrophobin-exposing
yeasts.

Key points
• Class I hydrophobin DewA can be efficiently exposed on S. cerevisiae cell surfaces.
• Yeast exposure of HFBI and DewA increases osmotic and heat resistance.
• Engineered strains show modified biocatalytic behavior

Keywords Hydrophobin . HFBI . DewA . Biocatalysis . Stress resistance

                                                                             Introduction

                                                                             Biocatalysis is considered a powerful tool to perform chemical
                                                                             transformations of organic compounds under very mild con-
* Marcel li del Olmo                                                         ditions and with high chemo-, regio-, and stereoselectivity. Its
  m.del.olmo@uv.es                                                           specificity results in the production of a few side products, and
1
                                                                             water is employed as an environmentally friendly solvent (Ni
     Departament de Química Orgànica, Facultat de Farmàcia, Universitat
                                                                             et al. 2014), with minimum waste pollutant production
     de València, Burjassot, València, Spain
2
                                                                             (Crabtree 2009; Heus et al. 2015; Tao and Kazlauskas
     Departament de Bioquímica i Biologia Molecular, Facultat de
                                                                             2011). For all these reasons, biocatalysis has been broadly
     Ciències Biològiques, Universitat de València, Burjassot,
     València, Spain                                                         used as a green alternative to classic chemical methods in
3                                                                            pharmaceutical, agrochemical, and food industries (Andreu
     Department of Microbiology, Karlsruhe Institute of Technology
     (KIT)-South Campus, Fritz-Haber-Weg 4,                                  and Del Olmo 2014; Andreu et al. 2016; Andreu and del
     D-76131 Karlsruhe, Germany                                              Olmo 2018a, 2019, 2020).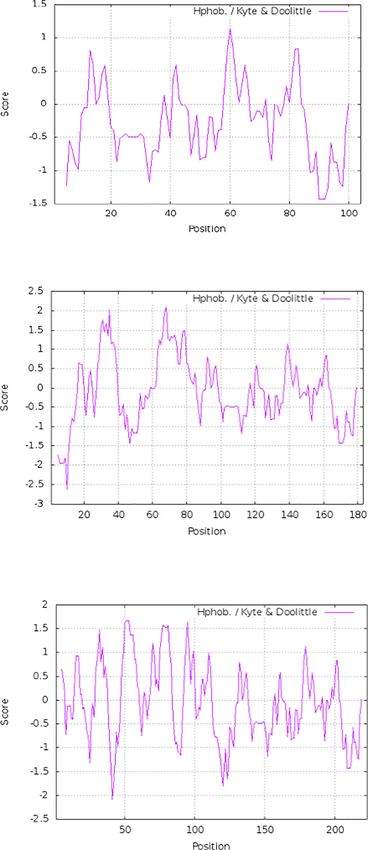
Appl Microbiol Biotechnol

    Whole cells of Saccharomyces cerevisiae have been wide-         glycosylated and can only be dissociated from membranes
ly employed in asymmetric transformations, especially in the        by agents such as formic acid (FA) or trifluoroacetic acid
synthesis of chiral alcohols by bioreduction reactions              (TFA); type II hydrophobins are formed by 50-100 residues
(Bariotaki et al. 2012; Moore et al. 2007; Pscheidt and             and are soluble in ethanol or SDS (Wessels 1997; Wösten
Glieder 2008). Employing whole cells as biocatalysts offers         2001). These molecules have attracted much interest in bio-
several advantages over the use of isolated enzymes: the nat-       technology for their potential applications. In fact, it has been
ural environment in cells increases enzyme stability; no addi-      described that type I hydrophobins in the soluble form are able
tional costs are needed for enzyme isolation and purification;      to stabilize some compounds of medical interest (Zhao et al.
finally, and most importantly, the use of expensive external        2016) and can increase the solubility of organic compounds
cofactors is unnecessary because cells have systems for their       (Valo et al. 2010), properties that have been applied to obtain
own efficient in situ recycling (Kisukuri and Andrade 2015;         pharmaceutical preparations.
Robertson and Steer 2004).                                              Among the hydrophobins described to date, we find the
    Yeast surface display (YSD) technology allows the expres-       hydrophobin of class II HFBI of Trichoderma reesei and that
sion of peptides and proteins of interest in the yeast cell wall    of class I DewA of Aspergillus nidulans. The former is
(for recent reviews see Andreu and del Olmo 2018b; Linciano         expressed at very high levels when that fungus is grown in
et al. 2019; Urbar-Ulloa et al. 2019). It is based on a type of     glucose-containing media (Nakari et al. 1993) and has been
protein characteristic of the most superficial cell wall layer,     genetically and biochemically characterized (Nakari-Setälä
mannoproteins such as Sag1 (AGα1), a-agglutinin (Aga1-              et al. 1996). HFBI has been previously exposed on the surface
Aga2), Fig2, Flo1, Sed1, Spi1, Cwp1/2, Tip1, Tir1, and              of yeast cells by using the YSD methodology to obtain slight-
Pir1/2/3/4. The protein to be exposed on the cell surface is        ly less negatively charged cells with a more apolar cover
associated with one of them, it comes in the form of a fusion       (Nakari-Setälä et al. 2002). There are reports showing that
protein, and its expression can be regulated by different sys-      the co-display of this hydrophobin with the lipase B of
tems. The choice of one or another depends on the yeast spe-        Candida antarctica in Pichia pastoris allows this lipase great-
cies, the required expression level, and the size of the protein    er activity due to the changes introduced in the structure and
to be placed on the cell surface (Andreu and del Olmo 2018b).       the hydrophobic properties of the cell surface (Wang et al.
The widely used a-agglutinin system consists of two subunits        2016; Zhang et al. 2017).
linked through two disulfide bridges: Aga1 is anchored via a            Hydrophobin DewA was identified by Stringer and
GPI to the cell surface, while Aga2 is used to immobilize the       Timberlake (1995). It has been described to be actively
protein of interest on the cell surface (Cappellaro et al. 1994).   expressed in late conidiation stages in A. nidulans
pYD1 and pYD5 are vectors used for YSD with this system             (Grünbacher et al. 2014; Stringer and Timberlake 1995),
(Kieke et al. 1997; Wang et al. 2005); in both, gene fusions are    downregulated in early vegetative growth, and differentially
expressed under the control of the GAL1 gene promoter and           expressed during the isotropic-to-polar growth switch, which
are, hence, induced by galactose. The YSD methodology has           suggests that it may function in isotropic expansion during
allowed different biomedical and biotechnological applica-          both vegetative growth and asexual reproduction
tions to be developed, including biocatalysis (Benjaphokee          (Breakspear and Momany 2007). It has been subsequently
et al. 2012; Boder et al. 2012; Kumar and Kumar 2019; Park          expressed in T. reesei (Schmoll et al. 2010). Some more recent
2020; Perpiñá et al. 2015; Tabañag et al. 2018; Takayama            studies demonstrate its utility for the functionalization of sur-
et al. 2006; Traxlmayr and Shusta 2017; Wasilenko et al.            faces to which it is capable of adhering. In this sense, variants
2010; Wu et al. 2015).                                              of DewA that contain binding sites for integrin receptors, such
    Hydrophobins are relatively small proteins produced natu-       as the Arg-Gly-Asp sequence (RGD) or the globular domain
rally by filamentous fungi, whose properties allow these or-        of laminin LG3, and can present greater adhesion capacity of
ganisms to survive and adapt to the environment (Sammer             mesenchymal stem cells, osteoblasts, fibroblasts, and
et al. 2016; Wessels 1997; Wösten 2001). They show inter-           chondrocytes at no higher risk of bacterial infections may be
esting physicochemical properties, such as surface activity         useful for developing medical implants (Boeuf et al. 2012).
and self-assembly, and can adhere efficiently and stably to         Fokina et al. (2016) have described how biotechnologically
natural and artificial surfaces. With these capacities, they are    relevant enzymes, such as laccases, can be immobilized on
able to convert hydrophobic surfaces into hydrophilic or hy-        particular surfaces by their expression as fusion proteins with
drophilic into hydrophobic (Linder et al. 2005; Wessels 1997).      DewA. These authors thus obtained interesting results for the
Their homology is not great, except they contain many hydro-        LccC protein of A. nidulans in modified hydrophilic
phobic amino acids and eight cysteine residues with con-            polystyrene.
served spacing, which form a total of four disulfide bridges.           Winandy et al. (2018) expressed and purified these two,
Two classes are differentiated: type I hydrophobins, which          and other soluble class I Dew hydrophobins of A. nidulans
contain between 100 and 125 amino acids, can be                     from Escherichia coli to compare their surface binding
Appl Microbiol Biotechnol
properties. These authors demonstrated that all these proteins introduced into the SmaI site of pYD5M (Fig. 1b). The
are efficient in forming glass surface coatings to thereby in- resulting plasmid was named pYD5M-DewA.
crease the hydrophobicity of glass. Besides, they organized a The Gibson Assembly methodology was used to introduce
uniform layer, except for DewE, which formed protein aggre- a second copy of the hydrophobin-coding genes into pYD5M-
gates. The results reported agree with previous studies dem- HFBI and pYD5M-DewA (Gibson et al. 2009). To this end,
onstrating that hydrophobins from a single organism belong- these plasmids were linearized with SmaI and EcoRI, respec-
ing to the same class can exhibit various surface binding char- tively. PCR products hfbI and dewA were generated using
acteristics (van Wetter et al. 2000). Indeed, only DewA pro- oligonucleotides HfbIGibA/B and DewAGibA/B (Table S1
tein layers showed typical class I high resistance to water, in the Supplementary Material), and the procedure described
ethanol, detergent, and temperature treatments, while the in the Gibson Assembly® Cloning Kit (New England Biolabs,
HFBI class II hydrophobin formed less stable layers on glass Ipswich, Massachusetts, USA) was followed with the reagents
surfaces. More recently, this research group also revealed that supplied by the manufacturer. The resulting plasmids were
DewA and HFBI are able to coat and reduce the water absorp- called pYD5M-HFBI-2c and pYD5M-DewA-2c.
tion of different lithotypes, independently of their chemical The introduction of the desired sequences and their loca-
nature and structure. DewA especially generated strong water tion in the frame with the Aga2 coding sequence in the
repellency on all three lithotypes without decreasing the vapor resulting plasmids were confirmed in all cases by sequencing
permeability of stone samples (Winandy et al. 2019). with oligonucleotides AGA2SEQ and SEQPYD5DIR (also
In this work, the cloning of the genes encoding both HFBI described in Table S1 in the Supplementary Material).
and DewA hydrophobins in plasmid pYD5 was carried out to
achieve efficient exposure on the cell surface of the yeast Yeast strains and growth conditions
S. cerevisiae. The properties of the resulting strains were char-
acterized, and their potential application as biocatalysts was All the experiments were carried out with the S. cerevisiae
also evaluated and compared to the unmodified one. EBY100 strain (MATa trp1 leu2Δ1 his3Δ200 pepA:HIS3
prb1D1.6R can1 PGAL-AGA1, Wang et al. 2005) trans-
formed with the above-described pYD5-derived plasmids.
Materials and methods Strains were grown in SC-trp minimal medium (0.17% (w/v)
nitrogen base without amino acids and ammonium sulfate,
Cloning of hydrophobin genes in the pYD5 vector 0.5% (w/v) (NH4)2SO4, 0.2 % (w/v) drop out mix without
Trp), containing 2% (w/v) glucose (Glu) or galactose (Gal)
Genes hfbI and dewA were cloned in pYD5 (Wang et al. as a carbon source. The solid medium also contained 2% (w/
2005). Previously, and in order to increase the versatility of v) agar and 2% glucose as a carbon source. Liquid cultures
this vector for genetic engineering purposes, unique restriction were incubated at 30 °C in an orbital shaker (180 rpm). For
sites for SmaI and NcoI were added close to the recognition site most experiments, an overnight liquid culture was prepared on
for EcoRI by site-directed mutagenesis, using the “QuikChange SC-Trp Glu medium up to an OD600 between 2 and 5; then,
Lightning Site-Directed Mutagenesis Kit” (Stratagene, La Jolla, cells were collected, washed, and transferred to fresh SC-Trp
USA) following a previously described procedure (Andreu and Gal medium, and incubation continued for 24 h.
del Olmo 2013). The employed oligonucleotides are included To carry out the growth kinetic experiments, the cells from
in Table S1 in the Supplementary Material. The resulting plas- the overnight cultures in the SC-Trp containing glucose were
mid was designed by pYD5M (Fig. 1a). transferred to a fresh medium with glucose or galactose at an
For hfbI cloning, the coding region for the mature protein
SmaI – NcoI - EcoRI
was amplified by PCR from plasmid pTNS23 (Nakari-Setälä a Aga2 signal
et al. 2002) using oligonucleotides HFBSMA and HFBECO pepde CCCGGGCCATGGGAATTC V5 epitope
coding
(described in Table S1 in the Supplementary Material) and coding
GGGCCCGGTACCCTTAAG sequence
sequence
introduced between the SmaI and EcoRI sites of pYD5M
(Fig. 1b). pTNS23 was previously isolated from yeast strain
VTT-C-99315 provided by the VTT Technical Research
b HFBI
DewA
Centre (Finland) and propagated through E. coli strain
DH5α (New England Biolabs, Ipswich, Massachusetts, Aga2 V5 (G4S)3 Aga2 coding sequence COOH
NH2 Signal
USA). The resulting plasmid was named pYD5M-HFBI. pepde
epitope linker
For dewA cloning, the coding region was amplified from
Fig. 1 Scheme of the sequence modifications introduced into the pYD5
plasmid pLW58 (Winandy et al. 2018) using oligonucleotides vector (on the gray scale) to generate pYD5M (a) and the protein fusions
DEWAECORVF and DEWAECORVR (Table S1 in the expressed under the control of the GAL1 promoter in pYD5M-HFBI and
Supplementary Material), digested with EcoRV, and pYD5M-DewA (b)Appl Microbiol Biotechnol
OD600 of 0.2, and incubation continued for 2 days at 30 °C. In w ratio 1 : 10 yeast/EtOH), and applied on both “nor-
some experiments, growth was also followed under several mal” hydrophilic glass and silanized hydrophobic glass.
stress conditions (37 °C or 0.5 M NaCl). In these cases, the After complete solvent evaporation, WCA were mea-
initial OD600 after cell transfer from glucose to galactose me- sured with an OCA20 and v3.12.11 of the SCA 202
dium was approximately 0.3, and the stress condition was software (both DataPhysics Instruments GmbH,
applied 6 to 8 h later to allow the expression of the fusion Filderstadt, Germany), as described in Winandy et al.
proteins. Experiments were carried out in triplicate. (2018).
Protein analysis Flocculation assay
Samples were taken from the cultures of the strains considered The flocculation ability of the strains considered in this work
grown in glucose or galactose. Protein extracts were prepared was determined by the method described by Bony et al.
and analyzed by western blotting as described in Perpiñá et al. (1997) and Nayyar et al. (2014). The yeast cells grown in
(2015). Prior to immunodetection, the transfer of proteins to the SC-Trp Gal for 24 h were harvested by centrifugation, washed
nitrocellulose filters was confirmed by staining with 0.1% (w/v) in de-flocculation buffer (50 mM sodium acetate pH
Ponceau S (Sigma, St. Louis, USA) in 5% acetic acid. Anti-V5 4.5, 5 mM EDTA), incubated in this medium for 30
(Invitrogen, San Diego, USA) was employed to detect the pro- min, and washed again (twice in this buffer and twice
teins expressed from plasmid pYD5 using a dilution of 1 : 5000 in double-distilled water). Cells were resuspended at
in PBS, 0.05% (v/v) Tween 20, 5% (w/v) nonfat dry milk. OD600 of 2 in 5 mL of flocculation buffer (50 mM
sodium acetate, 5 mM CaCl2) and placed inside test
Flow cytometry tubes (15 mm diameter, 50 mm height). They were
sealed and left in a shaking incubator at room temper-
The flow cytometry experiments were carried out as described ature and 140 rpm for 30 min. Then, the cell suspension
in Perpiñá et al. (2015) with the samples obtained from the was left undisturbed for 6 min in a vertical position and
cultures of strains after growth under the previously described OD600 was determined by taking the samples just below
conditions. the meniscus. The percentage of flocculated cells was
calculated by subtracting the fraction of cells that remained
Fluorescence microscopy in suspension from the total cell count. Experiments were
carried out 5 times.
To detect Aga2 on the cell surface by fluorescence microsco-
py, cells were prepared in a similar fashion to that used for the Viability determination under several stress
FACS (fluorescence-activated cell sorting) analyses and they conditions
were finally observed under a fluorescence microscopy
Axioskop 2 (Zeiss Inc., Jena, Germany) using the GFP filter. The percentage of viable cells was determined from the cul-
Pictures were taken with a SPOT camera (Diagnostic tures grown for 24 h in SC-Trp medium containing
Instruments Inc., Sterling Heights, USA). galactose as the only carbon source. Five OD600 units
were collected by centrifugation, washed with distilled
Assay of cell surface hydrophobicity water, and resuspended in 1 mL of this solution con-
taining the considered concentration of the reagent to be
The cell surface hydrophobicity analysis done with the strains tested. The analyzed conditions were temperature (37,
herein used was carried out according to the procedures de- 40, 42, and 44 °C), presence of salt (NaCl concentra-
scribed by Wang et al. (2016) and Zhang et al. (2017), in tions between 0.7 and 1.5 M), ethanol (6 to 10%, v/v),
which this parameter is determined from the proportion of acetonitrile (3 to 9%, v/v), dimethylformamide (DMF, 6
the yeast cells passed to an organic phase (constituted by bu- to 25%, v/v), and dimethylsulfoxide (DMSO, 12–30%,
tanol in our case). For these experiments, cells were grown in v/v). Viability was determined by using a trypan blue
SC-Trp medium with galactose as the only carbon source for reagent as previously described (Andreu and del Olmo
24 h after previous growth in Sc-Trp Glu. Experiments were 2019). Experiments were carried out in triplicate.
carried out 5 times. The viability for organic compound phenoxyacetone was
also determined. It was also used to analyze the ability of these
Contact angle determination strains as biocatalysts. In this case, ten OD600 units were
employed instead of five, to work under the same conditions
The yeast cells from 24-h cultures in SC-Trp Gal me- in both experiments. The concentration range was between
dium were freeze-dried, resuspended in 100% EtOH (w/ 0.65 and 5.3 mg/mL.Appl Microbiol Biotechnol
General procedure for biocatalytic processes using surface through the disulfide bridges established between ag-
cell-exposing hydrophobins HFBI and DewA glutinins Aga1 and Aga2.
The western blot shown in Fig. S1 in the Supplementary
The cells from the overnight cultures in SC-Trp Glu were Material demonstrates that both proteins were expressed in the
transferred to a fresh medium containing galactose as the only transformed yeast cells as fusions with V5 epitope-Aga2.
carbon source and incubation at 30 °C continued for another Migration of proteins was affected by their glycosylation,
24-h period. The volume that corresponded to 100 OD600 which resulted in several bands that appeared rather fuzzy.
units from these cultures was centrifuged. Cells were washed Flow cytometry analyses were carried out to determine the
and suspended in 2% galactose prepared in distilled freshwa- level of expression of these fusion proteins on the cell surface.
ter (9 mL) and transferred to a 50-mL Erlenmeyer flask. The The presence of the V5 epitope in the fusion proteins provides
mixture was incubated at 30 °C or 40 °C for 30 min with an accurate determination of the percentage of cells displaying
orbital shaking (180 rpm). Then, 1 mL of a freshly prepared HFBI and DewA in populations after 24 h of growth in a
suspension of phenoxyacetone (1-phenoxypropan-2-one, 1) in minimal medium containing galactose as a carbon source.
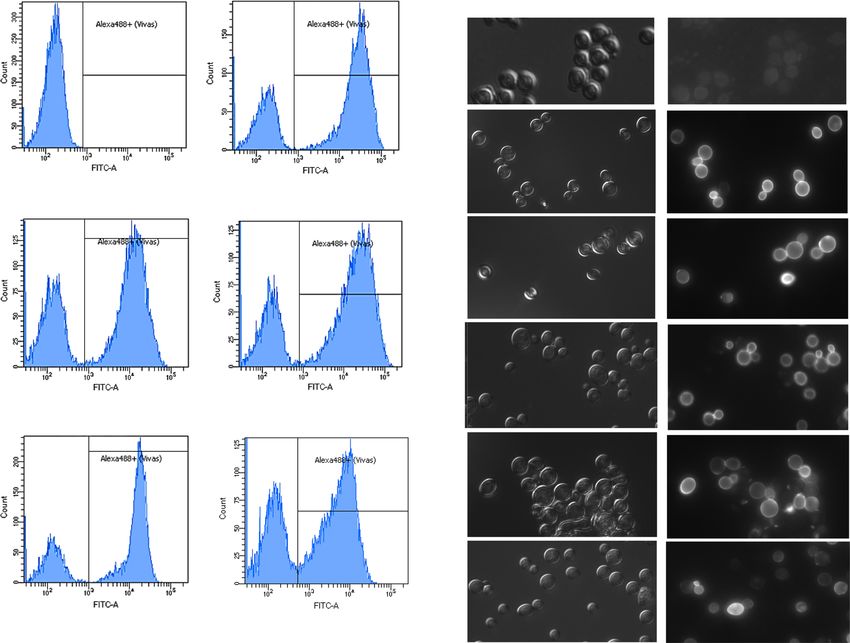
water at a 10-fold higher concentration than the desired final The obtained results (Fig. 2a) indicated that efficient exposure
one was added. The mixture was maintained with orbital shak- had been achieved. According to the integration of the peaks
ing for 24 h at the same temperature. Afterward, it was cen- corresponding to the fluorescent (the right one) and nonfluo-
trifuged (3 min at 3000 rpm) and the aqueous supernatant was rescent (the left one) cells, around 71% of them exposed Aga2
extracted with methylene chloride (2 × 8 mL). The organic in the strain transformed with pYD5M and a slightly lower
phases were combined and dried over sodium sulfate. After percentage (about 67–69% approximately) was detected for
solvent evaporation, the crude material was analyzed by Aga2-HFBI and Aga2-DewA. The analysis of the mean fluo-
1
HNMR (in a Bruker DRX 300 spectrometer; Bruker, rescent intensity, shown as M in this figure, indicated
Billerica, MA) and integrated to quantify the percentage of certain displacement to lower values in DewA, and in
all the compounds. Chiral High-Performance Liquid HfbI to a greater extent. According to this, the number
Chromatography (HPLC, Merck Hitachi Lachrom system, of molecules exposed per cell lowered to some extent
Darmstadt, Germany) using a Chiralcel ODH column (Hex/ when hydrophobins were introduced into protein V5-
iprOH 95:5, flow = 1 mL min−1, wavelength = 214 nm) was Aga2, but the values were indicative of a marked ex-
performed to determine enantiomeric excess. In all cases, and pression on the cell surface.
according to the retention times (Andreu and del Olmo Exposure of fusion proteins with hydrophobins was
2019), the enantiomer that was mainly obtained was that also confirmed by fluorescence microscopy observation
with S configuration (ee 85%). The NMR data corre- (Fig. 2b).
sponding to the purified compound by flash chromatog-
raphy (Merck silica gel 60, particle size: 0.040-0.063 mm) Exposure of hydrophobins HFBI from T. reesei
were fully consistent with those described in the literature and DewA from A. nidulans affects cell surface
(Andreu and del Olmo 2019). properties
Hydrophobins have been described to be able to convert hy-
Results drophobic surfaces into hydrophilic or hydrophilic into hydro-
phobic (Wessels 1997; Linder et al. 2005).
Hydrophobins HFBI from T. reesei and DewA Figure 3 shows the hydrophobicity profile provided by the
from A. nidulans can be efficiently expressed Protscale software (Gasteiger et al. 2005) for the fusion pro-
on the cell surface of S. cerevisiae strain EBY100 teins of Aga2 with the two hydrophobins considered in this
work compared to that corresponding to Aga2 when they are
In order to understand how the exposure of hydrophobins of expressed from the pYD5-derived vectors herein used.
classes I and II could affect the features of the S. cerevisiae cell According to these profiles, both proteins should increase
surface, the coding sequence of two well-known representa- the hydrophobicity of the cell surface. This parameter was also
tives of these groups (class I DewA from A. nidulans and class determined experimentally following the procedure of Wang
II HFBI from T. reesei) were cloned into the pYD5 yeast et al. (2016) and Zhang et al. (2017), as described in
display vector, as described in “Materials and Methods.” In “Materials and Methods.” In this methodology, the hydropho-
this way, after the transformation of strain EBY100 with the bicity index (HI) is determined through the cell population
resulting plasmids (pYD5M-HFBI and pYD5M-DewA), the being distributed between butanol (organic phase) and water.
expression of the gene fusions should occur in the presence of The obtained results were 0.022 ± 0.012 for the EBY100/
galactose as the only carbon source, and fusion proteins Aga2- pYD5M strain, 0.109 ± 0.027 for EBY100/pYD5M-HFBI,
HFB1 and Aga2-DewA would remain attached to the cell and 0.072 ± 0.012 for EBY100/pYD5M-DewA. TheAppl Microbiol Biotechnol
Fluorescence microscopy
a pYD5M (Glc) pYD5M
b
DIC FITC
% 71.3
pYD5M (Glc)
M 30572
%0
M 1193
pYD5M
pYD5M-HFBI pYD5M-DewA
% 68.8 % 67
pYD5M-HFBI
M 18156 M 19473
Cell counts
pYD5M-DewA
pYD5M-HFBI-2c pYD5M-DewA-2c pYD5M-HFBI-2c
% 68.3 % 63
M 16355 M 9138
pYD5M-DewA-2c
Fluorescence intensity
Fig. 2 Flow cytometry (a) and fluorescence and DIC microscopy (b) accessible display of the Aga2 fusion proteins was evaluated by immu-
analyses of the cultures corresponding to the EBY100-derived strains nofluorescence labeling with an anti-V5 antibody. Experiments were re-
expressing the Aga2 (pYD5M) or Aga2 fusion proteins with HFBI peated 3 times with similar results. The figure shows the result of a
(pYD5M-HFBI, pYD5M-HFBI-2c) or DewA (pYD5M-DewA, representative experiment of each strain. The first panel in each figure
pYD5M-DewA-2c). Strains were grown O/N in SC-Trp Glu at 30 °C. is a control that corresponds to a sample of the EBY100/pYD5 cells
Then, they were transferred to the same medium, but it contained galac- grown in glucose; in b, the FITC image was overexposed
tose as a carbon source, and were incubated for another 24-h period. An
differences between the modified and the control strain were Another feature of yeast cells that can provide infor-
statistically significant considering the p values found (7.287 mation about the changes on the surface associated with
× 10−5 and 8.019 × 10⁻⁵, respectively). According to this, the hydrophobin exposure is their flocculation ability. This prop-
exposure of the hydrophobins herein considered increased the erty was measured by determining the percentage of cells
hydrophobicity of the cell surface, almost 5-fold in the case of which did not remain on the top of the solution after floccu-
HFBI and 3.27-fold for DewA. lation induction in the 24-h cultures in a galactose-containing
The contact angles with hydrophilic and hydrophobic medium. The results were 7.40 ± 1.63% for the EBY100/
glass were determined for the cells grown for 24 h in a pYD5M strain, 27.39 ± 3.42% for EBY100/pYD5M-HFBI,
minimal medium with galactose. According to the re- and 17.07 ± 2.70% for EBY100/pYD5M-DewA. The differ-
sults shown in Fig. 4, no significant differences were ences between the modified and the control strain were
found between the considered strains. This suggests that statistically significant considering the p values found
the addition of hydrophobins to the yeast surface had no (8.30 × 10⁻⁴ and 2.22 × 10⁻³, respectively). These data
effect on surface hydrophobicity, unlike evidences for indicate that the modified strains displayed greater floc-
the opposite situation provided by the above-described culation capacity, which resulted in bigger differences
analyses. when class II hydrophobin was considered. Indeed, theAppl Microbiol Biotechnol
Aga2 Fig. 3 Protein profile of the fusion proteins expressed from plasmids
pYD5M, pYD5M-HFBI, and pYD5M-DewA. The amino acid scale
used to determine profiles was defined by the numeric value assigned
to each one. The Protein Translate facility was employed for the
translation of the nucleotide sequence and the Protscale to generate the
protein profile (Swiss Institute of Bioinformatics ExPASy). Vertical lines
separate the part corresponding to the introduced sequences and the Aga2
protein. According to the scale used (Hphob. / Kyte and Doolittle 1982),
the individual value for each amino acid is as follows: Ala: 1.800; Arg:
−4.500; Asn: −3.500; Asp: −3.500; Cys: 2.500; Gln: −3.500; Glu:
−3.500; Gly: −0.400; His: −3.200; Ile: 4.500; Leu: 3.800; Lys: −3.900;
Met: 1.900; Phe: 2.800; Pro: −1.600; Ser: −0.800; Thr: −0.700; Trp:
−0.900; Tyr: −1.300; Val: 4.200
HFBI and DewA exposure on S. cerevisiae influences
resistance under several adverse conditions for yeast
HFBI Aga2 growth
The modification of the yeast surface associated with the ex-
posure of hydrophobins of classes I and II could result in
changes in the resistance to stress conditions produced by
physicochemical agents, including the substrates and solvents
used for biocatalysis with yeast whole cells. In this section,
viability in the presence of adverse conditions was analyzed
Hydrophilic glass Control
22.4 ± 0.9° 20.1 ± 1.5°
HFBI
20.7 ± 1.2°
DewA Aga2
DewA
19.2 ± 1.1°
Hydrophobic glass (silanized) Control
100.5 ± 0.9° 60.9 ± 2.4°
HFBI
61.2 ± 2.2°
DewA
62.8 ± 1.9°
percentage of flocculated cells in the strains exposing
DewA and HFBI was increased 2.31- and 3.70-fold,
respectively, compared to that of the control. This result
is consistent with the greater hydrophobicity of the cells
Fig. 4 Water contact angle measurements of the yeast-coated glass slides.
of these two strains obtained from the butanol extraction The images on the left are the WCA of the glass with no yeast on it. The
experiments. shown values correspond to mean and standard deviation, with n = 10Appl Microbiol Biotechnol
a LT50 b LD50 (M)
(°C)
pYD5M 1.66
pYD5M 42.9
100 pYD5M-HFBI 2.12
* * ** ** pYD5M-HFBI 47.9
100
* * ** ** pYD5M-DewA 2.20
90 90
pYD5M-DewA 45.9
80 * * ** * * *
Percentage of viable cells
80
* *
70 70
60 60
50 50
40 40
30 30
20 20
10 10
0 0
37 40 42 44 0.7 1 1.2 1.5
Temperature (˚C) NaCl concentration (M)
Fig. 5 Resistance of the yeast cells exposing Aga2 (vector pYD5M, left carried out 5 times, and the figure shows the mean value and the standard
bar), Aga2-HFBI (middle bar), and Aga2-DewA (right bar) to high tem- deviation. * indicates those cases in which the differences compared to
peratures and salt concentrations. Five OD600 units of yeast cells from the the strain transformed with vector pYD5M were statistically significant
24-h cultures in galactose were incubated under the conditions described with a p value lower than 0.05; ** is included in those cases in which the p
in “Materials and Methods.” The percentage of viable cells was deter- value was lower than 0.01. The LT50 and NaCl LD50 values are also
mined in each case by the trypan blue exclusion assay. Experiments were shown; standard deviations were always lower than 5% of the mean value
by the trypan blue exclusion assay following the proce- First, the viability of all the strains was determined at dif-
dure described in “Materials and Methods.” The obtain- ferent temperatures (37, 40, 42, and 44 °C). As seen in Fig. 5a,
ed results are shown in Figs. 5 and 6 and S2 and S3 in the the modified ones always showed more thermoresistance than
Supplementary Material. the control (EBY100/pYD5M), with statistically significant
100 * **
* ** LD50 (mg/mL)
90
** pYD5M 3.355 ± 0.029
80
pYD5M-HFBI 2.966 ± 0.026
Percentage of viable cells
70 pYD5M-DewA 3.403 ± 0.036
60
50 **
40
30
20
**
10
** * *
0
0.65 1.3 2.6 3.9 4.6 5.3
Phenoxyacetone concentration (mg/mL)
EBY100/pYD5M EBY100/pYD5M-HFBI EBY100/pYD5M-DewA
Fig. 6 Resistance of the yeast cells exposing Aga2 (vector pYD5M), Experiments were carried out 5 times, and the figure shows the average
Aga2-HFBI, and Aga2-DewA to phenoxyacetone. Ten OD600 units of value and the standard deviation. * indicates those cases in which the
yeast cells from the 24-h cultures in galactose were incubated under the differences in relation to the strain transformed with the vector pYD5M
conditions described in “Materials and Methods” with the concentrations were statistically significant with a p value lower than 0.05; ** is included
of the compound indicated in the figure. The percentage of viable cells in those cases in which the p value was lower than 0.01. The LD50 values
was determined in each case by the trypan blue exclusion assay. for this compound are also shownAppl Microbiol Biotechnol
differences. Overexposure of DewA, and particularly of present from 0.65 to 2.6 mg/mL of the final concentration.
HFBI, resulted in greater resistance and mainly at the highest However, viability of the HFB1 expressing strain was more
temperatures. Accordingly, the LT50 value was determined for negatively affected from around 3.9 mg/mL compared to the
each one (temperature at which 50% viable cells were found). other two. From these data, LD50 was calculated and included
Next, salt resistance was also checked and, once again, the in the same figure.
two strains displaying hydrophobins were more viable, with
statistically significant differences (Fig. 5b). Under this Introduction of a second copy of the HFBI and DewA
stress condition, both showed a similar pattern with hydrophobins does not affect the properties
quite close LD50 values. of the yeast cell surface and viability under adverse
Growth experiments were also carried out with strains conditions
EBY100/pYD5M, pYD5M-HFBI, and pYD5M-DewA under
the two conditions explained above. The growth in the SC-trp Improvement in the cell surface properties and stress resis-
medium containing galactose as the only carbon source at 30 tance associated with the exposure of one copy of the
°C was followed as the control. As shown in Fig. S2 in the hydrophobins herein considered prompted us to analyze if
Supplementary Material, the HFBI-expressing cells grew the introduction of a second copy fused to the first one could
slightly more slowly compared to the other strains, which provide additional positive effects. The Gibson Assembly
showed quite similar behavior to one another. However, when strategy was used to construct the corresponding strains as
growth was followed at 37 °C, the strains exposing explained in “Materials and Methods.” The efficient expres-
hydrophobins displayed more growth, particularly that over- sion of the two copies of HFBI or DewA on the cell surface
expressing DewA on the cell surface. In the experiments car- was confirmed by western blot, flow cytometry, and micros-
ried out in the presence of 0.5 M NaCl, both strains exposing copy (Fig. S1 in the Supplementary Material, and Figs. 2a and
hydrophobins also showed improved growth compared to the 2b, respectively). The data obtained in the last analyses indi-
unmodified one, in which case the better results were found by cated that the percentage of cells exposing hydrophobins was
HFBI exposure. not affected by the addition of the second copy. However, the
Resistance to several organic solvents was also analyzed. mean fluorescence intensity decreased, which suggests that
As shown in Fig. S3 in the Supplementary Material, and after the number of proteins per cell lowered. The experiments
considering all the data, no consistent and significant differ- carried out with these strains revealed no significant differ-
ences were found among the strains for ethanol, acetonitrile, ences in terms of the above-described properties, such as the
dimethylformamide, and dimethylsulfoxide under the concen- HI, flocculation ability, and heat resistance (data not shown).
trations tested in these experiments (6–10%, 3–9% v/v, 6–25% Accordingly, further analyses were restricted to the strains
v/v, and 12–30% v/v, respectively). However, it is worth men- exposing one copy of the herein analyzed hydrophobins.
tioning that in some cases, exposure of hydrophobins (partic-
ularly HFBI) resulted in lower resistance to these agents (e.g., Behavior of hydrophobin-exposing strains
see the data for 6% (v/v) ethanol, 7–9% acetonitrile, and 30% EBY100/pYD5M-HFBI and EBY100/pYD5M-DewA
(v/v) DMSO). in biocatalysis
The organic substrates that can be used in biocatalytic pro-
cesses carried out by yeast whole cells could be toxic for them, The effect of the hydrophobin expression on cells’ surface
which limits the charge that can be applied in the correspond- during the biocatalytic processes carried out by yeast whole
ing reactions. Figure 6 shows the results of the viability of the cells in an aqueous medium was determined. For this purpose,
three considered strains in the presence of different amounts of the reaction reduction of the ketone 1-phenoxypropan-2-one 1
one of these substrates: phenoxyacetone 1. We can see that the (Scheme 1) was taken as a benchmark.
effect of the exposure of hydrophobins on the cell surface When the reaction was carried out at the optimal growth
depends on the considered substrate concentration. Increased temperature for S. cerevisiae (around 30 °C), the transforma-
resistance of yeast cells to this compound was found when tion was more marked with the modified strains than in the
control one, particularly with EBY100/pYD5M-HFBI, with a
statistically significant difference in this case (Fig. 7a). Given
the greater viability of the YSD modified strains at 40 °C, the
ability of whole cells to reduce this substrate was also tested at
this temperature. Under this condition, transformation was
lower in all cases, although these two strains showed en-
Scheme 1 Reduction of phenoxyacetone 1 to (+)-(S)-1-phenoxy-2-
hanced reactivity compared to the control one, with statistical-
propanol biocatalyzed by strains EBY100/pYD5M/pYD5M-HFBI and ly significant differences once again for the HFBI-exposing
pYD5M/DewA in the presence of galactose. OD refers to OD600 units strain (Fig. 7b).Appl Microbiol Biotechnol
a (30°C) b (40° C)
1.6 1.6
* *
1.4 1.4
1.2 1.2
Transformation ratio
Transformation ratio
1 1
0.8 0.8
0.6 0.6
0.4 0.4
0.2 0.2
0 0
Strain Strain
Fig. 7 Comparative results among the three strains studied for the relation between the conversion (expressed as μmol of product/mg cells
reduction reaction of ketone 1. Experiments were carried at 30 °C or 40 dry weight) obtained with the hydrophobin-modified strains vs. the con-
°C for 24 h using 100 OD600 units of whole cells in 10 mL of 2% trol one, for which a value of 1 was assigned. Conversion was calculated
galactose and 0.65 mg/mL of a substrate. The mean value and standard based on the integration of 1HNMR spectra. Cell dry weight was deter-
deviation for the transformation ratio of five independent experiments are mined after the lyophilization of the aliquots containing 100 OD600 units
shown in this figure. The transformation ratio was determined as the of whole cells
The effect of the substrate charge on the development of significant differences in all cases. Higher substrate concen-
the reaction was also analyzed. As shown in Fig. 8, biocata- trations were not considered because of the sharp drop in cell
lytic activity was greater at 30 °C in both hydrophobin- viability described in a previous section (Fig. 6).
exposing strains than in the control one by at least up to 2.5
mg/mL of the substrate final concentration, with statistically
1.6
Discussion
1.4 **** ** ** ** * ** Hydrophobins are proteins with interesting biotechnological
and biomedical applications, and research about their
1.2
Transformation ratio
properties and utilities has increased in the last few
1 years (Bayry et al. 2012; Berger and Sallada 2019;
Khalesi et al. 2015a, 2015b; Maiolo et al. 2017; Niu et al.
0.8
2012; Valo et al. 2010; Wösten and Scholtmeijer 2015).
0.6 Several reports have analyzed the effects of displaying
hydrophobins of class I (SC3 of Schizophyllum commune)
0.4 and class II (HFBI de Trichoderma reesei) on the surface of
0.2
yeast cells belonging to the Saccharomyces cerevisiae and
Pichia pastoris species (Nakari-Setälä et al. 2002; Wang
0 et al. 2016; Zhang et al. 2017).
0.65 1.3 1.9 2.5
Substrate concentration (mg/mL)
The results described in this work indicate that the two
considered hydrophobins, HFBI and DewA (a hydrophobin
of class I of A. nidulans not previously exposed), were accu-
Fig. 8 Effect of the substrate concentration on the biocatalytic rately displayed on the yeast surface of S. cerevisiae (Fig. 2).
transformation by the yeast whole cells of the strains herein considered. In previous studies, higher hydrophobicity was observed in
Reactions were carried out for 24 h using 100 OD600 units of whole cells EBY100 cells overexpressing Aga2 in the cell surface
in 10 mL of 2% galactose. Substrate 1 was used at the final concentration
indicated in each case. The mean value and standard deviation of five
(Andreu and del Olmo 2013). Herein, we found that the ex-
independent experiments are shown in the figure. The transformation posure of both hydrophobins, especially HFBI, resulted in an
ratio was determined as in Fig. 7 additional increase of the hydrophobicity of the cell surfaceAppl Microbiol Biotechnol
Fig. 9 Comparison between the a b
data obtained for the 0.16 35
hydrophobicity index and
flocculation capacity for the **
0.14
strains herein considered. * 30
indicates those cases in which the
0.12
differences compared to the strain 25
Hydrophobicity index
Flocculation capacity
transformed with vector pYD5M **
0.1
were statistically significant with
20
a p value lower than 0.05
0.08
15
0.06
10
0.04
0.02 5
0 0
(Fig. 9). Nakari-Setälä et al. (2002) described the display of protein HFBI on the surface by the Flo1 anchoring system
HFBI on S. cerevisiae and also found that hydrophobin- (32.8 ± 2.1 compared to 30.0 ± 1.9). We cannot rule out that
expressing yeast was much less hydrophilic than the control the treatment with ethanol used to prepare samples could bring
ones. Unfortunately, it is not possible to compare our results to about changes in the association or conformation of the
those found by these authors for different reasons; e.g., they hydrophobins that could affect the WCA determinations.
were unable to determine the level of HFBI exposure by Besides, there is the possibility of a capillary effect due to
FACS and used a different yeast display system based on spaces between cells or channel-like structures that form be-
Flo1 anchoring and the constitutive ADH1 promoter to tween multiple yeast layers depending on coating density.
regulate expression; besides, the methodology followed to We also analyzed the effect of displaying these proteins on
determine this property was different. Wang et al. (2016) also cell surfaces on their resistance to stress conditions, like high
exposed HFBI in Pichia pastoris and observed a higher HI temperatures and presence of salt or organic compounds. As
value (1.68-fold change). We also found a greater tendency of expected, the increased stressing agent diminished cell
flocculation for the strains exposing hydrophobins, mainly viability, but this effect was less marked on the strains
HFBI, which is consistent with hydrophobicity differences exposing hydrophobins than on the control one in all cases.
(Fig. 9). Jin and Speers (1998) reported that a high cell surface By means of transmission electron microscopy, Wang et al.
hydrophobicity (CSH) level facilitates better cell-cell contact (2016) observed that exposure of HFBI and type I hydrophobin
in an aqueous medium, which results in a more specific lectin- SC3 resulted in cell wall structure differences. These authors
carbohydrate interaction. Nayyar et al. (2014) also described a found that the cell wall inner layers of the recombinant strains
correlation between increased CSH and the initiation of displaying these hydrophobins were thicker than those of the
flocculence during fermentation for four industrial reference strain. There were also slightly longer mannan fibrils
S. cerevisiae strains used to produce beer, champagne, wine, on the cell wall outer layer of the strain exposing SC3 and
and fuel alcohol. shorter ones in that displaying HFBI. Perhaps, these differences
Despite these results, all the strains considered herein obtain- lie behind the increased resistance to high temperatures and salt
ed quite close water contact angle values (WCA, around 19– solutions of the EBY100 cells transformed with pYD5M-HFBI
20) on hydrophilic glass, which were similar to those found for and pYD5M-DewA reported in this work (Fig. 5, S2 and S3 in
other unmodified yeast strains reported in the literature (20.7 the Supplementary Material).
for H2155, Nakari-Setälä et al. 2002; 18.4 for NCYC 1681, Exposure of a second copy of HFBI or DewA
White and Walker 2011). It is difficult to explain the reason hydrophobins fused to the first one did not provide any addi-
for the discrepancies that appear among the hydrophobicity tional improvement to surface properties and resistance to
data obtained from solvent extraction analyses and WCA de- high temperatures. Although this second copy introduced
terminations, but they have also been reported by other authors more hydrophobic residues, the structure adopted when the
(White and Walker 2011). Nakari-Setälä et al. (2002) only de- whole protein was associated extracellularly to the cell wall
tected quite a modest increase, which was probably not statis- by the linking Aga1-Aga2-hydrophobin is not known.
tically significant, in the contact angle in water when expressing Besides, the flow cytometry analyses revealed fewer copiesAppl Microbiol Biotechnol
per cell when the second copy was introduced (see the M Ethics approval The article does not contain any studies with human
participants or animals performed by any of the authors.
value in Fig. 2a).
Improved biocatalytic activity in lipases co-expressed with
hydrophobins SC3 or HFBI on the cell surface has been dem-
onstrated (Wang et al. 2016; Zhang et al. 2017). These authors
References
considered that this can be explained by the change in the
Andreu C, del Olmo M (2014) Potential of some yeast strains in the
surface structure and hydrophobic characteristics, which re- stereoselective synthesis of (R)-(-)-phenylacetylcarbinol and (S)-
sulted in an effect on the catalytic features of the lipase (+)-phenylacetylcarbinol and their reduced 1,2-dialcohol deriva-
displayed. In this work, we analyzed how exposing proteins tives. Appl Microbiol Biotechnol 98:5901–5913. https://doi.org/
10.1007/s00253-014-5635-5
HFBI and DewA on the yeast cell surface influenced the bio-
Andreu C, Peña M, del Olmo M (2016) Biocatalytic reduction of racemic
catalytic reduction reaction of ketone 1 carried out by whole 2-arenoxycycloalkanones by yeasts P. glucozyma and C. glabrata:
cells. Thus, we demonstrated that the exposure of both pro- one way of achieving chiral 2-arenoxycycloalcohols. Appl
teins resulted in enhanced activity when phenoxyacetone con- Microbiol Biotechnol 100:4865–4873. https://doi.org/10.1007/
s00253-015-7261-2
centrations went up to 2.5 mg/mL, possibly because greater
Andreu C, del Olmo M (2018a) Biotransformation using halotolerant
surface lipophilicity makes its entry in the cell easier. No yeast in seawater: a sustainable strategy to produce R-(-)-
reactions were carried out at higher substrate charges given phenylacetylcarbinol. Appl Microbiol Biotechnol 102:4717–4727.
the toxic effect on cells (Fig. 6). https://doi.org/10.1007/s00253-018-8945-1
Andreu C, del Olmo M (2019) Improved biocatalytic activity of the
Relevant results were found when reactions were carried
Debaryomyces species in seawater. Chemcatchem 11:3085–3092.
out at 40 °C (Fig. 7). At this temperature, reactions were https://doi.org/10.1002/cctc.201900558
slower than at 30 °C, but stereoselectivity remained (ee Andreu C, del Olmo M (2013) Yeast arming by the Aga2p system: effect
85%). Once again, greater thermotolerance was observed for of growth conditions in galactose on the efficiency of the display and
the hydrophobin-exposing strains as in the viability experi- influence of expressing leucine-containing peptides. Appl Microbiol
Biotechnol 97:9055–9069. https://doi.org/10.1007/s00253-013-
ments. This result is important for the biocatalytic processes 5086-4
that employ whole cells because it offers the possibility of Andreu C, del Olmo M (2018b) Yeast arming systems: pros and cons of
using high lipophilic substrates in an aqueous medium to in- different protein anchors and other elements required for display.
crease their solubility by raising the reaction temperature. Appl Microbiol Biotechnol 102:2543–2561. https://doi.org/10.
1007/s00253-018-8827-6
Further analysis should be performed to understand the appli- Andreu C, del Olmo M (2020) Whole-cell biocatalysis in seawater: new
cations of the new strains described herein and the possibility halotolerant yeast strains for the regio- and stereoselectivity reduc-
of introducing these modifications into other more convenient tion of 1-phenylpropane-1,2-dione in saline-rich media.
yeast species for biotechnological processes. Chembiochem 21:1621–1628. https://doi.org/10.1002/cbic.
202000023
Bariotaki A, Kalaitzakis D, Smonou I (2012) Enzymatic reductions for
Supplementary Information The online version contains supplementary the regio- and stereoselective synthesis of hydroxy-keto esters and
material available at https://doi.org/10.1007/s00253-021-11090-8. dihydroxy esters. Org Lett 14:1792–1795. https://doi.org/10.1021/
ol3003833
Acknowledgments We are indebted to Dr. Markku Saloheimo for pro- Bayry J, Aimanianda V, Guijarro J, Sunde M, Latgé J (2012)
viding us with the S. cerevisiae strain VTT-C-99315 carrying the Hydrophobins—unique fungal proteins. PLoS Pathog 8:e1002700.
pTNS23 plasmid. We gratefully acknowledge SCSIE (Universitat de https://doi.org/10.1371/journal.ppat.1002700
València) for providing access to its instrumental facilities for DNA se- Benjaphokee S, Hasegawa D, Yokota D, Asvarak T, Auesukaree C,
quencing and flow cytometry. Sugiyama M, Kaneko Y, Boonchird C, Harashima S (2012)
Highly efficient bioethanol production by a Saccharomyces
Author contribution C.A and M.O conceived, designed, and performed cerevisiae strain with multiple stress tolerance to high temperature,
research and data analyses, performed conceptualization and supervision, acid and ethanol. New Biotechnol 29:379–386. https://doi.org/10.
and wrote the paper. L.W and J.G contributed with some experiments. 1016/j.nbt.2011.07.002
R.F was involved in the discussion of results and the supervision of the Berger B, Sallada N (2019) Hydrophobins: multifunctional biosurfactants
paper. C.A and M.O have contributed equally to this work. for interface engineering. J Biol Eng 13:10. https://doi.org/10.1186/
s13036-018-0136-1
Funding This work was supported by grants from the Universitat de Boder ET, Raeeszadeh-Sarmazdeh M, Price JV (2012) Engineering anti-
València: UV-INV-AE15-323062 and UV-19-INV-AE19. bodies by yeast display. Arch Biochem Biophys 526:00–106.
https://doi.org/10.1016/j.abb.2012.03.009
Boeuf S, Throm T, Gutt B, Strunk T, Hoffmann M, Seebach E, Mühlberg
Data availability All the data generated from this study are included in L, Brocher J, Gotterbarm T, Wenzel W, Fischer R, Richter W (2012)
this article or in its supplementary information files. Engineering hydrophobin DewA to generate surfaces that enhance
adhesion of human but not bacterial cells. Acta Biomater 8:1037–
Compliance with ethical standards 1047. https://doi.org/10.1016/j.actbio.2011.11.022
Bony M, Thines-Sempoux D, Barre P, Blondin B (1997) Localization
and cell surface anchoring of the Saccharomyces cerevisiae floccu-
Conflict of interest The authors declare that they have no conflict of
lation protein Flo1p. J Bacteriol 179:4929–4936. https://doi.org/10.
interest.
1128/jb.179.15.4929-4936.1997Appl Microbiol Biotechnol
Breakspear A, Momany M (2007) Aspergillus nidulans conidiation genes Moore JC, Pollard DJ, Kosjek B, Devine PN (2007) Advances in the
dewA, fluG, and stuA are differentially regulated in early vegetative enzymatic reduction of ketones. Acc Chem Res 40:1412–1419.
growth. Eukaryot Cell 6:1697–1700. https://doi.org/10.1128/EC. https://doi.org/10.1021/ar700167a
00189-07 Nakari T, Alatalo E, Penttilä ME (1993) Isolation of Trichoderma
Cappellaro C, Baldermann C, Rachel R, Tanner W (1994) Mating type- reesei genes highly expressed on glucose-containing media:
specific cell-cell recognition of Saccharomyces cerevisiae: cell wall characterization of the tef1 gene encoding translation elonga-
attachment and active sites of a- and alpha-agglutinin. EMBO J 13: tion factor 1 alpha. Gene 136:313–318. https://doi.org/10.
4737–4744. https://doi.org/10.1002/j.1460-2075.1994.tb06799.x 1016/0378-1119(93)90486-m
Crabtree RH (2009) Handbook of green chemistry Volume 3. Nakari-Setälä T, Aro N, Kalkkinen N, Alatalo E, Penttilä M (1996)
Biocatalysis. Wiley-VCH, Weinheim Genetic and biochemical characterization of the Trichoderma reesei
Fokina O, Fenchel A, Winandy L, Fischer R (2016) Immobilization of hydrophobin HFBI. Eur J Biochem 235:248–255. https://doi.org/10.
LccC laccase from Aspergillus nidulans on hard surfaces via fungal 1111/j.1432-1033.1996.00248.x
hydrophobins. Appl Environ Microbiol 82:6395–6402. https://doi. Nakari-Setälä T, Azeredo J, Henriques M, Oliveira R, Teixeira J, Linder
org/10.1128/AEM.01413-16 M, Penttilä M (2002) Expression of a fungal hydrophobin in the
Gasteiger E, Hoogland C, Gattiker A, Duvaud S, Wilkins MR, Appel RD, Saccharomyces cerevisiae cell wall: effect on cell surface properties
Bairoch A (2005) Protein identification and analysis tools on the and immobilization. Appl Environ Microbiol 68:3385–3391. https://
ExPASy server. In: Walker JM (ed) The proteomics protocols hand- doi.org/10.1128/AEM.68.7.3385-3391.2002
book. Humana Press, Totowa, pp 571–607 Nayyar A, Walker G, Canetta E, Wardrop F, Adya AK (2014) Cell
Gibson DG, Young L, Chuang RY, Venter JC, Hutchison CA, Smith HO surface properties and flocculation behavior for industrial strains
(2009) Enzymatic assembly of DNA molecules up to several hun- of Saccharomyces cerevisiae. Int J Appl Microbiol Biotechnol Res
dred kilobases. Nat Methods 6:343–345. https://doi.org/10.1038/ 2:64–72. https://doi.org/10.33500/ijambr.2014.02.007
nmeth.1318 Ni Y, Holtmann D, Hollmann F (2014) How green is biocatalysis? To
Grünbacher A, Throm T, Seidel C, Gutt B, Röhrig J, Strunk T, Vincze P, calculate is to know. ChemCatChem 6:930–943. https://doi.org/10.
Walheim S, Schimmel T, Wenzel W, Fischer R (2014) Six 1002/cctc.201300976
hydrophobins are involved in hydrophobin rodlet formation in Niu B, Wang D, Yang Y, Xu H, Qiao M (2012) Heterologous expression
Aspergillus nidulans and contribute to hydrophobicity of the spore and characterization of the hydrophobin HFBI in Pichia pastoris
surface. PLoS One 9(4):e94546. https://doi.org/10.1371/journal. and evaluation of its contribution to the food industry. Amino
pone.0094546 Acids 43:763–771. https://doi.org/10.1007/s00726-011-1126-5
Heus S, Meynial-Salles I, O’Donohue MJ, Dumon C (2015) White bio- Park M (2020) Surface display technology for biosensor applications: a
technology: state of the art strategies for the development of review. Sensors 20:2775. https://doi.org/10.3390/s20102775
biocatalysts for biorefining. Biotechnol Adv 33:1653–1670.
Perpiñá C, Vinaixa J, Andreu C, del Olmo M (2015) Development of new
https://doi.org/10.1016/j.biotechadv.2015.08.004
tolerant strains to hydrophilic and hydrophobic organic solvents by
Jin Y-L, Speers RA (1998) Flocculation of Saccharomyces cerevisiae. Food
the yeast surface display methodology. Appl Microbiol Biotechnol
Res Int 31:421–440. https://doi.org/10.1016/S0963-9969(99)00021-6
99:775–789. https://doi.org/10.1007/s00253-014-6048-1
Khalesi M, Gebruers K, Derdelinckx G (2015a) Recent advances in fun-
Pscheidt B, Glieder A (2008) Yeast cell factories for fine chemical and
gal hydrophobin towards using in industry. Protein J 34:243–255.
API production. Microb Cell Factories 7:25–61. https://doi.org/10.
https://doi.org/10.1007/s10930-015-9621-2
1186/1475-2859-7-25
Khalesi M, Mandelings N, Herrera-Malaver B, Riveros-Galan D,
Gebruers K, Derdelinckx G (2015b) Improvement of the retention Robertson DE, Steer BA (2004) Recent progress in biocatalyst discovery
of ocimene in water phase using class II hydrophobin HFBII. and optimization. Curr Opin Chem Biol 8:141–149. https://doi.org/
Flavour Fragr J 30:451–458. https://doi.org/10.1002/ffj.3260 10.1016/j.cbpa.2004.02.010
Kieke MC, Cho BK, Boder ET, Kranz DM, Wittrup KD (1997) Isolation Sammer D, Krause K, Gube M, Wagner K, Kothe E (2016)
of anti-T cell receptor scFv mutants by yeast surface display. Protein Hydrophobins in the life cycle of the ectomycorrhizal basidiomycete
Eng 10:1303–1310. https://doi.org/10.1093/protein/10.11.1303 Tricholoma vaccinum. PLoS One 11:e0167773. https://doi.org/10.
Kisukuri C, Andrade L (2015) Production of chiral compounds using 1371/journal.pone.0167773
immobilized cells as a source of biocatalysts. Org Biomol Chem Schmoll M, Seibel C, Kotlowski C, Wöllert Genannt Vendt F, Liebmann
13:10086–10117. https://doi.org/10.1039/c5ob01677k B, Kubicek CP (2010) Recombinant production of an Aspergillus
Kumar R, Kumar P (2019) Yeast-based vaccines: new perspective in nidulans class I hydrophobin (DewA) in Hypocrea jecorina
vaccine development and application. FEMS Yeast Res 19:foz007. (Trichoderma reesei) is promoter-dependent. Appl Microbiol
https://doi.org/10.1093/femsyr/foz007 Biotechnol 88:95–103. https://doi.org/10.1007/s00253-010-2710-4
Kyte J, Doolittle RF (1982) A simple method for displaying the hydro- Stringer MA, Timberlake WE (1995) dewA encodes a fungal
pathic character of a protein. J Mol Biol 157:105–132. https://doi. hyddrophobin component of the Aspergillus spore wall. Mol
org/10.1016/0022-2836(82)90515-0 Microbiol 16:33–44. https://doi.org/10.1111/j.1365-2958.1995.
Linciano S, Pluda S, Bacchin A, Angelini A (2019) Molecular evolution tb02389.x
of peptides by yeast surface display technology. MedChemComm Tabañag IDF, Chu IM, Wei YH, Tsai SL (2018) The role of yeast-
10:1569–1580. https://doi.org/10.1039/c9md00252a surface-display techniques in creating biocatalysts for consolidated
Linder MB, Szilvay GR, Nakari-Setälä T, Penttilä ME (2005) bioprocessing. Catalysts 8:94. https://doi.org/10.3390/catal8030094
Hydrophobins: the protein-amphiphiles of filamentous fungi. Takayama K, Suye SI, Kuroda K, Ueda M, Kitaguchi T, Tsuchiyama K,
FEMS Microbiol Rev 29:877–896. https://doi.org/10.1016/j. Fukuda T, Chen W, Mulchandani A (2006) Surface display of or-
femsre.2005.01.004 ganophosphorus hydrolase on Saccharomyces cerevisiae.
Maiolo D, Pigliacelli C, Sánchez Moreno P, Violatto MB, Talamini L, Biotechnol Prog 22:939–943. https://doi.org/10.1021/bp060107b
Tirotta I, Piccirillo R, Zucchetti M, Morosi L, Frapolli R, Candiani Tao J, Kazlauskas RJ (2011) Biocatalysis for green chemistry and chem-
G, Bigini P, Metrangolo P, Baldelli BF (2017) Bioreducible ical process development. John Wiley & Sons, Hoboken
hydrophobin-stabilized supraparticles for selective intracellular re- Traxlmayr MW, Shusta EV (2017) Directed evolution of protein thermal
lease. ACS Nano 11:9413–9423. https://doi.org/10.1021/acsnano. stability using yeast surface display. Methods Mol Biol 1575:45–65.
7b04979 https://doi.org/10.1007/978-1-4939-6857-2_4You can also read